Attached files
| file | filename |
|---|---|
| EXCEL - IDEA: XBRL DOCUMENT - Q2 Holdings, Inc. | Financial_Report.xls |
| EX-10.7 - EXHIBIT 10.7 - Q2 Holdings, Inc. | a123114exhibit107.htm |
| EX-31.1 - EXHIBIT 31.1 - Q2 Holdings, Inc. | a123114exhibit311.htm |
| EX-32.1 - EXHIBIT 32.1 - Q2 Holdings, Inc. | a123114exhibit321.htm |
| EX-32.2 - EXHIBIT 32.2 - Q2 Holdings, Inc. | a123114exhibit322.htm |
| EX-10.8 - EXHIBIT 10.8 - Q2 Holdings, Inc. | a123114exhibit108.htm |
| EX-23.1 - EXHIBIT 23.1 - Q2 Holdings, Inc. | a123114exhibit231eyconsent.htm |
| XML - IDEA: XBRL DOCUMENT - Q2 Holdings, Inc. | R9999.htm |
| EX-31.2 - EXHIBIT 31.2 - Q2 Holdings, Inc. | a123114exhibit312.htm |
UNITED STATES
SECURITIES AND EXCHANGE COMMISSION
Washington, D.C. 20549
FORM 10-K
(Mark One)
ý Annual Report Pursuant to Section 13 or 15(d) of the Securities Exchange Act of 1934
For the fiscal year ended December 31, 2014.
or
o Transition Report Pursuant to Section 13 or 15(d) of the Securities Exchange Act of 1934
Q2 Holdings, Inc.
(Exact name of Registrant as Specified in Its Charter)
Delaware (State or Other Jurisdiction of Incorporation or Organization) | 001-36350 (Commission File Number) | 20-2706637 (IRS Employer Identification No.) | ||
13785 Research Blvd, Suite 150
Austin, Texas 78750
(512) 275-0072
(Address, Including Zip Code, and Telephone Number, Including Area Code, of Registrant's Principal Executive Offices)
Securities registered pursuant to Section 12(b) of the Act:
Title of each class | Name of each exchange on which registered | |||||
Common Stock, $0.0001 par value | New York Stock Exchange | |||||
Securities registered pursuant to Section 12(g) of the Act: None
Indicate by a check mark if the registrant is a well-known seasoned issuer, as defined in Rule 405 of the Securities Act. Yes o No x
Indicate by check mark if the registrant is not required to file reports pursuant to Section 13 or Section 15(d) of the Act. Yes o No x
Indicate by check mark whether the registrant (1) has filed all reports required to be filed by Section 13 or 15(d) of the Securities Exchange Act of 1934 during the preceding 12 months (or for such shorter period that the registrant was required to file such reports), and (2) has been subject to such filing requirements for the past 90 days. Yes x No o
Indicate by check mark whether the registrant has submitted electronically and posted on its corporate Web site, if any, every Interactive Data File required to be submitted and posted pursuant to Rule 405 of Regulation S-T (§232.405 of this chapter) during the preceding 12 months (or for such shorter period that the registrant was required to submit and post such files). Yes x No o
Indicate by check mark if disclosure of delinquent filers pursuant to Item 405 of regulation S-K (§229.405 of this chapter) is not contained herein, and will not be contained, to the best of registrant’s knowledge, in definitive proxy or information statements incorporated by reference in Part III of this Form 10-K or any amendment to this Form 10-K. x
Indicate by check mark whether the registrant is a large accelerated filer, an accelerated filer, a non-accelerated filer, or a smaller reporting company. See the definitions of “large accelerated filer,” “accelerated filer,” and “smaller reporting company” in Rule 12b-2 of the Exchange Act.
o Large accelerated filer | o Accelerated filer | ý Non-accelerated filer | o Smaller reporting company | |||
(Do not check if a smaller reporting company) | ||||||
Indicate by check mark whether the registrant is a shell company (as defined in Rule 12b-2 of the Exchange Act). Yes o No ý
Based on the closing price of the registrant's common stock on the last business day of the registrant's most recently completed second fiscal quarter, which was June 30, 2014, the aggregate market value of its shares held by non-affiliates on that date was approximately $262,112,618. Shares of common stock held by each officer and director and by each person who owns 5% or more of the outstanding Common Stock have been excluded in that such persons may be deemed to be affiliates. This determination of affiliate status was based on publicly filed documents and is not necessarily a conclusive determination for other purposes.
There were 34,937,128 shares of the registrant’s common stock outstanding as of January 31, 2015.
Part III of this Annual Report on Form 10-K incorporates certain information by reference from the definitive proxy statement for the registrant’s 2015 Annual Meeting of Stockholders to be filed within 120 days of the registrant’s fiscal year ended December 31, 2014, or the Proxy Statement. Except with respect to information specifically incorporated by reference in this Annual Report on Form 10-K, the Proxy Statement is not deemed to be filed as part of this Annual Report on Form 10-K.
TABLE OF CONTENTS
PAGE | ||
PART I | ||
Item 1. | Business. | |
Item 1A. | Risk Factors. | |
Item 1B. | Unresolved Staff Comments. | |
Item 2. | Properties. | |
Item 3. | Legal Proceedings. | |
Item 4. | Mine Safety Disclosures. | |
PART II | ||
Item 5. | Market for Registrant’s Common Equity, Related Stockholder Matters, and Issuer Purchases of Equity Securities. | |
Item 6. | Selected Financial Data. | |
Item 7. | Management’s Discussion and Analysis of Financial Condition and Results of Operations. | |
Item 7A. | Quantitative and Qualitative Disclosures About Market Risk. | |
Item 8. | Financial Statements and Supplementary Data. | |
Item 9. | Change in and Disagreements With Accountants on Accounting and Financial Disclosure. | |
Item 9A. | Controls and Procedures. | |
Item 9B. | Other Information. | |
PART III | ||
Item 10. | Directors, Executive Officers and Corporate Governance. | |
Item 11. | Executive Compensation. | |
Item 12. | Security Ownership of Certain Beneficial Owners and Management and Related Stockholder Matters. | |
Item 13. | Certain Relationships and Related Transactions, and Director Independence. | |
Item 14. | Principal Accounting Fees and Services. | |
PART IV | ||
Item 15. | Exhibits, Financial Statement Schedules. | |
2
Special Note Regarding Forward-Looking Statements
This Annual Report on Form 10-K contains forward-looking statements that are based on our management's beliefs and assumptions and on information currently available to our management. The statements contained in this Annual Report on Form 10-K that are not purely historical are forward-looking statements within the meaning of the Private Securities Litigation Reform Act of 1995, Section 27A of the Securities Act of 1933, as amended, or the Securities Act, and Section 21E of the Securities Exchange Act of 1934, as amended, or the Exchange Act. You can identify these statements by words such as "anticipates," "believes," "can," "continue," "could," "estimates," "expects," "intends," "may," "plans," "seeks," "should," "will," "strategy," "future," "likely," or "would" or the negative of these terms or similar expressions. These statements are not guarantees of future performance or development and involve known and unknown risks, uncertainties and other factors that are in some cases beyond our control. All of our forward-looking statements are subject to risks and uncertainties that may cause our actual results to differ materially from our expectations. Factors that may cause such differences include, but are not limited to, the risks described under "Risk Factors" in this Annual Report on Form 10-K and those discussed in other documents we file with the Securities and Exchange Commission, or the SEC.
Given these risks and uncertainties, you should not place undue reliance on these forward-looking statements. Also, forward-looking statements represent our management's beliefs and assumptions only as of the date of this Annual Report on Form 10-K. You should read this Annual Report on Form 10-K completely and with the understanding that our actual future results may be materially different from what we expect. We hereby qualify our forward-looking statements by these cautionary statements. Except as required by law, we assume no obligation to update these forward-looking statements publicly, or to update the reasons actual results could differ materially from those anticipated in these forward-looking statements, even if new information becomes available in the future.
Item 1. Business.
Overview
Q2 is a leading provider of secure, cloud-based virtual banking solutions. We enable regional and community financial institutions, or RCFIs, to deliver a robust suite of integrated virtual banking services and engage more effectively with their retail and commercial account holders who expect to bank anytime, anywhere and on any device. Our solutions are often the most frequent point of interaction between our RCFI customers and their account holders. As such, we purpose-built our solutions to deliver a compelling, consistent user experience across digital channels and drive the success of our customers by extending their local brands, enabling improved account holder retention and creating incremental sales opportunities.
Our founding team has provided software solutions to the RCFI market for over 20 years, and they started Q2 with the mission of using technology to help RCFIs succeed and strengthen the communities they serve. We leverage our deep domain expertise to develop highly-secure virtual banking solutions designed to help our customers compete in the complex and heavily-regulated financial services industry. We internally design and develop our solutions around a common platform that tightly integrates our solutions with each other and with our customers' internal and third-party systems. This integrated approach delivers to account holders a unified and robust virtual banking experience across online, mobile, voice and tablet channels and allows for close, lasting relationships. We designed our solutions and data center infrastructure to comply with the stringent security and technical regulations applicable to financial institutions and safeguard our customers and their account holders.
The RCFI market includes approximately 13,000 banks and credit unions that compete to provide financial services in the U.S. RCFIs have historically sought to differentiate themselves and create account holder loyalty by providing localized, in-branch banking services and serving as centers of commerce and influence in their communities. However, account holders increasingly engage with their financial services providers across digital channels rather than in physical branches, making it easier for account holders to access competitive financial services and harder for RCFIs to maintain account holder loyalty. Innovation in financial services technologies, the proliferation of mobile and tablet devices and evolving consumer expectations for modern and intuitive user experiences are pressuring RCFIs to deliver advanced virtual banking services to successfully compete and grow.
RCFIs, unlike larger national banks, typically operate without all of the resources and personnel required to effectively deploy, manage and enhance their own internally-developed virtual banking offerings. In addition, RCFIs are required to spend increasing amounts of time and money complying with rapidly changing federal and state rules and regulations and frequent examinations by regulatory agencies. As a result, RCFIs are challenged to satisfy account holder expectations and compete effectively in what has become a complex and dynamic environment. These challenges often cause RCFIs to rely on disparate, third-party and internally-developed point solutions to deliver virtual banking services. However, many of these solutions provide limited features and functionality or can be expensive and time-intensive to implement, maintain and upgrade.
3
According to a January 2014 report published by Celent entitled "IT Spending in Banking, A North American Perspective," U.S. financial institutions are expected to spend $53.5 billion in 2015 on information technology, or IT. Of this amount, the report forecasts that these institutions will spend approximately $13.8 billion on new initiatives, heavily focused on enhancing their online, mobile, tablet and other self-service banking capabilities. Based on our current prices and virtual banking solutions, we believe that the RCFI market is greater than $3.5 billion annually. Our current RCFI customers represent less than 3% of the 12,994 federally-insured RCFIs in the U.S. with less than $50 billion in assets. We believe we can capture an increasing portion of the IT spend among RCFIs as we continue to grow our customer base and introduce new solutions.
Our software-as-a-service, or SaaS, delivery model is designed to scale with our customers as they add account holders on our solutions and expand the breadth of virtual banking services they offer. Our SaaS delivery model is also designed to reduce the cost and complexity of implementing, maintaining and enhancing the virtual banking services our RCFI customers provide to their account holders. RCFIs can configure our solutions to function in a manner that is consistent with their specific workflows, processes and controls and personalize the experiences they deliver to their account holders by extending the services and local character of their branches across digital channels.
We primarily sell subscriptions to our cloud-based solutions through our direct sales organization and recognize the related revenues over the terms of our customer agreements. The initial term of our customer agreements averages over five years, although it varies by customer. Our revenues increase as we add new customers and sell additional solutions to existing customers and as our customers increase the number of account holders on our solutions. We earn additional revenues based on the number of transactions that account holders perform on our virtual banking solutions. We support the efforts of our sales organization through a network of key referral partners, such as the American Bankers Association, National Association of Federal Credit Unions, and Western Independent Bankers.
As of December 31, 2014, we had over 360 customers with more than 4.3 million retail and commercial users registered on our solutions, and these registered users executed over $265 billion in financial transactions with our solutions during 2014, compared with over 330 customers as of December 31, 2013, whose 3.1 million registered users executed over $200 billion in financial transactions on our solutions during 2013. As we have grown our customer base over time, the size of our customers has also increased. Our current RCFI customers are in 47 states and include Camden National Bank, Community Bank (Los Angeles, CA), Eli Lilly Federal Credit Union, First Financial Bank (Cincinnati, OH), Heartland Financial, Peoples Bank of Alabama, Rockland Trust Company, Umpqua Bank, United Heritage Credit Union and Urban Partnership Bank.
We have achieved significant growth since our inception. We had total revenues of $79.1 million, $56.9 million and $41.1 million in 2014, 2013 and 2012, respectively. We seek to deepen and grow our customer relationships by providing consistent, high-quality implementation and customer support services which we believe drives higher customer retention and incremental sales opportunities within our existing customer base.
We have invested, and intend to continue to invest, to grow our business by expanding our sales and marketing activities, developing new solutions, enhancing our existing solutions and technical infrastructure and scaling our operations. We incurred net losses of $19.6 million, $17.9 million and $8.8 million in 2014, 2013 and 2012, respectively.
We were incorporated in March 2005 in the state of Delaware under the name CBG Holdings, Inc. We changed our name to Q2 Holdings, Inc. in March 2013. We are headquartered in Austin, Texas, and our principal executive offices are located at 13785 Research Blvd, Suite 150, Austin, Texas 78750. Our telephone number is (512) 275-0072.
Industry Background
RCFIs are a substantial and critical part of the economy
Regional and community banks and credit unions with less than $50 billion in assets comprised 12,994 of the 13,031 federally-insured financial institutions in the U.S., as of September 30, 2014, according to data compiled by BauerFinancial. Further, banking institutions and credit unions with less than $50 billion in assets had assets of $4.5 trillion and $1.1 trillion, respectively, as of September 30, 2014, according to BauerFinancial.
The U.S. financial services market is intensely competitive, and RCFIs have historically sought to differentiate themselves by providing local, personalized banking services that are responsive to the changing needs and circumstances of their communities. Many RCFIs are locally-owned and obtain deposits and make lending decisions on a local basis. As a result, RCFIs often develop strong, lasting relationships with their account holders and serve as centers of commerce and influence in their communities. According to a 2014 report from the Small Business Administration, small businesses (typically those independent businesses with fewer than 500 employees) have generated 60% of all net new jobs in the U.S. since mid-2013, and according to FDIC data as of September 30, 2014, RCFIs underwrote approximately 76% of all loans to these businesses during the first nine months of 2014.
4
RCFIs must respond to innovations in banking
According to a 2012 survey conducted by the Independent Community Bankers of America and a 2012 report from the National Credit Union Administration, approximately 96% of U.S. banks and 71% of U.S. credit unions offer online banking services to their retail and commercial account holders. Account holders have increasingly come to expect and rely upon a wider range of online banking services to meet their banking needs. For example, 72% of U.S. adults are expected to utilize online banking services by 2017 according to a report titled Trends 2014: North American Digital Banking published by Forrester Research, Inc. on April 22, 2014. By providing online account access and other virtual banking services, financial institutions are able to better engage with and sell more products and services to their account holders through digital channels. To appeal to those account holders who utilize virtual banking services, RCFIs must deliver robust virtual banking capabilities that allow account holders to seamlessly transition between physical branches and digital channels.
Financial service providers are innovating and expanding the virtual banking services they offer. In recent years, virtual banking services have grown beyond simple account access to view balances and pay bills, to more advanced self-service features such as remote check deposit, peer-to-peer payments and online loan application and approval. To remain competitive, RCFIs must keep pace with the innovation in the financial services industry by frequently enhancing the quality and scope of the virtual banking services they offer.
The proliferation of mobile and tablet devices and evolving consumer expectations for modern and intuitive user experiences increase the challenges of offering virtual banking solutions
The proliferation of smart mobile and tablet devices expands the channels through which account holders can perform virtual banking activities, decreasing the need to visit physical bank branches. The accelerating adoption of these devices and the extension of virtual banking services to new devices are making it increasingly difficult to provide a consistent, intuitive and personalized user experience and driving the need to provide virtual banking solutions that support new and rapidly changing mobile operating systems and device types. The technical and operational complexities of delivering integrated virtual banking services across multiple operating systems and devices increases the difficulty of providing a consistent, intuitive and personalized user experience.
Prominent consumer brands such as Amazon, Google and Netflix are continually innovating and shaping consumer expectations by delivering modern, intuitive user experiences across digital channels. We believe the frequency and duration with which consumers visit a website or mobile application is heavily influenced by the quality and ease-of-use of the user experience. As a result, RCFIs must deliver compelling user experiences to satisfy account holder expectations and increase account holder loyalty.
Security is of paramount importance in virtual banking
The risks of theft and fraud have always existed in banking. However, as the adoption and use of virtual banking services has increased, the incidence of fraud and theft in digital channels has grown substantially. For example, according to a February 2014 report by Javelin Strategy & Research, fraud resulting from account takeover attacks affected 43% more consumers in 2013 than 2012 and losses therefrom exceeded $5 billion in 2013. In December 2014, International Data Corporation predicted that global financial institutions will spend $2.8 billion by 2016 on fraud and financial crimes analytics software and services. In addition, according to a 2014 report by Verizon Communications Inc., or Verizon, financial services companies accounted for 34% of all security incidents with confirmed victims of data loss in 2013, which was more than two times the public sector, the next highest industry category.
The methods by which criminals seek to commit fraud are constantly changing, requiring financial institutions to continually modify their security strategies. In addition, safeguarding RCFI and account holder funds and information becomes increasingly complex as virtual banking services grow and extend across new channels and devices.
Market dynamics are driving demand for third-party solutions
RCFIs, unlike larger national banks, typically operate without all of the resources and personnel required to effectively deploy, manage, and enhance their own internally-developed virtual banking service offerings. Following the passage of the Dodd-Frank Wall Street Reform and Consumer Protection Act and the increased rule-making and examination efforts imposed by federal and state regulatory officials, RCFIs are having to commit additional time and resources to compliance matters. As a result, RCFIs are challenged to operate successfully in what has become a complex and dynamic environment.
These market dynamics are driving greater demand among RCFIs for modern, intuitive virtual banking solutions from leading third-party providers. According to a January 2014 report published by Celent entitled "IT Spending in Banking, A North American Perspective," U.S. financial institutions are expected to spend $53.5 billion in 2015 on IT. Of this amount, the report forecasts that these institutions will spend approximately $13.8 billion on new initiatives, heavily focused on enhancing
5
their online, mobile, tablet and other self-service banking capabilities. Based on our current prices and virtual banking solutions, we believe that the RCFI market is greater than $3.5 billion annually. As RCFIs continue to embrace virtual banking, they will need partners who can help them maintain and enhance the level of personalization they can deliver to their account holders in an effort to continue to differentiate themselves. We believe we can capture an increasing portion of the market for RCFI spend on IT, and in particular their spend on new initiatives, as we continue to broaden the scope of our virtual banking solutions by identifying additional solutions that will further benefit and grow our RCFI customers' account holder bases.
Organizations are increasingly transitioning to SaaS providers
Many organizations are transitioning from solutions which are deployed on-premises under a traditional enterprise license arrangement to cloud-based solutions offered under a SaaS model. According to a study entitled “Forecast Overview: Public Cloud Services, Worldwide, 2014 Update” by Ed Anderson, which was published by Gartner on September 9, 2014, 78% of organizations stated that they plan to increase spending on cloud services through 2017. SaaS solutions can provide a number of benefits to RCFIs, such as lower costs of ownership and operation, improved performance and integration, greater flexibility and scalability, easier deployment of upgrades and enhancements and efficient compliance with regulatory requirements. In addition, legacy systems cannot easily handle the introduction of new channels and devices, resulting in ongoing costly and time consuming work to keep pace with rapid technology innovation.
Traditional virtual banking systems have limitations
Many traditional virtual banking systems were originally developed over a decade ago to address a single type of account holder or specific digital channel such as voice banking. These systems can create the following challenges for RCFIs:
• | integrating applications and digital channels from multiple vendors may increase an RCFI's implementation costs, time-to-market or both; |
• | managing relationships with multiple vendors may be more time consuming and require greater management infrastructure; |
• | operating, supporting and upgrading systems from multiple vendors can be difficult, costly and less secure and generally do not provide for a unified user experience or a comprehensive view of an account holder; and |
• | training account holders and internal personnel on the use of different point systems can be challenging, time-consuming and costly. |
The use of multiple point systems for virtual banking can require account holders to maintain different login credentials for their retail and commercial accounts across digital channels and learn and understand different systems. Additionally, the disjointed nature of the underlying workflows, data and terminology caused by the implementation of multiple solutions can lead to decreased account holder adoption, retention and satisfaction. Account holders' adoption, retention and satisfaction can be adversely impacted by the dated user interfaces of older legacy systems.
We believe innovation in financial services technologies, the proliferation of mobile and tablet devices and evolving consumer expectations for modern and intuitive user experiences, combined with the limitations of traditional systems, create a significant opportunity for a SaaS provider to address the challenges RCFIs face as they seek to increase their level of engagement with account holders across digital channels and drive account holder loyalty. We believe this opportunity creates a substantial and growing market for cloud-based virtual banking solutions that deliver modern, intuitive self-service banking capabilities with a compelling and personalized user experience across digital channels and devices, while complying with regulatory requirements and safeguarding RCFIs and their account holders from fraud and theft.
Our Solutions
We provide secure, compliant cloud-based software solutions designed to enable RCFIs to grow their account holder bases and increase their profitability and market share by leveraging the power of virtual banking. Our solutions are often the most frequent point of interaction between our RCFI customers and their account holders. As such, we purpose-built our solutions to deliver a compelling, consistent user experience across digital channels and devices, promoting account holder acquisition and retention and creating incremental sales opportunities.
6
Key Attributes
Our virtual banking solutions include the following key attributes:
• | Common platform: Our solutions all operate on a common platform that supports the delivery of unified virtual banking services across online, mobile, voice and tablet channels. Our platform provides a single point of management enabling RCFIs to deliver targeted experiences including tailored rights, features and branding to account holders. |
• | Tablet-first design: We initially design the features and user experience of our solutions to be optimized for touch-based tablet devices and then extend that design to other digital channels. This design process and the broad feature set available in our common platform enable our solutions to deliver a modern, unified user experience across digital channels. |
• | Comprehensive view of account holders: Our cloud-based solutions and common platform provide our RCFI customers with a comprehensive view of account holder access and activity across devices and channels. The understanding and analysis made possible by this comprehensive view enable an enhanced, personalized user experience, real-time risk and fraud assessment and other analytic features that improve the utility of our solutions. |
• | Flexible integration: We have developed a highly flexible set of integration tools, enabling the rapid integration of third-party applications and data sources. This large set of internally-developed integration tools connects with over 190 third-party applications, allowing us to seamlessly integrate with RCFIs' internal and third-party systems such as account services, payments and imaging. |
• | SaaS delivery model: We developed our solutions to be cloud-based, and we host our solutions for substantially all of our RCFI customers. Our customers subscribe and pay for their use of our solutions over time, and our solutions do not require our customers to install any significant technical infrastructure. |
• | Regulatory compliance: Our solutions leverage our deep domain expertise and the significant investments we have made in the design and development of our data center architecture and other technical infrastructure to meet the stringent security and technical regulations applicable to financial institutions. |
• | Security: Our solutions provide both behavioral analytics and policy-based decision prompts to identify suspect transactions and allow RCFI administrators to analyze transaction activity. |
Key Benefits
We believe our solutions provide the following key benefits to our RCFI customers and their account holders:
• | Delivery of robust virtual banking services across digital channels: Our cloud-based solutions enable our RCFI customers to deliver robust and integrated virtual banking services to their account holders who increasingly expect and appreciate the freedom to bank anytime, anywhere and on any device. Through a single log-in and consistent workflow, users are able to seamlessly conduct retail and commercial transactions across digital channels and devices. |
• | Improved and more frequent engagement with account holders: The breadth of our virtual banking solutions and quality of the user experience they provide enable our RCFI customers to increase the frequency and effectiveness of their interactions with account holders. Our customers interact significantly more on average with account holders through our solutions than in physical branches. The frequency of these interactions can strengthen the relationships between account holders and our RCFI customers and help our customers gain a better understanding of the behavior and activities of their account holders to better serve them. |
• | Drive account holder loyalty: We believe our RCFI customers are able to drive account holder loyalty by increasing their level of engagement with account holders and consolidating their virtual banking activities on a single platform across devices and digital channels. Our customers are also able to tailor our solutions by offering individually relevant functionality as well as branded, localized user experiences. We believe this further strengthens loyalty by extending account holders' emotional ties to local branches into digital channels. |
• | More effective marketing of products and services: Our customers' marketing of their new and existing products and services through our solutions can be more frequent, timely and targeted than through traditional advertising. The ease and availability of communications within these virtual channels also make it easier for account holders to find information about products and services whenever needed. |
7
• | Real-time security: Our integrated Q2 Risk & Fraud Analytics offering allows our customers to better identify suspect activities and protect against fraud and theft by monitoring and understanding the behavior and activities of their account holders across channels. Customers leveraging our Risk & Fraud Analytics solution are blocking suspected fraudulent activity in real-time at the application layer and notifying operations staff and account holders of suspect transactions prior to funds leaving the financial institution. By approaching security in this and other ways, our customers can better safeguard their account holders and themselves, reducing risk and protecting their reputations. |
• | Lower total cost of ownership: Our SaaS delivery model can reduce the total cost of ownership of our customers by providing on a subscription basis the development, implementation, integration, maintenance, monitoring and support of our cloud-based solutions. Our common platform is designed to support the rapid addition of new services as well as the introduction of new devices and digital channels. As a result, our customers can easily and cost-effectively scale the use of our solutions with their needs as they add account holders and registered users and expand the virtual banking services they offer. |
• | Facilitate regulatory compliance: Customers who use our cloud-based solutions are able to satisfy security and technical compliance obligations by relying on the security programs and regulatory certification of our data centers and other technical infrastructure. By doing so, our customers eliminate significant cost and effort associated with building, maintaining and upgrading a regulatory-compliant environment on their own. |
Our Business Strengths
Since our inception, our mission has been to help our RCFI customers succeed and strengthen the communities they serve. As a result, we have remained focused on designing and developing solutions that help them respond to the unique challenges they face. We believe our position as a leading provider of virtual banking solutions to our RCFI customers stems from the following strengths:
• | Our purpose-built solutions lead the RCFI virtual banking market: We built our solutions to address the unique challenges that RCFIs face in providing virtual banking services. Our common platform was created to support the proliferation of mobile and tablet devices and the speed at which their use has become a common part of daily life. Our platform reduces the inefficiencies of traditional point-to-point integration strategies and replaces multiple management consoles with a single unified view of the rules, rights and security involved with operating seamlessly across digital channels. Our solutions enable our RCFI customers to provide a compelling, unified user experience to retail and commercial account holders using a single login anywhere, anytime and on any device. |
• | We have a proven track record in the markets we serve: Our founders and management have a track record of successfully building banking technology companies. In addition, our employees have deep domain expertise in financial services and community banking. We utilize this deep industry-specific experience to drive our continued growth and success. |
• | Our customer acquisition model is focused and efficient: We focus our customer acquisition efforts exclusively on RCFIs. This market opportunity drives our targeted go-to-market strategy which allows us to effectively direct our sales and marketing efforts. Utilizing the deep industry experience of our management and sales teams, we are able to leverage our relationships with leaders and influencers at many RCFIs as valuable sources of reference and promotion. As a result, our sales professionals are typically able to identify opportunities early and often reduce sales cycle time. |
• | We grow our customer relationships over time: Throughout our long-term customer relationships, we employ a structured strategy designed to inform, educate and enhance customer confidence and help our customers identify and implement additional solutions designed to benefit and grow their account holder bases. |
• | Our revenues are highly predictable: We generally recognize our revenues over the terms of our customer agreements. The initial term of our customer agreements averages over five years, although it varies by customer. Our long-term agreements and our high customer retention, as well as the growth over time in the number of account holders using our solutions, drive the recurring nature of our revenues and provide us with significant visibility into future revenues. Furthermore, we believe our customer services model drives high retention rates and incremental sales of our solutions. |
• | Our award-winning culture drives innovation and customer success: We believe our award-winning, innovation-focused culture and the location of our operations facilitate recruiting and retaining top development, integration and design talent. We are headquartered in Austin, Texas which is a vibrant city that continues to attract an increasing |
8
number of young professionals and has close ties to leading research institutions. In each of the past four years, the Austin American Statesman recognized us as one of Austin's "Top Places to Work." Our mission, combined with our focus on delivering cloud-based virtual banking solutions to RCFIs, continue to enable us to attract and retain top talent.
Our Growth Strategy
We intend to continue to expand our position as a leading provider of cloud-based virtual banking solutions to RCFIs. To accomplish this goal, we are pursuing the following growth strategies:
• | Further penetrate our large market opportunity: We believe RCFIs are increasingly adopting cloud-based virtual banking solutions. Our current customers represent less than 3% of the 12,994 federally-insured RCFIs in the U.S. with less than $50 billion in assets. We intend to further penetrate our large market opportunity and increase our number of RCFI customers through investments in our sales and marketing organization and related activities. |
• | Grow revenues by expanding our relationships with existing customers: We believe there is significant opportunity to expand our relationships with existing customers by selling additional solutions such as mobility applications, remote check deposit and mobile bill payment. In addition, our revenues from existing customers continue to grow as these customers increase the number of account holders on our solutions and as the number of transactions these account holders perform on our solutions increases. |
• | Continue to expand our solutions and enhance our platform: We believe our history of innovation distinguishes us in the market, and we intend to continue to invest in our software development efforts and introduce new solutions that are largely informed by and aligned with the business objectives of our existing and new customers. For example, we recently added Q2 Treasury, which is designed to support RCFIs in their efforts to attract and retain larger commercial accounts. Additionally, we successfully leveraged our common platform and integration capabilities which enabled us to derive rich analytics and build and deploy our Risk & Fraud Analytics offering, which has been adopted by over 49% of our customers. We plan to continue to expand our analytics capabilities and leverage the data generated on our common platform to further support the strategic initiatives of our existing and new customers. |
• | Further develop our partner relationships: We establish key partner relationships with industry-leading providers to optimize our go-to-market strategy and enhance the value of our platform. Our partners typically inform, educate and connect RCFIs with the services and solutions required to deliver new and innovative technology to their account holders. We plan to leverage our partner ecosystem and cultivate new partner relationships, such as our partnerships with the American Banking Association, National Association of Federal Credit Unions, and Western Independent Bankers, to increase the awareness of our solutions. |
• | Selectively pursue acquisitions and strategic investments: In addition to continuing to develop our solutions organically, we regularly evaluate strategic opportunities and anticipate that we will selectively pursue acquisitions of and strategic investments in businesses and technologies that will strengthen and expand the features and functionality of our solutions or provide access to new customers. |
The Q2 Solutions
Our solutions allow RCFIs to offer a comprehensive and unified suite of virtual banking services to their account holders. We internally designed and developed our solutions around a common platform that integrates our solutions with each other and RCFIs' other internal and third-party systems and enables virtual banking services to extend across online, mobile, voice and tablet channels. Our common platform architecture, deep integration with other systems and the multi-tenant aspects of our infrastructure, enable us to develop solutions that allow our customers to harness the power of the information within their other systems to gain greater insights and to improve the overall security of their account holders and themselves.
Our common platform is deployed with the initial installation of our solutions and provides our customers with the following benefits:
• | single-login and multi-layered security across channels and devices; |
• | deep integration with numerous other internal and third-party systems within RCFIs; |
• | single interface to an RCFI's core transaction processing system; |
• | unified user experience and consistent workflows, languages and data; |
9
• | more rapid configurability, development and deployment of new features and functionality; and |
• | comprehensive view of account holder activity across channels and devices. |
We leverage the benefits of our common platform to provide our customers the following solutions:
Q2online: Q2online is our browser-based virtual banking solution. Q2online leverages the integration and other benefits of our common platform to securely deliver comprehensive RCFI-branded virtual banking capabilities such as account access, check balancing, funds transfers, bill pay, processing recurring payments, statement viewing and new products and service applications. Q2online also supports single and batch ACH processing, payroll, state and federal tax payments and domestic and international wires. Q2online also provides our customers with management functionality such as account holder enrollment, password management, permissions, rights management, reports, integrated security as well as feature assignment for online, mobile, voice and tablet banking.
Q2 Risk & Fraud Analytics: Q2 Risk & Fraud Analytics is our real-time security analytics solution designed to help our customers detect and block suspect transactions within our virtual banking solutions. Q2 Risk & Fraud Analytics provides both behavioral analytics and policy-based decision prompts for RCFI administrators. Our solution continuously learns account holder behaviors while providing an analysis of transaction activity via easy-to-use case management tools supporting either the authorization or interruption of transactions.
Q2 Treasury: Q2 Treasury is designed to support RCFIs in their efforts to attract and retain larger commercial accounts. Using Q2 Treasury, business accounts can more effectively manage higher volume and more complex transactions by restricting transactions based on accounts, subsidiaries, approval levels, user roles, date and time as well as geographic location. In addition, Q2 Treasury supports more advanced information reporting designed to help RCFIs deliver key business information to their commercial account holders.
Q2mobility App: Q2mobility App is our mobile and tablet virtual banking solution. With Q2mobility App, retail and commercial account holders can access, engage and complete banking transactions such as adding and managing payees, transferring funds, executing single or recurring payments for multiple bank accounts, viewing e-statements or check images and managing other general banking services from their Apple iOS or Android-enabled mobile or tablet device. Q2mobility App uses the native functionality of mobile and tablet devices, such as touch, camera and geo-location to enhance the virtual banking experience of account holders.
Q2mobile Remote Deposit Capture: Q2mobile Remote Deposit Capture is a partnered solution that allows remote check deposit capture utilizing account holders' camera-ready mobile and tablet devices.
Q2text: Q2text is our mobile solution designed to enable specific virtual banking activities through the text messaging function of the device. Q2text provides self-service banking to account holders without the use of an app. Q2text enables account holders to check account balances, review transaction histories, transfer funds between accounts and manage alert and notification messaging to their mobile device.
Q2voice: Q2voice is our voice-based solution for telephones. With Q2voice account holders can use their traditional telephone or mobile phones to conduct voice banking such as checking account balances and transfers. Q2voice also enables our customers to provide alerts, notification, security and completion of an online initiated transaction to their account holders.
Q2themes: Q2themes is a personalization solution for Q2online customers. RCFIs can use Q2themes to customize their virtual banking services through personal, local, loyalty- and audience-specific themes, such as language preferences, font styles and designs specific to our customers' account holders.
Q2clarity: Q2clarity is our analytics solution for our Q2online customers. Q2clarity leverages cross-channel data and security analysis to provide our customers' executives with a view of key performance indicators, such as solution performance, utilization and account holder interactions.
Implementation and Customer Support
We seek to deepen and grow our customer relationships by providing consistent, high-quality implementation and customer support services which we believe drive higher customer retention and incremental sales opportunities within our existing customer base. We structure our implementation teams to effectively collaborate with the management and technology teams of our customers ensuring the rapid deployment and effective utilization of our solutions. Our implementation teams develop and execute a coordinated implementation plan for our customers centered around five key phases: initiation, configuration, application testing, limited production and production.
10
Our customer support personnel serve the comprehensive support-related needs of our customers. Due to the highly-regulated and complex nature of the financial services industry, our implementation and customer support service teams are aided by highly-trained, in-house resources who are knowledgeable about our solutions and the regulatory environment in which our customers operate.
Partner Offerings
The flexible nature of our common platform allows us to build rapid integrations with RCFIs' internal and third-party systems to support account holder activities and RCFI processes. Our ability to integrate with these systems enables our customers to offer a comprehensive set of retail and commercial functionality to their account holders such as bill payment, personal finance management, online account opening and secure browsing while providing the RCFI a single view of the RCFI's activities and processes such as risk management, fraud detection and account reconciliation. This level of visibility enables our RCFI customers to evaluate the overall efficiency of their virtual banking offerings.
Sales and Marketing
Our sales and marketing organization is responsible for growing our customer base and maintaining and expanding relationships with our existing customers. We sell our virtual banking solutions mainly through our direct sales organization. Our direct sales organization consists of experienced sales professionals who are organized based on several different criteria including geography, account size, type of financial institution and whether a prospect is a new or existing customer. Our sales representatives are supported by our solutions consulting and sales operations teams.
Our marketing team complements our sales organization through lead generation, brand building, analyst relations and industry research. Our target market is well-defined due to the regulatory classifications of financial institutions. As a result we are able to target our marketing efforts on RCFIs. We focus our marketing efforts on industry-specific tradeshows, publications and digital newsletters as well as referral agreements with strategic industry partners. Our marketing team also conducts primary research to support our industry thought leadership and to identify emerging trends in account holder behavior and virtual banking activities. Our marketing programs target RCFI technology, finance, operations and marketing executives as well as senior business leaders.
Research and Development
Our focus on innovation has fueled our growth and enables us to provide our customers unified cloud-based virtual banking solutions built on a common platform. We allocate significant resources to developing and improving our platform and virtual banking solutions to meet our customers' evolving virtual banking needs. We monitor and test our solutions regularly, and we maintain a disciplined release process to enhance our existing solutions and introduce new capabilities without interrupting service delivery. We follow state-of-the-art practices in software development and design, including using modern programming languages, data storage systems and other tools. Our multi-tiered architecture enables us to scale, add and modify features quickly in response to changing market dynamics, customer needs and regulatory requirements. Our platform was engineered to support rapid development and deployment of new features to address RCFI needs in the market. We also enable RCFIs to address their market-specific needs via our extension and integration frameworks which is a key aspect of our technology strategy. Workflows and features that we deliver include automated enrollment, product specific payment workflows, loan origination, "save-the-change" programs, targeted marketing and new account opening.
Our research and development expenses were $12.1 million, $9.0 million and $5.3 million for the years ended December 31, 2014, 2013 and 2012, respectively.
Technology and Operations
Due to the highly regulated nature of the financial services industry, our platform combines both multi-tenant and single instance aspects. This structure is designed to maximize account holder data security and minimize compliance cost and risks. Our solutions utilize a multi-tiered architecture that allows for scalability, operational simplicity, security and disaster recovery. We have also developed an internal operations and analytics platform that aggregates and leverages customer instance and account holder experience captured within our solutions to drive future innovation and scale.
We serve our customers from two secure, third-party, American National Standards Institute Tier 4 data center facilities, one located in Carrollton, Texas and the other located in Austin, Texas. Both data centers are operated by the same third party provider. We believe that our current data centers have sufficient capacity to meet our anticipated growth for the foreseeable future. Although we utilize a third-party to manage our data center facilities, we manage the hardware and software on which our solutions operate. We utilize industry standard hardware in resilient configurations to minimize service interruptions. We have also purchased a private block of IP address space to simplify and expedite our disaster recovery management operations for our customers.
11
Our solutions have had average monthly uptimes in excess of 99.8% since January 2012. We actively monitor our infrastructure 24x7 for any sign of failure, and we seek to take preemptive action to minimize and prevent downtime. Our data centers employ advanced measures to ensure physical integrity and security, including redundant power from multiple substations and cooling systems, fire and flood prevention mechanisms, continual security coverage and biometric readers at entry points as well as perimeter boundary security measures. We have also implemented extensive disaster recovery measures and continue to invest in data center and other technical infrastructure.
All users are authenticated, authorized and validated before they can access our solutions. Users must have at a minimum, a valid user ID and associated password. Many of our customers also employ other authentication methods such as out-of-band one-time password delivery to log on to our solutions and hardware cryptographic tokens to authorize transactions. Our layered security model allows different groups of users to have different levels of access to our solutions. Our solutions' vulnerability is tested using internal tools prior to release, and an independent third party performs penetration and vulnerability tests on our solutions periodically.
Intellectual Property
We rely on a combination of patent, trademark, trade secrets and copyright laws, as well as confidentiality procedures and contractual restrictions, to establish, maintain and protect our proprietary rights. As of December 31, 2014, we had two issued patents and one patent application pending in the U.S. Our issued patent, which expires in March 2028, relates to our intellectual property created to address technology integration challenges for community banks and credit unions. We use the software components and methods claimed in this patent to access the data from several different types of RCFIs and to allow us to deliver our online, mobile, tablet, voice and text solutions to their account holders without having to individually integrate each solution with each RCFI's data. Despite substantial investment in research and development activities, we have not focused on patents and patent applications historically. We license third-party technologies, such as bill pay technologies, that are incorporated into some of our solutions.
The efforts we have taken to protect our intellectual property rights may not be sufficient or effective. It may be possible for other parties to copy or otherwise obtain and use the content of our solutions without authorization. Failure to protect our proprietary rights adequately could significantly harm our competitive position and operating results.
Companies in the Internet and technology industries, and other patent and trademark holders seeking to profit from royalties in connection with grants of licenses, own large numbers of patents, copyrights, trademarks and trade secrets and frequently enter into litigation based on allegations of infringement or other violations of intellectual property rights. We have received in the past, and will likely in the future, receive notices that claim we have misappropriated or misused other parties' intellectual property rights. There may be intellectual property rights held by others, including issued or pending patents and trademarks that cover significant aspects of our solutions. Any intellectual property claim against us, regardless of merit, could be time consuming and expensive to settle or litigate and could divert our management's attention and other resources. These claims could also subject us to significant liability for damages and could result in our having to stop using solutions found to be in violation of another party's rights. We might be required or may opt to seek a license for rights to intellectual property held by others, which may not be available on commercially reasonable terms, or at all. Even if a license is available, we could be required to pay significant royalties, which would increase our operating expenses. We may also be required to develop alternative non-infringing solutions, which could require significant effort and expense and which we may not be able to perform efficiently or at all. If we cannot license the intellectual property at issue or develop non-infringing solutions for any allegedly infringing aspect of our business, we may be unable to compete effectively.
Our Competition
The market for virtual banking solutions is highly competitive. We compete with point solution vendors and core processing vendors, as well as internally-developed solutions. We believe that our deep industry expertise, reputation for consistent, high-quality customer support and our comprehensive and unified cloud-based virtual banking solutions that extend across online, mobile, voice and tablet channels and devices in a secure compliant manner distinguish us from the competition.
We currently compete with providers of technology and services in the financial services industry, including point system vendors and core processing vendors, as well as systems internally developed by RCFIs. We have a number of point system competitors, including Digital Insight Corporation (acquired by NCR Corporation), First Data Corporation and ACI Worldwide, Inc. in the online, consumer and small business banking space and Fundtech Ltd., ACI Worldwide, Inc., Clear2Pay NV/SA and Bottomline Technologies (de), Inc. in the commercial banking space. We also compete with core processing vendors that provide systems and services such as Fiserv, Inc., Jack Henry and Associates, Inc. and Fidelity National Information Services, Inc. Many of our competitors have significantly more financial, technical, marketing and other resources than we have, may devote greater resources to the promotion, sale and support of their systems than we can, have more extensive customer bases
12
and broader customer relationships than we have and have longer operating histories and greater name recognition than we have. In addition, many of our competitors expend a greater amount of funds on research and development.
Although we compete with point system vendors and core processing vendors, we also partner with some of these vendors for certain data and services utilized in our solutions and receive referrals from them. In addition, certain RCFIs have or can obtain the ability to create their own in-house systems, and while many of these systems have difficulties scaling and providing an integrated platform, we still face challenges displacing in-house systems and retaining customers that choose to develop an in-house system.
We believe the principal competitive factors in our market include the following:
• | alignment with the mission of the RCFIs; |
• | ability to provide a single platform for retail and commercial account holders; |
• | functionality across online, mobile, voice and tablet channels; |
• | cloud-based technology platform and pricing model; |
• | ability to quickly integrate with third-party applications and systems; |
• | ease of use of the interface, view and login to virtual banking services across channels; |
• | design of the account holder experience, including modern, intuitive and touch-centric features; |
• | configurability and RCFI branding capabilities; |
• | familiarity of workflows and terminology and feature-on-demand functionality; |
• | integrated multi-layered security and compliance of solutions with regulatory requirements; |
• | quality of implementation, integration and support services; |
• | domain expertise and innovation in banking technology; |
• | ability to innovate and respond to customer needs rapidly; and |
• | rate of development, deployment and enhancement of software. |
We believe that we compete favorably with respect to these factors within the RCFI market for virtual banking solutions, but we expect competition to continue and increase as existing competitors continue to evolve their offerings and as new companies enter our market. Many of our competitors have substantially greater financial, technical and other resources and have greater flexibility in bundling and pricing competing solutions. To remain competitive, we believe we must continue to invest in research and development, sales and marketing, customer support and our business operations generally.
Employees
As of December 31, 2014, we had 501 employees, all of which are located in the U.S. We consider our current relationship with our employees to be good. None of our employees are represented by a labor union or are a party to a collective bargaining agreement.
Culture
Since our inception, our culture has been rooted in our mission to help our RCFI customers be more successful and better serve their communities. We believe our passion, dedication and commitment towards this mission is a significant differentiator for us with RCFIs and our employees. We share our culture through our customer interactions, employee functions and collaborative and educational customer events like our client conference, user groups and collaboration focus groups. In each of the past four years, the Austin American Statesman recognized us as one of Austin's "Top Places to Work," and approximately 50% of our newly-hired employees in 2014 were referred by existing employees.
13
Presented with regular opportunities to help RCFIs more successfully compete and grow, we seek out ways to enhance our culture and our ability to make a difference for our customers and their account holders. Our culture is visible across our organization and highlighted through a host of initiatives, programs and committees including the following:
• | our employee led committees of culture, wellness, green, cares and communications help create opportunities for employees to come together around important causes to make a difference in the work place and local communities; |
• | our project renaissance and project base camp initiatives promote the hiring of broad and non-traditional engineering and project management talent; |
• | our emerging leaders management training program identifies and cultivates new and emerging leadership talent within our organization; and |
• | our flexible work spaces promote a collaborative, high-energy work environment and help facilitate team-based problem solving and cross-departmental learning. |
Government Regulation
As a technology service provider to banks and credit unions, we are not required to be chartered by the Office of the Comptroller of the Currency, the Board of Governors of the Federal Reserve System, the Federal Deposit Insurance Corporation, the National Credit Union Administration or other federal or state agencies that regulate or supervise our customers and other providers of financial services.
Our customers and prospects are subject to extensive and complex regulations and oversight by federal and state regulatory authorities. These laws and regulations are constantly evolving and affect the conduct of our customers' operations and, as a result, our business. For instance, in 2010 the Dodd-Frank Wall Street Reform and Consumer Protection Act, or the Dodd-Frank Act, was enacted. The Dodd-Frank Act introduced substantial reforms to the supervision and operation of the financial services industry, including introducing changes that:
• | affect the oversight and supervision of financial institutions; |
• | introduce more stringent regulatory capital requirements; |
• | implement changes to corporate governance and executive compensation practices; and |
• | require significant rule-making. |
The Dodd-Frank Act also established a new federal interagency council called the Financial Stability Oversight Council, or FSOC, and a new federal bureau called the Consumer Financial Protection Bureau, or CFPB. The FSOC monitors and assesses systemic risk to the safety of the U.S. financial system and coordinates the actions of the various regulatory agencies on those issues. The CFPB is empowered to conduct rule-making and supervision related to, and enforcement of, federal consumer financial protection laws. The Dodd-Frank Act has generated, and will continue to generate, numerous new regulations that will impact the financial services industry. It is difficult to predict the extent to which the Dodd-Frank Act, the FSOC, the CFPB or the resulting regulations will impact our business or the businesses of our current and potential customers.
Our solutions must enable our customers to comply with other applicable requirements such as the following:
• | the Electronic Funds Transfer Act; |
• | the Electronic Signatures in Global and National Commerce Act; |
• | federal and state usury laws; |
• | the Gramm-Leach-Bliley Act; |
• | laws against unfair, deceptive, or abusive acts or practices; |
• | the Privacy of Consumer Financial Information regulations; |
• | the Guidance on Supervision of Technology Services Providers promulgated by the Federal Financial Institutions Examination Council, or FFIEC; |
14
• | the Guidance on Outsourcing Technology Services promulgated by the FFIEC; and |
• | other state and local laws and regulations. |
We are subject to periodic examination by banking regulators under the authority of the FFIEC under its Guidance on the Supervision of Technology Services Providers and the Gramm-Leach-Bliley Act of 1999, and other federal and state laws that apply to technology service providers as a result of the services we provide to the institutions they regulate. As an independent technology service provider, we are examined by federal financial regulators on a rotating basis. These examinations are based on guidance from the FFIEC, which is a formal interagency body empowered to prescribe uniform principles, standards and report forms for the examination of financial institutions and to make recommendations to promote uniformity in the supervision of financial institutions. The examinations cover a wide variety of subjects, including our management, acquisition and development activities, support and delivery, IT audits, as well as our disaster preparedness and business recovery planning. The banking regulators that make up the FFIEC have broad supervisory authority to remedy any shortcomings identified in an examination. Following an examination, our financial institutions customers may request an executive summary of the examination through their lead examination agency.
The Dodd-Frank Act granted the CFPB authority to promulgate rules and interpret certain federal consumer financial protection laws, some of which apply to the solutions we offer. In certain circumstances, the CFPB also has examination and supervision powers with respect to service providers who provide a material service to a financial institution offering consumer financial products and services.
The compliance of our solutions with these requirements depends on a variety of factors, including the functionality and design of our solutions, the classification of our customers, and the manner in which our customers and their account holders utilize our solutions. For example, we are subject to the privacy and confidentiality provisions of the Gramm-Leach-Bliley Act and its implementing regulations. In order to comply with our obligations under these laws, we are required to implement operating policies and procedures to protect the privacy and security of our customers' and their account holders' information and to undergo periodic audits and examinations.
Available Information
Our website address is https://q2ebanking.com. Our Annual Report on Form 10-K, quarterly reports on Form 10-Q, current reports on Form 8-K and amendments to those reports filed or furnished pursuant to Section 13(a) or 15(d) of the Securities Exchange Act of 1934 are available through the investor relations page of our internet website free of charge as soon as reasonably practicable after we electronically file such material with, or furnish it to, the Securities and Exchange Commission ("SEC"). Our website and the information contained therein or connected thereto are not intended to be incorporated into this Annual Report on Form 10-K. The public may read and copy any materials we file with SEC at the SEC’s Public Reference Room at 100 F Street, NE, Washington, DC 20549. The public may obtain information on the operation of the Public Reference Room by calling the SEC at 1-800-SEC-0330. In addition, the SEC maintains an Internet site (http://www.sec.gov) that contains reports, proxy and information statements, and other information regarding issuers that file electronically with the SEC.
Item 1A. Risk Factors.
Our business, prospects, financial condition, operating results and the trading price of our common stock could be materially adversely affected by any of the risks and uncertainties described below, as well as other risks not currently known to us or that are currently considered immaterial. In assessing these risks, you should also refer to the other information contained in this Annual Report on Form 10-K, including our consolidated financial statements and related notes.
Risks Related to Our Business
We have experienced rapid growth in recent periods, including an increase in the size of our customers, and if we fail to manage our growth effectively, we may be unable to execute our business plan, maintain high levels of service and customer satisfaction or adequately address competitive challenges, and our financial performance may be adversely affected.
Since our inception, our business has rapidly grown, which has resulted in large increases in our number of employees, expansion of our infrastructure, enhancement of our internal systems and other significant changes and additional complexities. Our revenues increased from $41.1 million for the twelve months ended December 31, 2012 to $56.9 million for the twelve months ended December 31, 2013, and $79.1 million for the twelve months ended December 31, 2014. While we intend to further expand our overall business, customer base, and number of employees, our recent growth rate is not necessarily
15
indicative of the growth that we will achieve in the future. The growth in our business generally, our management of a growing workforce and customer base geographically-dispersed across the U.S. and the stress of such growth on our internal controls and systems require substantial management effort, infrastructure and operational capabilities. To support our growth, we must continue to improve our management resources and our operational and financial controls and systems, and these improvements may increase our expenses more than anticipated and result in a more complex business, and our failure to timely and effectively implement these improvements could have an adverse effect on our operations and financial results. We will also have to anticipate the necessary expansion of our relationship management, implementation, customer service and other personnel to support our growth and achieve high levels of customer service and satisfaction, particularly as we sell to larger customers that have heightened levels of complexity in their hardware, software and network infrastructure needs. Our success will depend on our ability to plan for and manage this growth effectively. If we fail to anticipate and manage our growth or are unable to provide high levels of system performance and customer service, our reputation, as well as our business, results of operations and financial condition, could be harmed.
If the market for our cloud-based virtual banking solutions develops more slowly than we expect or changes in a way that we fail to anticipate, our sales would suffer and our operating results would be harmed.
Use of and reliance on cloud-based virtual banking solutions is at an early stage, and we do not know whether RCFIs will continue to adopt virtual banking solutions such as ours in the future, or whether the market will change in ways that we do not anticipate. Many RCFIs have invested substantial personnel and financial resources in legacy software, and these institutions may be reluctant or unwilling to convert from their existing systems to our solutions. Furthermore, some RCFIs may be reluctant or unwilling to use a cloud-based solution over concerns such as the security of their data and reliability of the delivery model. These concerns or other considerations may cause RCFIs to choose not to adopt cloud-based solutions such as ours or to adopt alternative solutions, either of which would harm our operating results. If RCFIs are unwilling to transition from their legacy systems, the demand for our virtual banking solutions and related services could decline and adversely affect our business, operating results and financial condition.
Our future success also depends on our ability to sell additional solutions and enhanced solutions to our current customers. As we create new solutions and enhance our existing solutions to support new technologies and devices, these solutions and related services may not be attractive to customers. In addition, promoting and selling these new and enhanced solutions may require increasingly costly sales and marketing efforts, and if customers choose not to adopt these solutions, our business could suffer.
Our business could be adversely affected if our customers are not satisfied with our virtual banking solutions, particularly as we introduce new products and solutions, or our systems and infrastructure fail to meet their needs.
Our business depends on our ability to satisfy our customers and meet their virtual banking needs. Our customers use a variety of network infrastructure, hardware and software, which typically increases in complexity the larger the customer is, and our virtual banking solutions must support the specific configuration of our customers' existing systems, including in many cases the solutions of third-party providers. If our solutions do not currently support a customer's required data format or appropriately integrate with a customer's applications and infrastructure, then we must configure our solutions to do so, which could negatively affect the performance of our systems and increase our expenses and the time it takes to implement our solutions. Any failure of or delays in our systems could cause service interruptions or impaired system performance. Some of our customer agreements require us to issue credits for downtime in excess of certain thresholds, and in some instances give our customers the ability to terminate the agreements in the event of significant amounts of downtime. If sustained or repeated, these performance issues could reduce the attractiveness of our solutions to new and existing customers, cause us to lose customers, and lower renewal rates by existing customers, each of which could adversely affect our revenue and reputation. In addition, negative publicity resulting from issues related to our customer relationships, regardless of accuracy, may damage our business by adversely affecting our ability to attract new customers and maintain and expand our relationships with existing customers.
If the use of our virtual banking solutions increases, or if our customers demand more advanced features from our solutions, we will need to devote additional resources to improving our solutions, and we also may need to expand our technical infrastructure at a more rapid pace than we have in the past. This would involve spending substantial amounts to purchase or lease data center capacity and equipment, upgrade our technology and infrastructure and introduce new or enhanced solutions. It takes a significant amount of time to plan, develop and test changes to our infrastructure, and we may not be able to accurately forecast demand or predict the results we will realize from such improvements. There are inherent risks associated with changing, upgrading, improving and expanding our technical infrastructure. Any failure of our solutions to operate effectively with future infrastructure and technologies could reduce the demand for our solutions, resulting in customer dissatisfaction and harm to our business. Also, any expansion of our infrastructure would likely require that we appropriately
16
scale our internal business systems and services organization, including implementation and customer support services, to serve our growing customer base. If we are unable to respond to these changes or fully and effectively implement them in a cost-effective and timely manner, our service may become ineffective, we may lose customers, and our operating results may be negatively impacted.
Our limited operating history makes it difficult to evaluate our current business and future prospects.
We began our operations in March 2005. Our limited operating history makes it difficult to evaluate our current business and future prospects. We have encountered and will continue to encounter risks and difficulties frequently experienced by growing companies in rapidly developing and changing industries, including challenges in forecasting the future growth of our customer base, the number of our customers' account holders and the number of users registered to use our solutions as well as the number of transactions that registered users perform on our solutions. In addition, we have and may continue to face challenges with our infrastructure, services organization and related expenses, market acceptance of our existing and future solutions, competition from established companies with greater financial and technical resources as well as new competitive entrants, acquiring and retaining customers, managing customer implementations and developing new solutions. We cannot assure you that we will be successful in addressing these difficulties and other challenges we may face in the future.
The markets in which we participate are intensely competitive, and pricing pressure, new technologies or other competitive dynamics could adversely affect our business and operating results.
We currently compete with providers of technology and services in the financial services industry, including point system vendors and core processing vendors, as well as systems internally-developed by RCFIs. We have a number of point system competitors, including Digital Insight Corporation (acquired by NCR Corporation), First Data Corporation and ACI Worldwide, Inc. in the online, consumer and small business banking space and Fundtech Ltd., ACI Worldwide, Inc., Clear2Pay NV/SA and Bottomline Technologies (de), Inc. in the commercial banking space. We also compete with core processing vendors that provide systems and services such as Fiserv, Inc., Jack Henry and Associates, Inc. and Fidelity National Information Services, Inc. Many of our competitors have significantly more financial, technical, marketing and other resources than we have, may devote greater resources to the promotion, sale and support of their systems than we can, have more extensive customer bases and broader customer relationships than we have and have longer operating histories and greater name recognition than we have. In addition, many of our competitors expend a greater amount of funds on research and development.
We may also face competition from new companies entering our markets, which may include large established businesses that decide to develop, market or resell virtual banking solutions, acquire one of our competitors or form a strategic alliance with one of our competitors. In addition, new companies entering our markets may choose to offer virtual banking applications at little or no additional cost to the customer by bundling them with their existing applications, including adjacent banking technologies and core processing software. New entrants to the market might also include non-banking providers of payment solutions and other technologies. Competition from these new entrants may make our business more difficult and adversely affect our results.
If we are unable to compete in this environment, sales and renewals of our virtual banking solutions could decline and adversely affect our business, operating results and financial condition. With the introduction of new technologies and potential new entrants into the virtual banking solutions market, we expect competition to intensify in the future, which could harm our ability to increase sales and achieve profitability. Our industry has experienced consolidation. For example, in January 2014, NCR Corporation acquired Digital Insight Corporation. We believe that our industry could experience further consolidation, which could lead to increased competition and result in pricing pressure or loss of market share, either of which could have a material adverse effect on our business, limit our growth prospects or reduce our revenues.
If we are unable to effectively integrate our solutions with other systems used by our customers and prospective customers, or if there are performance issues with such third-party systems, our solutions will not operate effectively and our operations will be adversely affected.
The functionality of our solutions depends on our ability to integrate with other third-party systems used by our customers, including core processing software. Certain providers of these third-party systems also offer solutions that are competitive with our solutions and may have an advantage over us with customers using their software by having better ability to integrate with their software and by being able to bundle their competitive products with other applications used by our customers and prospective customers at favorable pricing. We do not have formal arrangements with many of these third-party providers regarding our access to their application program interfaces to enable these customer integrations.
17
Our business may be harmed if any of our third-party providers:
• | change the features or functionality of their applications and platforms in a manner adverse to us; |
• | discontinue or limit our solutions' access to their systems; |
• | terminate or do not allow us to renew or replace our existing contractual relationships on the same or better terms; |
• | modify their terms of service or other policies, including fees charged to, or other restrictions on, us or our customers; |
• | establish more favorable relationships with one or more of our competitors, or acquire one or more of our competitors and offer competing services; or |
• | otherwise have or develop their own competitive offerings. |
Such changes could limit or prevent us from integrating our solutions with these third-party systems, which could impair the functionality of our solutions, prohibit the use of our solutions or limit our ability to sell our solutions to customers, each of which could harm our business. If we are unable to integrate with such third-party software as a result of changes to or restricted access to the software by such third parties during the terms of existing agreements with customers using such third-party software, we may not be able to meet our contractual obligations to customers, which may result in disputes with customers and harm to our business. In addition, if any third-party software providers experience an outage, our virtual banking solutions integrated with such software will not function properly or at all, and our customers may be dissatisfied with our virtual banking solutions. If the software of such third-party providers have performance or other problems, such issues may reflect poorly on us and the adoption and renewal of our virtual banking solutions and our business may be harmed. Although our customers may be able to switch to alternative technologies if a provider's services were unreliable or if a provider was to limit such customer's access and utilization of its data or the provider's functionality, our business could nevertheless be harmed due to the risk that our customers could reduce their use of our solutions.
Our customers are highly regulated and subject to a number of challenges and risks. Our failure to comply with laws and regulations applicable to us as a technology provider to financial institutions and to enable our RCFI customers to comply with the laws and regulations applicable to them could adversely affect our business and results of operations, increase costs and impose constraints on the way we conduct our business.
Our customers and prospective customers are highly regulated and may be required to comply with stringent regulations in connection with subscribing to and implementing our virtual banking solutions. As a provider of technology to RCFIs, we are examined on a periodic basis by various regulatory agencies and required to review certain of our suppliers and partners. The examination handbook and other guidance issued by the Federal Financial Institutions Examination Council govern the examination of our operations and include a review of our systems and data center and technical infrastructure, management, financial condition, development activities and our support and delivery capabilities. If deficiencies are identified, customers may choose to terminate or reduce their relationships with us. In addition, while much of our operations are not directly subject to the same regulations applicable to RCFIs, we are generally obligated to our customers to provide software solutions and maintain internal systems and processes that comply with federal and state regulations applicable to them. In particular, as a result of obligations under our customer agreements, we are required to comply with certain provisions of the Gramm-Leach-Bliley Act related to the privacy of consumer information and may be subject to other privacy and data security laws because of the solutions we provide to RCFIs. In addition, numerous regulations have been proposed and are still being written to implement the Dodd-Frank Wall Street Reform and Consumer Protection Act of 2010, including requirements for enhanced due diligence of the internal systems and processes of companies like ours by their financial institution customers. If we have to make changes to our internal processes and solutions as a result of this heightened scrutiny, we could be required to invest substantial additional time and funds and divert time and resources from other corporate purposes to remedy any identified deficiency.
This evolving, complex and often unpredictable regulatory environment could result in our failure to provide compliant solutions, which could result in customers' not purchasing our solutions or terminating their agreements with us or the imposition of fines or other liabilities for which we may be responsible. In addition, federal, state and/or foreign agencies may attempt to further regulate our activities in the future. For example, Congress could enact legislation to regulate providers of electronic commerce services as retail financial services providers or under another regulatory framework. If enacted or deemed applicable to us, such laws, rules or regulations could be imposed on our activities or our business thereby rendering our
18
business or operations more costly, burdensome, less efficient or impossible, any of which could have a material adverse effect on our business, financial condition and operating results.
If our or our customers' security measures are compromised or unauthorized access to customer data is otherwise obtained, our solutions may be perceived as not being secure, customers may curtail or cease their use of our solutions, our reputation may be harmed, and we may incur significant liabilities.
Our operations involve access to and transmission of proprietary information and data and transaction details of our customers and their account holders. Our security measures and the security measures of our customers may not be sufficient to prevent our systems from being compromised. Security incidents could result in unauthorized access to, loss of or unauthorized disclosure of this information, litigation, indemnity obligations and other possible liabilities, as well as negative publicity, which could damage our reputation, impair our sales and harm our business. Cyber-attacks, account take-over attacks, fraudulent representations and other malicious Internet-based activity continue to increase and financial institutions, their account holders and virtual banking providers are often targets of such attacks. In addition, third parties may attempt to fraudulently induce employees or customers into disclosing sensitive information such as user names, passwords or other information to gain access to our confidential or proprietary information or the data of our customers and their account holders. A party who is able to compromise the security of our facilities could cause interruptions or malfunctions in our operations. If security measures are compromised as a result of third-party action, the error or intentional misconduct of employees, customers or their account holders, malfeasance or stolen or fraudulently obtained log-in credentials, our reputation could be damaged, our business may be harmed and we could incur significant liability. We may be unable to anticipate or prevent techniques used to obtain unauthorized access or sabotage systems because they change frequently and generally are not detected until after an incident has occurred. As we increase our customer base and our brand becomes more widely known and recognized, we may become more of a target for third parties seeking to compromise our security systems or gain unauthorized access to the data of our customers and their account holders. A failure or inability to meet our customers' expectations with respect to security and confidentiality could seriously damage our reputation and affect our ability to retain customers and attract new business.
Federal and state regulations may require us to notify individuals of data security incidents involving certain types of personal data. Security compromises experienced by our competitors, by our customers or by us may lead to public disclosures and widespread negative publicity. Any security compromise in our industry, whether actual or perceived, could erode customer confidence in the effectiveness of our security measures, negatively impact our ability to attract new customers, cause existing customers to elect not to renew their subscriptions or subject us to third-party lawsuits, regulatory fines or other action or liability, which could materially and adversely affect our business and operating results.
In addition, some of our customers contractually require notification of any data security compromise and include representations and warranties that our solutions comply with certain regulations related to data security and privacy. Although our customer agreements typically include limitations on our potential liability, there can be no assurance that such limitations of liability would be enforceable or adequate or would otherwise protect us from any such liabilities or damages with respect to any particular claim. We also cannot be sure that our existing general liability insurance coverage and coverage for errors or omissions will continue to be available on acceptable terms or will be available in sufficient amounts to cover one or more claims, or that our insurers will not deny or attempt to deny coverage as to any future claim. The successful assertion of one or more claims against us, the inadequacy of or denial of coverage under our insurance policies, litigation to pursue claims under our policies or the occurrence of changes in our insurance policies, including premium increases or the imposition of large deductible or co-insurance requirements, could have a material adverse effect on our business, financial condition and results of operations.
19
We may experience quarterly fluctuations in our operating results due to a number of factors, which makes our future results difficult to predict and could cause our operating results to fall below expectations or our guidance.
Our quarterly operating results have fluctuated in the past and are expected to fluctuate in the future due to a variety of factors, many of which are outside of our control. As a result, comparing our operating results on a period-to-period basis may not be meaningful. Our past results may not be indicative of our future performance. In addition to the other risks described in this report, factors that may affect our quarterly operating results include the following:
• | the addition or loss of customers, including through acquisitions, consolidations or failures; |
• | the amount of use of our solutions in a period and the amount of any associated revenues and expenses; |
• | budgeting cycles of our customers and changes in spending on virtual banking solutions by our current or prospective customers; |
• | seasonal variations in sales of our solutions, which may be lowest in the first quarter of the calendar year; |
• | changes in the competitive dynamics of our industry, including consolidation among competitors, changes to pricing or the introduction of new products and services that limit demand for our virtual banking solutions or cause customers to delay purchasing decisions; |
• | the amount and timing of cash collections from our customers; |
• | long or delayed implementation times for new customers, including larger customers, or other changes in the levels of customer support we provide; |
• | the timing of customer payments and payment defaults by customers, including any buyouts by customers of the remaining term of their contracts with us in a lump sum payment that we would have otherwise recognized over the term of those contracts; |
• | the amount and timing of our operating costs and capital expenditures; |
• | changes in tax rules or the impact of new accounting pronouncements; |
• | general economic conditions that may adversely affect our customers' ability or willingness to purchase solutions, delay a prospective customer's purchasing decision, reduce our revenues from customers or affect renewal rates; |
• | unexpected expenses such as those related to litigation or other disputes; |
• | the timing of stock awards to employees and related adverse financial statement impact of having to expense those stock awards over their vesting schedules; and |
• | the amount and timing of costs associated with recruiting, hiring, training and integrating new employees, many of whom we hire in advance of anticipated needs. |
Moreover, our stock price might be based on expectations of investors or securities analysts of future performance that are inconsistent with our actual growth opportunities or that we might fail to meet and, if our revenues or operating results fall below expectations, the price of our common stock could decline substantially.
We have a history of losses, and we do not expect to be profitable for the foreseeable future.
We have incurred losses from operations in each period since our inception in 2005, except for 2010 when we recognized a gain on the sale of a subsidiary. We incurred net losses of $19.6 million, $17.9 million, and $8.8 million for the years ended December 31, 2014, 2013, and 2012, respectively. As of December 31, 2014, we had an accumulated deficit of $64.4 million. These losses and accumulated deficit reflect the substantial investments we have made to develop our solutions and acquire customers. As we seek to continue to grow our number of customers, we expect to incur significant sales, marketing, implementation and other related expenses. Our ability to achieve or sustain profitability will depend on our obtaining sufficient scale and productivity so that the cost of adding and supporting new customers does not adversely impact our margins. We also expect to make other significant expenditures to develop and expand our solutions and our business, including continuing to
20
increase our marketing, services and sales operations and continuing our significant investment in research and development and our technical infrastructure. We expect to incur losses for the foreseeable future as we continue to focus on adding new customers, and we cannot predict whether or when we will achieve or sustain profitability. Our efforts to grow our business may be more costly than we expect, and we may not be able to increase our revenues enough to offset our higher operating expenses. In addition, as a public company, we incur significant legal, accounting and other expenses that we did not incur as a private company. These increased expenditures will make it harder for us to achieve and maintain profitability. While our revenues have grown in recent periods, it may not be sustainable, and our revenues could decline or grow more slowly than we expect. We also may incur additional losses in the future for a number of reasons, including due to litigation and other unforeseen reasons and the risks described in this report. Accordingly, we cannot assure you that we will achieve profitability in the future, nor that, if we do become profitable, we will be able to sustain profitability. If we are unable to achieve and sustain profitability, our customers may lose confidence in us and slow or cease their purchases of our solutions and we may be unable to attract new customers, which would adversely impact our operating results.
Our sales cycle can be unpredictable, time-consuming and costly, which could harm our business and operating results.
Our sales process involves educating prospective customers and existing customers about the use, technical capabilities and benefits of our solutions. Prospective customers, especially larger financial institutions, often undertake a prolonged evaluation process, which typically involves not only our solutions, but also those of our competitors and lasts from six to nine months or longer. We may spend substantial time, effort and money on our sales and marketing efforts without any assurance that our efforts will produce any sales. It is also difficult to predict the level and timing of sales opportunities that come from our referral partners.
Events affecting our customers' businesses may occur during the sales cycle that could affect the size or timing of a purchase, contributing to more unpredictability in our business and operating results. As a result of these factors, we may face greater costs, longer sales cycles and less predictability in the future.
We do not have an adequate history with our subscription or pricing models to accurately predict the long-term rate of customer subscription renewals or adoption, or the impact these renewals and adoption will have on our revenues or operating results.
We have limited experience with respect to determining the optimal prices for our solutions. As the markets for our existing solutions develop, we may be unable to attract new customers at the same price or based on the same pricing model as we have used historically. Moreover, large or influential RCFIs may demand more favorable pricing or other contract terms. As a result, in the future we may be required to reduce our prices or accept other unfavorable contract terms, each of which could adversely affect our revenues, gross margin, profitability, financial position and cash flow.
Our customers have no obligation to renew their subscriptions for our solutions after the expiration of the initial subscription term, and our customers may renew for fewer solutions or on different pricing terms, if at all. Since the average initial term of our customer agreements is over five years and we only began selling our solutions in 2005, we have limited historical data with respect to rates of customer subscription renewals, so we cannot be certain of our pricing model for renewals or the accuracy of our anticipated renewal rates. Our renewal rates may decline or fluctuate as a result of a number of factors, including our customers' satisfaction with our pricing or our solutions or their ability to continue their operations and spending levels. If our customers do not renew their subscriptions for our solutions on similar pricing terms, our revenues may decline and our business could suffer. As we create new solutions or enhance our existing solutions to support new technologies and devices, our pricing of these solutions and related services may be unattractive to customers or fail to cover our costs.
Defects or errors in our virtual banking solutions could harm our reputation, result in significant costs to us, impair our ability to sell our solutions and subject us to substantial liability.
Our virtual banking solutions are inherently complex and may contain defects or errors, particularly when first introduced or as new versions are released. Despite extensive testing, from time-to-time we have discovered defects or errors in our solutions. In addition, due to changes in regulatory requirements relating to our customers or to technology providers to financial institutions like us, we may discover deficiencies in our software processes related to those requirements. Material performance problems or defects in our solutions might arise in the future.
Any such errors, defects, other performance problems or disruptions in service to provide bug fixes or upgrades, whether in connection with day-to-day operations or otherwise, could be costly for us to remedy, damage our customers' businesses and harm our reputation. In addition, if we have any such errors, defects or other performance problems, our customers could seek
21
to terminate their agreements, elect not to renew their subscriptions, delay or withhold payment or make claims against us. Any of these actions could result in lost business, increased insurance costs, difficulty in collecting our accounts receivable, costly litigation and adverse publicity. Such errors, defects or other problems could also result in reduced sales or a loss of, or delay in, the market acceptance of our solutions.
Moreover, software development is time-consuming, expensive, complex and requires regular maintenance. Unforeseen difficulties can arise. If we do not complete our periodic maintenance according to schedule or if customers are otherwise dissatisfied with the frequency and/or duration of our maintenance services, customers could elect not to renew, or delay or withhold payment to us or cause us to issue credits, make refunds or pay penalties. Because our solutions are often customized and deployed on a customer-by-customer basis, rather than through a multi-tenant SaaS method of distribution, applying bug fixes, upgrades or other maintenance services may require updating each instance of our software, which could be time consuming and cause us to incur significant expense. We might also encounter technical obstacles, and it is possible that we discover problems that prevent our solutions from operating properly. If our solutions do not function reliably or fail to achieve customer expectations in terms of performance, customers could seek to cancel their agreements with us and assert liability claims against us, which could damage our reputation, impair our ability to attract or maintain customers and harm our results of operations.
Failures or reduced accessibility of third-party hardware and software on which we rely could impair the delivery of our solutions and adversely affect our business.
We rely on hardware that we purchase or lease and software that we develop or license from, or that is hosted by third parties, to offer our virtual banking solutions. In addition, we obtain licenses from third parties to use intellectual property associated with the development of our solutions. These licenses might not continue to be available to us on acceptable terms, or at all. While we are not substantially dependent upon any third party hardware or software, the loss of the right to use all or a significant portion of our third party hardware or software required for the development, maintenance and delivery of our solutions could result in delays in the provision of our solutions until we develop or identify, obtain and integrate equivalent technology, which could harm our business.
Any errors or defects in the hardware or software we use could result in errors, interruptions or a failure of our solutions. Although we believe that there are alternatives, any significant interruption in the availability of all or a significant portion of such hardware or software could have an adverse impact on our business unless and until we can replace the functionality provided by these products at a similar cost. Furthermore, this hardware and software may not be available on commercially reasonable terms, or at all. The loss of the right to use all or a significant portion of this hardware or software could limit access to our solutions. Additionally, we rely upon third parties' abilities to enhance their current products, develop new products on a timely and cost-effective basis and respond to emerging industry standards and other technological changes. We may be unable to effect changes to such third-party technologies, which may prevent us from rapidly responding to evolving customer requirements. We also may be unable to replace the functionality provided by the third-party software currently offered in conjunction with our solutions in the event that such software becomes obsolete or incompatible with future versions of our solutions or is otherwise not adequately maintained or updated.
We depend on data centers operated by third parties and third-party Internet hosting providers, and any disruption in the operation of these facilities or access to the Internet could adversely affect our business.
We currently serve our customers from two third-party data center hosting facilities located in Austin, Texas and Carrollton, Texas. The owners and operators of these current and future facilities do not guarantee that our customers' access to our solutions will be uninterrupted, error-free or secure. We may experience website disruptions, outages and other performance problems, including problems resulting from our anticipated data center migration. These problems may be caused by a variety of factors, including infrastructure changes, human or software errors, viruses, security attacks, fraud, spikes in customer usage and denial of service issues. In some instances, we may not be able to identify the cause or causes of these performance problems within an acceptable period of time. We do not control the operation of these data center facilities, and such facilities are vulnerable to damage or interruption from human error, intentional bad acts, power loss, hardware failures, telecommunications failures, fires, wars, terrorist attacks, floods, earthquakes, hurricanes, tornadoes or similar catastrophic events. They also could be subject to break-ins, computer viruses, sabotage, intentional acts of vandalism and other misconduct. The occurrence of a natural disaster or an act of terrorism, a decision to close the facilities without adequate notice or terminate our hosting arrangement or other unanticipated problems could result in lengthy interruptions in the delivery of our solutions, cause system interruptions, prevent our customers' account holders from accessing their accounts online, reputational harm and loss of critical data, prevent us from supporting our solutions or cause us to incur additional expense in arranging for new facilities and support.
22
We also depend on third-party Internet-hosting providers and continuous and uninterrupted access to the Internet through third-party bandwidth providers to operate our business. If we lose the services of one or more of our Internet-hosting or bandwidth providers for any reason or if their services are disrupted, for example due to viruses or denial of service or other attacks on their systems, or due to human error, intentional bad acts, power loss, hardware failures, telecommunications failures, fires, wars, terrorist attacks, floods, earthquakes, hurricanes, tornadoes or similar catastrophic events, we could experience disruption in our ability to offer our solutions and adverse perception of our solutions' reliability, or we could be required to retain the services of replacement providers, which could increase our operating costs and harm our business and reputation.
We derive all of our revenues from customers in the financial services industry, and any downturn or consolidation in the financial services industry could harm our business.
All of our revenues are derived from RCFIs. RCFIs have experienced significant pressure in recent years due to economic uncertainty, liquidity concerns and increased regulation. In recent years, many RCFIs have failed, merged or been acquired. Failures and consolidations are likely to continue, and there are very few new RCFIs being created. Further, if our customers merge with or are acquired by other entities such as financial institutions that have in-house developed virtual banking solutions or that are not our customers or use fewer of our solutions, our customers may discontinue, reduce or change the terms of their use of our solutions. It is also possible that the larger RCFIs that result from mergers or consolidations could have greater leverage in negotiating terms with us or could decide to replace some or all of our solutions. In addition, any downturn in the financial services industry may cause our customers to reduce their spending on virtual banking solutions or to seek to terminate or renegotiate their contracts with us. Any of these developments could have an adverse effect on our business, results of operations and financial condition.
Because we recognize revenues from our virtual banking solutions over the terms of our customer agreements, the impact of changes in the subscriptions for our solutions will not be immediately reflected in our operating results, and rapid growth in our customer base may adversely affect our operating results in the short term since we expense a substantial portion of implementation costs as incurred.
We generally recognize revenues monthly over the terms of our customer agreements. The initial term of our customer agreements averages over five years, although it varies by customer. As a result, the substantial majority of the revenues we report in each quarter are related to agreements entered into during previous quarters. Consequently, a change in the level of new customer agreements or implementations in any quarter may have a small impact on our revenues in that quarter but will affect our revenues in future quarters. Accordingly, the effect of significant downturns in sales and market acceptance of our solutions, or changes in our rate of renewals may not be fully reflected in our results of operations until future periods. Our subscription model also makes it difficult for us to rapidly increase our revenues through additional sales in any period.
Additionally, we recognize our expenses over varying periods based on the nature of the expense. In particular, we recognize a portion of implementation expenses as incurred even though we recognize the related revenues over extended periods. As a result, we may report poor operating results in periods in which we are incurring higher implementation expenses related to revenues that we will recognize in future periods, including implementations for larger customers that have heightened levels of complexity in their hardware, software and network infrastructure needs. Alternatively, we may report better operating results in periods due to lower implementation expenses, but such lower expenses may be indicative of slower revenue growth in future periods. As a result, our expenses may fluctuate as a percentage of revenues and changes in our business generally may not be immediately reflected in our results of operations.
As the number, size and complexity of customers that we serve increase, we may encounter implementation challenges, and we may have to delay revenue recognition for some complex engagements, which would harm our business and operating results.
We may face unexpected implementation challenges related to the complexity of our customers' implementation and integration requirements, particularly implementations for larger customers that have heightened levels of complexity in their hardware, software and network infrastructure needs. Our implementation expenses increase when customers have unexpected data, hardware or software technology challenges, or complex or unanticipated business requirements. In addition, our customers typically require complex acceptance testing related to the implementation of our solutions. Implementation delays may also require us to delay revenue recognition under the related customer agreement longer than expected. Further, because we do not fully control our customers' implementation schedules, if our customers do not allocate the internal resources necessary to meet implementation timelines or if there are unanticipated implementation delays or difficulties, our revenue recognition may be delayed. Losses of registered users or any difficulties or delays in implementation processes could cause
23
customers to delay or forgo future purchases of our solutions, which would adversely affect our business, operating results and financial condition.
Shifts over time in the number of account holders and registered users of our solutions, their use of our solutions and our customers' implementation and customer support needs could negatively affect our profit margins.
Our profit margins can vary depending on numerous factors, including the scope and complexity of our implementation efforts, the number of account holders and registered users on our solutions, the frequency and volume of their use of our solutions and the level of customer support services required by our customers. For example, our services offerings typically have a much higher cost of revenues than subscriptions to our solutions, so any increase in sales of services as a proportion of our subscriptions would have an adverse effect on our overall gross margin and operating results. If we are unable to increase the number of registered users and the number of transactions they perform on our solutions, the types of RCFIs that purchase our solutions changes, or the mix of solutions purchased by our customers changes, our profit margins could decrease and our operating results could be adversely affected.
If we fail to provide effective customer training on our virtual banking solutions and high-quality customer support, our business and reputation would suffer.
Effective customer training on our virtual banking solutions and high-quality, ongoing customer support are important to the successful marketing and sale of our solutions and for the renewal of existing customer agreements. Providing this training and support requires that our customer training and support personnel have financial services knowledge and expertise, making it difficult for us to hire qualified personnel and scale our training and support operations. The demand on our customer support organization will increase as we expand our business and pursue new customers, and such increased support could require us to devote significant development services and support personnel, which could strain our team and infrastructure and reduce our profit margins. If we do not help our customers quickly resolve any post-implementation issues and provide effective ongoing customer support, our ability to sell additional solutions to existing and future customers could suffer and our reputation would be harmed.
If we fail to respond to evolving technological requirements or introduce adequate enhancements and new features, our virtual banking solutions could become obsolete or less competitive.
The market for our solutions is characterized by rapid technological advancements, changes in customer requirements and technologies, frequent new product introductions and enhancements and changing regulatory requirements. The life cycles of our solutions are difficult to estimate. Rapid technological changes and the introduction of new products and enhancements by new or existing competitors or large financial institutions could undermine our current market position. Other means of digital or virtual banking may be developed or adopted in the future, and our solutions may not be compatible with these new technologies. In addition, the technological needs of, and services provided by, RCFIs may change if they or their competitors offer new services to account holders. Maintaining adequate research and development resources to meet the demands of the market is essential. The process of developing new technologies and solutions is complex and expensive. The introduction of new solutions by our competitors, the market acceptance of competitive solutions based on new or alternative technologies or the emergence of new technologies or solutions in the broader financial services industry could render our solutions obsolete or less effective.
The success of any enhanced or new solution depends on several factors, including timely completion, adequate testing and market release and acceptance of the solution. Any new solutions that we develop or acquire may not be introduced in a timely or cost-effective manner, may contain defects or may not achieve the broad market acceptance necessary to generate significant revenues. If we are unable to anticipate customer requirements or work with our customers successfully on implementing new solutions or features in a timely manner or enhance our existing solutions to meet our customers' requirements, our business and operating results may be adversely affected.
If we fail to effectively expand our sales and marketing capabilities and teams, including through partner relationships, we may not be able to increase our customer base and achieve broader market acceptance of our solutions.
Increasing our customer base and achieving broader market acceptance of our virtual banking solutions will depend on our ability to expand our sales and marketing organizations and their abilities to obtain new customers and sell additional solutions and services to existing customers. We believe there is significant competition for direct sales professionals with the skills and knowledge that we require, and we may be unable to hire or retain sufficient numbers of qualified individuals in the future. Our ability to achieve significant future revenue growth will depend on our success in recruiting, training and retaining a sufficient number of direct sales professionals. New hires require significant training and time before they become fully
24
productive and may not become as productive as quickly as we anticipate. As a result, the cost of hiring and carrying new representatives cannot be offset by the revenues they produce for a significant period of time. Our growth prospects will be harmed if our efforts to expand, train and retain our direct sales team do not generate a corresponding significant increase in revenues. Additionally, if we fail to sufficiently invest in our marketing programs or they are unsuccessful in creating market awareness of our company and solutions, our business may be harmed and our sales opportunities limited.
In addition to our direct sales team, we also extend our sales distribution through formal and informal relationships with referral partners. While we are not substantially dependent upon referrals from any partner, our ability to achieve significant revenue growth in the future will depend upon continued referrals from our partners and growth of the network of our referral partners. These partners are under no contractual obligation to continue to refer business to us, nor do these partners have exclusive relationships with us and may choose to instead refer potential customers to our competitors. We cannot be certain that these partners will prioritize or provide adequate resources for promoting our solutions or that we will be successful in maintaining, expanding or developing our relationships with referral partners. Our competitors may be effective in providing incentives to third parties, including our partners, to favor their solutions or prevent or reduce subscriptions to our solutions either by disrupting our relationship with existing customers or limiting our ability to win new customers. Establishing and retaining qualified partners and training them with respect to our solutions requires significant time and resources. If we are unable to devote sufficient time and resources to establish and train these partners, or if we are unable to maintain successful relationships with them, we may lose sales opportunities and our revenues could suffer.
We rely on our management team and other key employees, and the loss of one or more key employees could harm our business.
Our success and future growth depend upon the continued services of our management team, in particular our Chief Executive Officer, and other key employees, including in the areas of research and development, marketing, sales, services and general and administrative functions. From time to time, there may be changes in our management team resulting from the hiring or departure of executives, which could disrupt our business. We also are dependent on the continued service of our existing development professionals because of the complexity of our solutions, including complexity arising as a result of the regulatory requirements that are applicable to our customers and the pace of technology changes impacting our customers and their account holders. We may terminate any employee's employment at any time, with or without cause, and any employee may resign at any time, with or without cause; however, our employment agreements with our named executive officers provide for the payment of severance under certain circumstances. We have also entered into employment agreements with our other executive officers which provide for the payment of severance under similar circumstances as in our named executive officers' employment agreements. The loss of one or more of our key employees could harm our business.
Because competition for key employees is intense, we may not be able to attract and retain the highly-skilled employees we need to support our operations and future growth.
Competition for executive officers, software developers and other key employees in our industry is intense. In particular, we compete with many other companies for executive officers, for software developers with high levels of experience in designing, developing and managing software, as well as for skilled sales and operations professionals and knowledgeable customer support professionals, and we may not be successful in attracting the professionals we need. Our research and development organization is principally located in Austin, Texas, where competition for software development and engineering personnel is intense. We may have difficulty hiring and retaining suitably skilled personnel or expanding our research and development organization. In addition, job candidates and existing employees often consider the actual and potential value of the equity awards they receive as part of their overall compensation. Thus, if the perceived value or future value of our stock declines, our ability to attract and retain highly skilled employees may be adversely affected. In addition many of our existing employees may exercise vested options or vest in outstanding restricted stock units and sell our stock, which may make it more difficult for us to retain key employees. If we fail to attract and retain new employees, our business and future growth prospects could be harmed.
Our failure to comply with laws and regulations related to the Internet and mobile usage could adversely affect our business and results of operations, increase costs and impose constraints on the way we conduct our business.
We and our customers are subject to laws and regulations applicable to doing business over the Internet and through the use of mobile devices. It is often not clear how existing laws governing issues such as property ownership, sales and other taxes apply to the Internet and mobile usage, as these laws have in some cases failed to keep pace with technological change. Laws governing the Internet could also impact our business or the business of our customers. For instance, existing and future regulations on taxing Internet use, pricing, characterizing the types and quality of services and products or restricting the exchange of information over the Internet or mobile devices could result in reduced growth of our business, a general decline in
25
the use of the Internet by financial service institutions or their account holders, diminished viability of our solutions and could significantly restrict our customers' ability to use our solutions. Changing federal and state laws and regulations, industry standards and industry self-regulation regarding the collection, use and disclosure of certain data may have similar effects on our and our customers' businesses. Any such constraint on the growth in Internet and mobile usage could decrease its acceptance as a medium of communication and commerce or result in increased adoption of new modes of communication and commerce that may not be supported by our solutions. Any such adverse legal or regulatory developments could substantially harm our operating results and our business.
Legislation relating to consumer privacy may affect our ability to collect data that we use in providing our customers' account holder information, which, among other things, could negatively affect our ability to satisfy our customers' needs.
We collect and store personal and identifying information regarding our customer's account holders to enable certain functionality of our solutions and provide our customers with data about their account holders. The enactment of new or amended legislation or industry regulations pertaining to consumer or private sector privacy issues could have a material adverse impact on our collection, storage and sharing of such information. Legislation or industry regulations regarding consumer or private sector privacy issues could place restrictions upon the collection, sharing and use of information that is currently legally available, which could materially increase our cost of collecting some data. These types of legislation or industry regulations could also prohibit us from collecting or disseminating certain types of data, which could adversely affect our ability to meet our customers' requirements and our profitability and cash flow targets. While 47 states and the District of Columbia have enacted data breach notification laws, there is no such federal law generally applicable to our businesses. These legislative measures impose strict requirements on reporting time frames for providing notice, as well as the contents of such notices. The costs of compliance with, and other burdens imposed by, such laws and regulations may lead to significant fines, penalties or liabilities for any noncompliance with such privacy laws. Even the perception of privacy concerns, whether or not valid, may inhibit market adoption of our solutions.
In addition to government activity, privacy advocacy groups and the technology and other industries are considering various new, additional or different self-regulatory standards that may place additional burdens on us. If the collecting, storing and processing of personal information were to be curtailed, our solutions would be less effective, which may reduce demand for our solutions and adversely affect our business.
Any use of our virtual banking solutions by our customers in violation of regulatory requirements could damage our reputation and subject us to additional liability.
If our customers or their account holders use our virtual banking solutions in violation of regulatory requirements and applicable laws, we could suffer damage to our reputation and could become subject to claims. We rely on contractual obligations made to us by our customers that their use and their account holders' use of our solutions will comply with applicable laws. However, we do not audit our customers or their account holders to confirm compliance. We may become subject to or involved with claims for violations by our customers or their account holders of applicable laws in connection with their use of our solutions. Even if claims asserted against us do not result in liability, we may incur costs in investigating and defending against such claims. If we are found liable in connection with our customers' or their account holders' activities, we could incur liabilities and be required to redesign our solutions or otherwise expend resources to remedy any damages caused by such actions and to avoid future liability.
Any future litigation against us could be costly and time-consuming to defend.
We may become subject, from time to time, to legal proceedings and claims that arise in the ordinary course of business such as claims brought by our customers in connection with commercial disputes or employment claims made by our current or former employees. Litigation might result in substantial costs and may divert management's attention and resources, which might seriously harm our business, overall financial condition and operating results. Insurance might not cover such claims, might not provide sufficient payments to cover all the costs to resolve one or more such claims and might not continue to be available on terms acceptable to us. A claim brought against us that is uninsured or underinsured could result in unanticipated costs, thereby reducing our operating results and leading analysts or potential investors to reduce their expectations of our performance, which could reduce the trading price of our stock.
Lawsuits by third parties against us and our customers for alleged infringement of the third parties' proprietary rights or for other intellectual property related claims could results in significant expenses and harm our operating results.
Our industry is characterized by the existence of a large number of patents, copyrights, trademarks, trade secrets and other intellectual property and proprietary rights. Companies in our industry are often required to defend against litigation
26
claims based on allegations of infringement or other violations of intellectual property rights. Furthermore, our customer agreements typically require us to indemnify our customers against liabilities incurred in connection with claims alleging our solutions infringe the intellectual property rights of a third party. From time to time, we have been involved in disputes related to patent and other intellectual property rights of third parties, none of which have resulted in material liabilities. We expect these types of disputes to continue to arise in the future. Our business could be adversely affected by any significant disputes between us and our customers as to the applicability or scope of our indemnification obligations to them. There can be no assurances that any existing limitations of liability provisions in our contracts would be enforceable or adequate, or would otherwise protect us from any such liabilities or damages with respect to any particular claim. If such claims are successful, or if we are required to indemnify or defend our customers from these or other claims, these matters could be disruptive to our business and management and have an adverse effect on our business, operating results and financial condition.
Furthermore, our technologies may not be able to withstand any third-party claims or rights against their use. As a result, our success depends upon our not infringing upon the intellectual property rights of others. Our competitors, as well as a number of other entities and individuals, may own or claim to own intellectual property relating to our industry. We have a very limited patent portfolio, which will likely prevent us from deterring patent infringement claims, and our competitors and others may now and in the future have significantly larger patent portfolios than we have. From time to time, we have received and may continue to receive threatening letters or notices or in the future may be the subject of claims that our solutions and underlying technology infringe or violate the intellectual property rights of others, and we may be found to be infringing upon such rights. The risk of patent litigation has been amplified by the increase in the number of non-practicing patent asserting entities, or patent trolls. Any claims or litigation could cause us to incur significant expenses and, if successfully asserted against us or our customers whom we indemnify, could require that we pay substantial damages or ongoing royalty payments, prevent us from offering our solutions or require that we comply with other unfavorable terms. Even if the claims do not result in litigation or are resolved in our favor, these claims and the time and resources necessary to resolve them, could divert the resources of our management and harm our business and operating results.
The frequency of these types of claims may increase as we continue to add new customers and as a result of our being a public company.
If we are unable to protect our intellectual property, our business could be adversely affected.
Our success depends upon our ability to protect our intellectual property, which may require us to incur significant costs. We have developed much of our intellectual property internally, and we rely on a combination of confidentiality obligations in contracts, patents, copyrights, trademarks, service marks, trade secret laws and other contractual restrictions to establish and protect our intellectual property and other proprietary rights. In particular, we enter into confidentiality and invention assignment agreements with our employees and consultants and enter into confidentiality agreements with the parties with whom we have business relationships in which they will have access to our confidential information. We also rely upon licenses to intellectual property from third parties. No assurance can be given that these agreements or other steps we take to protect our intellectual property or the third party intellectual property used in our solutions will be effective in controlling access to and distribution of our solutions and our confidential and proprietary information. We will not be able to protect our intellectual property if we are unable to enforce our rights or if we do not detect unauthorized uses of our intellectual property.
Despite our precautions, it may be possible for third parties to copy our solutions and use information that we regard as proprietary to create solutions and services that compete with ours. Third parties may also independently develop technologies that are substantially equivalent to our solutions. Some license provisions protecting against unauthorized use, copying, transfer and disclosure of our solutions may be unenforceable under the laws of certain jurisdictions.
In some cases, litigation may be necessary to enforce our intellectual property rights or to protect our trade secrets. Litigation could be costly, time consuming and distracting to management and could result in the impairment or loss of portions of our intellectual property. Furthermore, our efforts to enforce our intellectual property rights may be met with defenses, counterclaims and countersuits attacking the validity and enforceability of our intellectual property rights and exposing us to significant damages or injunctions. Our inability to protect our intellectual property against unauthorized copying or use, as well as any costly litigation or diversion of our management's attention and resources, could delay sales or the implementation of our solutions, impair the functionality of our solutions, delay introductions of new solutions, result in our substituting less-advanced or more-costly technologies into our solutions or harm our reputation. In addition, we may be required to license additional intellectual property from third parties to develop and market new solutions, and we cannot assure you that we could license that intellectual property on commercially reasonable terms or at all.
27
We cannot be certain that any patents will be issued with respect to our current or future patent applications.
As of December 31, 2014, we had one U.S. patent application pending and two issued U.S. patents. We do not know whether our pending patent application will result in the issuance of a patent or whether the examination process will require us to narrow the scope of our claims. To the extent that our pending patent application or any portion of such application proceeds to issuance as a patent, any such future patent may be opposed, contested, circumvented, designed around by a third party or found to be invalid or unenforceable. In addition, our existing and any future issued patents may be opposed, contested, circumvented, designed around by a third party or found to be invalid or unenforceable. The process of seeking patent protection can be lengthy and expensive. We rely on a combination of patent, copyright, trade secret, trademark and other intellectual property laws to protect our intellectual property, and much of our technology is not covered by any patent or patent application.
We use "open source" software in our solutions, which may restrict how we use or distribute our solutions, require that we release the source code of certain software subject to open source licenses or subject us to litigation or other actions that could adversely affect our business.
We currently use in our solutions, and may use in the future, software that is licensed under "open source," "free" or other similar licenses where the licensed software is made available to the general public on an "as-is" basis under the terms of a specific non-negotiable license. Some open source software licenses require that software subject to the license be made available to the public and that any modifications or derivative works based on the open source code be licensed in source code form under the same open source licenses. Although we monitor our use of open source software, we cannot assure you that all open source software is reviewed prior to use in our solutions, that our programmers have not incorporated open source software into our solutions, or that they will not do so in the future. In addition, some of our products may incorporate third-party software under commercial licenses. We cannot be certain whether such third-party software incorporates open source software without our knowledge. In the past, companies that incorporate open source software into their products have faced claims alleging noncompliance with open source license terms or infringement or misappropriation of proprietary software. Therefore, we could be subject to suits by parties claiming noncompliance with open source licensing terms or infringement or misappropriation of proprietary software. Because few courts have interpreted open source licenses, the manner in which these licenses may be interpreted and enforced is subject to some uncertainty. There is a risk that open source software licenses could be construed in a manner that imposes unanticipated conditions or restrictions on our ability to market or provide our solutions. As a result of using open source software subject to such licenses, we could be required to release our proprietary source code, pay damages, re-engineer our products, limit or discontinue sales or take other remedial action, any of which could adversely affect our business.
The market data and forecasts included in this report may prove to be inaccurate, and even if the markets in which we compete achieve the forecasted growth, we cannot assure you that our business will grow at similar rates, or at all.
The market data and forecasts included in this report, including the data and forecasts published by BauerFinancial, Celent, Forrester, Gartner, International Data Corporation, Javelin Strategy & Research and Verizon, among others, and our internal estimates and research are subject to significant uncertainty and are based on assumptions and estimates that may not prove to be accurate. If the forecasts of market growth or anticipated spending prove to be inaccurate, our business and growth prospects could be adversely affected. Even if the forecasted growth occurs, our business may not grow at a similar rate, or at all. Our future growth is subject to many factors, including our ability to successfully implement our business strategy, which itself is subject to many risks and uncertainties. The reports described in this report speak as of their respective publication dates and the opinions expressed in such reports are subject to change. Accordingly, potential investors in our common stock are urged not to put undue reliance on such forecasts and market data.
Uncertain or weakened economic conditions may adversely affect our industry, business and results of operations.
Our overall performance depends on economic conditions, which may remain challenging or uncertain for the foreseeable future. Financial developments seemingly unrelated to us or our industry may adversely affect us. Domestic and international economies have been impacted by threatened sovereign defaults and ratings downgrades, falling demand for a variety of goods and services, restricted credit, threats to major multinational companies, poor liquidity, reduced corporate profitability, volatility in credit, equity and foreign exchange markets, bankruptcies and overall uncertainty. These conditions affect the rate of technology spending and could adversely affect our customers' ability or willingness to purchase our virtual banking solutions, delay prospective customers' purchasing decisions, reduce the value or duration of their subscriptions or affect renewal rates, any of which could adversely affect our operating results. We cannot predict the timing, strength or duration of the economic recovery or any subsequent economic slowdown in the U.S. or in our industry.
28
We may not be able to utilize a significant portion of our net operating loss carryforwards, which could adversely affect our operating results and cash flows.
As of December 31, 2014, we had approximately $69.9 million of U.S. federal net operating loss carryforwards. Utilization of these net operating loss carryforwards depends on many factors, including our future income, which cannot be assured. Our loss carryforwards begin to expire in 2027. In addition, Section 382 of the Internal Revenue Code generally imposes an annual limitation on the amount of net operating loss carryforwards that may be used to offset taxable income when a corporation has undergone an ownership change. An ownership change is generally defined as a greater than 50% change in equity ownership by value over a 3-year period. We have undergone one or more ownership changes as a result of prior financings, and may have undergone an ownership change as a result of our initial public offering on March 20, 2014, or IPO, and any such change in ownership and the corresponding annual limitation may prevent us from using our current net operating losses prior to their expiration. Future ownership changes or future regulatory changes could further limit our ability to utilize our net operating loss carryforwards. To the extent we are not be able to offset our future income against our net operating loss carryforwards, this would adversely affect our operating results and cash flows if we attain profitability.
Our business may be subject to additional obligations to collect and remit sales tax and other taxes, and we may be subject to tax liability for past sales. Any successful action by state, local or other authorities to collect additional or past sales tax could adversely harm our business.
We file sales tax returns in certain states within the U.S. as required by law and certain customer contracts for a portion of the solutions that we provide. Our sales tax liabilities with respect to sales and use taxes in various states and local jurisdictions were $0.2 million as of December 31, 2014. From time to time we face sales tax audits, and we will likely continue to do so in the future, and our liability for these taxes could exceed our estimates as state tax authorities could still assert that we are obligated to collect additional amounts as taxes from our customers and remit those taxes to those authorities.
We do not collect sales or other similar taxes in other states and many of the states do not apply sales or similar taxes to certain of our solutions. State and local taxing jurisdictions have differing rules and regulations governing sales and use taxes, and these rules and regulations are subject to varying interpretations that may change over time. In particular, the applicability of sales taxes to our virtual banking solutions in various jurisdictions is unclear. We review these rules and regulations periodically and, when we believe we are subject to sales and use taxes in a particular state, we may voluntarily engage state tax authorities to determine how to comply with their rules and regulations. A successful assertion by one or more states, including states for which we have not accrued tax liability, requiring us to collect sales or other taxes with respect to sales of our solutions or customer support could result in substantial tax liabilities for past transactions, including interest and penalties, discourage customers from purchasing our solutions or otherwise harm our business and operating results.
Changes in financial accounting standards or practices may cause adverse, unexpected financial reporting fluctuations and affect our reported results of operations.
Financial accounting standards may change or their interpretation may change. A change in accounting standards or practices can have a significant effect on our reported results and may even affect our reporting of transactions completed before the change becomes effective. Changes to existing rules or the re-examining of current practices may adversely affect our reported financial results or the way we conduct our business. Accounting for revenues from sales of our solutions is particularly complex, is often the subject of intense scrutiny by the Securities and Exchange Commission, or SEC, and will evolve as the Financial Accounting Standards Board, or FASB, continues to consider applicable accounting standards in this area.
We may acquire or invest in companies, or pursue business partnerships, which may divert our management's attention, result in ownership dilution to our stockholders, and we may be unable to integrate acquired businesses and technologies successfully or achieve the expected benefits of such acquisitions or investments.
We may evaluate and consider potential strategic transactions, including acquisitions of, or investments in, businesses, technologies, services, products and other assets in the future. We also may enter into relationships with other businesses to expand our solutions, which could involve preferred or exclusive licenses, additional channels of distribution, discount pricing or investments in other companies. Negotiating these transactions can be time-consuming, difficult and expensive, and our ability to close these transactions may be subject to approvals that are beyond our control. In addition, we have limited experience in acquiring other businesses. We may not be able to find and identify desirable acquisition targets, we may incorrectly estimate the value of an acquisition target, and we may not be successful in entering into an agreement with any particular target. Consequently, these transactions, even if undertaken and announced, may not close.
29
If we acquire additional businesses, we may not achieve the anticipated benefits from the acquired business due to a number of factors, including:
• | our inability to integrate or benefit from acquired technologies or services; |
• | unanticipated costs or liabilities associated with the acquisition; |
• | incurrence of acquisition-related costs; |
• | difficulty integrating the accounting systems, operations and personnel of the acquired business; |
• | difficulties and additional expenses associated with supporting legacy solutions and hosting infrastructure of the acquired business; |
• | difficulty converting the customers of the acquired business to our solutions and contract terms, including disparities in the revenues, licensing, support or professional services model of the acquired company; |
• | diversion of management's attention from other business concerns; |
• | adverse effects to our existing business relationships with business partners and customers as a result of the acquisition; |
• | use of resources that are needed in other parts of our business; |
• | the issuance of additional equity securities that would dilute the ownership interests of our stockholders; |
• | the use of a substantial portion of our cash that we may need to operate our business; |
• | incurrence of debt on terms unfavorable to us or that we are unable to repay; |
• | incurrence of large charges or substantial liabilities; |
• | difficulties retaining key employees of the acquired company or integrating diverse software codes or business culture; and |
• | become subject to adverse tax consequences, substantial depreciation or deferred compensation charges. |
In addition, a significant portion of the purchase price of companies we acquire may be allocated to acquired goodwill and other intangible assets, which must be assessed for impairment at least annually. In the future, if our acquisitions do not yield expected returns, we may be required to take charges to our operating results based on this impairment assessment process, which could adversely affect our results of operations.
We may not be able to secure sufficient additional financing on favorable terms, or at all, to meet our future capital needs.
We may require additional capital in the future to pursue business opportunities or acquisitions or respond to challenges and unforeseen circumstances. We may also decide to engage in equity or debt financings or enter into credit facilities for other reasons. We may not be able to secure additional debt or equity financing in a timely manner, on favorable terms, or at all. Any debt financing we obtain in the future could involve restrictive covenants relating to our capital raising activities and other financial and operational matters, which may make it more difficult for us to obtain additional capital and pursue business opportunities, including potential acquisitions.
Risks Related to Ownership of Our Common Stock
Our stock price could decline due to the large number of outstanding shares of our common stock eligible for future sale.
Sales of substantial amounts of our common stock in the public market following our IPO or the perception that these sales could occur, could cause the market price of our common stock to decline. These sales could also make it more difficult for us to sell equity or equity-related securities in the future at a time and price that we deem appropriate. We have 34,937,128
30
shares of common stock outstanding as of January 31, 2015, excluding shares issuable upon the exercise of our outstanding stock options or vesting of restricted stock units and shares otherwise issuable pursuant to our stock plans. The shares sold in the IPO were immediately tradable without restriction, except for any shares purchased by our affiliates as defined in Rule 144 of the Securities Act or by immediate family members of our directors and officers in the directed share program. Shares beneficially owned by our affiliates and employees are subject to volume and other restrictions under Rules 144 and 701 under the Securities Act of 1933, as amended, or the Securities Act, various vesting agreements, our insider trading policy and any applicable 10b5-1 trading plan.
On May 15, 2014, we registered 8,960,341 shares of our common stock that we have issued or may issue under our stock plans. These shares can be freely sold in the public market upon issuance, subject in some cases to volume and other restrictions under Rules 144 and 701 under the Securities Act, and various vesting agreements and trading windows under our insider trading policy. In addition, some of our employees, including some of our named executive officers, have entered into 10b5-1 trading plans regarding sales of shares of our common stock. If any of these additional shares are sold, or if it is perceived that they will be sold, in the public market, the trading price of our common stock could decline.
As of January 31, 2015, holders of approximately 41.7% of our common stock were entitled to rights with respect to the registration of their shares under the Securities Act. If we register their shares of common stock, these stockholders could sell those shares in the public market without being subject to the volume and other restrictions of Rule 144 and Rule 701.
In the future, we may issue securities in connection with investments and acquisitions. The amount of our common stock issued in connection with an investment or acquisition could constitute a material portion of our then outstanding stock. Due to these factors, sales of a substantial number of shares of our common stock in the public market could occur at any time. These sales, or the perception in the market that the holders of a large number of shares intend to sell shares, could reduce the market price of our common stock.
If securities or industry analysts publish unfavorable or misleading research about our business, or cease coverage of our company, our stock price and trading volume could decline.
The trading market for our common stock depends in part on the research and reports that securities or industry analysts publish about us or our business. If one or more of the securities or industry analysts who covers us downgrades our stock or publishes unfavorable or misleading research about our business, our stock price would likely decline. If one or more of these analysts ceases coverage of our company or fails to publish reports on us regularly, we could lose visibility in the market for our stock, and demand for our stock could decrease, which could cause our stock price or trading volume to decline.
We have incurred and will continue to incur significant increased expenses and administrative burdens as a public company, which could have a material adverse effect on our operations and financial results.
We face increased legal, accounting, administrative and other costs and expenses as a public company that we did not incur as a private company, prior to our IPO in March 2014. The Sarbanes-Oxley Act of 2002, or the Sarbanes-Oxley Act, including the requirements of Section 404, as well as rules and regulations subsequently implemented by the SEC, the Public Company Accounting Oversight Board and the New York Stock Exchange, impose additional reporting and other obligations on public companies. Compliance with public company requirements have and will increase our costs and make some activities more time-consuming. Since our IPO, we have created new board committees and have adopted new internal controls and disclosure controls and procedures. In addition, we have and will continue to incur additional expenses associated with our SEC reporting requirements. In connection with our IPO, we appointed a new chief financial officer and hired several finance and accounting personnel and such individuals have only worked for us for a limited period of time and have limited experience in managing public companies. Furthermore, if we identify any issues in complying with those requirements (for example, if our financial systems prove inadequate or we or our auditors identify deficiencies in our internal control over financial reporting), we could incur additional costs rectifying those issues, and the existence of those issues could adversely affect us, our reputation or investor perceptions of us. It is also more expensive to maintain director and officer liability insurance as a public company. Risks associated with our status as a public company may make it more difficult for us to attract and retain qualified persons to serve on our board of directors or as executive officers. The additional reporting and other obligations imposed on us by these rules and regulations have and we expect will continue to increase our legal and financial compliance costs and the costs of our related legal, accounting and administrative activities. These costs require us to divert a significant amount of money that we could otherwise use to expand our business and achieve our strategic objectives. Proposals submitted by stockholders at our annual meeting or other advocacy efforts by stockholders and third parties may also prompt additional changes in governance and reporting requirements, which could further increase our costs.
In addition, changing laws, regulations and standards relating to corporate governance and public disclosure are creating uncertainty for public companies, increasing legal and financial compliance costs and making some activities more time consuming. These laws, regulations and standards are subject to varying interpretations, in many cases due to their lack of
31
specificity, and, as a result, their application in practice may evolve over time as new guidance is provided by regulatory and governing bodies. This situation could result in continuing uncertainty regarding compliance matters and higher costs necessitated by ongoing revisions to disclosure and governance practices. We intend to invest resources to comply with evolving laws, regulations and standards, and this investment may result in increased general and administrative expenses and a diversion of management's time and attention from revenue-generating activities to compliance activities. If our efforts to comply with new laws, regulations and standards differ from the activities intended by regulatory or governing bodies due to ambiguities related to their application and practice, regulatory authorities may initiate investigations, inquiries, administrative proceedings or legal proceedings against us and our business may be adversely affected.
Insiders continue to have substantial control over us, which may limit our stockholders' ability to influence corporate matters and delay or prevent a third party from acquiring control over us.
As of January 31, 2015, our directors, executive officers and holders of more than 5% of our common stock, together with their affiliates, beneficially owned, in the aggregate, approximately 62.9% of our outstanding common stock. This significant concentration of ownership may adversely affect the trading price for our common stock because investors often perceive disadvantages in owning stock in companies with one or more large stockholders. In addition, these stockholders will be able to exercise significant influence over all matters requiring stockholder approval, including the election of directors and approval of corporate transactions, such as a merger or other sale of our company or its assets. This concentration of ownership could limit other stockholders' ability to influence corporate matters and may have the effect of delaying or preventing a change in control, including a merger, consolidation or other business combination involving us, or discouraging a potential acquirer from making a tender offer or otherwise attempting to obtain control, even if that change in control would benefit our other stockholders.
Our management has broad discretion over the use of the proceeds we received in our IPO and might not apply those proceeds in ways that increase the value of our common stock.
Our management has broad discretion to use the net proceeds from our IPO. Our management might not apply the net proceeds of the IPO in ways that increase the value of our common stock. We used approximately $6.2 million of our net proceeds to repay outstanding indebtedness under our credit facility with Wells Fargo Bank, National Association, or Credit Facility, and expect to use the balance for general corporate purposes, including working capital and capital expenditures, which may in the future include investments in, or acquisitions of, complementary businesses, services or technologies. Our management might not be able to yield a significant return, if any, on any use of these net proceeds.
If we fail to maintain proper and effective internal controls, our ability to produce accurate and timely financial statements could be impaired, which could harm our operating results, our ability to operate our business and investors' views of us.
Ensuring that we have adequate internal financial and accounting controls and procedures in place so that we can produce accurate financial statements on a timely basis is a costly and time-consuming effort that needs to be re-evaluated frequently. Our internal control over financial reporting is a process designed to provide reasonable assurance regarding the reliability of financial reporting and preparation of financial statements in accordance with GAAP. We are in the process of documenting, reviewing and improving our internal controls and procedures for compliance with Section 404(a) of the Sarbanes-Oxley Act, which requires annual management assessment of the effectiveness of our internal control over financial reporting. If we fail to maintain proper and effective internal controls, our ability to produce accurate and timely financial statements could be impaired, which could harm our operating results, harm our ability to operate our business and reduce the trading price of our stock.
Our stock price may be volatile.
The trading price of our common stock has been and is expected to continue to be highly volatile and could be subject to wide fluctuations in response to various factors, including the risk factors described in this report, and other factors beyond our control. Factors affecting the trading price of our common stock include:
• | variations in our operating results or the operating results of similar companies; |
• | announcements of technological innovations, new solutions or enhancements or strategic partnerships or agreements by us or by our competitors; |
32
• | changes in the estimates of our operating results, our financial guidance or changes in recommendations by any securities analysts that follow our common stock; |
• | the gain or loss of customers, particularly our larger customers; |
• | adoption or modification of regulations, policies, procedures or programs applicable to our business and our customers' business; |
• | marketing and advertising initiatives by us or our competitors; |
• | threatened or actual litigation; |
• | changes in our senior management; |
• | recruitment or departure of key personnel; |
• | market conditions in our industry, the industries of our customers and the economy as a whole; |
• | the overall performance of the equity markets; |
• | sales of shares of our common stock by existing stockholders; |
• | volatility in our stock price, which may lead to higher stock-based compensation expenses under applicable accounting standards; and |
• | the market's reaction to our reduced disclosure as a result of being an emerging growth company under the JOBS Act. |
In addition, the stock market in general and the market for technology companies in particular, have experienced extreme price and volume fluctuations that have often been unrelated or disproportionate to the operating performance of those companies. Broad market and industry factors may harm the market price of our common stock regardless of our actual operating performance. Each of these factors, among others, could adversely affect your investment in our common stock. Some companies that have had volatile market prices for their securities have had securities class action lawsuits filed against them. If a suit were filed against us, regardless of its merits or outcome, it could result in substantial costs and divert management's attention.
We currently do not intend to pay dividends on our common stock, and, consequently, your only opportunity to achieve a return on your investment is if the price of our common stock appreciates.
We have never declared nor paid cash dividends on our capital stock. We currently do not plan to declare dividends on shares of our common stock in the foreseeable future. We currently intend to retain any future earnings to finance the operation and expansion of our business. Any payment of future dividends will be at the discretion of our board of directors, subject to compliance with certain covenants contained in our Credit Facility, which limit our ability to pay dividends, and will depend on our financial condition, results of operations, capital requirements, general business conditions and other factors that our board of directors may deem relevant. Consequently, your only opportunity to achieve a return on your investment in our company will be if the market price of our common stock appreciates and you sell your shares at a profit. There is no guarantee that the price of our common stock that will prevail in the market will ever exceed the price that you paid for your common stock.
As an "emerging growth company" under the JOBS Act, we are relying on permitted exemptions from certain disclosure requirements, which could make our common stock less attractive to investors.
As an "emerging growth company" under the JOBS Act, we are relying on permitted exemptions from certain disclosure requirements. In particular, we have not included all of the executive compensation related information that would be required in this report if we were not an emerging growth company. We are also only providing three years of selected financial data instead of the five years of selected financial data required for companies that do not qualify for emerging growth company status. In addition, for so long as we are an emerging growth company, we will not be required to:
• | have an auditor report on our internal control over financial reporting pursuant to Section 404(b) of the Sarbanes-Oxley Act; |
33
• | comply with any requirement that may be adopted by the Public Company Accounting Oversight Board regarding mandatory audit firm rotation or a supplement to the auditor's report providing additional information about the audit and the financial statements (auditor discussion and analysis); and |
• | submit certain executive compensation matters to stockholder advisory votes, such as "say on pay" and "say on frequency." |
Because of these exemptions and the other reduced disclosure obligations for emerging growth companies, our stock may appear less attractive to investors and could cause our stock price to decline.
Although we intend to rely on certain of the exemptions provided in the JOBS Act, the exact implications of the JOBS Act for us are still subject to interpretations and guidance by the SEC and other regulatory agencies. Also, as our business grows, we may no longer satisfy the conditions of an emerging growth company. We will remain an "emerging growth company" until the earliest of (i) the last day of the fiscal year during which we have total annual gross revenues of $1 billion or more; (ii) the last day of the fiscal year following the fifth anniversary of our IPO; (iii) the date on which we have, during the previous three-year period, issued more than $1 billion in non-convertible debt; and (iv) the date on which we are deemed to be a "large accelerated filer" under the Exchange Act. We will be deemed a large accelerated filer on the first day of the fiscal year after the market value of our common equity held by non-affiliates exceeds $700 million, measured on June 30. If investors find our common stock less attractive as a result of our reliance on certain of the JOBS Act exemptions, there may be a less active trading market for our common stock, and our stock price may be more volatile.
In addition, Section 107 of the JOBS Act also provides that an emerging growth company can take advantage of the extended transition period provided in Section 7(a)(2)(B) of the Securities Act for complying with new or revised accounting standards. In other words, an emerging growth company can delay the adoption of certain accounting standards until those standards would otherwise apply to private companies. However, we have chosen to "opt out" of such extended transition period, and as a result, we will comply with new or revised accounting standards on the relevant dates on which adoption of
such standards is required for non-emerging growth companies. Section 107 of the JOBS Act provides that our decision to opt out of the extended transition period for complying with new or revised accounting standards is irrevocable.
Anti-takeover provisions in our charter documents and Delaware law could discourage, delay or prevent a change in control of our company and may affect the trading price of our common stock.
We are a Delaware corporation and the anti-takeover provisions of the Delaware General Corporation Law, which apply to us, may discourage, delay or prevent a change in control by prohibiting us from engaging in a business combination with an interested stockholder for a period of three years after the stockholder becomes an interested stockholder, even if a change in control would be beneficial to our existing stockholders. In addition, our amended and restated certificate of incorporation and amended and restated bylaws may discourage, delay or prevent a change in our management or control over us that stockholders may consider favorable. Our certificate of incorporation and bylaws:
• | authorize the issuance of "blank check" preferred stock that could be issued by our board of directors to help defend against a takeover attempt; |
• | establish a classified board of directors, as a result of which the successors to the directors whose terms have expired will be elected to serve from the time of election and qualification until the third annual meeting following their election; |
• | require that directors only be removed from office for cause and only upon a supermajority stockholder vote; |
• | provide that vacancies on the board of directors, including newly created directorships, may be filled only by a majority vote of directors then in office rather than by stockholders; |
• | prevent stockholders from calling special meetings; |
• | include advance notice procedures for stockholders to nominate candidates for election as directors or bring matters before an annual meeting of stockholders; |
• | prohibit stockholder action by written consent, requiring all actions to be taken at a meeting of the stockholders; and |
• | provide that certain litigation against us can only be brought in Delaware. |
34
Item 1B. Unresolved Staff Comments.
Not applicable.
Item 2. Properties.
Our principal executive offices are located in Austin, Texas, where we lease approximately 86,000 square feet of office space under a lease with an initial term that expires on April 30, 2021, with the option to extend the lease for an additional five year term. In July 2014, we entered into a new agreement to lease approximately 70,000 additional square feet in an office building located adjacent to our current headquarters. We anticipate that approximately 55,000 square feet of the new space will become available in November 2015 and the remaining approximately 15,000 square feet August 2016. We also lease office space near Atlanta, Georgia. We believe our current facilities will be adequate for our needs for the foreseeable future.
Item 3. Legal Proceedings.
From time to time, we may become involved in legal proceedings arising in the ordinary course of our business. Management believes that there are no claims or actions pending against the Company, the ultimate disposition of which would have a material impact on our business, financial condition, results of operations or cash flows.
Item 4. Mine Safety Disclosures.
Not applicable.
35
PART II - OTHER INFORMATION
Item 5. Market for Registrant’s Common Equity, Related Stockholder Matters, and Issuer Purchases of Equity Securities.
Market Information and Holders
Our common stock has been listed on the New York Stock Exchange under the symbol “QTWO” since March 20, 2014. Prior to that date, there was no public trading market for our common stock. Our common stock was priced at $13.00 per share in our IPO. The following table sets forth for the periods indicated the high and low intra-day sale prices per share of our common stock as reported on the New York Stock Exchange:
High | Low | |||||||
First Quarter (from March 20, 2014) | $ | 17.38 | $ | 14.41 | ||||
Second Quarter 2014 | 16.96 | 9.62 | ||||||
Third Quarter 2014 | 16.89 | 12.44 | ||||||
Fourth Quarter 2014 | 20.48 | 13.03 | ||||||
As of December 31, 2014, we had 61 holders of record of our common stock. The actual number of holders of common stock is greater than this number of record holders and includes stockholders who are beneficial owners, but whose shares are held in street name by brokers and nominees. The number of holders of record also does not include stockholders whose shares may be held in trust by other entities.
Dividend Policy
We have never declared or paid any cash dividends on our common stock. Any future determination to declare cash dividends on our common stock will be made at the discretion of our board of directors and will depend on our financial condition, results of operations, capital requirements, general business conditions and other factors that our board of directors may deem relevant. We do not anticipate paying cash dividends on our common stock for the foreseeable future.
Use of Proceeds From Registered Securities
On March 25, 2014, we completed our IPO of 7,760,870 shares of common stock, at a price of $13.00 per share, before underwriting discounts and commissions, and on April 2, 2014 we completed the sale of an additional 1,164,131 shares of our common stock, at a price of $13.00 per share, before underwriting discounts and commissions, as a result of the underwriters' exercise of their over-allotment option to purchase additional shares. We sold 7,414,131 of such shares and existing stockholders sold an aggregate of 1,510,870 of such shares. The IPO generated net proceeds to us of $86.3 million, after deducting $10.1 million in underwriting discounts, commissions and offering expenses. We did not receive any proceeds from the sale of shares by the selling stockholders in the IPO. The joint managing underwriters of the offering were J.P. Morgan Securities LLC and Stifel, Nicolaus & Company, Incorporated.
There have been no material changes in the planned use of proceeds from our IPO from that described in the final prospectus filed with the SEC pursuant to Rule 424(b) on March 20, 2014. With a portion of the proceeds of the IPO, we repaid approximately $6.2 million of our outstanding indebtedness under our Credit Facility.
Equity Compensation Plan Information
Information regarding the securities authorized for issuance under our equity compensation plans will be included in our Proxy Statement relating to our 2015 annual meeting of stockholders to be filed with the SEC within 120 days after the end of our fiscal year ended December 31, 2014, and is incorporated herein by reference.
Performance Graph
The graph set forth below compares the cumulative total stockholder return on our common stock between March 20, 2014 (the date of our IPO) and December 31, 2014, with the cumulative total return of (i) the Russell 2000 Index and (ii) the S&P 1500 Application Software Index. This graph assumes the investment of $100 on March 20, 2014 in our common stock at our IPO offering price of $13.00 per share, the Russell 2000 Index and the S&P 1500 Application Software Index, and assumes the reinvestment of dividends, if any. Note that historic stock price performance is not necessarily indicative of future stock price performance.
36
The information contained in the Stock Performance Graph shall not be deemed to be soliciting material or to be filed with the SEC nor shall such information be incorporated by reference into any future filing under the Securities Act of 1933 or the Exchange Act, except to the extent we specifically incorporate it by reference into such filing.
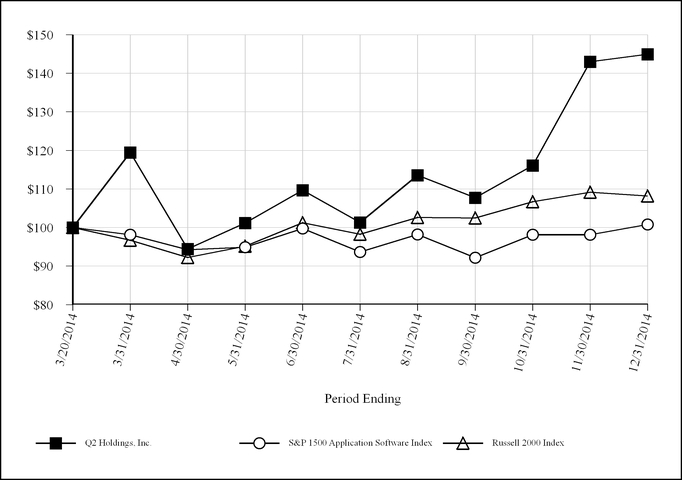
Issuer Purchases of Equity Securities
Total Number of Shares Purchased(1) | Average Price Paid Per Share(2) | Total Number of Shares Purchased as Part of a Publicly Announced Plans or Programs | Approximate Dollar Value of Shares That May Be Purchased Under the Plans or Programs | |||||||||||
October 1 - 31, 2014 | — | $ | — | — | $ | — | ||||||||
November 1 - 30, 2014 | — | — | — | — | ||||||||||
December 1 - 31, 2014 | 1,037 | 19.44 | — | — | ||||||||||
Total | 1,037 | $ | 19.44 | — | $ | — | ||||||||
(1) | Total shares purchased are attributable to shares of common stock tendered to us by one or more holders of common stock options to cover the exercise price of options exercised. |
(2) | Reflects the closing price of Q2 shares as reported on the New York Stock Exchange on the date of exercise. |
37
Item 6. Selected Financial Data.
The following selected consolidated statements of operations data for the years ended December 31, 2014, 2013 and 2012, and the selected consolidated balance sheet data as of December 31, 2014 and 2013 are derived from our audited consolidated financial statements included elsewhere in this Annual Report on Form 10-K. The selected consolidated statement of operations data for the year ended December 31, 2011 and the balance sheet data as of December 31, 2012 and 2011 were derived from our audited consolidated financial statements not included in this Annual Report on Form 10-K. The selected consolidated financial data should be read together with "Management's Discussion and Analysis of Financial Condition and Results of Operations," our consolidated financial statements, related notes, and other financial information included elsewhere in this Annual Report on Form 10-K. Our historical results are not necessarily indicative of our results to be expected in any future period. All amounts are in thousands, except per share data.
Year Ended December 31, | ||||||||||||||||
2014 | 2013 | 2012 | 2011 | |||||||||||||
Consolidated Statements of Operations Data: | ||||||||||||||||
Revenues | $ | 79,129 | $ | 56,872 | $ | 41,101 | $ | 26,982 | ||||||||
Cost of revenues(1)(2) | 46,054 | 36,261 | 25,170 | 14,795 | ||||||||||||
Gross profit | 33,075 | 20,611 | 15,931 | 12,187 | ||||||||||||
Operating expenses: | ||||||||||||||||
Sales and marketing(2) | 23,069 | 16,726 | 8,962 | 5,589 | ||||||||||||
Research and development(2) | 12,086 | 9,029 | 5,317 | 3,428 | ||||||||||||
General and administrative(2) | 16,991 | 11,742 | 8,780 | 4,857 | ||||||||||||
Unoccupied lease charges(3) | — | 236 | — | — | ||||||||||||
Total operating expenses | 52,146 | 37,733 | 23,059 | 13,874 | ||||||||||||
Loss from operations | (19,071 | ) | (17,122 | ) | (7,128 | ) | (1,687 | ) | ||||||||
Total other expense, net | (492 | ) | (499 | ) | (228 | ) | (76 | ) | ||||||||
Loss before income taxes | (19,563 | ) | (17,621 | ) | (7,356 | ) | (1,763 | ) | ||||||||
Provision for income taxes | (71 | ) | (55 | ) | (164 | ) | (132 | ) | ||||||||
Loss from continuing operations | (19,634 | ) | (17,676 | ) | (7,520 | ) | (1,895 | ) | ||||||||
Loss from discontinued operations, net of tax(4) | — | (199 | ) | (1,259 | ) | (1,132 | ) | |||||||||
Net loss | $ | (19,634 | ) | $ | (17,875 | ) | $ | (8,779 | ) | $ | (3,027 | ) | ||||
Net loss per common share: | ||||||||||||||||
Loss from continuing operations per common share, basic and diluted | $ | (0.67 | ) | $ | (1.49 | ) | $ | (0.66 | ) | $ | (0.17 | ) | ||||
Loss from discontinued operations per common share, basic and diluted | $ | — | $ | (0.02 | ) | $ | (0.11 | ) | $ | (0.10 | ) | |||||
Net loss per common share, basic and diluted | $ | (0.67 | ) | $ | (1.51 | ) | $ | (0.77 | ) | $ | (0.27 | ) | ||||
Weighted average common shares outstanding: | ||||||||||||||||
Basic and diluted | 29,257 | 11,866 | 11,345 | 11,326 | ||||||||||||
Other Financial Data: | ||||||||||||||||
Adjusted EBITDA(5) | $ | (10,418 | ) | $ | (12,310 | ) | $ | (4,400 | ) | $ | (277 | ) | ||||
(1) | Includes reclassified costs of research and development personnel who performed certain implementation and customer support services as follows: |
Year Ended December 31, | ||||||||||||||||
2014 | 2013 | 2012 | 2011 | |||||||||||||
Research and development costs classified into cost of revenues | $ | 1,412 | $ | 1,572 | $ | 1,390 | $ | 434 | ||||||||
38
(2) | Includes stock-based compensation expenses as follows: |
Year Ended December 31, | ||||||||||||||||
2014 | 2013 | 2012 | 2011 | |||||||||||||
Cost of revenues | $ | 623 | $ | 264 | $ | 187 | $ | 52 | ||||||||
Sales and marketing | 774 | 274 | 123 | 52 | ||||||||||||
Research and development | 527 | 257 | 195 | 57 | ||||||||||||
General and administrative | 2,646 | 810 | 526 | 236 | ||||||||||||
Total stock-based compensation expenses | $ | 4,570 | $ | 1,605 | $ | 1,031 | $ | 397 | ||||||||
(3) | Unoccupied lease charges include costs related to our early exit from our previous headquarters, partially offset by anticipated sublease income from that facility. |
(4) | We previously had a subsidiary which we fully divested in March 2013. Loss from discontinued operations, net of tax reflects the financial results of this divested subsidiary. |
(5) | We define adjusted EBITDA as net loss before depreciation, amortization, loss from discontinued operations, stock-based compensation, provision for income taxes, total other expense, net, unoccupied lease charges and loss on disposal of long-lived assets. |
The following table presents a reconciliation of net loss to adjusted EBITDA for each of the periods indicated:
Year Ended December 31, | ||||||||||||||||
2014 | 2013 | 2012 | 2011 | |||||||||||||
Reconciliation of Net Loss to Adjusted EBITDA: | ||||||||||||||||
Net loss | $ | (19,634 | ) | $ | (17,875 | ) | $ | (8,779 | ) | $ | (3,027 | ) | ||||
Depreciation and amortization | 4,083 | 2,971 | 1,697 | 1,013 | ||||||||||||
Stock-based compensation expense | 4,570 | 1,605 | 1,031 | 397 | ||||||||||||
Loss from discontinued operations, net of tax | — | 199 | 1,259 | 1,132 | ||||||||||||
Provision for income taxes | 71 | 55 | 164 | 132 | ||||||||||||
Total other expense, net | 492 | 499 | 228 | 76 | ||||||||||||
Unoccupied lease charges | — | 236 | — | — | ||||||||||||
Adjusted EBITDA | $ | (10,418 | ) | $ | (12,310 | ) | $ | (4,400 | ) | $ | (277 | ) | ||||
Year Ended December 31, | ||||||||||||||||
2014 | 2013 | 2012 | 2011 | |||||||||||||
Consolidated Balance Sheet Data: | ||||||||||||||||
Cash and cash equivalents | $ | 67,979 | $ | 18,675 | $ | 9,111 | $ | 15,363 | ||||||||
Total current assets | 104,522 | 33,871 | 19,134 | 22,724 | ||||||||||||
Deferred solution and other costs, total | 12,219 | 8,482 | 5,394 | 4,328 | ||||||||||||
Deferred implementation costs, total | 7,374 | 6,374 | 5,133 | 3,716 | ||||||||||||
Total current liabilities | 32,887 | 29,191 | 19,082 | 12,562 | ||||||||||||
Deferred revenues, total | 36,725 | 27,501 | 17,840 | 13,505 | ||||||||||||
Total redeemable preferred and common stock | — | 42,052 | 21,730 | 21,730 | ||||||||||||
Total stockholders' equity (deficit) | 78,940 | (36,316 | ) | (18,981 | ) | (11,250 | ) | |||||||||
39
Item 7. Management’s Discussion and Analysis of Financial Condition and Results of Operations.
The following discussion and analysis of our financial condition and results of operations should be read in conjunction with our consolidated financial statements and related notes included elsewhere in this Annual Report on Form 10-K. In addition to historical consolidated financial information, the following discussion contains forward-looking statements that reflect our plans, estimates and beliefs. Our actual results could differ materially from those discussed in the forward-looking statements. Factors that could cause or contribute to these differences include those discussed below and elsewhere in this Annual Report on Form 10-K, particularly in the section titled “Risk Factors.”
Overview
We are a leading provider of secure, cloud-based virtual banking solutions. We enable regional and community financial institutions, or RCFIs, to deliver a robust suite of integrated virtual banking services and engage more effectively with their retail and commercial account holders who expect to bank anytime, anywhere and on any device. Our solutions are often the most frequent point of interaction between our RCFI customers and their account holders. As such, we purpose-built our solutions to deliver a compelling, consistent user experience across digital channels and drive the success of our customers by extending their local brands, enabling improved account holder retention and creating incremental sales opportunities.
The effective delivery and management of secure and advanced virtual banking solutions in the complex and heavily-regulated financial services industry require significant resources, personnel and expertise. We provide virtual banking solutions that are designed to be highly configurable, scalable and adaptable to the specific needs of our RCFI customers. Our solutions deliver to account holders a unified virtual banking experience across online, mobile, voice and tablet channels by leveraging a common platform that integrates our solutions with each other and with our customers' other internal and third-party systems. In addition, we design our solutions and our data center infrastructure to comply with stringent security and technical regulations applicable to financial institutions and to safeguard our customers and their account holders through features such as real-time risk and fraud analytics.
We deliver our solutions to the substantial majority of our customers using a software-as-a-service, or SaaS, model under which our customers pay subscription fees for the use of our solutions. A small portion of our customers host our solutions in their own data centers under term license and maintenance agreements. Our customers have numerous account holders, and those account holders can represent one or more registered users on our solutions. We price our solutions based on the number of solutions purchased by our customers and the number of registered users utilizing our solutions. We earn additional revenues based on the number of bill-pay and certain other transactions that registered users perform on our virtual banking solutions in excess of the levels included in our standard subscription fee. As a result, our revenues grow as our customers buy more solutions from us and increase the number of registered users utilizing our solutions and as those users increase their number of transactions on our solutions.
We have achieved significant growth since our inception. During each of the past three years, our average number of registered users per installed customer has grown, and we have been able to sell additional solutions to existing customers. Our revenues per installed customer and per registered user vary period-to-period based on the length and timing of customer implementations, changes in the average number of registered users per customer, sales of additional solutions to existing customers, changes in the number of transactions on our solutions by registered users and variations among existing customers and new customers with respect to the mix of purchased solutions and related pricing.
We believe we have a significant opportunity to continue to grow our business, and we intend to invest across our organization to increase our revenues and improve our operating efficiencies. These investments will increase our costs on an absolute dollar basis, but the timing and amount of these investments will vary based on the rate at which we expect to add new customers, the implementation and support needs of our customers, our software development plans, our technology infrastructure requirements and the internal needs of our organization. Many of these investments will occur in advance of our realizing any resultant benefit which may make it difficult to determine if we are effectively allocating our resources.
If we are successful in growing our revenues by increasing the number and scope of our customer relationships, we anticipate that greater economies of scale and increased operating leverage will improve our margins over the long term. We also anticipate that increases in the number of registered users for existing customers will improve our margins. However, we do not have any control or influence over whether account holders elect to become registered users of our customers' virtual banking services.
We sell our solutions primarily through our professional sales organization. Our target market of approximately 13,000 RCFIs is well-defined as a result of applicable governmental regulations. As a result, we are able to effectively concentrate our
40
sales and marketing efforts on these readily-identifiable financial institutions. We intend to add sales representatives for both banks and credit unions across the U.S. We also expect to increase our number of sales support and marketing personnel, as well as our investment in marketing initiatives designed to increase awareness of our solutions and generate new customer opportunities.
We seek to help our RCFI customers succeed by providing advanced virtual banking solutions that allow our customers to distinguish themselves from competing financial institutions and better engage with their account holders. We believe that we successfully compete in our market due to our deep domain expertise, reputation for innovation and the quality, breadth and integration of our solutions and common platform. We have made significant investments, and intend to increase investments, in technology innovation and software development as we enhance our solutions and platform and increase or expand the number of solutions that we offer to RCFIs and their account holders.
We believe that delivery of consistent, high-quality customer support is a significant driver of RCFI purchasing and renewal decisions. To develop and maintain a reputation for high-quality service, we seek to build deep relationships with our customers through our customer service organization, which we staff with personnel who are motivated by our common mission of using technology to help RCFIs succeed and who are knowledgeable with respect to the regulated and complex nature of the financial services industry. As we grow our business, we must continue to invest in and grow our services organization to support our customers' needs and maintain our reputation.
On March 25, 2014, we completed our IPO of 7,760,870 shares of common stock at a price of $13.00 per share, before underwriting discounts and commissions, and on April 2, 2014 we completed the sale of an additional 1,164,131 shares of our common stock, at a price of $13.00 per share, before underwriting discounts and commissions, as a result of the underwriters' exercise of their over-allotment option to purchase additional shares. We sold 7,414,131 of such shares, and existing stockholders sold an aggregate of 1,510,870 of such shares. The IPO generated net proceeds to us of approximately $86.3 million, after deducting $10.1 million in underwriting discounts and commissions and offering costs, which have been recorded against the proceeds received from the IPO. We did not receive any proceeds from the sale of shares by the selling stockholders in the IPO.
There have been no material changes in the planned use of proceeds from our IPO from that described in the final prospectus filed with the SEC pursuant to Rule 424(b) on March 20, 2014. With a portion of the proceeds of the IPO, we repaid approximately $6.2 million of our outstanding indebtedness under our Credit Facility.
Key Operating Measures
In addition to the GAAP measures described below in "Management's Discussion and Analysis of Financial Condition and Results of Operations—Components of Operating Results," we monitor the following operating measures to evaluate growth trends, plan investments and measure the effectiveness of our sales and marketing efforts:
Installed Customers
We define installed customers as the number of customers from which we are currently recognizing revenues. The average size of our installed customers, measured in both registered users per installed customer and revenues per installed customer, has increased over time as our existing installed customers continue to add registered users and buy more solutions from us, and as we add larger RCFIs to our installed customer base. The rate at which we add installed customers varies based on our implementation capacity, the size and unique needs of our customers and the readiness of our customers to implement our solutions. We had 361, 334 and 299 installed customers as of December 31, 2014, 2013 and 2012, respectively.
41
Registered Users
We define a registered user as an individual related to an account holder of an installed customer who has registered to use one or more of our solutions and has current access to use those solutions as of the last day of the reporting period presented. We price our solutions based on the number of registered users, so as the number of registered users of our solutions increases, our revenues grow. Our average number of registered users per installed customer grows as our existing customers add more registered users and as we add larger RCFIs to our installed customer base. We anticipate that the number of registered users will grow at a faster rate than our number of installed customers. The rate at which our customers add registered users and the incremental revenues we recognize from new registered users vary significantly period-to-period based on the timing of our implementations of new customers and the timing of registration of new users. Our installed customers had approximately 4.3 million, 3.1 million and 2.4 million registered users as of December 31, 2014, 2013 and 2012, respectively.
Revenue Retention Rate
We believe that our ability to retain our installed customers and expand their use of our products and services over time is an indicator of the stability of our revenue base and the long-term value of our customer relationships. We assess our performance in this area using a metric we refer to as our revenue retention rate. We calculate our revenue retention rate as the total revenues in a calendar year from customers who were installed customers as of December 31 of the prior year, expressed as a percentage of the total revenues during the prior year from those installed customers. Our revenue retention rate provides insight into the impact on current year revenues of the number of new customers implemented during the prior year, the timing of our implementation of those new customers in the prior year, growth in the number of registered users and changes in their usage of our solutions, sales of new products and services to our existing installed customers during the current year and customer attrition. The most significant drivers of changes in our revenue retention rate each year have historically been the number of new customers in the prior year and the timing of our implementation of those new customers. The timing of our implementation of new customers in the prior year is significant because we do not start recognizing revenues from new customers until they become installed customers. If implementations are weighted more heavily in the first or second half of the prior year, our revenue retention rate will be lower or higher, respectively. Our revenue retention rate was 122%, 128% and 136% for the years ended December 31, 2014, 2013 and 2012, respectively.
Churn
We utilize churn to monitor the satisfaction of our clients and evaluate the effectiveness of our business strategies. We define churn as the amount of any monthly recurring revenue losses due to customer cancellations and downgrades, net of upgrades and additions of new solutions, during a year, divided by our monthly recurring revenue at the beginning of the year. Cancellations refer to customers that have either stopped using our services completely or remained a customer but terminated a particular service. Downgrades are a result of customers taking less of a particular service or renewing their contract for identical services at a lower price. Our annual churn has ranged from 5.4% to 3.5% over the last four years, and we had annual churn of 4.8%, 3.5% and 3.6% for the years ended December 31, 2014, 2013 and 2012, respectively. Our use of churn has limitations as an analytical tool, and investors should not consider it in isolation. Other companies in our industry may calculate churn differently, which reduces its usefulness as a comparative measure.
Adjusted EBITDA
We define adjusted EBITDA as net loss before depreciation, amortization, loss from discontinued operations, stock-based compensation, provision for income taxes, total other expense, net, unoccupied lease charges and disposal of long-lived assets. We believe that adjusted EBITDA provides useful information to investors and others in understanding and evaluating our operating results for the following reasons:
• | adjusted EBITDA is widely used by investors and securities analysts to measure a company's operating performance without regard to items that can vary substantially from company to company depending upon their financing, capital structures and the method by which assets were acquired; |
• | our management uses adjusted EBITDA in conjunction with GAAP financial measures for planning purposes, in the preparation of our annual operating budget, as a measure of our operating performance, to assess the effectiveness of our business strategies and to communicate with our board of directors concerning our financial performance; |
42
• | adjusted EBITDA provides more consistency and comparability with our past financial performance, facilitates period-to-period comparisons of our operations and also facilitates comparisons with other companies, many of which use similar non-GAAP financial measures to supplement their GAAP results; and |
• | our investor and analyst presentations include adjusted EBITDA as a supplemental measure of our overall operating performance. |
Adjusted EBITDA should not be considered as an alternative to net loss or any other measure of financial performance calculated and presented in accordance with GAAP. The use of adjusted EBITDA as an analytical tool has limitations such as:
• | depreciation and amortization are non-cash charges, and the assets being depreciated or amortized will often have to be replaced in the future and adjusted EBITDA does not reflect cash requirements for such replacements; |
• | adjusted EBITDA may not reflect changes in, or cash requirements for, our working capital needs or contractual commitments; |
• | adjusted EBITDA does not reflect the potentially dilutive impact of stock-based compensation; |
• | adjusted EBITDA does not reflect interest or tax payments that could reduce cash available for use; and |
• | other companies, including companies in our industry, might calculate adjusted EBITDA or similarly titled measures differently, which reduces their usefulness as comparative measures. |
Because of these and other limitations, you should consider adjusted EBITDA together with our GAAP financial measures including cash flow from operations and net loss. The following table presents a reconciliation of net loss to adjusted EBITDA for each of the periods indicated (in thousands):
Year Ended December 31, | ||||||||||||
2014 | 2013 | 2012 | ||||||||||
Reconciliation of Net Loss to Adjusted EBITDA: | ||||||||||||
Net loss | $ | (19,634 | ) | $ | (17,875 | ) | $ | (8,779 | ) | |||
Depreciation and amortization | 4,083 | 2,971 | 1,697 | |||||||||
Stock-based compensation expense | 4,570 | 1,605 | 1,031 | |||||||||
Loss from discontinued operations, net of tax | — | 199 | 1,259 | |||||||||
Provision for income taxes | 71 | 55 | 164 | |||||||||
Total other expense, net | 492 | 499 | 228 | |||||||||
Unoccupied lease charges | — | 236 | — | |||||||||
Adjusted EBITDA | $ | (10,418 | ) | $ | (12,310 | ) | $ | (4,400 | ) | |||
Components of Operating Results
Revenues
All of our revenue-generating activities directly relate to the sale, implementation and support of our solutions within a single operating segment. We derive the substantial majority of our revenues from subscription fees for the use of our solutions hosted in our data centers as well as revenues for implementation and customer support services related to our solutions. A small portion of our customers host our solutions in their own data centers under term license and maintenance agreements, and we recognize the corresponding revenues over the term of those customer agreements.
Subscription fees are based on the number of solutions purchased by our customers, the number of registered users and the number of bill-pay and certain other transactions those users conduct using our solutions in excess of the levels included in our standard subscription fee. Subscription fees are billed and recognized monthly over the term of our customer agreements. The initial term of our customer agreements averages over five years, although it varies by customer. We begin recognizing subscription fees on the date a solution is implemented and made available to the customer. The timing of our implementations
43
vary period-to-period based on our implementation capacity, the number of solutions purchased by our customers, the size and unique needs of our customers and the readiness of our customers to implement our solutions. We recognize any related implementation services revenues ratably over the initial agreement term beginning on the date we commence recognizing subscription fees. Amounts that have been invoiced but not paid are recorded in accounts receivable and in revenues or deferred revenues, depending on whether our revenue recognition criteria have been met.
We consider subscription fees to be fixed or determinable unless the fees are subject to refund or adjustment or are not payable within our standard payment terms. In determining whether collection of subscription fees is reasonably assured, we consider financial and other information about customers, such as a customer's current credit-worthiness and payment history over time. Historically, our bad debt expenses have not been significant.
Cost of Revenues
Cost of revenues is comprised primarily of salaries and other personnel-related costs, including employee benefits, bonuses and stock-based compensation, for employees providing services to our customers. This includes the costs of our implementation, customer support, data center and customer training personnel as well as a reclassification of costs related to research and development personnel who perform implementation and customer support services. Cost of revenues also includes the direct costs of bill-pay and other third-party intellectual property included in our solutions, the amortization of deferred solution and services costs, co-location facility costs and depreciation of our data center assets, an allocation of general overhead costs and referral fees. We allocate general overhead expenses to all departments based on the number of employees in each department, which we consider to be a fair and representative means of allocation.
The amount of research and development costs reclassified to cost of revenues was $1.4 million, $1.6 million and $1.4 million for the years ended December 31, 2014, 2013 and 2012, respectively.
We capitalize certain personnel costs directly related to the implementation of our solution to the extent those costs are considered to be recoverable from future revenues. We amortize the costs for a particular implementation once revenue recognition commences, and we amortize those implementation costs over the remaining term of the customer agreement. Other costs not directly recoverable from future revenues are expensed in the period incurred. We capitalized implementations costs in the amount of $3.8 million, $3.2 million and $2.6 million for the years ended December 31, 2014, 2013 and 2012, respectively.
We intend to continue to increase our investments in our implementation and customer support teams and technology infrastructure to serve our customers and support our growth. We expect cost of revenues to continue to grow in absolute dollars as we grow our business but to fluctuate as a percentage of revenues based principally on the level and timing of implementation and support activities and other related costs. We expect our gross margins to decrease in the near term as we add larger customers requiring higher levels of implementation and customer support services.
Operating Expenses
Operating expenses consist of sales and marketing, research and development and general and administrative expenses. We intend to continue to hire new employees and make other investments to support our anticipated growth. As a result, we expect our operating expenses to increase in absolute dollars but to decrease as a percentage of revenues over the long term as we grow our business.
Sales and Marketing
Sales and marketing expenses consist primarily of salaries and other personnel-related costs, including commissions, benefits, bonuses and stock-based compensation. Additional expenses relate to advertising, lead generation, promotional event programs, corporate communications, travel and allocated overhead.
Sales and marketing expenses as a percentage of total revenues will change in any given period based on several factors including the addition of newly-hired sales professionals, the number and timing of newly-installed customers and the amount of sales commissions expense amortized related to those customers. Commissions are generally capitalized and then amortized over the life of the customer agreement.
Sales and marketing expenses are also impacted by the timing of significant marketing programs such as our annual user conference which we typically hold during the second quarter. We plan to continue investing in sales and marketing by
44
increasing our number of sales and marketing personnel and expanding our sales and marketing activities. We believe these investments will help us build brand awareness, add new customers and expand sales to our existing customers as they continue to buy more solutions from us, the number of registered users utilizing our solutions grows and those users increase the number of transactions on our solutions.
Research and Development
We believe that continuing to improve and enhance our solutions is essential to maintaining our reputation for innovation and growing our customer base and revenues. Research and development expenses include salaries and personnel-related costs, including benefits, bonuses and stock-based compensation, third-party contractor expenses, software development costs, allocated overhead and other related expenses incurred in developing new solutions and enhancing existing solutions. Research and development expenses are expensed as incurred. To date, software development costs eligible for capitalization have not been significant. Accordingly, we have not capitalized any software development costs, and we do not anticipate capitalizing any such costs in the foreseeable future.
General and Administrative
General and administrative expenses consist primarily of salaries and other personnel-related costs, including benefits, bonuses and stock-based compensation, of our administrative, finance and accounting, information systems, legal and human resources employees. Additional expenses include consulting and professional fees, insurance and travel. Our general and administrative expenses have increased as a result of our operating as a public company since our IPO. These expenses include costs to comply with Section 404 of the Sarbanes-Oxley Act and other regulations governing public companies, increased costs of directors' and officers' liability insurance, increased professional services expenses and costs associated with enhanced investor relations activities.
Unoccupied Lease Charges
Unoccupied lease charges include costs related to the early exit from our previous headquarters facility, partially offset by anticipated sublease income from that facility.
Total Other Expense, Net
Total other expense, net, consists primarily of interest income and expense. We earn interest income on our cash, cash equivalents and investments, and expect interest income to increase due to the increase in our cash, cash equivalents and investments as a result of our IPO. Interest expense consists primarily of the interest incurred on outstanding borrowings under our Credit Facility. We expect interest expense to decrease in future periods as we have utilized a portion of the proceeds from our IPO to pay down a portion of our Credit Facility.
Provision for Income Taxes
As a result of our current net operating loss position, income tax expenses consist primarily of state income taxes. We incurred minimal state income taxes for each of the years ended December 31, 2014, 2013 and 2012. Our net operating loss carryforwards for federal income tax purposes were $69.9 million at December 31, 2014 and will expire at various dates beginning in 2026 if not utilized. We also held state tax credits of $0.2 million and federal alternative minimum tax credits of $0.1 million at December 31, 2014. The state tax credits will expire in 2027 if not utilized, and the federal alternative minimum tax credits have an indefinite carryforward period.
Critical Accounting Policies and Significant Judgments and Estimates
Our management’s discussion and analysis of our financial condition and results of operations is based on our consolidated financial statements, which have been prepared in accordance with GAAP. The preparation of these consolidated financial statements requires us to make estimates and assumptions that affect the reported amounts of assets and liabilities, disclosure of contingent assets and liabilities at the date of the consolidated financial statements, and the reported amounts of revenues and expenses. In accordance with GAAP, we base our estimates on historical experience and on various other assumptions that we believe are reasonable under the circumstances. Actual results might differ from these estimates under different assumptions or conditions.
45
Our significant accounting policies are described in Note 2 to our consolidated financial statements appearing elsewhere in this Annual Report on Form 10-K, and we believe that the accounting policies discussed below involve the greatest degree of complexity and exercise of significant judgments and estimates by our management. The methods, estimates and judgments that we use in applying our accounting policies have a significant impact on our results of operations and, accordingly, we believe the policies described below are the most critical for understanding and evaluating our financial condition and results of operations.
Revenue Recognition
All of our revenue-generating activities directly relate to the sale, implementation and support of our solutions within a single operating segment. We derive the substantial majority of our revenues from subscription fees for the use of our solutions hosted in our data centers as well as revenues for implementation and customer support services related to our solutions. A small portion of our customers host our solutions in their own data centers under term license and maintenance agreements, and we recognize the corresponding revenues monthly over the term of those customer agreements.
Revenues are recognized net of sales credits and allowances. We begin to recognize revenue for a customer when all of the following conditions are satisfied:
• | there is persuasive evidence of an arrangement; |
• | the service has been or is being provided to the customer; |
• | the collection of the fees is reasonably assured; and |
• | the amount of fees to be paid by the customer is fixed or determinable. |
Determining whether and when these criteria have been met can require significant judgment and estimates. In general, revenue recognition is commenced when our solutions are implemented and made available to the customers.
Subscription fees are billed and recognized monthly over the agreement term. The initial term of our customer agreements averages over five years, although it varies by customer. We begin recognizing subscription fees on the date a solution is implemented and made available to the customer. The timing of our implementations vary period-to-period based on our implementation capacity, the number of solutions purchased by our customers, the size and unique needs of our customers and the readiness of our customers to implement our solutions. We recognize any related implementation services revenues ratably over the initial agreement term beginning on the date we commence recognizing subscription fees. Amounts that have been invoiced are recorded in accounts receivable and deferred revenues or revenues, depending on whether our revenue recognition criteria have been met.
We enter into arrangements with multiple‑deliverables that generally include multiple subscriptions and implementation services. We consider subscription fees to be fixed or determinable unless the fee is subject to refund or adjustment or is not payable within our standard payment terms. In determining whether collection of the subscription fees is reasonably assured, we consider financial and other information about customers, such as a customer’s current credit‑worthiness and payment history over time. Historically, our bad debt expenses have not been significant.
For multiple‑deliverable arrangements, arrangement consideration is allocated to deliverables based on their relative selling price. In order to treat deliverables in a multiple-deliverable arrangement as separate units of accounting, the deliverables must have standalone value upon delivery. If the deliverables have standalone value upon delivery, each deliverable must be accounted for separately. Subscription services have standalone value as such services are often sold separately. In determining whether implementation services have standalone value apart from the subscription services, we consider factors including the availability of the services from other vendors. To date, we have concluded that the implementation services included in our multiple‑deliverable arrangements do not have standalone value. As a result, when implementation services are sold in a multiple‑deliverable arrangement we capitalize any fees for implementation services and recognize such amounts ratably over the period of performance for the initial customer agreement term.
When multiple‑deliverables included in an arrangement are separated into different units of accounting, the consideration is allocated to the identified separate units based on a relative selling price hierarchy. The selling price for a deliverable is based on its vendor‑specific objective evidence of selling price, or VSOE, if available, third‑party evidence of selling price, or TPE, if VSOE is not available or best estimate of selling price, or BESP, if neither VSOE nor TPE is available. We have not established VSOE for our subscription services due to lack of pricing consistency, the introduction of new services and other factors. We have determined that TPE is not a practical alternative due to differences in our service offerings compared to other parties and the lack of availability of relevant third‑party pricing information. Accordingly, we use BESP to
46
determine the relative selling price. The amount of revenues allocated to delivered items is limited to revenues that are not contingent.
We determined BESP by considering our overall pricing objectives and market conditions. Significant pricing practices taken into consideration include our discounting practices, the size and number of our transactions, customer demographics, price lists, go‑to‑market strategy, historical standalone sales and agreement prices. As our go‑to‑market strategies evolve, we may modify our pricing practices in the future, which could result in changes in relative selling prices, and include both VSOE and BESP.
Deferred Revenues
Deferred revenues consist primarily of amounts that have been billed to customers for implementation, maintenance and other services in advance of revenue recognition and prepayments received from customers in advance for implementation, maintenance and other services, as well as initial subscription fees. We recognize deferred revenues as revenues when our corresponding revenue recognition criteria are met. Customer prepayments are generally applied against invoices issued to customers when services are performed and billed. Deferred revenues that are expected to be recognized as revenues during the succeeding twelve month period are recorded in current liabilities as deferred revenues, current portion and the remaining portion is recorded in long‑term liabilities as deferred revenues, net of current portion.
Deferred Implementation Costs
We capitalize certain personnel and other costs related to the implementation of our solutions. We amortize the costs for a particular implementation once revenue recognition commences, and we amortize those implementation costs over the remaining term of the customer agreement. We analyze implementation costs that may be capitalized to assess their recoverability, and we only capitalize costs that we anticipate to be recoverable. The portion of capitalized implementation costs expected to be amortized during the succeeding twelve-month period is recorded in current assets as deferred implementation costs, current portion, and the remainder is recorded in long‑term assets as deferred implementation costs, net of current portion.
Deferred Solution and Other Costs
We capitalize sales commissions and certain third‑party costs related to our customer agreements. These costs are amortized over the term of the related customer agreements. We analyze solutions and other costs that may be capitalized to assess their recoverability, and we only capitalize costs that we anticipate to be recoverable. The portion of capitalized costs expected to be amortized during the succeeding twelve-month period is recorded in current assets as deferred solution and other costs, current portion, and the remainder is recorded in long‑term assets as deferred solution and other costs, net of current portion.
Accounts Receivable, Net
Accounts receivable are stated at net realizable value, including both billed and unbilled receivables to customers. Unbilled receivable balances arise primarily when we perform services related to subscription fee agreements in advance of billing. Billing for such services typically occurs one month in arrears.
We assess the collectability of outstanding accounts receivable on an ongoing basis and maintain an allowance if accounts receivable are deemed uncollectable. This allowance is recorded as a reduction of accounts receivable. At December 31, 2014 and 2013, we did not provide for an allowance for doubtful accounts, as all amounts outstanding were deemed collectable. Historically, our collection experience has not varied significantly and bad debt expenses have been insignificant.
Stock‑Based Compensation
Stock‑based awards are measured at fair value at each grant date. We recognize stock‑based compensation expenses ratably over the requisite service period of the option award.
Determination of the Fair Value of Stock‑Based Compensation Grants
The determination of the fair value of stock‑based compensation arrangements is affected by a number of variables, including estimates of the fair value of our common stock, expected stock price volatility, risk‑free interest rate and the expected life of the award. We value stock options using the Black‑Scholes option‑pricing model, which was developed for use in estimating the fair value of traded options that are fully transferable and have no vesting restrictions. Black‑Scholes and
47
other option valuation models require the input of highly subjective assumptions, including the expected stock price volatility. If we made different assumptions, our stock‑based compensation expenses, net loss, and net loss per common share could be significantly different.
We have assumed no dividend yield because we do not expect to pay dividends in the foreseeable future, which is consistent with our past practice. The risk‑free interest rate assumption is based on observed interest rates for U.S. Treasury securities with maturities consistent with the expected life of our stock options. The expected life represents the period of time the stock options are expected to be outstanding and is based on the simplified method. Under the simplified method, the expected life of an option is presumed to be the midpoint between the vesting date and the end of the agreement term. We used the simplified method due to the lack of sufficient historical exercise data to provide a reasonable basis upon which to otherwise estimate the expected life of the stock options. Expected volatility is based on historical volatilities for publicly traded stock of comparable companies over the estimated expected life of the stock options. The list of comparable companies we used to determine expected volatility was consistent with those used to determine the corresponding fair value of our common stock at each grant date.
We based our estimate of pre-vesting forfeitures, or forfeiture rate, on historical forfeiture rates. We apply the estimated forfeiture rate to the total estimated fair value of the awards, as derived from the Black-Scholes model, to compute the stock-based compensation expenses, net of pre-vesting forfeitures, to be recognized in our consolidated statements of operations.
Determination of the Fair Value of Common Stock on Grant Dates
Prior to our IPO, we were a private company with no active public market for our common stock. Our board of directors periodically determined for financial reporting purposes the estimated per share fair value of our common stock at various dates using independent third-party valuations.
We performed these valuations as of March 31, 2011, September 30, 2011, December 31, 2011, March 31, 2012, June 30, 2012, September 30, 2012, December 31, 2012, March 31, 2013, June 30, 2013, October 17, 2013 and December 31, 2013, and utilized the probability weighted expected return model, or PWERM, approach to allocate our equity value to our common shares. The PWERM approach employs various market, income or cost approach calculations depending on the likelihood of various liquidation scenarios. In conducting the valuations, our board of directors considered all objective and subjective factors that they believed to be relevant for each valuation conducted, including management’s estimate of our business condition, prospects and operating performance at each valuation date. Within the valuations performed by our management, a range of factors, assumptions and methodologies were used. Significant factors considered were:
• | independent third-party valuations performed contemporaneously or shortly before the grant date, as applicable; |
• | the fact that we were a privately held technology company and our common stock was illiquid; |
• | the nature and history of our business; |
• | our discounted future cash flows, based on our projections of future operating results at the time; |
• | valuations of comparable public companies; |
• | the potential impact on common stock of preferential liquidation and redemption rights of our redeemable convertible preferred stock under different valuation scenarios; |
• | current and forecasted economic conditions, both generally and specific to our industry; |
• | the estimated likelihood of achieving a liquidity event for shares of our common stock such as an initial public offering or a sale of our company, given prevailing market conditions, or remaining a private company; and |
• | the state of the initial public offering market for similarly situated privately held technology companies. |
There were significant judgments and estimates inherent in these contemporaneous valuations. These judgments and estimates included assumptions regarding our future operating performance, the timing of an initial public offering or other liquidity event and the determinations of the appropriate valuation methods. If we made different assumptions, our stock-based compensation expenses, net loss and net loss per common share could be significantly different.
Since the completion of our IPO in March 2014, our board of directors has approved stock option grants with exercise prices based on the closing market price of our common stock on the grant date.
48
Income Taxes
We account for income taxes under the asset and liability method. We record deferred tax assets and liabilities for the future tax consequences attributable to differences between the financial statement carrying amounts of existing assets and liabilities and their respective tax bases, as well as for operating loss and tax credit carryforwards. We measure deferred tax assets and liabilities using enacted tax rates expected to apply to taxable income in the years in which we expect to recover or settle those temporary differences. We recognize the effect of a change in tax rates on deferred tax assets and liabilities in the results of operations in the period that includes the enactment date. We assess the likelihood that deferred tax assets will be realized, and we recognize a valuation allowance if it is more likely than not that some portion of the deferred tax assets will not be realized. This assessment requires judgment as to the likelihood and amounts of future taxable income by tax jurisdiction. To date, we have provided a valuation allowance against our deferred tax assets as we believe the objective and verifiable evidence of our historical pretax net losses outweighs any positive evidence of our forecasted future results. Although we believe that our tax estimates are reasonable, the ultimate tax determination involves significant judgment. We will continue to monitor the positive and negative evidence and will adjust the valuation allowance as sufficient objective positive evidence becomes available.
We account for uncertain tax positions by recognizing the financial statement effects of a tax position only when, based upon technical merits, it is more likely than not that the position will be sustained upon examination. We recognize potential accrued interest and penalties associated with unrecognized tax positions within our global operations in income tax expense.
Results of Operations
Consolidated Statements of Operations Data
The following table sets forth our consolidated statements of operations data for each of the periods indicated (in thousands):
Year Ended December 31, | ||||||||||||
2014 | 2013 | 2012 | ||||||||||
Revenues | $ | 79,129 | $ | 56,872 | $ | 41,101 | ||||||
Cost of revenues(1)(2) | 46,054 | 36,261 | 25,170 | |||||||||
Gross profit | 33,075 | 20,611 | 15,931 | |||||||||
Operating expenses: | ||||||||||||
Sales and marketing(2) | 23,069 | 16,726 | 8,962 | |||||||||
Research and development(2) | 12,086 | 9,029 | 5,317 | |||||||||
General and administrative(2) | 16,991 | 11,742 | 8,780 | |||||||||
Unoccupied lease charges(3) | — | 236 | — | |||||||||
Total operating expenses | 52,146 | 37,733 | 23,059 | |||||||||
Loss from operations | (19,071 | ) | (17,122 | ) | (7,128 | ) | ||||||
Total other expense, net | (492 | ) | (499 | ) | (228 | ) | ||||||
Loss before income taxes | (19,563 | ) | (17,621 | ) | (7,356 | ) | ||||||
Provision for income taxes | (71 | ) | (55 | ) | (164 | ) | ||||||
Loss from continuing operations | (19,634 | ) | (17,676 | ) | (7,520 | ) | ||||||
Loss from discontinued operations, net of tax(4) | — | (199 | ) | (1,259 | ) | |||||||
Net loss | $ | (19,634 | ) | $ | (17,875 | ) | $ | (8,779 | ) | |||
_______________________________________________________________________________
(1) | Includes reclassified costs of research and development personnel who performed certain implementation and customer support services as follows: |
Year Ended December 31, | ||||||||||||
2014 | 2013 | 2012 | ||||||||||
Research and development costs classified into cost of revenues | $ | 1,412 | $ | 1,572 | $ | 1,390 | ||||||
49
(2) | Includes stock-based compensation expenses as follows: |
Year Ended December 31, | ||||||||||||
2014 | 2013 | 2012 | ||||||||||
Cost of revenues | $ | 623 | $ | 264 | $ | 187 | ||||||
Sales and marketing | 774 | 274 | 123 | |||||||||
Research and development | 527 | 257 | 195 | |||||||||
General and administrative | 2,646 | 810 | 526 | |||||||||
Total stock-based compensation expenses | $ | 4,570 | $ | 1,605 | $ | 1,031 | ||||||
(3) | Unoccupied lease charges include costs related to our early exit from our previous headquarters, partially offset by anticipated sublease income from that facility. |
(4) | We previously had a subsidiary which we fully divested in March 2013. Loss from discontinued operations, net of tax reflects the financial results of this divested subsidiary. |
The following table sets forth our consolidated statements of operations data as a percentage of revenues for each of the periods indicated:
Year Ended December 31, | |||||||||
2014 | 2013 | 2012 | |||||||
Revenues | 100.0 | % | 100.0 | % | 100.0 | % | |||
Cost of revenues(1)(2) | 58.2 | % | 63.8 | % | 61.2 | % | |||
Gross margin | 41.8 | % | 36.2 | % | 38.8 | % | |||
Operating expenses: | |||||||||
Sales and marketing(2) | 29.2 | % | 29.4 | % | 21.8 | % | |||
Research and development(2) | 15.3 | % | 15.9 | % | 12.9 | % | |||
General and administrative(2) | 21.5 | % | 20.6 | % | 21.4 | % | |||
Unoccupied lease charges(3) | — | % | 0.4 | % | — | % | |||
Total operating expenses | 66.0 | % | 66.3 | % | 56.1 | % | |||
Loss from operations | (24.2 | )% | (30.1 | )% | (17.3 | )% | |||
Total other expense, net | (0.6 | )% | (0.9 | )% | (0.6 | )% | |||
Loss before income taxes | (24.8 | )% | (31.0 | )% | (17.9 | )% | |||
Provision for income taxes | (0.1 | )% | (0.1 | )% | (0.4 | )% | |||
Loss from continuing operations | (24.9 | )% | (31.1 | )% | (18.3 | )% | |||
Loss from discontinued operations, net of tax(4) | — | % | (0.3 | )% | (3.1 | )% | |||
Net loss | (24.9 | )% | (31.4 | )% | (21.4 | )% | |||
_______________________________________________________________________________
(1) | Includes reclassified costs of research and development personnel who performed certain implementation and customer support services as follows: |
Year Ended December 31, | |||||||||
2014 | 2013 | 2012 | |||||||
Research and development costs classified into cost of revenues | 1.8 | % | 2.8 | % | 3.4 | % | |||
50
(2) | Includes stock-based compensation expenses as follows: |
Year Ended December 31, | |||||||||
2014 | 2013 | 2012 | |||||||
Cost of revenues | 0.8 | % | 0.5 | % | 0.5 | % | |||
Sales and marketing | 1.0 | % | 0.5 | % | 0.3 | % | |||
Research and development | 0.7 | % | 0.4 | % | 0.5 | % | |||
General and administrative | 3.3 | % | 1.4 | % | 1.3 | % | |||
Total stock-based compensation expenses | 5.8 | % | 2.8 | % | 2.6 | % | |||
(3) | Unoccupied lease charges include costs related to our early exit from our previous headquarters, partially offset by anticipated sublease income from that facility. |
(4) | We previously had a subsidiary which we fully divested in March 2013. Loss from discontinued operations, net of tax reflects the financial results of this divested subsidiary. |
Comparison of Year Ended December 31, 2014 and 2013, and the Year Ended December 31, 2013 and 2012
Revenues
The following table presents our revenues for each of the periods indicated (dollars in thousands):
Year Ended December 31, | Change | Year Ended December 31, | Change | |||||||||||||||||||||||||||
2014 | 2013 | $ | (%) | 2013 | 2012 | $ | (%) | |||||||||||||||||||||||
Revenues | $ | 79,129 | $ | 56,872 | $ | 22,257 | 39.1 | % | $ | 56,872 | $ | 41,101 | $ | 15,771 | 38.4 | % | ||||||||||||||
Year Ended December 31, 2014 Compared to the Year Ended December 31, 2013. Revenues increased by $22.3 million, or 39.1%, from $56.9 million for the year ended December 31, 2013 to $79.1 million for the year ended December 31, 2014. This increase was primarily attributable to an $18.2 million increase from the growth in new registered users from a combination of strong client retention and growth from existing customers and the addition of registered users from new installed customers. The remaining $4.1 million increase was generated from increases in the number of transactions processed using our solutions. In particular, the number of registered users on our solutions increased from 3.1 million at December 31, 2013 to 4.3 million at December 31, 2014.
Year Ended December 31, 2013 Compared to the Year Ended December 31, 2012. Revenues increased by $15.8 million, or 38.4%, from $41.1 million for the year ended December 31, 2012 to $56.9 million for the year ended December 31, 2013. Of this increase, $12.7 million was generated from the growth in new registered users from a combination of strong client retention and growth from existing customers and the addition of registered users from new installed customers. The remaining $3.1 million increase was generated from increases in the number of transactions processed using our solutions. In particular, the number of registered users on our solutions increased from 2.4 million at December 31, 2012 to 3.1 million at December 31, 2013.
Cost of Revenues
The following table presents our cost of revenues for each of the periods indicated (dollars in thousands):
Year Ended December 31, | Change | Year Ended December 31, | Change | |||||||||||||||||||||||||||
2014 | 2013 | $ | (%) | 2013 | 2012 | $ | (%) | |||||||||||||||||||||||
Cost of revenues | $ | 46,054 | $ | 36,261 | $ | 9,793 | 27.0 | % | $ | 36,261 | $ | 25,170 | $ | 11,091 | 44.1 | % | ||||||||||||||
Percentage of revenues | 58.2 | % | 63.8 | % | 63.8 | % | 61.2 | % | ||||||||||||||||||||||
Year Ended December 31, 2014 Compared to the Year Ended December 31, 2013. Cost of revenues increased by $9.8 million, or 27.0%, from $36.3 million for the year ended December 31, 2013 to $46.1 million for the year ended December 31, 2014. This increase was primarily attributable to a $4.3 million increase in personnel costs due to an increase in the number of personnel who provide implementation and customer support and maintain our data centers and other technical infrastructure. The increase in personnel costs includes a $0.4 million increase in stock-based compensation expense allocated to cost of
51
revenue for the increase in the number of stock-based awards vesting during the period and the increased fair value of the awards vesting due to the increase in our stock price. In addition, there was a $3.8 million increase in direct costs related to bill-pay transaction processing and other third-party intellectual property included in our solutions which was related to the increase in the number of new registered users and transactions processed on our solutions, a $0.9 million increase in co-location facility costs and depreciation of our data center assets resulting from the increased infrastructure necessary to support our expanding customer base and a $0.5 million increase in facilities and other overhead costs.
Year Ended December 31, 2013 Compared to the Year Ended December 31, 2012. Cost of revenues increased by $11.1 million, or 44.1%, from $25.2 million for the year ended December 31, 2012 to $36.3 million for the year ended December 31, 2013. This increase was primarily attributable to a $4.4 million increase in personnel costs due to our growth in the number of personnel who provide implementation and customer support and maintain our data centers and other technical infrastructure, including a $0.2 million increase in reclassified research and development costs. Also, direct costs related to bill-pay transaction processing and other third-party intellectual property included in our solutions represented $2.9 million of this increase as the number of new registered users and transactions processed on our solutions increased, co-location facility costs and depreciation of our data center assets increased by $2.8 million as we expanded our data centers and other technical infrastructure to support our expanding customer base, and we incurred an additional $1.0 million in facilities and other overhead costs.
We defer certain payroll costs directly related to the implementation of our solutions to the extent those costs are considered to be recoverable from future revenues. However, a substantial portion of our implementation costs are not eligible for deferral and, as a result, are expensed in the period incurred. Costs related to implementations that have been deferred are amortized over the same period in which the related revenue is recognized. Additionally, we invested in personnel, business processes and systems infrastructure to standardize our business processes and drive future efficiency in our implementations, customer support and data center operations. We expect these investments in capacity and process improvement to provide opportunities for future expansion of our gross margin as we begin to achieve economies of scale.
Operating Expenses
The following tables present our operating expenses for each of the periods indicated (dollars in thousands):
Sales and Marketing
Year Ended December 31, | Change | Year Ended December 31, | Change | |||||||||||||||||||||||||||
2014 | 2013 | $ | (%) | 2013 | 2012 | $ | (%) | |||||||||||||||||||||||
Sales and marketing | $ | 23,069 | $ | 16,726 | $ | 6,343 | 37.9 | % | $ | 16,726 | $ | 8,962 | $ | 7,764 | 86.6 | % | ||||||||||||||
Percentage of revenues | 29.2 | % | 29.4 | % | 29.4 | % | 21.8 | % | ||||||||||||||||||||||
Year Ended December 31, 2014 Compared to the Year Ended December 31, 2013. Sales and marketing expenses increased by $6.3 million, or 37.9%, from $16.7 million for the year ended December 31, 2013 to $23.1 million for the year ended December 31, 2014. This increase was primarily attributable to a $5.3 million increase in personnel costs due to the growth of our sales and marketing organizations. The increase in personnel costs includes a $0.5 million increase in stock-based compensation expense allocated to sales and marketing for the increase in the number of stock-based awards vesting during the period and the increased fair value of the awards vesting due to the increase in our stock price. In addition, there was a $0.5 million increase in travel and entertainment costs due to increased employee travel to attract new customers and efforts to support our sales and marketing initiatives, a $0.3 million increase in facilities and other overhead costs, a $0.2 million increase in discretionary marketing spend as a result of increased advertising to drive brand awareness and expanded marketing efforts to attract new customers and retain and grow existing customers. We anticipate that sales and marketing expenses will continue to increase in absolute dollars in the future as we add personnel to support our revenue growth and as we increase discretionary marketing spend to attract new customers, retain and grow existing customers and drive brand awareness. We expect such expenses to decline as a percentage of our revenues over time as our revenues grow.
Year Ended December 31, 2013 Compared to the Year Ended December 31, 2012. Sales and marketing expenses increased by $7.8 million, or 86.6%, from $9.0 million for the year ended December 31, 2012 to $16.7 million for the year ended December 31, 2013. This increase was primarily attributable to a $5.1 million increase in personnel costs due to the growth of our sales and marketing organizations. Also, discretionary marketing spend increased by $1.2 million as a result of
52
increased advertising to drive brand awareness and expanded marketing efforts to attract new customers and retain and grow existing customers, travel and other miscellaneous expenses increased by $0.7 million as a result of these activities, and we incurred a $0.8 million increase in facilities and other overhead costs.
Research and Development
Year Ended December 31, | Change | Year Ended December 31, | Change | |||||||||||||||||||||||||||
2014 | 2013 | $ | (%) | 2013 | 2012 | $ | (%) | |||||||||||||||||||||||
Research and development | $ | 12,086 | $ | 9,029 | $ | 3,057 | 33.9 | % | $ | 9,029 | $ | 5,317 | $ | 3,712 | 69.8 | % | ||||||||||||||
Percentage of revenues | 15.3 | % | 15.9 | % | 15.9 | % | 12.9 | % | ||||||||||||||||||||||
Year Ended December 31, 2014 Compared to the Year Ended December 31, 2013. Research and development expenses increased by $3.1 million, or 33.9%, from $9.0 million for the year ended December 31, 2013 to $12.1 million for the year ended December 31, 2014. This increase was primarily attributable to a $2.8 million increase in personnel costs as a result of the growth in our research and development organization for continued enhancements to our solutions. The increase in personnel costs includes a $0.3 million increase in stock-based compensation expense allocated to research and development for the increase in the number of stock-based awards vesting during the period and the increased fair value of the awards vesting due to the increase in our stock price. In addition, there was a $0.3 million increase in facilities and other overhead costs. We anticipate that research and development expenses will increase in absolute dollars in the future as we continue to support and expand our platform and enhance our existing solutions.
Year Ended December 31, 2013 Compared to the Year Ended December 31, 2012. Research and development expenses increased by $3.7 million, or 69.8%, from $5.3 million for the year ended December 31, 2012 to $9.0 million for the year ended December 31, 2013. This increase was attributable to a $3.2 million increase in personnel costs as a result of the growth in our research and development organization for continued enhancements to our solutions, a $0.3 million increase in facilities and other overhead costs and a $0.2 million increase in travel and other development costs. We reclassified to cost of revenues an additional $0.2 million of costs related to research and development personnel who perform services related to implementation and customer support.
General and Administrative
Year Ended December 31, | Change | Year Ended December 31, | Change | |||||||||||||||||||||||||||
2014 | 2013 | $ | (%) | 2013 | 2012 | $ | (%) | |||||||||||||||||||||||
General and administrative | $ | 16,991 | $ | 11,742 | $ | 5,249 | 44.7 | % | $ | 11,742 | $ | 8,780 | $ | 2,962 | 33.7 | % | ||||||||||||||
Percentage of revenues | 21.5 | % | 20.6 | % | 20.6 | % | 21.4 | % | ||||||||||||||||||||||
Year Ended December 31, 2014 Compared to the Year Ended December 31, 2013. General and administrative expenses increased by $5.2 million, or 44.7%, from $11.7 million for the year ended December 31, 2013 to $17.0 million for the year ended December 31, 2014. The increase in general and administrative expenses was primarily attributable to a $4.0 million increase in personnel costs to support the growth of our business. The increase in personnel costs includes a $1.8 million increase in stock-based compensation expense allocated to general and administrative expenses for the increase in the number of stock-based awards vesting during the period and the increased fair value of the awards vesting due to the increase in our stock price. The remaining increase was attributable to a $0.8 million increase in corporate insurance expense due to our IPO in March 2014, a $0.2 million increase in facilities and other overhead costs, a $0.1 million increase in information technology and other corporate expenses associated with our continued efforts to enhance and improve our infrastructure, and a $0.1 million increase in executive travel associated with developing relations with the investor community. We anticipate that general and administrative expenses will increase in absolute dollars in the future as a result of being a public company. General and administrative expenses include costs to comply with Section 404 of the Sarbanes-Oxley Act and other regulations governing public companies, increased costs of directors' and officers' liability insurance, and increased professional services expenses and costs associated with enhanced investor relations activities. We expect such expenses to decline as a percentage of our revenues over time as our revenues grow.
53
Year Ended December 31, 2013 Compared to the Year Ended December 31, 2012. General and administrative expenses increased by $3.0 million, or 33.7%, from $8.8 million for the year ended December 31, 2012 to $11.7 million for the year ended December 31, 2013. The increase in general and administrative expenses was attributable to a $2.0 million increase in personnel costs to support the growth of our business and preparation for our initial public offering process, a $0.7 million increase in professional services costs related to accounting and tax services, legal services and other professional services related to internal systems implementations and a $0.3 million increase in facilities and other overhead costs.
Seasonality and Quarterly Results
Our overall operating results fluctuate from quarter to quarter as a result of a variety of factors, including the timing of investments in growing our business. The timing of our implementation activities and corresponding revenues from new customers are subject to fluctuation based on the timing of our sales. Sales may tend to be lower in the first quarter of each year than in subsequent quarters for such year, but any resulting impact on our results of operation has been difficult to measure due to the timing of our implementations and overall growth in our business. The timing of our implementations also vary period-to-period based on our implementation capacity, the number of solutions purchased by our customers, the size and unique needs of our customers and the readiness of our customers to implement our solutions. Our solutions are often the most frequent point of interaction between our customers and their account holders. As a result, we and our customers are very deliberate and careful in our implementation activities to help ensure a successful roll-out of the solutions to account holders and increase the registration of new users. Unusually long or short implementations, for even a small number of customers, may result in short-term quarterly variability in our results of operations.
Our quarterly results of operations may vary significantly in the future, and period-to-period comparisons of our operating results may not be meaningful and should not be relied upon as an indication of future results.
Liquidity and Capital Resources
Sources of Liquidity
Since our inception, we have financed our operations primarily through the proceeds from the issuance of our preferred stock, issuance of common stock in our IPO, borrowings under credit facilities and cash flows from operations. At December 31, 2014, our principal sources of liquidity were cash, cash equivalents and investments of $88.9 million and $22.0 million of available borrowings under our Credit Facility.
Cash Flows
The following table summarizes our cash flows for the periods indicated (in thousands):
Year Ended December 31, | ||||||||||||
2014 | 2013 | 2012 | ||||||||||
Net cash provided by (used in): | ||||||||||||
Operating activities | $ | (5,286 | ) | $ | (1,507 | ) | $ | (3,009 | ) | |||
Investing activities | (26,735 | ) | (11,309 | ) | (2,606 | ) | ||||||
Financing activities | 81,325 | 22,380 | (637 | ) | ||||||||
Net increase (decrease) in cash and cash equivalents | $ | 49,304 | $ | 9,564 | $ | (6,252 | ) | |||||
Cash Flows from Operating Activities
Cash used in operating activities is primarily influenced by the amount and timing of customer receipts and vendor payments and by the amount of cash we invest in personnel and infrastructure to support the anticipated growth of our business and increase the number of installed customers.
For the year ended December 31, 2014, our net cash and cash equivalents used in operating activities were $5.3 million, which consisted of a net loss of $19.6 million, offset by cash inflows from changes in operating assets and liabilities of $1.1 million and non-cash adjustments of $13.3 million. Cash inflows were the result of a $9.2 million increase in deferred revenue due to increased payments and deposits received from customers prior to the recognition of revenue from those related payments and a $4.0 million decrease in accounts receivable due to the timing of billings at the end of the prior year and
54
increased collection efforts. Cash outflows are the result of a $9.2 million increase in deferred solution and implementation costs due to our increased customer growth and new and existing customers undergoing implementations during the period, a $2.2 million decrease in accounts payable and accrued liabilities due to the timing of payments in support of our expanding customer base and related growth in our technical infrastructure and a net change in other assets and liabilities of $0.7 million. Non-cash items consisted primarily of $4.4 million of amortization of deferred implementation and deferred solution and other costs, $4.1 million of depreciation and amortization expense due to growth in our fixed asset base, and $4.6 million of stock-based compensation expense.
For the year ended December 31, 2013, our net cash and cash equivalents used by operating activities of $1.5 million primarily consisted of a net loss of $17.9 million, partially offset by $8.6 million of cash provided by changes in operating assets and liabilities and $8.0 million attributable to non-cash items. Increases in deferred revenues of $9.7 million, offset by a $3.3 million increase in accounts receivable, are the result of increases in customer prepayments and growth in the number of registered users and transactions processed on our solutions. Increases in deferred implementation costs and deferred solution and other costs of $3.2 million and $4.0 million, respectively, are due to an increase in the number of new customers for whom solutions were being implemented during the period. Net increases in accrued liabilities of $5.5 million are attributable to increased spending in support of our expanding customer base and related growth in our technical infrastructure. Non-cash items consisted primarily of $3.0 million of depreciation and amortization expense due to growth in our fixed asset base and data center and other technical infrastructure to support our customer growth, $2.8 million of amortization of deferred implementation and deferred solution and other costs and $1.6 million of stock based compensation expense attributable to staffing increases and the related increase in option grants.
For the year ended December 31, 2012, our net cash and cash equivalents used by operating activities of $3.0 million consisted of a net loss of $8.8 million, partially offset by $1.0 million of cash provided by changes in operating assets and liabilities and $5.9 million in adjustments for non-cash items. Increases in deferred revenues of $4.3 million, offset by a $2.0 million increase in accounts receivable, are the result of increases in customer prepayments and growth in the number of registered users and transactions processed on our solutions. Increases in deferred implementation costs and deferred solution and other costs of $2.6 million and $1.7 million, respectively are due to an increase in the number of new customers undergoing implementation during the period. Net increases in accounts payable and accrued liabilities of $1.9 million and $1.1 million, respectively, are attributable to increased spending in support of our expanding customer base and infrastructure growth. Non-cash items consisted primarily of $1.7 million of depreciation and amortization expense due to growth in our fixed asset base and increased customer activity, $1.9 million of amortization of deferred implementation and deferred solution and other costs and $1.0 million of stock based compensation expense attributable to staffing increases and the related increase in option grants. We also incurred a non-cash charge of $1.3 million from loss from discontinued operations offset by $1.1 million in cash used in discontinued operations.
Cash Flows from Investing Activities
Our investing activities have consisted primarily of purchases of investments and purchases of property and equipment to support our growth. Purchases of property and equipment may vary from period to period due to the timing of the expansion of our operations and data center and other technical infrastructure.
For the year ended December 31, 2014, net cash used in investing activities was $26.7 million, consisting primarily of $23.2 million for the purchase of investments, partially offset by $2.2 million in maturities of investments, $5.0 million for the purchase of property and equipment, and a $0.7 million increase in restricted cash for the deposit securing the lease for the expansion of our corporate headquarters.
For the year ended December 31, 2013, net cash used in investing activities was $11.3 million, of which $11.1 million was for the purchase of property and equipment and $0.1 million was for acquired technology and related intangible assets. During the second quarter of 2013, we incurred capital expenditures related to our move to our new corporate offices. During the third quarter of 2013, we made significant investments in our data center and other technical infrastructure.
For the year ended December 31, 2012, net cash used in investing activities was $2.6 million, of which $1.8 million was for equipment purchases and $0.4 million was for acquired technology and related intangible assets.
55
Cash Flows from Financing Activities
Our financing activities have consisted primarily of net proceeds from the issuance of common stock in our IPO, proceeds from the issuance of preferred stock prior to our IPO, proceeds from the exercises of options to purchase common stock and payments on capital lease obligations as well as proceeds from, and repayments on, our Credit Facility.
For the year ended December 31, 2014, net cash provided by financing activities was $81.3 million, consisting primarily of proceeds from the completion of our IPO in March 2014. We received $86.3 million in net proceeds from our IPO after deducting the payment of underwriters' discounts and commissions and offering costs. In addition, we made draws of $12.5 million on our Credit Facility, and we received $2.0 million from the exercise of stock options, which were partially offset by payments of $18.7 million on our Credit Facility and $0.7 million on capital lease obligations.
For the year ended December 31, 2013, net cash provided by financing activities was $22.4 million, consisting primarily of proceeds from the issuance of preferred stock and borrowings on our line of credit. We raised $19.0 million, net of issuance costs, from the issuance of our Series C preferred stock, and increased our line of credit borrowings by $3.7 million. We also received $0.4 million from the exercise of stock options and made payments of $0.7 million on capital lease obligations.
For the year ended December 31, 2012, net cash used by financing activities was $0.6 million, consisting primarily of $0.7 million for payments on capital lease obligations.
Contractual Obligations and Commitments
Our principal commitments consist of obligations under our credit facility, non-cancellable capital and operating leases related to our facilities and equipment and minimum purchase commitments for our third-party products, co-location fees, other product costs and data center hardware and software purchases. We are party to several purchase commitments for third-party products that contain both a contractual minimum obligation and a variable obligation based upon usage or other factors which can change on a monthly basis. The estimated amounts for usage and other factors are not included within the table below.
The following table summarizes our contractual obligations and commitments at December 31, 2014 (in thousands):
Payment due by period | ||||||||||||||||||||
Contractual Obligations: | Less Than 1 Year | 1 to 3 Years | 3 to 5 Years | More Than 5 Years | Total | |||||||||||||||
Interest payments - line of credit | $ | — | $ | 13 | $ | — | $ | — | $ | 13 | ||||||||||
Operating lease obligations | 2,054 | 6,313 | 6,824 | 13,446 | 28,637 | |||||||||||||||
Capital lease obligations | 418 | 168 | — | — | 586 | |||||||||||||||
Purchase commitments | 10,465 | 10,846 | 8,324 | 4,092 | 33,727 | |||||||||||||||
Total | $ | 12,937 | $ | 17,340 | $ | 15,148 | $ | 17,538 | $ | 62,963 | ||||||||||
In April 2013, we entered into a secured credit facility with Wells Fargo which provides a line of credit up to $25.0 million and is described in Note 8 to our consolidated financial statements appearing elsewhere in this Annual Report on Form 10-K. The amount that can be borrowed under the line of credit is limited to the lesser of $25.0 million or 75% of our trailing twelve-month recurring revenues. Access to total borrowings available under the line of credit is restricted based on covenants related to our minimum liquidity, trailing twelve-months recurring revenues and adjusted EBITDA. Amounts borrowed under the line of credit accrue interest, on our election, at either (i) the per annum rate equal to the LIBOR rate plus an applicable margin, or (ii) the current base rate plus the greater of the U.S. Federal Funds rate plus one percentage point, the one month LIBOR plus one percentage point, or the lending financial institution's prime rate.
In August 2014, we entered into an amendment to our Credit Facility which modified the Credit Facility to add an accordion feature and modified or eliminated certain of our financial covenants and fees under the Credit Facility. The amendment also removed the requirement for us to maintain advances of any minimum amount. We pay a monthly fee based on the total unused borrowings balance, an annual administrative fee and the initial closing fee, which is paid in three equal installments over the first three years of the credit facility. The Credit Facility matures in April 2017, at which time any outstanding borrowings and accrued interest become payable. As of December 31, 2014, we had no borrowings outstanding, only a secured letter of credit of $3.0 million against the line, leaving an available balance of $22.0 million. The line of credit is
56
collateralized by substantially all of our assets and requires that we maintain certain financial covenants as defined in the Credit Facility, as amended. As of December 31, 2014, we were in compliance with all such covenants.
Off-Balance Sheet Arrangements
As of December 31, 2014, we did not have any off-balance sheet arrangements, as defined in Item 303(a)(4)(ii) of SEC Regulation S-K, such as the use of unconsolidated subsidiaries, structured finance, special purpose entities or variable interest entities.
Recent Accounting Pronouncements
In May 2014, the Financial Accounting Standards Board issued Accounting Standards Update No. 2014-09, Revenue from Contracts with Customers (Topic 606), or ASU 2014-09, which amends the existing accounting standards for revenue recognition. ASU 2014-09 is based on principles that govern the recognition of revenue at an amount an entity expects to be entitled to when products are transferred to customers. ASU 2014-09 will be effective for us beginning in its first quarter of 2017. Early adoption is not permitted. The new revenue standard may be applied retrospectively to each prior period presented or retrospectively with the cumulative effect recognized as of the date of adoption. We are currently evaluating the impact of adopting the new revenue standard on our consolidated financial statements.
JOBS Act
The Jumpstart Our Business Startups Act of 2012, or JOBS Act, contains provisions that, among other things, reduce certain reporting requirements for qualifying public companies. As defined in the JOBS Act, a public company whose initial public offering of common equity securities occurred after December 8, 2011 and whose annual gross revenues are less than $1.0 billion will, in general, qualify as an "emerging growth company" until the earliest of:
• | the last day of its fiscal year following the fifth anniversary of the date of its initial public offering of common equity securities; |
• | the last day of its fiscal year in which it has annual gross revenue of $1.0 billion or more; |
• | the date on which it has, during the previous three-year period, issued more than $1.0 billion in non-convertible debt; and |
• | the date on which it is deemed to be a "large accelerated filer," which will occur at such time as the company (a) has an aggregate worldwide market value of common equity securities held by non-affiliates of $700 million or more as of the last business day of its most recently completed second fiscal quarter, (b) has been required to file annual and quarterly reports under the Exchange Act for a period of at least 12 months and (c) has filed at least one annual report pursuant to the Exchange Act. |
Under this definition, we are an "emerging growth company" and could remain one until as late as December 31, 2019.
As an "emerging growth company" we have chosen to rely on such exemptions and are therefore not required to, among other things, (i) provide an auditor's attestation report on our system of internal controls over financial reporting pursuant to Section 404 of the Sarbanes-Oxley Act, (ii) provide all of the compensation disclosure that may be required of non-emerging growth public companies under the Dodd-Frank Wall Street Reform and Consumer Protection Act, (iii) comply with any requirement that may be adopted by the Public Company Accounting Oversight Board regarding mandatory audit firm rotation or a supplement to the auditor's report providing additional information about the audit and the financial statements (auditor discussion and analysis) and (iv) disclose certain executive compensation-related items such as the correlation between executive compensation and performance and comparisons of the Chief Executive Officer's compensation to median employee compensation.
In addition, Section 107 of the JOBS Act also provides that an emerging growth company can take advantage of the extended transition period provided in Section 7(a)(2)(B) of the Securities Act for complying with new or revised accounting standards. In other words, an emerging growth company can delay the adoption of certain accounting standards until those standards would otherwise apply to private companies. However, we have chosen to "opt out" of such extended transition period, and as a result, we will comply with new or revised accounting standards on the relevant dates on which adoption of such standards is required for non-emerging growth companies. Section 107 of the JOBS Act provides that our decision to opt out of the extended transition period for complying with new or revised accounting standards is irrevocable.
57
Item 7A. Quantitative and Qualitative Disclosures About Market Risk.
Market risk is the risk of loss to future earnings, values or future cash flows that may result from changes in the price of a financial instrument. The value of a financial instrument might change as a result of changes in interest rates, exchange rates, commodity prices, equity prices and other market changes. We do not use derivative financial instruments for speculative, hedging or trading purposes, although in the future we might enter into exchange rate hedging arrangements to manage the risks described below.
Interest Rate Risk
We are exposed to market risk related to changes in interest rates. Borrowings under our Credit Facility bear interest at rates that are variable. Increases in the LIBOR or prime rate would increase the amount of interest payable on outstanding borrowings on our Credit Facility. For the years ended December 31, 2014, 2013 and 2012, a 10% change in either the LIBOR or prime rate would not have had a material impact on our interest expense or cash flows. We do not believe that an increase or decrease in interest rates of 100-basis points would have a material effect on our operating results or financial condition.
Foreign Currency Risk
Our results of operations and cash flows are not subject to fluctuations due to changes in foreign currency exchange rates. We bill our customers in U.S. dollars and receive payment in U.S. dollars, and substantially all of our operating expenses are denominated in U.S. dollars. If we grow sales of our solutions outside the U.S., our agreements with foreign customers may not be denominated in U.S. dollars, and we may become subject to changes in currency exchange rates.
Inflation Risk
We do not believe that inflation has had a material effect on our business, financial condition or results of operations. We continue to monitor the impact of inflation in order to reduce its effects through pricing strategies, productivity improvements and cost reductions. If our costs were to become subject to significant inflationary pressures, we may not be able to fully offset such higher costs through price increases. Our inability or failure to do so could harm our business, financial condition and results of operations.
Item 8. Financial Statements and Supplementary Data.
The information required by this item is incorporated by reference to the consolidated financial statements and accompanying notes set forth on pages F-1 through F-30 of this Annual Report on Form 10-K.
Item 9. Change in and Disagreements With Accountants on Accounting and Financial Disclosure.
None.
Item 9A. Controls and Procedures.
Disclosure Controls and Procedures
The term "disclosure controls and procedures," as defined in Rules 13a-15(e) and 15d-15(e) under the Exchange Act refers to controls and procedures that are designed to ensure that information required to be disclosed by a company in the reports that it files or submits under the Exchange Act is recorded, processed, summarized and reported, within the time periods specified in the SEC's rules and forms. Disclosure controls and procedures include, without limitation, controls and procedures designed to ensure that such information is accumulated and communicated to a company's management, including its principal executive and principal financial officers, as appropriate to allow timely decisions regarding required disclosure.
Our management, with the participation of our Chief Executive Officer and Chief Financial Officer, has evaluated the effectiveness of our disclosure controls and procedures as of December 31, 2014, the end of the period covered by this Annual Report on Form 10-K. Based upon such evaluation, our Chief Executive Officer and Chief Financial Officer have concluded that our disclosure controls and procedures were effective as of such date.
58
Management’s Annual Report on Internal Control over Financial Reporting
This Annual Report on Form 10-K does not include a report of management's assessment regarding internal control over financial reporting or an attestation report of our registered public accounting firm due to a transition period established by rules of the SEC for newly public companies and our status as an "emerging growth company" under the JOBS Act.
Changes in Internal Control over Financial Reporting
There were no changes in our internal control over financial reporting that occurred during the quarter ended December 31, 2014 that have materiality affected, or are reasonably likely to materially affect, our internal control over financial reporting.
Limitations on Controls
Our disclosure controls and procedures and internal control over financial reporting are designed to provide reasonable assurance of achieving their objectives as specified above. Management does not expect, however, that our disclosure controls and procedures or our internal control over financial reporting will prevent or detect all error and fraud. Any control system, no matter how well designed and operated, is based upon certain assumptions and can provide only reasonable, not absolute, assurance that its objectives will be met. Further, no evaluation of controls can provide absolute assurance that misstatements due to error or fraud will not occur or that all control issues and instances of fraud, if any, within the Company have been detected.
Item 9B. Other Information.
Not applicable.
59
PART III
Item 10. Directors, Executive Officers and Corporate Governance.
Information required by Part III, Item 10, will be included in our Proxy Statement relating to our 2015 annual meeting of stockholders to be filed with the SEC within 120 days after the end of our fiscal year ended December 31, 2014, and is incorporated herein by reference.
Item 11. Executive Compensation.
Information required by Part III, Item 11, will be included in our Proxy Statement relating to our 2015 annual meeting of stockholders to be filed with the SEC within 120 days after the end of our fiscal year ended December 31, 2014, and is incorporated herein by reference.
Item 12. Security Ownership of Certain Beneficial Owners and Management and Related Stockholder Matters.
Information required by Part III, Item 12, will be included in our Proxy Statement relating to our 2015 annual meeting of stockholders to be filed with the SEC within 120 days after the end of our fiscal year ended December 31, 2014, and is incorporated herein by reference.
Item 13. Certain Relationships and Related Transactions, and Director Independence.
Information required by Part III, Item 13, will be included in our Proxy Statement relating to our 2015 annual meeting of stockholders to be filed with the SEC within 120 days after the end of our fiscal year ended December 31, 2014, and is incorporated herein by reference.
Item 14. Principal Accounting Fees and Services.
Information required by Part III, Item 14, will be included in our Proxy Statement relating to our 2014 annual meeting of stockholders to be filed with the SEC within 120 days after the end of our fiscal year ended December 31, 2014, and is incorporated herein by reference.
60
Part IV.
Item 15. Exhibits, Financial Statement Schedules.
(a) Documents Filed with Report
(1) Financial Statements.
(2) Financial Statement Schedules.
Schedules required by this item have been omitted since they are either not required or not applicable or because the information required is included in the consolidated financial statements included elsewhere herein or the notes thereto.
(3) Exhibits.
The information required by this Item is set forth on the exhibit index that follows the signature page of this Annual Report on Form 10-K.
61
SIGNATURES
Pursuant to the requirements of Section 13 or 15(d) of the Securities Exchange Act of 1934, the registrant has duly caused this report to be signed on its behalf by the undersigned, thereunto duly authorized.
Date: | Q2 HOLDINGS, INC. | |||
February 12, 2015 | By: | /s/ MATTHEW P. FLAKE | ||
Matthew P. Flake President and Chief Executive Officer | ||||
SIGNATURES AND POWER OF ATTORNEY
Each person whose individual signature appears below hereby authorizes and appoints Matthew P. Flake, with full power of substitution and re-substitution and full power to act without the other, as his or her true and lawful attorney-in-fact and agent to act in his or her name, place and stead and to execute in the name and on behalf of each person, individually and in each capacity stated below, and to file any and all amendments to this Annual Report on Form 10-K, and to file the same, with all exhibits thereto, and other documents in connection therewith, with the Securities and Exchange Commission, granting unto said attorney-in-fact and agents, and each of them, full power and authority to do and perform each and every act and thing, ratifying and confirming all that said attorney-in-fact and agents or any of them or their or his substitute or substitutes may lawfully do or cause to be done by virtue thereof.
Pursuant to the requirements of the Securities Exchange Act of 1934, this report has been signed below by the following persons on behalf of the registrant and in the capacities indicated.
Name | Title | Date | ||||
/s/ MATTHEW P. FLAKE | President, Chief Executive Officer (Principal Executive Officer) and Director | February 12, 2015 | ||||
Matthew P. Flake | ||||||
/s/ JENNIFER N. HARRIS | Chief Financial Officer (Principal Financial and Accounting Officer) | February 12, 2015 | ||||
Jennifer N. Harris | ||||||
/s/ R. H. "HANK" SEALE, III | Executive Chairman of the Board of Directors | February 12, 2015 | ||||
R.H. "Hank" Seale, III | ||||||
/s/ MICHAEL M. BROWN | Director | February 12, 2015 | ||||
Michael M. Brown | ||||||
/s/ JEFFREY T. DIEHL | Director | February 12, 2015 | ||||
Jeffrey T. Diehl | ||||||
/s/ CHARLES T. DOYLE | Director | February 12, 2015 | ||||
Charles T. Doyle | ||||||
/s/ MICHAEL J. MAPLES, SR. | Director | February 12, 2015 | ||||
Michael J. Maples, Sr. | ||||||
/s/ JAMES R. OFFERDAHL | Director | February 12, 2015 | ||||
James R. Offerdahl | ||||||
/s/ CARL JAMES SCHAPER | Director | February 12, 2015 | ||||
Carl James Schaper | ||||||
62
Q2 HOLDINGS, INC.
INDEX TO CONSOLIDATED FINANCIAL STATEMENTS
Page | |
F-1
Report of Independent Registered Public Accounting Firm
The Board of Directors and Stockholders of Q2 Holdings, Inc.
We have audited the accompanying consolidated balance sheets of Q2 Holdings, Inc. as of December 31, 2014 and 2013, and the related consolidated statements of comprehensive loss, changes in stockholders’ equity (deficit) and cash flows for each of the three years in the period ended December 31, 2014. These financial statements are the responsibility of the Company’s management. Our responsibility is to express an opinion on these financial statements based on our audits.
We conducted our audits in accordance with the standards of the Public Company Accounting Oversight Board (United States). Those standards require that we plan and perform the audit to obtain reasonable assurance about whether the financial statements are free of material misstatement. We were not engaged to perform an audit of the Company’s internal control over financial reporting. Our audits included consideration of internal control over financial reporting as a basis for designing audit procedures that are appropriate in the circumstances, but not for the purpose of expressing an opinion on the effectiveness of the Company’s internal control over financial reporting. Accordingly, we express no such opinion. An audit also includes examining, on a test basis, evidence supporting the amounts and disclosures in the financial statements, assessing the accounting principles used and significant estimates made by management, and evaluating the overall financial statement presentation. We believe that our audits provide a reasonable basis for our opinion.
In our opinion, the financial statements referred to above present fairly, in all material respects, the consolidated financial position of Q2 Holdings, Inc. at December 31, 2014 and 2013, and the consolidated results of its operations and its cash flows for each of the three years in the period ended December 31, 2014, in conformity with U.S. generally accepted accounting principles.
/s/ Ernst & Young LLP
Austin, Texas
February 12, 2015
F-2
Q2 HOLDINGS, INC.
CONSOLIDATED BALANCE SHEETS
(in thousands, except per share data)
December 31, | ||||||||
2014 | 2013 | |||||||
Assets | ||||||||
Current assets: | ||||||||
Cash and cash equivalents | $ | 67,979 | $ | 18,675 | ||||
Restricted cash | 829 | 116 | ||||||
Investments | 20,956 | — | ||||||
Accounts receivable, net | 5,007 | 9,063 | ||||||
Prepaid expenses and other current assets | 2,695 | 1,079 | ||||||
Deferred solution and other costs, current portion | 5,060 | 3,124 | ||||||
Deferred implementation costs, current portion | 1,996 | 1,814 | ||||||
Total current assets | 104,522 | 33,871 | ||||||
Property and equipment, net | 18,521 | 14,831 | ||||||
Deferred solution and other costs, net of current portion | 7,159 | 5,358 | ||||||
Deferred implementation costs, net of current portion | 5,378 | 4,560 | ||||||
Other long-term assets | 1,226 | 2,488 | ||||||
Total assets | $ | 136,806 | $ | 61,108 | ||||
Liabilities, redeemable convertible preferred stock, redeemable common stock and stockholders' equity (deficit) | ||||||||
Current liabilities: | ||||||||
Accounts payable | $ | 1,986 | $ | 4,085 | ||||
Accrued liabilities | 9,268 | 7,288 | ||||||
Accrued compensation | 3,936 | 4,376 | ||||||
Deferred revenues, current portion | 17,289 | 12,728 | ||||||
Capital lease obligations, current portion | 408 | 714 | ||||||
Total current liabilities | 32,887 | 29,191 | ||||||
Deferred revenues, net of current portion | 19,436 | 14,773 | ||||||
Capital lease obligations, net of current portion | 167 | 575 | ||||||
Long-term debt, net of current portion | — | 6,288 | ||||||
Deferred rent, net of current portion | 4,694 | 4,444 | ||||||
Other long-term liabilities | 682 | 101 | ||||||
Total liabilities | 57,866 | 55,372 | ||||||
Commitments and contingencies (Note 9) | ||||||||
Redeemable convertible preferred stock and redeemable common stock: | ||||||||
Series A preferred stock: $0.0001 par value; no shares authorized, issued or outstanding as of December 31, 2014, and 7,908 shares authorized, issued and outstanding as of December 31, 2013 | — | 10,815 | ||||||
Series B preferred stock: $0.0001 par value; no shares authorized, issued or outstanding as of December 31, 2014, and 1,818 shares authorized, issued and outstanding as of December 31, 2013 | — | 10,915 | ||||||
Series C preferred stock: $0.0001 par value; no shares authorized, issued or outstanding as of December 31, 2014, and 2,605 shares authorized, issued and outstanding as of December 31, 2013 | — | 18,995 | ||||||
Common stock: $0.0001 par value; no shares outstanding as of December 31, 2014, and 3,829 shares outstanding as of December 31, 2013 | — | 1,327 | ||||||
Stockholders' equity (deficit): | ||||||||
Junior convertible preferred stock: $0.0001 par value; no shares authorized, issued or outstanding as of December 31, 2014, and 1,251 shares authorized, issued and outstanding as of December 31, 2013 | — | 1,740 | ||||||
Preferred stock: $0.0001 par value; 5,000 shares authorized, no shares issued or outstanding as of December 31, 2014, and no shares authorized, issued and outstanding as of December 31, 2013 | — | — | ||||||
Common stock: $0.0001 par value; 150,000 shares authorized, 34,697 shares issued, and 34,696 shares outstanding as of December 31, 2014, and 35,000 shares authorized, 8,288 shares issued and outstanding as of December 31, 2013 | 3 | 1 | ||||||
Treasury stock at cost; 1 and zero shares at December 31, 2014 and 2013, respectively | (20 | ) | — | |||||
Additional paid-in capital | 143,337 | 6,675 | ||||||
Accumulated other comprehensive loss | (14 | ) | — | |||||
Accumulated deficit | (64,366 | ) | (44,732 | ) | ||||
Total stockholders' equity (deficit) | 78,940 | (36,316 | ) | |||||
Total liabilities, redeemable convertible preferred stock, redeemable common stock and stockholders' equity (deficit) | $ | 136,806 | $ | 61,108 | ||||
The accompanying notes are an integral part of these consolidated financial statements.
F-3
Q2 HOLDINGS, INC.
CONSOLIDATED STATEMENTS OF COMPREHENSIVE LOSS
(in thousands, except per share data)
Year Ended December 31, | ||||||||||||
2014 | 2013 | 2012 | ||||||||||
Revenues | $ | 79,129 | $ | 56,872 | $ | 41,101 | ||||||
Cost of revenues(1) | 46,054 | 36,261 | 25,170 | |||||||||
Gross profit | 33,075 | 20,611 | 15,931 | |||||||||
Operating expenses: | ||||||||||||
Sales and marketing(1) | 23,069 | 16,726 | 8,962 | |||||||||
Research and development(1) | 12,086 | 9,029 | 5,317 | |||||||||
General and administrative(1) | 16,991 | 11,742 | 8,780 | |||||||||
Unoccupied lease charges | — | 236 | — | |||||||||
Total operating expenses | 52,146 | 37,733 | 23,059 | |||||||||
Loss from operations | (19,071 | ) | (17,122 | ) | (7,128 | ) | ||||||
Other income (expense): | ||||||||||||
Interest and other income | 65 | 6 | 4 | |||||||||
Interest and other expense | (557 | ) | (505 | ) | (232 | ) | ||||||
Total other expense, net | (492 | ) | (499 | ) | (228 | ) | ||||||
Loss before income taxes | (19,563 | ) | (17,621 | ) | (7,356 | ) | ||||||
Provision for income taxes | (71 | ) | (55 | ) | (164 | ) | ||||||
Loss from continuing operations | (19,634 | ) | (17,676 | ) | (7,520 | ) | ||||||
Loss from discontinued operations, net of tax | — | (199 | ) | (1,259 | ) | |||||||
Net loss | $ | (19,634 | ) | $ | (17,875 | ) | $ | (8,779 | ) | |||
Other comprehensive loss: | ||||||||||||
Unrealized loss on available-for-sale investments | (14 | ) | — | — | ||||||||
Comprehensive loss | $ | (19,648 | ) | $ | (17,875 | ) | $ | (8,779 | ) | |||
Net loss per common share: | ||||||||||||
Loss from continuing operations per common share, basic and diluted | $ | (0.67 | ) | $ | (1.49 | ) | $ | (0.66 | ) | |||
Loss from discontinued operations per common share, basic and diluted | $ | — | $ | (0.02 | ) | $ | (0.11 | ) | ||||
Net loss per common share, basic and diluted | $ | (0.67 | ) | $ | (1.51 | ) | $ | (0.77 | ) | |||
Weighted average common shares outstanding: | ||||||||||||
Basic and diluted | 29,257 | 11,866 | 11,345 | |||||||||
_______________________________________________________________________________
(1) | Includes stock-based compensation expenses as follows: |
Year Ended December 31, | ||||||||||||
2014 | 2013 | 2012 | ||||||||||
Cost of revenues | $ | 623 | $ | 264 | $ | 187 | ||||||
Sales and marketing | 774 | 274 | 123 | |||||||||
Research and development | 527 | 257 | 195 | |||||||||
General and administrative | 2,646 | 810 | 526 | |||||||||
Total stock-based compensation expenses | $ | 4,570 | $ | 1,605 | $ | 1,031 | ||||||
The accompanying notes are an integral part of these consolidated financial statements.
F-4
Q2 HOLDINGS, INC.
CONSOLIDATED STATEMENTS CHANGES IN STOCKHOLDERS' EQUITY (DEFICIT)
(in thousands)
Junior Convertible Preferred Stock | Common Stock | |||||||||||||||||||||||||||||||||
Treasury Stock | Additional Paid-In Capital | Accumulated Other Comprehensive Loss | Accumulated Deficit | Total Stockholder's Equity (Deficit) | ||||||||||||||||||||||||||||||
Shares | Amount | Shares | Amount | |||||||||||||||||||||||||||||||
Balance at January 1, 2012 | 1,251 | $ | 1,740 | 11,337 | $ | 1 | $ | — | $ | 5,087 | $ | — | $ | (18,078 | ) | $ | (11,250 | ) | ||||||||||||||||
Stock-based compensation | — | — | — | — | — | 1,031 | — | — | 1,031 | |||||||||||||||||||||||||
Exercise of stock options | — | — | 42 | — | — | 17 | — | — | 17 | |||||||||||||||||||||||||
Net loss | — | — | — | — | — | — | — | (8,779 | ) | (8,779 | ) | |||||||||||||||||||||||
Balance at December 31, 2012 | 1,251 | 1,740 | 11,379 | 1 | — | 6,135 | — | (26,857 | ) | (18,981 | ) | |||||||||||||||||||||||
Stock-based compensation | — | — | — | — | — | 1,605 | — | — | 1,605 | |||||||||||||||||||||||||
Reclass to redeemable common stock | — | — | (3,829 | ) | — | — | (1,327 | ) | — | — | (1,327 | ) | ||||||||||||||||||||||
Exercise of stock options | — | — | 738 | — | — | 435 | — | — | 435 | |||||||||||||||||||||||||
Distribution associated with spin-off | — | — | — | — | — | (173 | ) | — | — | (173 | ) | |||||||||||||||||||||||
Net loss | — | — | — | — | — | — | — | (17,875 | ) | (17,875 | ) | |||||||||||||||||||||||
Balance at December 31, 2013 | 1,251 | 1,740 | 8,288 | 1 | — | 6,675 | — | (44,732 | ) | (36,316 | ) | |||||||||||||||||||||||
Stock-based compensation | — | — | — | — | — | 4,570 | — | — | 4,570 | |||||||||||||||||||||||||
Conversion of Series A, B, C Preferred Stock, Redeemable Common Stock, and Junior Preferred Stock into Common Stock on initial public offering | (1,251 | ) | (1,740 | ) | 17,412 | 1 | — | 43,790 | — | — | 42,051 | |||||||||||||||||||||||
Initial public offering, net of issuance costs | — | — | 7,414 | 1 | — | 86,285 | — | 86,286 | ||||||||||||||||||||||||||
Exercise of stock options | — | — | 1,583 | — | — | 2,017 | — | — | 2,017 | |||||||||||||||||||||||||
Shares acquired to settle the exercise of stock options | — | — | (1 | ) | — | (20 | ) | — | — | — | (20 | ) | ||||||||||||||||||||||
Other comprehensive loss | — | — | — | — | — | — | (14 | ) | — | (14 | ) | |||||||||||||||||||||||
Net loss | — | — | — | — | — | — | — | (19,634 | ) | (19,634 | ) | |||||||||||||||||||||||
Balance at December 31, 2014 | — | $ | — | 34,696 | $ | 3 | $ | (20 | ) | $ | 143,337 | $ | (14 | ) | $ | (64,366 | ) | $ | 78,940 | |||||||||||||||
The accompanying notes are an integral part of these consolidated financial statements.
F-5
Q2 HOLDINGS, INC.
CONSOLIDATED STATEMENTS OF CASH FLOWS
(in thousands)
Year Ended December 31, | ||||||||||||
2014 | 2013 | 2012 | ||||||||||
Cash flows from operating activities: | ||||||||||||
Net loss | $ | (19,634 | ) | $ | (17,875 | ) | $ | (8,779 | ) | |||
Adjustments to reconcile net loss to net cash used in operating activities: | ||||||||||||
Amortization of deferred implementation, solution and other costs | 4,435 | 2,837 | 1,869 | |||||||||
Depreciation and amortization | 4,083 | 2,971 | 1,697 | |||||||||
Amortization of debt issuance costs | 96 | 68 | — | |||||||||
Amortization of premiums on investments | 17 | — | — | |||||||||
Stock-based compensation expenses | 4,570 | 1,605 | 1,031 | |||||||||
Loss from discontinued operations | — | 199 | 1,259 | |||||||||
Allowance for sales credits | 65 | 57 | 51 | |||||||||
Loss on disposal of long-lived assets | — | 18 | 24 | |||||||||
Unoccupied lease charges | — | 236 | — | |||||||||
Changes in operating assets and liabilities: | ||||||||||||
Accounts receivable, net | 3,991 | (3,267 | ) | (2,013 | ) | |||||||
Prepaid expenses and other current assets | (628 | ) | (414 | ) | 124 | |||||||
Deferred solution and other costs | (5,329 | ) | (4,011 | ) | (1,728 | ) | ||||||
Deferred implementation costs | (3,842 | ) | (3,155 | ) | (2,625 | ) | ||||||
Other long-term assets | (244 | ) | (1,539 | ) | (182 | ) | ||||||
Accounts payable | (842 | ) | 1,326 | 1,949 | ||||||||
Accrued liabilities | (1,398 | ) | 5,523 | 1,094 | ||||||||
Deferred revenue | 9,224 | 9,706 | 4,299 | |||||||||
Deferred rent and other long-term liabilities | 150 | 4,444 | 41 | |||||||||
Net cash used in continuing operations | (5,286 | ) | (1,271 | ) | (1,889 | ) | ||||||
Net cash used in discontinued operating activities | — | (236 | ) | (1,120 | ) | |||||||
Net cash used in operating activities | (5,286 | ) | (1,507 | ) | (3,009 | ) | ||||||
Cash flows from investing activities: | ||||||||||||
Purchases of investments | (23,216 | ) | — | — | ||||||||
Maturities of investments | 2,230 | — | — | |||||||||
Purchases of property and equipment | (5,036 | ) | (11,138 | ) | (1,804 | ) | ||||||
Acquisitions and purchase of intangible assets | — | (125 | ) | (425 | ) | |||||||
Increase in restricted cash | (713 | ) | — | (116 | ) | |||||||
Cash included in distribution of spin-off | — | (46 | ) | — | ||||||||
Net cash used in continuing investing activities | (26,735 | ) | (11,309 | ) | (2,345 | ) | ||||||
Net cash used in discontinued investing activities | — | — | (261 | ) | ||||||||
Net cash used in investing activities | (26,735 | ) | (11,309 | ) | (2,606 | ) | ||||||
Cash flows from financing activities: | ||||||||||||
Proceeds from issuance of preferred stock, net of issuance costs | — | 18,995 | — | |||||||||
Proceeds from borrowings on line of credit | 12,500 | 6,350 | — | |||||||||
Payments on line of credit | (18,710 | ) | (2,682 | ) | — | |||||||
Payments on capital lease obligations | (748 | ) | (718 | ) | (654 | ) | ||||||
Proceeds from the issuance of common stock, net of issuance costs | 86,286 | — | — | |||||||||
Proceeds from exercise of stock options to purchase common stock | 2,017 | 435 | 17 | |||||||||
Shares acquired to settle the exercise of stock options | (20 | ) | — | — | ||||||||
Net cash provided by (used in) financing activities | 81,325 | 22,380 | (637 | ) | ||||||||
Net increase (decrease) in cash and cash equivalents | 49,304 | 9,564 | (6,252 | ) | ||||||||
Cash and cash equivalents, beginning of period | 18,675 | 9,111 | 15,363 | |||||||||
Cash and cash equivalents, end of period | $ | 67,979 | $ | 18,675 | $ | 9,111 | ||||||
Supplemental disclosures of cash flow information: | ||||||||||||
Cash paid for taxes | $ | 55 | $ | 164 | $ | 199 | ||||||
Cash paid for interest | $ | 419 | $ | 377 | $ | 184 | ||||||
Supplemental disclosure of non-cash investing activities: | ||||||||||||
Equipment acquired under capital lease | $ | — | $ | 975 | $ | 1,185 | ||||||
Data center assets acquired under financing arrangements | $ | 5,209 | $ | — | $ | — | ||||||
The accompanying notes are an integral part of these consolidated financial statements.
F-6
Q2 HOLDINGS, INC.
NOTES TO CONSOLIDATED FINANCIAL STATEMENTS
(in thousands, except per share amounts and unless otherwise indicated)
1. Organization and Description of Business
Q2 Holdings, Inc., or the Company, is a leading provider of secure, cloud-based virtual banking solutions. The Company enables regional and community financial institutions, or RCFIs, to deliver a robust suite of integrated virtual banking services and more effectively engage with their retail and commercial account holders who expect to bank anytime, anywhere and on any device. The Company delivers its solutions to the substantial majority of its customers using a software-as-a-service, or SaaS, model under which its RCFI customers pay subscription fees for the use of the Company's solutions.
The Company, formerly known as CBG Holdings, Inc., was incorporated in Delaware in March 2005 and is a holding company that owns 100% of the outstanding capital stock of Q2 Software, Inc. On March 1, 2013, the Company reorganized its business operations in conjunction with the private placement of its Series C redeemable convertible preferred stock. Prior to the reorganization, the Company owned 100% of the outstanding capital stock of cbanc Network Inc., or cbanc. Pursuant to the reorganization, the Company distributed all shares of cbanc to its stockholders in a spin-off, and the Company was renamed Q2 Holdings, Inc.
The Company's headquarters are located in Austin, Texas.
2. Summary of Significant Accounting Policies
Basis of Presentation and Principles of Consolidation
As used in this report, the terms "the Company," "we," "us," or "our" refer to Q2 Holdings, Inc. and its wholly-owned subsidiary. These consolidated financial statements have been prepared in accordance with accounting principles generally accepted in the United States, or GAAP, and Securities and Exchange Commission, or SEC, requirements. The consolidated financial statements include the accounts of the Company and its wholly-owned subsidiaries. All intercompany accounts and transactions have been eliminated in consolidation.
Use of Estimates
The preparation of the accompanying consolidated financial statements in conformity with GAAP requires management to make estimates and assumptions that affect the reported amounts of assets and liabilities, disclosure of contingent assets and liabilities at the date of the consolidated financial statements, and the reported amounts of revenues and expenses. Significant items subject to such estimates include stock-based compensation, the useful lives of property and equipment and income taxes. In accordance with GAAP, management bases its estimates on historical experience and on various other assumptions that management believes are reasonable under the circumstances. Management regularly evaluates its estimates and assumptions using historical experience and other factors; however, actual results could differ significantly from those estimates.
Cash and Cash Equivalents
The Company considers all highly liquid investments acquired with an original maturity of ninety days or less at the date of purchase to be cash equivalents. Cash equivalents are stated at cost or fair value based on the underlying security.
F-7
Q2 HOLDINGS, INC.
NOTES TO CONSOLIDATED FINANCIAL STATEMENTS
(in thousands, except per share amounts and unless otherwise indicated)
Restricted Cash
Restricted cash consists of deposits held in checking and money market accounts for leased office space.
Investments
Investments consist primarily of U.S. government agency bonds, corporate bonds, commercial paper, certificates of deposits and money market funds. All investments are considered available for sale and are carried at fair value.
Concentration of Credit Risk
Financial instruments that potentially subject the Company to concentrations of credit risk consist of cash and cash equivalents, restricted cash, investments and accounts receivable. The Company's cash and cash equivalents and restricted cash are placed with high credit quality financial institutions and issuers, and at times may exceed federally-insured limits. The Company has not experienced any loss relating to cash and cash equivalents or restricted cash in these accounts. The Company provides credit, in the normal course of business, to a number of its customers. The Company performs periodic credit evaluations of its customers' financial condition and generally does not require collateral. No individual customer accounted for 10% or more of revenues for each of the years ended December 31, 2014, 2013 and 2012. No individual customer accounted for 10% or more of accounts receivable, net, as of December 31, 2014 or 2013.
Accounts Receivable
Accounts receivable are stated at net realizable value, including both billed and unbilled receivables to customers. Unbilled receivable balances arise primarily when the Company provides services in advance of billing for these services and also when the Company earns revenues based on the number of registered users and the number of bill-pay and certain other transactions that registered users perform on the Company's virtual banking solutions in excess of the levels included in the Company's minimum subscription fee. Generally, billing for such revenues related to the number of registered users and the number of transactions processed by our registered users occurs one month in arrears. Included in the accounts receivable balances as of December 31, 2014 and 2013 were unbilled receivables of $2.3 million and $1.8 million, respectively.
The Company assesses the collectability of outstanding accounts receivable on an ongoing basis and maintains an allowance for doubtful accounts for accounts receivable deemed uncollectable. This allowance is recorded as a reduction against accounts receivable. As of December 31, 2014 and 2013, the Company did not provide for an allowance for doubtful accounts, as all amounts outstanding were deemed collectable. Historically, the Company's collection experience has not varied significantly, and bad debt expenses have been insignificant.
The Company maintains a reserve for estimated sales credits issued to customers for billing disputes or other service-related reasons. This allowance is recorded as a reduction against current period revenues and accounts receivable. In estimating this allowance, the Company analyzes prior periods to determine the amounts of sales credits issued to customers compared to the revenues in the period that related to the original customer invoice. This estimate is analyzed quarterly and adjusted as necessary.
The following table shows the Company's allowance for sales credits as follows:
Beginning Balance | Additions | Deductions | Ending Balance | |||||||||||||
Year Ended December 31, 2012 | $ | — | $ | 51 | $ | — | $ | 51 | ||||||||
Year Ended December 31, 2013 | 51 | 290 | (233 | ) | 108 | |||||||||||
Year Ended December 31, 2014 | $ | 108 | $ | 399 | $ | (334 | ) | $ | 173 | |||||||
F-8
Q2 HOLDINGS, INC.
NOTES TO CONSOLIDATED FINANCIAL STATEMENTS
(in thousands, except per share amounts and unless otherwise indicated)
Deferred Implementation Costs
The Company capitalizes certain personnel and other costs, such as employee salaries, benefits and the associated payroll taxes that are direct and incremental to the implementation of its solutions. The Company analyzes implementation costs that may be capitalized to assess their recoverability, and only capitalizes costs that it anticipates to be recoverable. The Company assesses the recoverability of its deferred implementation costs by comparing the greater of the amount of the non-cancellable portion of a customer's contract and the non-refundable customer prepayments received as it relates to the specific implementation costs incurred. The Company begins amortizing the deferred implementation costs for an implementation once the revenue recognition criteria have been met and the Company amortizes those deferred implementation costs ratably over the remaining term of the customer agreement. The portion of deferred implementation costs expected to be amortized during the succeeding twelve-month period is recorded in current assets as deferred implementation costs, current portion, and the remainder is recorded in long-term assets as deferred implementation costs, net of current portion.
Deferred Solution and Other Costs
The Company capitalizes sales commissions and other third-party costs, such as third party licenses and maintenance related to its customer agreements. The Company capitalizes sales commissions because the commission charges are so closely related to the revenues from the non-cancellable customer agreements that they should be recorded as an asset and charged to expense over the same period that the related revenue is recognized. The Company begins amortizing deferred solution and other costs for a particular customer agreement once the revenue recognition criteria are met and amortizes those deferred costs over the remaining term of the customer agreement. The Company analyzes solution and other costs that may be capitalized to assess their recoverability and only capitalizes costs that it anticipates to be recoverable. The portion of capitalized costs expected to be amortized during the succeeding twelve-month period is recorded in current assets as deferred solution and other costs, current portion, and the remainder is recorded in long-term assets as deferred solution and other costs, net of current portion. Deferred commissions were $7.0 million and $4.6 million as of December 31, 2014 and 2013, respectively.
Property and Equipment
Property and equipment are stated at cost less accumulated depreciation and amortization. Depreciation is calculated on a straight-line basis over the estimated useful lives of the related assets. Leasehold improvements are amortized over the shorter of the lease term or the estimated useful lives of the related assets. Maintenance and repairs that do not extend the life of or improve an asset are expensed in the period incurred.
The estimated useful lives of property and equipment are as follows:
Computer hardware and equipment | 3 - 5 years | |
Purchased software and licenses | 3 - 5 years | |
Furniture and fixtures | 7 years | |
Leasehold improvements | Lesser of estimated useful life or lease term | |
Deferred Revenues
Deferred revenues primarily consist of amounts that have been billed to or received from customers in advance of revenue recognition and prepayments received from customers in advance for implementation, maintenance and other services, as well as initial subscription fees. The Company recognizes deferred revenues as revenues when the services are performed and the corresponding revenue recognition criteria are met. Customer prepayments are generally applied against invoices issued to customers when services are performed and billed. Deferred revenues that are expected to be recognized as revenues during the succeeding twelve month period are recorded in current liabilities as deferred revenues, current portion and the remaining portion is recorded in long-term liabilities as deferred revenues, net of current portion.
F-9
Q2 HOLDINGS, INC.
NOTES TO CONSOLIDATED FINANCIAL STATEMENTS
(in thousands, except per share amounts and unless otherwise indicated)
Revenues
All revenue-generating activities are directly related to the sale, implementation and support of the Company's solutions within a single operating segment. The Company derives the substantial majority of its revenues from subscription fees for the use of its solutions hosted in the Company's data centers as well as revenues for implementation and customer support services related to the Company's solutions. A small portion of the Company's customers host the Company's solutions in their own data centers under term license and maintenance agreements, and the Company recognizes the corresponding revenues ratably over the term of those customer agreements.
Revenues are recognized net of sales credits and allowances. The Company begins to recognize revenues for a customer when all of the following criteria are satisfied:
• | there is persuasive evidence of an arrangement; |
• | the service has been or is being provided to the customer; |
• | the collection of the fees is reasonably assured; and |
• | the amount of fees to be paid by the customer is fixed or determinable. |
Determining whether and when these criteria have been met can require significant judgment and estimates. In general, revenue recognition commences when the Company's solutions are implemented and made available to the customers.
The Company's software solutions are available for use in hosted application arrangements under subscription fee agreements. Subscription fees from these applications, including related customer support, are recognized ratably over the customer agreement term beginning on the date the solution is made available to the customer. Amounts that have been invoiced are recorded in accounts receivable and deferred revenues or revenues, depending on whether the Company's revenue recognition criteria have been met.
The Company considers subscription fees to be fixed or determinable unless the fees are subject to refund or adjustment or are not payable within the Company's standard payment terms. In determining whether collection of subscription fees is reasonably assured, the Company considers financial and other information about customers, such as a customer's current credit-worthiness and payment history over time. Historically bad debt expenses have not been significant.
The Company enters into arrangements with multiple-deliverables that generally include multiple subscriptions and implementation services. Additional agreements with existing customers that are not in close proximity to the original arrangements are treated as separate contracts for accounting purposes.
For multiple-deliverable arrangements, arrangement consideration is allocated to deliverables based on their relative selling price. In order to treat deliverables in a multiple-deliverable arrangement as separate units of accounting, the deliverables must have standalone value upon delivery. If the deliverables have standalone value upon delivery, each deliverable must be accounted for separately. The Company's subscription services have standalone value as such services are often sold separately. In determining whether implementation services have standalone value apart from the subscription services, the Company considers various factors including the availability of the services from other vendors. To date, the Company has concluded that the implementation services included in multiple-deliverable arrangements do not have standalone value. As a result, when implementation services are sold in a multiple-deliverable arrangement, the Company defers any arrangement fees for implementation services and recognizes such amounts ratably over the period of performance for the initial agreement term.
When multiple-deliverables included in an arrangement are separated into different units of accounting, the arrangement consideration is allocated to the identified separate units based on a relative selling price hierarchy. The selling price for a deliverable is based on its vendor-specific objective evidence of selling price, or VSOE, if available, third-party evidence of selling price, or TPE, if VSOE is not available or best estimate of selling price, or BESP, if neither VSOE nor TPE is available.
F-10
Q2 HOLDINGS, INC.
NOTES TO CONSOLIDATED FINANCIAL STATEMENTS
(in thousands, except per share amounts and unless otherwise indicated)
The Company has not established VSOE for its subscription services due to lack of pricing consistency, the introduction of new services and other factors. The Company has determined that TPE is not a practical alternative due to differences in its service offerings compared to other parties and the availability of relevant third-party pricing information. Accordingly, the Company uses BESP to determine the relative selling price. The amount of revenue allocated to delivered items is limited by contingent revenues.
The Company determined BESP by considering its overall pricing objectives and market conditions. Significant pricing practices taken into consideration include the Company's discounting practices, the size and volume of its transactions, customer characteristics, price lists, go-to-market strategy, historical standalone sales and agreement prices. As the Company's go-to-market strategies evolve, it may modify its pricing practices in the future, which could result in changes in relative selling prices, and include both VSOE and BESP.
Subscription Fee Revenues
The Company's solutions are available as hosted solutions under subscription fee agreements without licensing perpetual rights to the software. Subscription fees from a hosted solution are recognized monthly over the customer agreement term beginning on the date the Company's solution is made available to the customer. Additional fees for monthly usage above the levels included in the standard subscription fee, which include fees for transactions processed during the period, are recognized as revenue in the month when the usage amounts are determined and reported. Any revenues related to upfront implementation services are recognized ratably over the same customer agreement term. Amounts that have been invoiced are recorded in accounts receivable and deferred revenues or revenues, depending on whether the revenue recognition criteria have been met.
Professional Services Revenues
When professional services are not combined with subscription services or term licenses as a single unit of accounting, these professional services revenues are recognized as the services are performed.
Certain out-of-pocket expenses billed to customers are recorded as revenues rather than an offset to the related expense. Revenues recorded from out-of-pocket expense reimbursements totaled approximately $0.8 million, $0.5 million and $0.4 million during the years ended December 31, 2014, 2013 and 2012, respectively. The out-of-pocket expenses are reported in cost of revenues.
Term Licenses and Maintenance Revenues
A small portion of the Company's customers host and manage the Company's solutions on-premises or in third-party data centers under term license and maintenance agreements. Term licenses sold with maintenance, which entitles the customer to technical support and upgrades and updates to the software made available on a when-and-if-available basis, are accounted for under Accounting Standards Codification 985-605, "Software Revenue Recognition." The Company does not have VSOE of fair value for the maintenance and professional services so the entire arrangement consideration is recognized monthly over the term of the software license when all of the other revenue recognition criteria have been met. Revenues from term licenses and maintenance agreements were not significant in the periods presented.
F-11
Q2 HOLDINGS, INC.
NOTES TO CONSOLIDATED FINANCIAL STATEMENTS
(in thousands, except per share amounts and unless otherwise indicated)
Cost of Revenues
Cost of revenues is comprised primarily of salaries and other personnel-related costs, including employee benefits, bonuses and stock-based compensation, for employees providing services to the Company's customers. Costs associated with these services include the costs of the Company's implementation, customer support, data center and customer training personnel as well as reclassification of certain research and development expenses related to research and development personnel who perform services related to implementation and customer support. Cost of revenues also includes the direct costs of bill-pay and other third-party intellectual property included in the Company's solutions, the amortization of deferred solution and services costs, co-location facility costs and depreciation of the Company's data center assets, an allocation of general overhead costs and referral fees. Direct costs of third-party intellectual property include amounts paid for third-party licenses and related maintenance that are incorporated into the Company's software, with the costs amortized to cost of revenues over the useful lives of the purchased assets.
The amount of research and development expenses allocated to cost of revenues was $1.4 million, $1.6 million and $1.4 million for the years ended December 31, 2014, 2013 and 2012, respectively.
The Company capitalizes certain personnel costs directly related to the implementation of its solutions to the extent those costs are considered to be recoverable from future revenues. The Company amortizes the costs for a particular implementation once revenue recognition commences, and the Company amortizes those implementation costs over the remaining term of the customer agreement. Other costs not directly recoverable from future revenues are expensed in the period incurred. The Company capitalized implementation costs in the amount of $3.8 million, $3.2 million, and $2.6 million during the years ended December 31, 2014, 2013 and 2012, respectively.
Software Development Costs
Software development costs include salaries and other personnel-related costs, including employee benefits, bonuses and stock-based compensation, attributed to programmers, software engineers and quality control teams working on the Company's solutions. Costs related to software development incurred between reaching technological feasibility and the point at which the software solution is ready for general release have been insignificant through December 31, 2014, and accordingly all of the Company's software development costs have been expensed as incurred as research and development.
Research and Development Costs
Research and development costs include salaries and other personnel-related costs, including employee benefits, bonuses and stock-based compensation, third-party contractor expenses, software development tools, an allocation of facilities and depreciation expenses and other related expenses incurred in developing new solutions and upgrading and enhancing existing solutions. Research and development costs are expensed as incurred.
Advertising
All advertising costs of the Company are expensed the first time the advertising takes place. Advertising costs were $0.5 million, and $0.3 million for the years ended December 31, 2014 and 2013, respectively, and advertising costs were insignificant for the year ended December 31, 2012.
Sales Tax
The Company presents sales taxes and other taxes collected from customers and remitted to governmental authorities on a net basis and, as such, excludes them from revenues.
F-12
Q2 HOLDINGS, INC.
NOTES TO CONSOLIDATED FINANCIAL STATEMENTS
(in thousands, except per share amounts and unless otherwise indicated)
Comprehensive Loss
Comprehensive loss includes net loss as well as other changes in stockholders' equity that result from transactions and economic events other than those with stockholders. Other comprehensive loss consists of net loss and unrealized gains and losses on investments.
Stock-Based Compensation
Stock options and restricted stock units awarded to employees, directors and consultants are measured at fair value at each grant date. The Company recognizes compensation expense ratably over the requisite service period of the option or restricted stock unit award. Generally, options vest 25% on the one-year anniversary of the grant date with the balance vesting monthly over the following 36 months, and restricted stock unit awards vest in four annual installments of 25% beginning on the one-year anniversary of the grant date.
The Company values stock options using the Black-Scholes option-pricing model, which requires the input of subjective assumptions, including the risk-free interest rate, expected life, expected stock price volatility and dividend yield. The risk-free interest rate assumption is based upon observed interest rates for constant maturity U.S. Treasury securities consistent with the expected term of the Company's employee stock options. The expected life represents the period of time the stock options are expected to be outstanding and is based on the simplified method. Under the simplified method, the expected life of an option is presumed to be the mid-point between the vesting date and end of the contractual term. The Company used the simplified method due to the lack of sufficient historical exercise data to provide a reasonable basis upon which to otherwise estimate the expected life of the stock options. Expected volatility is based on historical volatilities for publicly traded stock of comparable companies over the estimated expected life of the stock options. The Company assumed no dividend yield because it does not expect to pay dividends in the near future, which is consistent with the Company's history of not paying dividends.
Income Taxes
Deferred income taxes are provided for the tax effects of temporary differences between the carrying amounts of assets and liabilities for financial reporting purposes and the amounts used for income tax purposes and operating loss carryforwards and credits using enacted tax rates expected to be in effect in the years in which the differences are expected to reverse. The Company assesses the likelihood that deferred tax assets will be realized and recognizes a valuation allowance if it is more likely than not that some portion of the deferred tax assets will not be realized. This assessment requires judgment as to the likelihood and amounts of future taxable income by tax jurisdiction. To date, the Company has provided a full valuation allowance against its deferred tax assets as it believes the objective and verifiable evidence of its historical pretax net losses outweighs any positive evidence of its forecasted future results. Although the Company believes that its tax estimates are reasonable, the ultimate tax determination involves significant judgment that is subject to audit by tax authorities in the ordinary course of business. The Company will continue to monitor the positive and negative evidence, and it will adjust the valuation allowance as sufficient objective positive evidence becomes available.
The Company evaluates its uncertain tax positions based on a determination of whether and how much of a tax benefit taken by the Company in its tax filings or positions is more likely than not to be realized. Potential interest and penalties associated with any uncertain tax positions are recorded as a component of income tax expense. Through December 31, 2014, the Company has not identified any material uncertain tax positions for which liabilities would be required to be recorded.
F-13
Q2 HOLDINGS, INC.
NOTES TO CONSOLIDATED FINANCIAL STATEMENTS
(in thousands, except per share amounts and unless otherwise indicated)
Basic and Diluted Net Loss per Common Share
The Company uses the two-class method to compute net loss per common share because the Company has issued securities, other than common stock, that contractually entitle the holders to participate in dividends and earnings of the Company. The two-class method requires earnings for the period to be allocated between common stock and participating securities based upon their respective rights to receive distributed and undistributed earnings. Holders of the Company's Series A, B and C preferred stock are entitled, on a pari passu basis, to receive dividends when, as and if declared by the board of directors, prior and in preference to any declaration or payment of any dividend on the common stock or junior convertible preferred stock until such time as the total dividends paid on each share of Series A, B and C preferred stock is equal to the original issue price of the shares. Holders of junior convertible preferred stock are entitled to receive a pro rata share of any dividend declared, based on the number of shares of common and preferred stock outstanding. As a result, all series of the Company's preferred stock are considered participating securities.
Under the two-class method, for periods with net income, basic net income per common share is computed by dividing the net income attributable to common stockholders by the weighted-average number of shares of common stock outstanding during the period. Net income attributable to common stockholders is computed by subtracting from net income the portion of current year earnings that the participating securities would have been entitled to receive pursuant to their dividend rights had all of the year's earnings been distributed. No such adjustment to earnings is made during periods with a net loss, as the holders of the participating securities have no obligation to fund losses. Diluted net income per common share is computed under the two-class method by using the weighted-average number of shares of common stock outstanding plus, for periods with net income attributable to common stockholders, the potential dilutive effects of stock options and warrants. In addition, the Company analyzes the potential dilutive effect of the outstanding participating securities under the if-converted method when calculating diluted earnings per share, in which it is assumed that the outstanding participating securities convert into common stock at the beginning of the period. The Company reports the more dilutive of the approaches as its diluted net income per share during the period. Due to net losses for each of the years ended December 31, 2014, 2013 and 2012, basic and diluted net loss per share were the same, as the effect of all potentially dilutive securities would have been anti-dilutive.
F-14
Q2 HOLDINGS, INC.
NOTES TO CONSOLIDATED FINANCIAL STATEMENTS
(in thousands, except per share amounts and unless otherwise indicated)
The following table sets forth the computations of net loss per share for the periods listed:
Year ended December 31, | ||||||||||||
2014 | 2013 | 2012 | ||||||||||
Numerators: | ||||||||||||
Loss from continuing operations attributable to common stockholders | $ | (19,634 | ) | $ | (17,676 | ) | $ | (7,520 | ) | |||
Loss from discontinued operations attributable to common stockholders | — | (199 | ) | (1,259 | ) | |||||||
Net loss attributable to common stockholders | $ | (19,634 | ) | $ | (17,875 | ) | $ | (8,779 | ) | |||
Denominator: | ||||||||||||
Weighted-average common shares outstanding, basic and diluted | 29,257 | 11,866 | 11,345 | |||||||||
Loss from continuing operations per share, basic and diluted | $ | (0.67 | ) | $ | (1.49 | ) | $ | (0.66 | ) | |||
Loss from discontinued operations per share, basic and diluted | $ | — | $ | (0.02 | ) | $ | (0.11 | ) | ||||
Net loss per common share, basic and diluted | $ | (0.67 | ) | $ | (1.51 | ) | $ | (0.77 | ) | |||
Due to net losses for each of the years ended December 31, 2014, 2013 and 2012, basic and diluted loss per share were the same, as the effect of all potentially dilutive securities would have been anti-dilutive. The following table sets forth the anti-dilutive common share equivalents for the periods listed:
Year ended December 31, | |||||||||
2014 | 2013 | 2012 | |||||||
Redeemable convertible preferred stock: | |||||||||
Series A preferred stock | — | 7,908 | 7,908 | ||||||
Series B preferred stock | — | 1,818 | 1,818 | ||||||
Series C preferred stock | — | 2,184 | — | ||||||
Junior preferred stock | — | 1,251 | 1,251 | ||||||
Stock options and restricted stock units | 6,139 | 5,422 | 4,765 | ||||||
Total anti-dilutive common share equivalents | 6,139 | 18,583 | 15,742 | ||||||
Recent Accounting Pronouncements
In May 2014, the Financial Accounting Standards Board issued Accounting Standards Update No. 2014-09, Revenue from Contracts with Customers (Topic 606), or ASU 2014-09, which amends the existing accounting standards for revenue recognition. ASU 2014-09 is based on principles that govern the recognition of revenue at an amount an entity expects to be entitled to when products are transferred to customers. ASU 2014-09 will be effective for the Company beginning in its first quarter of 2017. Early adoption is not permitted. The new revenue standard may be applied retrospectively to each prior period presented or retrospectively with the cumulative effect recognized as of the date of adoption. The Company is currently evaluating the impact of adopting the new revenue standard on its consolidated financial statements.
Subsequent Events
The Company has evaluated subsequent events through February 12, 2015, the date the financial statements were issued.
F-15
Q2 HOLDINGS, INC.
NOTES TO CONSOLIDATED FINANCIAL STATEMENTS
(in thousands, except per share amounts and unless otherwise indicated)
3. Fair Value Measurements
The carrying values of the Company's financial instruments, principally cash equivalents, investments, accounts receivable, restricted cash and accounts payable, approximated their fair values due to the short period of time to maturity or repayment. The carrying values of the Company's debt instruments approximated their fair value based on rates currently available to the Company.
Fair value is defined as the exchange price that would be received for an asset or an exit price paid to transfer a liability in the principal or most advantageous market for the asset or liability in an orderly transaction between market participants on the measurement date. Valuation techniques used to measure fair value must maximize the use of observable inputs and minimize the use of unobservable inputs. The current accounting guidance for fair value measurements defines a three-level valuation hierarchy for disclosures as follows:
• | Level I—Unadjusted quoted prices in active markets for identical assets or liabilities; |
• | Level II—Inputs other than quoted prices included within Level I that are observable, unadjusted quoted prices in markets that are not active, or other inputs that are observable or can be corroborated by observable market data; and |
• | Level III—Unobservable inputs that are supported by little or no market activity, which requires the Company to develop its own assumptions. |
The categorization of a financial instrument within the valuation hierarchy is based upon the lowest level of input that is significant to the fair value measurement.
The following table details the fair value hierarchy of the Company's financial assets measured at fair value on a recurring basis as of December 31, 2014:
Fair Value Measurements Using: | ||||||||||||||||
Cash Equivalents: | Fair Value | Quoted Prices in Active Markets for Identical Assets (Level 1) | Significant Other Observable Inputs (Level 2) | Significant Unobservable Inputs (Level 3) | ||||||||||||
Money market funds | $ | 17,865 | $ | 17,865 | $ | — | $ | — | ||||||||
Certificates of deposit | 1,456 | — | 1,456 | — | ||||||||||||
$ | 19,321 | $ | 17,865 | $ | 1,456 | $ | — | |||||||||
Investments: | Fair Value | Quoted Prices in Active Markets for Identical Assets (Level 1) | Significant Other Observable Inputs (Level 2) | Significant Unobservable Inputs (Level 3) | ||||||||||||
U.S. government agency bonds | $ | 7,502 | $ | — | $ | 7,502 | $ | — | ||||||||
Corporate bonds and commercial paper | 6,192 | — | 6,192 | — | ||||||||||||
Certificates of deposit | 7,262 | — | 7,262 | — | ||||||||||||
$ | 20,956 | $ | — | $ | 20,956 | $ | — | |||||||||
All Company assets with fair values measured on a recurring basis, which consists only of cash and cash equivalents, as of December 31, 2013 were classified as Level 1 assets.
F-16
Q2 HOLDINGS, INC.
NOTES TO CONSOLIDATED FINANCIAL STATEMENTS
(in thousands, except per share amounts and unless otherwise indicated)
The Company determines the fair value of its investment holdings based on pricing from our pricing vendors. The valuation techniques used to measure the fair value of financial instruments having Level 2 inputs were derived from non-binding consensus prices that are corroborated by observable market data or quoted market prices for similar instruments. Such market prices may be quoted prices in active markets for identical assets (Level 1 inputs) or pricing determined using inputs other than quoted prices that are observable either directly or indirectly (Level 2 inputs).
4. Cash, Cash Equivalents and Investments
The Company's cash, cash equivalents and investments as of December 31, 2014 and 2013 consisted primarily of cash, U.S. government agency bonds, corporate bonds, commercial paper, certificates of deposits and money market funds.
The Company classifies investments as available-for-sale at the time of purchase and reevaluates such classification as of each balance sheet date. All investments are recorded at estimated fair value. Unrealized gains and losses on available-for-sale investments are included in accumulated other comprehensive loss, a component of stockholders' equity. The Company evaluates its investments to assess whether those with unrealized loss positions are other than temporarily impaired. The Company considers impairments to be other than temporary if they are related to deterioration in credit risk or if it is likely the Company will sell the investments before the recovery of their cost basis. Realized gains and losses and declines in value judged to be other than temporary are determined based on the specific identification method and are reported in other income (expense), net, in the consolidated statements of comprehensive loss. Interest, amortization of premiums, and accretion of discount on all investments classified as available-for-sale are also included as a component of other income (expense), net, in the consolidated statements of comprehensive loss.
As of December 31, 2014 and 2013, the Company's cash was $48.7 million and $18.7 million, respectively.
A summary of the cash equivalents and investments as of December 31, 2014 is as follows:
Cash Equivalents: | Amortized Cost | Unrealized Gains | Unrealized Losses | Fair Value | ||||||||||||
Money market funds | $ | 17,865 | $ | — | $ | — | $ | 17,865 | ||||||||
Certificates of deposit | 1,456 | — | — | 1,456 | ||||||||||||
$ | 19,321 | $ | — | $ | — | $ | 19,321 | |||||||||
Investments: | Amortized Cost | Unrealized Gains | Unrealized Losses | Fair Value | ||||||||||||
U.S. government agency bonds | $ | 7,508 | $ | — | $ | (6 | ) | $ | 7,502 | |||||||
Corporate bonds and commercial paper | 6,200 | — | (8 | ) | 6,192 | |||||||||||
Certificates of deposit | 7,262 | — | — | 7,262 | ||||||||||||
$ | 20,970 | $ | — | $ | (14 | ) | $ | 20,956 | ||||||||
The Company may sell its investments at any time, without significant penalty, for use in current operations or for other purposes, even if they have not yet reached maturity. As a result, the Company classifies its investments, including investments with maturities beyond twelve months as current assets in the accompanying consolidated balance sheets.
F-17
Q2 HOLDINGS, INC.
NOTES TO CONSOLIDATED FINANCIAL STATEMENTS
(in thousands, except per share amounts and unless otherwise indicated)
The following table summarizes the estimated fair value of the Company's investments, designated as available-for-sale and classified by the contractual maturity date of the investments as of the dates shown:
December 31, | ||||||||
2014 | 2013 | |||||||
Due within one year or less | $ | 9,095 | $ | — | ||||
Due after one year through five years | 11,861 | — | ||||||
Total | $ | 20,956 | $ | — | ||||
The Company has certain available-for-sale investments in a gross unrealized loss position, all of which have been in such position for less than twelve months. The Company reviews its debt securities classified as short-term investments on a regular basis to evaluate whether or not any security has experienced an other than temporary decline in fair value. The Company considers factors such as the length of time and extent to which the market value has been less than the cost, the financial position and near-term prospects of the issuer and its intent to sell, or whether it is more likely than not the Company will be required to sell the investment before recovery of the investment's amortized-cost basis. If the Company determines that an other than temporary decline exists in one of these investments, the respective investment would be written down to fair value. For debt securities, the portion of the write-down related to credit loss would be recognized to other income, net in the consolidated statements of comprehensive loss. Any portion not related to credit loss would be included in accumulated other comprehensive loss. Because the Company does not intend to sell any investments which have an unrealized loss position at this time, and it is not more likely than not that the Company will be required to sell the investment before recovery of its amortized cost basis, which may be maturity, the Company does not consider the investments with unrealized loss positions to be other than temporarily impaired as of December 31, 2014.
The following table shows the fair values and the gross unrealized losses of these available-for-sale investments aggregated by investment category as of as of December 31, 2014:
Fair Value | Gross Unrealized Loss | |||||||
U.S. government agency bonds | $ | 7,508 | $ | (6 | ) | |||
Corporate bonds and commercial paper | 6,200 | (8 | ) | |||||
Total | $ | 13,708 | $ | (14 | ) | |||
The Company did not have any available-for-sale investments as of December 31, 2013.
5. Deferred Solution and Other Costs
Deferred solution and other costs, current portion and net of current portion, consisted of the following:
December 31, | ||||||||
2014 | 2013 | |||||||
Deferred solution costs | $ | 3,585 | $ | 2,174 | ||||
Deferred commissions | 1,475 | 950 | ||||||
Deferred solution and other costs, current portion | $ | 5,060 | $ | 3,124 | ||||
Deferred solution costs | $ | 1,684 | $ | 1,721 | ||||
Deferred commissions | 5,475 | 3,637 | ||||||
Deferred solution and other costs, net of current portion | $ | 7,159 | $ | 5,358 | ||||
F-18
Q2 HOLDINGS, INC.
NOTES TO CONSOLIDATED FINANCIAL STATEMENTS
(in thousands, except per share amounts and unless otherwise indicated)
6. Property and Equipment
Property and equipment consisted of the following:
December 31, | ||||||||
2014 | 2013 | |||||||
Computer hardware and equipment | $ | 13,370 | $ | 8,917 | ||||
Purchased software and licenses | 5,759 | 3,501 | ||||||
Furniture and fixtures | 3,116 | 3,014 | ||||||
Leasehold improvements | 4,064 | 4,020 | ||||||
26,309 | 19,452 | |||||||
Accumulated depreciation | (7,788 | ) | (4,621 | ) | ||||
Property and equipment | $ | 18,521 | $ | 14,831 | ||||
Depreciation expense, including amortization of assets held under capital leases, was $4.0 million, $2.9 million and $1.5 million for the years ended December 31, 2014, 2013 and 2012, respectively. Property and equipment included $3.2 million for assets acquired under capital leases at each of December 31, 2014 and 2013.
7. Accrued Liabilities
Accrued liabilities consisted of the following:
December 31, | ||||||||
2014 | 2013 | |||||||
Accrued data center equipment purchases | $ | 3,228 | $ | 512 | ||||
Accrued data center software purchases | 1,483 | 467 | ||||||
Accrued transaction processing fees | 1,537 | 3,761 | ||||||
Accrued professional services | 730 | 721 | ||||||
Other | 2,290 | 1,827 | ||||||
Total accrued liabilities | $ | 9,268 | $ | 7,288 | ||||
8. Debt
In April 2013 the Company entered into a secured credit facility agreement, or Credit Facility, with Wells Fargo Bank, National Association, or Wells Fargo, which the Company and Wells Fargo subsequently amended on March 24, 2014 and again on August 11, 2014. The Credit Facility, as amended, provides for a line of credit of up to $25.0 million, with an accordion feature, or Accordion Feature, allowing the Company to increase its maximum borrowings by up to an additional $25.0 million, subject to certain conditions and limitations, including that borrowings at any time shall be limited to 75% of the Company's trailing twelve-month recurring revenues. Access to the total borrowings available under the Credit Facility is restricted based on covenants related to the Company's minimum liquidity and adjusted EBITDA. Amounts borrowed under the Credit Facility accrue interest, at the Company's election at either: (i) the per annum rate equal to the LIBOR rate plus an applicable margin; or (ii) the current base rate plus the greater of the U.S. Federal Funds rate plus one percentage point, the one-month LIBOR plus one percentage point, or the lending financial institution's prime rate. The Company pays a monthly fee based on the total unused borrowings balance, an annual administrative fee and the initial closing fee, which is paid in three equal annual installments over the first three years of the Credit Facility. The Accordion Feature expires in October 2016, at which time maximum borrowings under the Facility are reduced to $25.0 million, and the Credit Facility matures in April 2017, at which time any outstanding borrowings and accrued interest become payable. In April 2013, the Company drew an advance on the Credit Facility of $2.5 million to pay off its existing loan and security agreement with another institution. In June 2013, the Company drew an advance on the Credit Facility of $3.9 million to fund capital expenditures and secured a letter of credit
F-19
Q2 HOLDINGS, INC.
NOTES TO CONSOLIDATED FINANCIAL STATEMENTS
(in thousands, except per share amounts and unless otherwise indicated)
for the benefit of the landlord of its new corporate headquarters in the amount of $3.0 million. On February 26, 2014, the Company drew an advance of $12.5 million on the Credit Facility, which was subsequently repaid in full on March 17, 2014.
On March 24, 2014, the Company entered into Amendment Number One to the Credit Facility in connection with, and effective upon, the closing of the Company's initial public offering of shares of its common stock, or IPO, which occurred on March 25, 2014. The amendment primarily modified the definition of "Change of Control" in the Credit Facility. On April 22, 2014, the Company paid $4.2 million on the Credit Facility.
On August 11, 2014, the Company entered into Amendment Number Two to the Credit Facility, which modified the Credit Facility to add the Accordion Feature and modified or eliminated certain of the Company's financial covenants and fees it owes under the Credit Facility. On September 5, 2014, the Company paid $2.0 million on the Credit Facility.
As of December 31, 2014, the Company had no borrowings and only a secured letter of credit of $3.0 million against the Credit Facility, leaving an available balance of approximately $22.0 million, and the interest rate applicable to the Credit Facility was 4.7%. The Credit Facility is collateralized by substantially all of the Company's assets and requires that the Company maintain certain financial covenants as provided in the Credit Facility. The Company was in compliance with all financial covenants as of December 31, 2014.
9. Commitments and Contingencies
Operating and Capital Lease Commitments
The Company leases office space for its corporate headquarters in Austin, Texas under a non-cancelable operating lease that expires in April 2021 and a regional sales office in Atlanta, Georgia under a non-cancelable operating lease that expires in January 2016. In addition, the Company leases office space for its previous corporate headquarters in Austin, Texas under a non-cancelable operating lease that expires in March 2015. All of the rentable space covered by this lease has been sublet to a tenant for substantially all of the remainder of the lease. Rent expense under operating leases was $1.0 million, $1.4 million, and $0.9 million for the years ended December 31, 2014, 2013 and 2012, respectively. In 2013, the Company moved to its current headquarters. As a result, the Company vacated its former leased headquarters and recorded an estimated unoccupied lease charge of $0.2 million for the remaining contractual lease payments less estimated sublease income.
New Facilities Lease
On July 18, 2014, the Company entered into an office lease agreement, or the Lease, with CREF Aspen Lake Building II, LLC to lease approximately 70,000 rentable square feet, or the Premises, of an office building to be located immediately adjacent to the Company's current headquarters in order to expand the Company's headquarters. The Lease provides for phased commencement dates, with commencement of the first phase covering approximately 55,000 rentable square feet anticipated to occur on November 1, 2015, or the Initial Commencement Date, with the remaining space becoming available nine months thereafter. The actual commencement dates are subject to timely completion of the construction of the Premises. The term of the Lease commences on the Initial Commencement Date and runs 124 months, with a five year renewal option, and the rent obligations under the Lease begin with rents of $98 per month, which escalate over the course of the Lease to $160 per month in the final four months of the Lease's term.
The Company has entered into various capital lease arrangements to obtain property and equipment for its data center and corporate operations. These agreements expire over various terms from March 2015 through May 2025 and the leases are secured by the underlying leased property and equipment.
F-20
Q2 HOLDINGS, INC.
NOTES TO CONSOLIDATED FINANCIAL STATEMENTS
(in thousands, except per share amounts and unless otherwise indicated)
Future minimum payments required under capital and operating leases that have initial or remaining non-cancelable lease terms in excess of one year at December 31, 2014 were as follows:
Capital Leases | Operating Leases | |||||||
Year Ended December 31, | ||||||||
2015 | $ | 418 | $ | 2,054 | ||||
2016 | 164 | 3,023 | ||||||
2017 | 4 | 3,289 | ||||||
2018 | — | 3,371 | ||||||
2019 | — | 3,453 | ||||||
Thereafter | — | 13,446 | ||||||
Total minimum lease payments | 586 | $ | 28,636 | |||||
Less: imputed interest | (11 | ) | ||||||
Less: current portion | (408 | ) | ||||||
Capital lease obligations, net of current portion | $ | 167 | ||||||
Contractual Commitments
The Company has non-cancelable contractual commitments related to third-party products, co-location fees, other product costs and data center hardware and software purchases. The Company is party to several purchase commitments for third-party products that contain both a contractual minimum obligation and a variable obligation based upon usage or other factors which can change on a monthly basis. The estimated amounts for usage and other factors are not included within the table below.
Future minimum contractual commitments that have initial or remaining non-cancelable terms in excess of one year were as follows:
Contractual Commitments | ||||
Year Ended December 31, | ||||
2015 | $ | 10,465 | ||
2016 | 6,382 | |||
2017 | 4,464 | |||
2018 | 4,232 | |||
2019 | 4,092 | |||
Thereafter | 4,092 | |||
Total commitments | $ | 33,727 | ||
Legal Proceedings
From time to time, the Company may become involved in legal proceedings arising in the ordinary course of its business. The Company is not presently a party to any legal proceedings that, if determined adversely to the Company, would have a material adverse effect on the Company.
F-21
Q2 HOLDINGS, INC.
NOTES TO CONSOLIDATED FINANCIAL STATEMENTS
(in thousands, except per share amounts and unless otherwise indicated)
10. Stockholder's Equity
Initial Public Offering
On March 25, 2014, the Company completed its IPO of 7,761 shares of common stock at $13.00 per share. The total shares sold in the IPO included 1,511 shares sold by selling stockholders. After deducting the payment of underwriters' discounts and commissions and offering costs, the net proceeds to the Company from the sale of shares in the offering were approximately $72.6 million.
Underwriter's Exercise Of Option to Purchase Additional Shares
On April 2, 2014, pursuant to the terms of the Company's IPO, which occurred on March 25, 2014, the underwriters exercised their option to purchase an additional 1,164 shares to cover over-allotments. After deducting the payment of underwriters' discounts and commissions and offering costs, the Company received net proceeds from the sale of shares totaling approximately $13.7 million.
Conversion of Redeemable Common and Preferred Stock
Immediately prior to the closing of the IPO, which occurred on March 25, 2014, each share of the Company's outstanding preferred, junior preferred and redeemable common stock was converted into one share of undesignated common stock. The following table presents the conversion of all classes of stock on March 25, 2014:
Prior to Conversion | Subsequent to Conversion | |||||
Convertible preferred stock | ||||||
Series A | 7,908 | — | ||||
Series B | 1,818 | — | ||||
Series C | 2,605 | — | ||||
Redeemable common stock | 3,829 | — | ||||
Junior preferred stock | 1,251 | — | ||||
Undesignated common stock | — | 17,412 | ||||
11. Stock-Based Compensation
In March 2014, the Company's board of directors approved the 2014 Equity Incentive Plan, or 2014 Plan, under which stock options, stock appreciation rights, restricted stock, restricted stock units, performance shares and units and other cash-based or stock-based awards may be granted to employees, consultants and directors. Shares of common stock that are issued and available for issuance under the 2014 Plan consist of authorized, but unissued or reacquired shares of common stock or any combination thereof.
A total of 1,850 shares of the Company's common stock was initially authorized and reserved for issuance under the 2014 Plan. This reserve will automatically increase on January 1, 2015 and each subsequent anniversary through 2024, by an amount equal to the smaller of (a) 4.5% of the number of shares of common stock issued and outstanding on the immediately preceding December 31, or (b) an amount determined by the Company's board of directors. This reserve is automatically increased to include any outstanding shares under the Company's 2007 Stock Plan, or 2007 Plan, at the time of its termination or issuable upon expiration or termination of options granted under the Company's 2007 Plan that expire or terminate without having been exercised in full. Pursuant to the terms of the 2014 Plan, 107 shares available for future issuance under the 2007 Plan were transferred to the 2014 Plan, providing a total of 1,957 shares of common stock allocated for issuance under the 2014 Plan. In addition, 49 shares have been returned to the 2014 Plan as a result of termination of options that expired or terminated without having been exercised under the previously terminated 2007 Plan, resulting in a total of 2,006 shares available for issuance under the 2014 Plan. As of December 31, 2014, options to purchase a total of 606 shares of common stock have been granted under the 2014 Plan, 7 shares have been returned to the 2014 Plan as a result of termination of options that expired or
F-22
Q2 HOLDINGS, INC.
NOTES TO CONSOLIDATED FINANCIAL STATEMENTS
(in thousands, except per share amounts and unless otherwise indicated)
terminated without having been exercised, and 1,407 shares of common stock remain available for future issuance under the 2014 Plan.
In July 2007, the Company adopted the 2007 Plan under which options or stock purchase rights may be granted to employees, consultants and directors. In February 2014, the board of directors, under the authority granted to it by the 2007 Plan, increased the number of shares available to be granted under the plan by 1,400 shares, and as of December 31, 2014, a total of 9,172 shares of common stock were allocated for issuance under the plan. Upon the completion of the Company's IPO in March 2014, the board of directors terminated the 2007 Plan in connection with the IPO and pursuant to the terms of the 2014 Plan, 107 shares that were available for future issuance under the 2007 Plan at such time were transferred to the 2014 Plan. No shares remain available for future issuance of awards under the 2007 Plan. The 2007 Plan will continue to govern the terms and conditions of all outstanding equity awards granted under the 2007 Plan. Shares of common stock that are issued and were available for issuance under the 2007 Plan consist of authorized, but unissued or reacquired shares of common stock or any combination thereof.
Stock Options
The following summarizes the assumptions used for estimating the fair value of stock options granted during the periods indicated:
Year Ended December 31, | ||||||
2014 | 2013 | 2012 | ||||
Risk-free interest rate | 1.2 - 1.8% | 0.7 - 2.2% | 0.7 - 1.1% | |||
Expected life (in years) | 3.8 - 6.1 | 4.8 - 6.9 | 4.8 - 6.3 | |||
Expected volatility | 45.1 - 46.8% | 46.4 - 49.4% | 52.0 - 52.5% | |||
Dividend yield | — | — | — | |||
Weighted-average grant date fair value per share | $5.63 | $3.15 | $2.65 | |||
Stock option activity was as follows:
Number of Options | Weighted Average Exercise Price | ||||||
Balance as of January 1, 2012 | 5,022 | $ | 1.12 | ||||
Granted | 1,064 | 5.73 | |||||
Exercised | (42 | ) | 0.41 | ||||
Forfeited | (312 | ) | 1.84 | ||||
Balance as of December 31, 2012 | 5,732 | 1.94 | |||||
Granted | 834 | 7.69 | |||||
Exercised | (738 | ) | 0.59 | ||||
Forfeited | (406 | ) | 5.31 | ||||
Balance as of December 31, 2013 | 5,422 | 2.76 | |||||
Granted | 2,331 | 10.10 | |||||
Exercised | (1,583 | ) | 1.27 | ||||
Forfeited | (59 | ) | 7.56 | ||||
Balance as of December 31, 2014 | 6,111 | $ | 5.90 | ||||
F-23
Q2 HOLDINGS, INC.
NOTES TO CONSOLIDATED FINANCIAL STATEMENTS
(in thousands, except per share amounts and unless otherwise indicated)
The summary of stock options outstanding as of December 31, 2014 is as follows:
Options Outstanding | Options Exercisable | ||||||||||||||||||
Range of Exercise Prices | Number of Options | Weighted Average Exercise Price | Weighted Average Remaining Contractual Life (in years) | Number of Options | Weighted Average Exercise Price | Weighted Average Remaining Contractual Life (in years) | |||||||||||||
$0.29 - $0.35 | 919 | $ | 0.33 | 3.2 | 919 | $ | 0.33 | 3.2 | |||||||||||
$0.54 - $0.84 | 477 | 0.72 | 4.8 | 477 | 0.72 | 4.8 | |||||||||||||
$1.74 - $3.10 | 1,094 | 2.80 | 6.3 | 866 | 2.73 | 6.2 | |||||||||||||
$4.00 - $7.82 | 1,312 | 6.89 | 5.6 | 572 | 6.48 | 5.7 | |||||||||||||
$8.35 | 1,737 | 8.35 | 6.1 | — | — | — | |||||||||||||
$13.00 - $19.44 | 572 | 15.41 | 6.7 | 21 | 13.00 | 6.2 | |||||||||||||
6,111 | $ | 5.90 | 5.5 | 2,855 | $ | 2.44 | 4.9 | ||||||||||||
Restricted Stock Units
The Company’s restricted stock units vest over a four-year period and upon vesting, the vested shares are issued to the recipient of the restricted stock units.
The summary of restricted stock unit activity is as follows:
Number of Shares | Weighted Average Grant Date Fair Value | ||||||
Nonvested as of January 1, 2014 | — | $ | — | ||||
Granted | 28 | 19.44 | |||||
Vested | — | — | |||||
Forfeited | — | — | |||||
Nonvested as of December 31, 2014 | 28 | $ | 19.44 | ||||
The aggregate intrinsic value of stock options exercised during each of the years ended December 31, 2014, 2013 and 2012 was $17.3 million, $4.8 million and $0.2 million, respectively. The total fair value of stock options vested during each of the years ended December 31, 2014, 2013 and 2012 was $2.2 million, $1.2 million, and $0.8 million, respectively.
As of December 31, 2014, total unrecognized stock-based compensation expense, adjusted for estimated forfeitures, related to stock options was $14.0 million, which the Company expects to recognize over the next 3 years, and total unrecognized stock-based compensation expense, adjusted for estimated forfeitures, related to restricted stock units was $0.5 million, which the Company expects to recognize over the next 3.9 years.
F-24
Q2 HOLDINGS, INC.
NOTES TO CONSOLIDATED FINANCIAL STATEMENTS
(in thousands, except per share amounts and unless otherwise indicated)
12. Provision for Income Taxes
The components of the Company's provision for income taxes from continuing operations were as follows:
Year Ended December 31, | ||||||||||||
2014 | 2013 | 2012 | ||||||||||
Current taxes: | ||||||||||||
Federal | $ | — | $ | — | $ | — | ||||||
State | 67 | 52 | 162 | |||||||||
Total current taxes | $ | 67 | $ | 52 | $ | 162 | ||||||
Deferred taxes: | ||||||||||||
Federal | $ | — | $ | — | $ | — | ||||||
State | 4 | 3 | 2 | |||||||||
Total deferred taxes | 4 | 3 | 2 | |||||||||
Provision for income taxes | $ | 71 | $ | 55 | $ | 164 | ||||||
As of December 31, 2014, the Company had federal net operating loss carryforwards of approximately $69.9 million, state tax credits of approximately $0.2 million and federal alternative minimum tax credits of $0.1 million. The net operating loss carryforwards will expire at various dates beginning in 2026 if not utilized. The state tax credits expire in 2027 if not utilized. The alternative minimum tax credits have an indefinite carryforward period.
Federal and state laws impose restrictions on the utilization of net operating loss carryforwards and research and development credit carryforwards in the event of a change in ownership of the Company, which constitutes an "ownership change" as defined by Internal Revenue Code Sections 382 and 383. Should there be an ownership change in the future, the Company's ability to utilize existing carryforwards could be substantially restricted.
Deferred income taxes reflect the net tax effects of temporary differences between the carrying amounts of assets and liabilities for financial reporting purposes and the amounts used for income tax purposes. The Company has established a valuation allowance due to uncertainties regarding the realization of deferred tax assets based on the Company's lack of earnings history. During the year ended December 31, 2014, the valuation allowance increased by $6.4 million.
F-25
Q2 HOLDINGS, INC.
NOTES TO CONSOLIDATED FINANCIAL STATEMENTS
(in thousands, except per share amounts and unless otherwise indicated)
The Company's deferred tax assets and deferred tax liabilities were as follows:
December 31, | ||||||||
2014 | 2013 | |||||||
Deferred tax assets: | ||||||||
NOL and credit carryforwards | $ | 21,328 | $ | 16,340 | ||||
Deferred revenue | 2,657 | 1,596 | ||||||
Accrued expenses and other | 3,386 | 3,295 | ||||||
Stock-based compensation | 1,107 | 209 | ||||||
Total deferred tax assets | 28,478 | 21,440 | ||||||
Deferred tax liabilities: | ||||||||
Deferred expenses | (5,128 | ) | (3,924 | ) | ||||
Depreciation and amortization | (2,972 | ) | (3,573 | ) | ||||
Total deferred tax liabilities | (8,100 | ) | (7,497 | ) | ||||
Deferred tax assets less tax liabilities | 20,378 | 13,943 | ||||||
Less: valuation allowance | (20,266 | ) | (13,828 | ) | ||||
Net deferred tax asset | $ | 112 | $ | 115 | ||||
The Company had $9.9 million of excess stock deductions which are not included in deferred tax assets. The tax benefit from these deductions will increase additional paid-in capital when they are deemed realized under the "with and without" method.
The Company's provision for income taxes from continuing operations differs from the amount computed by applying the statutory federal income tax rate of 34% primarily as a result of the following:
Year Ended December 31, | |||||||||
2014 | 2013 | 2012 | |||||||
Income tax at U.S. statutory rate | 34.0 | % | 34.0 | % | 34.0 | % | |||
Effect of: | |||||||||
Increase in deferred tax valuation allowance | (32.9 | ) | (32.7 | ) | (31.5 | ) | |||
State taxes, net of federal benefit | 1.5 | 1.4 | (0.7 | ) | |||||
Other permanent items | (3.0 | ) | (3.0 | ) | (4.0 | ) | |||
Income tax provision effective rate | (0.4 | )% | (0.3 | )% | (2.2 | )% | |||
The Company files income tax returns in the U.S. federal jurisdiction and several state jurisdictions. With few exceptions, the Company is no longer subject to U.S. federal, state or local income tax examinations by tax authorities for years before 2011. Operating losses generated in years prior to 2011 remain open to adjustment until the statute of limitations closes for the tax year in which the net operating losses are utilized. The tax years 2011 through 2014 remain open to examination by all major taxing jurisdictions to which the Company is subject, though the Company is not currently under examination by any major taxing jurisdiction.
The Company had not recorded any tax reserves related to uncertain tax positions as of December 31, 2014, 2013 and 2012. The Company's policy is to accrue interest and penalties related to uncertain tax positions as a component of income tax expense. For the years ended December 31, 2014, 2013 and 2012, the Company did not incur any interest or penalties.
F-26
Q2 HOLDINGS, INC.
NOTES TO CONSOLIDATED FINANCIAL STATEMENTS
(in thousands, except per share amounts and unless otherwise indicated)
13. Employee Benefit Plan
In January 2009, the Company adopted a 401(k) profit-sharing plan, or 401(k) Plan, covering substantially all employees. Employees can contribute between 1% and 90% of their total earnings. The 401(k) Plan also provides for employer contributions to be made at the Company's discretion. As of December 31, 2014, the Company had not made any discretionary contributions.
14. Discontinued Operations
On March 1, 2013, the Company distributed all of the shares of a subsidiary to the Company's stockholders in a spin-off. However, since all shares of the subsidiary were distributed in 2013, the Company's consolidated statements of comprehensive loss and statements of cash flows have been presented to show the discontinued operations of the subsidiary separately from continuing operations for all periods presented. Since the transaction was between entities under common control, the distribution of the shares of the subsidiary did not result in a gain or loss on distribution as it was recorded at historical carrying values.
15. Segments and Geographic Information
All revenue-generating activities are directly related to the sale, implementation and support of the Company's solutions in a single operating segment. The Company's chief operating decision maker, the Chief Executive Officer, reviews financial information presented on a consolidated basis for purposes of allocating resources and evaluating financial performance. All of the Company's principal operations, assets and decision-making functions are located in the United States.
16. Related Parties
For the years ended December 31, 2014, 2013 and 2012, the Company recorded revenues from a related-party customer of $0.4 million, $0.3 million and $0.3 million, respectively.
For the year ended December 31, 2012, the Company paid $0.1 million to related parties for professional services.
F-27
Q2 HOLDINGS, INC.
NOTES TO CONSOLIDATED FINANCIAL STATEMENTS
(in thousands, except per share amounts and unless otherwise indicated)
17. Selected Quarterly Financial Data (unaudited)
Selected summarized quarterly financial information for the years ended 2014 and 2013 is as follows:
Three Months Ended | ||||||||||||||||||||||||||||||||
March 31, 2013 | June 30, 2013 | September 30, 2013 | December 31, 2013 | March 31, 2014 | June 30, 2014 | September 30, 2014 | December 31, 2014 | |||||||||||||||||||||||||
Revenues | $ | 12,834 | $ | 14,044 | $ | 14,325 | $ | 15,669 | $ | 16,834 | $ | 19,158 | $ | 20,989 | $ | 22,148 | ||||||||||||||||
Cost of revenues | 7,807 | 8,408 | 9,167 | 10,879 | 10,212 | 10,830 | 12,143 | 12,869 | ||||||||||||||||||||||||
Gross profit | 5,027 | 5,636 | 5,158 | 4,790 | 6,622 | 8,328 | 8,846 | 9,279 | ||||||||||||||||||||||||
Operating expenses: | ||||||||||||||||||||||||||||||||
Sales and marketing | 3,060 | 4,138 | 4,599 | 4,929 | 5,509 | 6,032 | 5,642 | 5,886 | ||||||||||||||||||||||||
Research and development | 1,866 | 2,152 | 2,259 | 2,752 | 2,736 | 2,787 | 3,155 | 3,408 | ||||||||||||||||||||||||
General and administrative | 2,335 | 2,776 | 3,207 | 3,424 | 3,718 | 4,058 | 4,574 | 4,641 | ||||||||||||||||||||||||
Unoccupied lease charges | — | 148 | 88 | — | — | — | — | — | ||||||||||||||||||||||||
Total operating expenses | 7,261 | 9,214 | 10,153 | 11,105 | 11,963 | 12,877 | 13,371 | 13,935 | ||||||||||||||||||||||||
Loss from operations | (2,234 | ) | (3,578 | ) | (4,995 | ) | (6,315 | ) | (5,341 | ) | (4,549 | ) | (4,525 | ) | (4,656 | ) | ||||||||||||||||
Total other expense, net | (51 | ) | (116 | ) | (170 | ) | (162 | ) | (207 | ) | (119 | ) | (82 | ) | (84 | ) | ||||||||||||||||
Loss before income taxes | (2,285 | ) | (3,694 | ) | (5,165 | ) | (6,477 | ) | (5,548 | ) | (4,668 | ) | (4,607 | ) | (4,740 | ) | ||||||||||||||||
Provision for income taxes | (5 | ) | (14 | ) | (14 | ) | (22 | ) | (18 | ) | (15 | ) | (18 | ) | (20 | ) | ||||||||||||||||
Loss from continuing operations | (2,290 | ) | (3,708 | ) | (5,179 | ) | (6,499 | ) | (5,566 | ) | (4,683 | ) | (4,625 | ) | (4,760 | ) | ||||||||||||||||
Loss from discontinued operations, net of tax | (199 | ) | — | — | — | — | — | — | — | |||||||||||||||||||||||
Net loss | $ | (2,489 | ) | $ | (3,708 | ) | $ | (5,179 | ) | $ | (6,499 | ) | $ | (5,566 | ) | $ | (4,683 | ) | $ | (4,625 | ) | $ | (4,760 | ) | ||||||||
Reconciliation of net loss to adjusted EBITDA: | ||||||||||||||||||||||||||||||||
Net Loss | $ | (2,489 | ) | $ | (3,708 | ) | $ | (5,179 | ) | $ | (6,499 | ) | $ | (5,566 | ) | $ | (4,683 | ) | $ | (4,625 | ) | $ | (4,760 | ) | ||||||||
Depreciation and amortization | 638 | 624 | 809 | 900 | 999 | 1,031 | 1,092 | 961 | ||||||||||||||||||||||||
Stock-based compensation expense | ||||||||||||||||||||||||||||||||
Cost of revenues | 61 | 61 | 70 | 72 | 126 | 147 | 159 | 191 | ||||||||||||||||||||||||
Sales and marketing | 39 | 60 | 81 | 94 | 167 | 187 | 189 | 231 | ||||||||||||||||||||||||
Research and development | 59 | 66 | 64 | 68 | 107 | 122 | 131 | 167 | ||||||||||||||||||||||||
General and administrative | 175 | 189 | 197 | 249 | 518 | 612 | 622 | 894 | ||||||||||||||||||||||||
Provision for income taxes | 5 | 14 | 14 | 22 | 18 | 15 | 18 | 20 | ||||||||||||||||||||||||
Other expense, net | 51 | 116 | 170 | 162 | 207 | 119 | 82 | 84 | ||||||||||||||||||||||||
Unoccupied lease charge | — | 148 | 88 | — | — | — | — | — | ||||||||||||||||||||||||
Loss from discontinued operations, net of tax | 199 | — | — | — | — | — | — | — | ||||||||||||||||||||||||
Adjusted EBITDA | $ | (1,262 | ) | $ | (2,430 | ) | $ | (3,686 | ) | $ | (4,932 | ) | $ | (3,424 | ) | $ | (2,450 | ) | $ | (2,332 | ) | $ | (2,212 | ) | ||||||||
Registered users (1) | 2,609 | 2,900 | 2,956 | 3,124 | 3,447 | 3,941 | 4,123 | 4,340 | ||||||||||||||||||||||||
(1)Represents registered users at the end of the period.
F-28
Exhibit Index
Incorporated by Reference | ||||||||||||
Exhibit Number | Description | Form | Filing No. | Filing Date | Exhibit No. | Filed / Furnished Herewith | ||||||
2.1 | Agreement and Plan of Reorganization, dated July 27, 2007, by and among the Registrant, Q2 Acquisition Corporation, Q2 Software, Inc., and RHS Investments, L.P. | S-1 | 333- 193911 | 2/12/2014 | 2.1 | |||||||
2.2 | Agreement and Plan of Reorganization, dated July 27, 2007, by and among the Registrant, Cardinal Acquisition Corporation, Cardinal Software, Inc. and RHS Investments, Inc. | S-1 | 333- 193911 | 2/12/2014 | 2.2 | |||||||
2.3 | Asset Purchase Agreement, dated June 11, 2010, by and between Cardinal Software Inc., ITS, Inc., and ITS Acquisition Sub, Inc. | S-1 | 333- 193911 | 2/12/2014 | 2.3 | |||||||
2.4 | Separation and Distribution Agreement, dated March 1, 2013, by and between the Registrant, Q2 Software, Inc., CB Network Holdings, Inc. and CBANC Network, Incorporated | S-1 | 333- 193911 | 2/12/2014 | 2.4 | |||||||
3.1 | Fourth Amended and Restated Certificate of Incorporation of the Registrant | S-1/A | 333- 193911 | 3/6/2014 | 3.2 | |||||||
3.2 | Amended and Restated Bylaws of the Registrant | S-1/A | 333- 193911 | 3/6/2014 | 3.4 | |||||||
4.1 | Third Amended and Restated Investors’ Rights Agreement, dated March 1, 2013 | S-1 | 333- 193911 | 2/12/2014 | 4.1 | |||||||
10.1 | Form of Indemnification Agreement for directors and officers | S-1/A | 333- 193911 | 2/25/2014 | 10.1 | |||||||
10.2.1 | † | 2007 Stock Plan, as amended | S-1/A | 333- 193911 | 2/25/2014 | 10.2.1 | ||||||
10.2.2 | † | Form of Stock Option Agreement under the 2007 Stock Plan | S-1 | 333- 193911 | 2/12/2014 | 10.2.2 | ||||||
10.2.3 | † | Form of Stock Option Agreement for Executive Officers under the 2007 Stock Plan | S-1 | 333- 193911 | 2/12/2014 | 10.2.3 | ||||||
10.2.4 | † | Form of Stock Option Agreement for Directors under the 2007 Stock Plan | S-1 | 333- 193911 | 2/12/2014 | 10.2.4 | ||||||
10.3.1 | Credit Agreement, dated April 11, 2013, by and among Wells Fargo Bank, National Association, as administrative agent for the lenders named therein, the Registrant, and Q2 Software, Inc. | S-1 | 333- 193911 | 2/12/2014 | 10.3.1 | |||||||
10.3.2 | Amendment Number One to Credit Agreement, dated March 24, 2014, by and among Wells Fargo Bank, National Association, as administrative agent for the lenders named therein, the Company, and the Subsidiary | 8-K | 001-36350 | 3/28/2014 | 10.1 | |||||||
10.3.3 | Amendment Number Two to Credit Agreement, dated August 11, 2014, by and among Wells Fargo Bank, National Association, as administrative agent for the lenders named therein, the Company, and the Subsidiary | 10-Q | 001-36350 | 8/12/2014 | 10.1 | |||||||
10.3.4 | Guaranty and Security Agreement, dated April 11, 2013, by and among Wells Fargo Bank, National Association, as administrative agent for the lenders named therein, the Registrant, and Q2 Software, Inc. | S-1 | 333- 193911 | 2/12/2014 | 10.3.2 | |||||||
10.3.5 | Patent Security Agreement, dated April 11, 2013, by and among Wells Fargo Bank, National Association, as administrative agent for the lenders named therein, the Registrant, and Q2 Software, Inc. | S-1 | 333- 193911 | 2/12/2014 | 10.3.3 | |||||||
10.4.1 | Lease Agreement, dated November 20, 2012, by and among the Q2 Software, Inc. and 13785 Research Blvd, LLC | S-1 | 333- 193911 | 2/12/2014 | 10.4 | |||||||
10.4.2 | Lease Agreement, dated July 18, 2014, by and among Q2 Software, Inc. and CREF Aspen Lake Building II, LLC | 8-K | 001-36350 | 7/23/2014 | 10.1 | |||||||
10.5 | † | Amended and Restated Employment Agreement, dated February 20, 2014, by and among the Registrant and Matthew P. Flake | S-1/A | 333- 193911 | 2/25/2014 | 10.5 | ||||||
10.7 | † | Employment Agreement, dated February 20, 2014, by and among the Registrant and Jennifer N. Harris | * | |||||||||
10.8 | † | Employment Agreement, dated February 20, 2014, by and among the Registrant and Adam D. Anderson | * | |||||||||
Incorporated by Reference | ||||||||||||
Exhibit Number | Description | Form | Filing No. | Filing Date | Exhibit No. | Filed / Furnished Herewith | ||||||
10.9 | 2014 Equity Incentive Plan and forms of agreements thereunder | S-1/A | 333- 193911 | 3/6/2014 | 10.9 | |||||||
10.10 | † | Forms of Restricted Stock Units Agreements under the Registrant's 2014 Equity Incentive Plan. | 10-Q | 001-36350 | 11/10/2014 | 10.2 | ||||||
10.11 | † | 2014 Employee Stock Purchase Plan | S-1/A | 333- 193911 | 3/6/2014 | 10.10 | ||||||
10.12 | Master Service Agreement dated October 18, 2012, by and among the Registrant and ViaWest, Inc. | S-1 | 333- 193911 | 2/12/2014 | 10.11 | |||||||
10.13 | Master Service Agreement dated January 11, 2010, by and among the Registrant and Cyrus Networks, LLC | S-1 | 333- 193911 | 2/12/2014 | 10.12 | |||||||
10.13.1 | Service Level Agreement dated January 11, 2010, by and among the Registrant and Cyrus Networks, LLC | S-1 | 333- 193911 | 2/12/2014 | 10.12.1 | |||||||
21.1 | List of Subsidiaries of the Registrant | S-1 | 333- 193911 | 2/12/2014 | 21.1 | |||||||
23.1 | Consent of Ernst & Young LLP, Independent Registered Public Accounting Firm | * | ||||||||||
24.1 | Power of Attorney (see page 63 to this Annual Report on Form 10-K). | * | ||||||||||
31.1 | Certification of Principal Executive Officer Required Under Rule 13a-14(a) and 15d-14(a) of the Securities Exchange Act of 1934, as amended, as adopted pursuant to Section 302 of The Sarbanes-Oxley Act of 2002. | * | ||||||||||
31.2 | Certification of Principal Financial Officer Required Under Rule 13a-14(a) and 15d-14(a) of the Securities Exchange Act of 1934, as amended, as adopted pursuant to Section 302 of The Sarbanes-Oxley Act of 2002. | * | ||||||||||
32.1 | Certification of Principal Executive Officer Required Under Rule 13a-14(a) and 15d-14(a) of the Securities Exchange Act of 1934, as amended, and 18 U.S.C. §1350 as adopted pursuant to Section 906 of The Sarbanes-Oxley Act of 2002. | # | ||||||||||
32.2 | Certification of Principal Financial Officer Required under Rule 13a-14(a) and 15d-14(a) of the Securities Exchange Act of 1934, as amended, and 18 U.S.C. §1350 as adopted pursuant to Section 906 of The Sarbanes-Oxley Act of 2002. | # | ||||||||||
101.INS | XBRL Instance Document. | * | ||||||||||
101.SCH | XBRL Taxonomy Extension Schema. | * | ||||||||||
101.CAL | XBRL Taxonomy Extension Calculation Linkbase. | * | ||||||||||
101.LAB | XBRL Taxonomy Extension Calculation Label Linkbase. | * | ||||||||||
101.PRE | XBRL Taxonomy Extension Presentation Linkbase. | * | ||||||||||
101.DEF | XBRL Taxonomy Extension Definition Linkbase. | * | ||||||||||
* Filed herewith # Furnished herewith † Management contract, compensatory plan or arrangement | ||||||||||||