Attached files
| file | filename |
|---|---|
| EXCEL - IDEA: XBRL DOCUMENT - MAXWELL TECHNOLOGIES INC | Financial_Report.xls |
| EX-23.1 - EXHIBIT 23.1 - MAXWELL TECHNOLOGIES INC | mxwlex23112311410k.htm |
| EX-31.1 - EXHIBIT 31.1 - MAXWELL TECHNOLOGIES INC | mxwlex3111231201410k.htm |
| EX-32.2 - EXHIBIT 32.2 - MAXWELL TECHNOLOGIES INC | mxwlex3221231201410k.htm |
| EX-21.1 - EXHIBIT 21.1 - MAXWELL TECHNOLOGIES INC | mxwlex2111231201410k.htm |
| EX-32.1 - EXHIBIT 32.1 - MAXWELL TECHNOLOGIES INC | mxwlex3211231201410k.htm |
| EX-10.36 - EXHIBIT 10.36 - MAXWELL TECHNOLOGIES INC | mxwlex10361231201410k.htm |
| EX-10.37 - EXHIBIT 10.37 - MAXWELL TECHNOLOGIES INC | mxwlex10371231201410k.htm |
| EX-31.2 - EXHIBIT 31.2 - MAXWELL TECHNOLOGIES INC | mxwlex3121231201410k.htm |
UNITED STATES
SECURITIES AND EXCHANGE COMMISSION
Washington, D.C. 20549
FORM 10-K
(Mark One)
x | ANNUAL REPORT PURSUANT TO SECTION 13 OR 15(d) OF THE SECURITIES EXCHANGE ACT OF 1934 |
For the fiscal year ended December 31, 2014
OR
¨ | TRANSITION REPORT PURSUANT TO SECTION 13 OR 15(d) OF THE SECURITIES EXCHANGE ACT OF 1934 |
For the transition period from to
Commission file number 001-15477
MAXWELL TECHNOLOGIES, INC.
(Exact name of registrant as specified in its charter)
Delaware | 95-2390133 | |
(State or other jurisdiction of incorporation or organization) | (I.R.S. Employer Identification No.) | |
3888 Calle Fortunada San Diego, California | 92123 | |
(Address of principal executive offices) | (Zip Code) | |
Registrant’s telephone number, including area code: (858) 503-3300
Securities registered pursuant to Section 12(b) of the Act:
Title of Each Class | Name of Each Exchange on Which Registered | |
Common Stock, par value $0.10 per share | Nasdaq Global Market | |
Securities registered pursuant to Section 12(g) of the Act:
None
Indicate by check mark if the registrant is a well-known seasoned issuer, as defined in Rule 405 of the Securities Act. YES ¨ NO x
Indicate by check mark if the registrant is not required to file reports pursuant to Section 13 or Section 15(d) of the Act. YES ¨ NO x
Indicate by check mark whether the registrant: (1) has filed all reports required to be filed by Section 13 or 15(d) of the Securities Exchange Act of 1934 during the preceding 12 months (or for such shorter period that the registrant was required to file such reports), and (2) has been subject to such filing requirements for the past 90 days. YES x NO ¨
Indicate by check mark whether the registrant has submitted electronically and posted on its corporate Website, if any, every Interactive Data File required to be submitted and posted pursuant to Rule 405 of Regulation S-T (§ 232.405 of this chapter) during the preceding 12 months (or for such shorter period that the registrant was required to submit and post such files). YES x NO ¨
Indicate by check mark if disclosure of delinquent filers pursuant to Item 405 of Regulation S-K (§ 229.405 of this chapter) is not contained herein, and will not be contained, to the best of registrant’s knowledge, in definitive proxy or information statements incorporated by reference in Part III of this Form 10-K or any amendment to this Form 10-K. ¨
Indicate by check mark whether the registrant is a large accelerated filer, an accelerated filer, a non-accelerated filer or a smaller reporting company. See the definitions of “accelerated filer”, “large accelerated filer” and “smaller reporting company” in Rule 12b-2 of the Exchange Act.
Large accelerated filer ¨ | Accelerated filer x | Non-accelerated filer ¨ | Smaller reporting company ¨ | |||
Indicate by check mark whether the registrant is a shell company (as defined in Rule 12b-2 of the Act). YES ¨ NO x
The aggregate market value of Common Stock held by non-affiliates as of June 30, 2014 based on the closing price of the common stock on the NASDAQ Global Market was $429,368,263.
The number of shares of the registrant’s Common Stock outstanding as of February 10, 2015, was 29,891,268 shares.
DOCUMENTS INCORPORATED BY REFERENCE
Portions of the proxy statement for the registrant’s annual meeting of stockholders (the “Proxy Statement”) are incorporated by reference in Part III of this Form 10-K to the extent stated herein. The Proxy Statement will be filed within 120 days of the registrant’s fiscal year ended December 31, 2014.
MAXWELL TECHNOLOGIES, INC.
INDEX TO ANNUAL REPORT ON FORM 10-K
For the fiscal year ended December 31, 2014
Page | ||
i
SPECIAL NOTE REGARDING FORWARD-LOOKING STATEMENTS
Unless the context otherwise requires, all references to “Maxwell,” “the Company,” “we,” “us,” and “our” refer to Maxwell Technologies, Inc. and its subsidiaries. All references to “Maxwell SA” refer to our Swiss Subsidiary, Maxwell Technologies, SA.
Some of the statements contained in this Annual Report on Form 10-K and incorporated herein by reference discuss our plans and strategies for our business or make other forward-looking statements, within the meaning of Section 27A of the Securities Act of 1933, as amended, and Section 21E of the Securities Exchange Act of 1934, as amended. The words “anticipates,” “believes,” “estimates,” “expects,” “plans,” “intends,” “may,” “could,” “will,” “continue,” “seek,” “should,” “would” and similar expressions are intended to identify these forward-looking statements, but are not the exclusive means of identifying them. These forward-looking statements reflect the current views and beliefs of our management; however, various risks, uncertainties and contingencies could cause our actual results, performance or achievements to differ materially from those expressed in, or implied by, our statements. Such risks, uncertainties and contingencies include, but are not limited to, the following:
• | the accuracy of customer demand forecasts and our reliance on them for planning and resource allocation; |
• | dependence upon the sale of products to a small number of customers and vertical markets, some of which are heavily dependent on government funding or government subsidies which may or may not continue in the future; |
• | dependence upon the sale of products into Asia and Europe, where macroeconomic factors outside our control may adversely affect our sales; |
• | risks related to our international operations including, but not limited to, our ability to adequately comply with the changing rules and regulations in countries where our business is conducted, our ability to oversee and control our foreign subsidiaries and their operations, our ability to effectively manage the impact of foreign currency exchange rate fluctuations arising from our international operations, and our ability to continue to comply with the U.S. Foreign Corrupt Practices Act as well as the anti-bribery laws of foreign jurisdictions; |
• | our ability to remain competitive and stimulate customer demand through successful introduction of new products at competitive prices, and to educate our prospective customers on the products we offer; |
• | successful acquisition, development and retention of key personnel; |
• | our ability to effectively manage our reliance upon certain suppliers of key component parts, specialty equipment and logistical services; |
• | our ability to manage product quality problems; |
• | our ability to protect our intellectual property rights and to defend claims against us; |
• | our ability to effectively identify, enter into, manage and benefit from strategic alliances; |
• | occurrence of a catastrophic event at any of our facilities; |
• | occurrence of a technology systems failure, network disruption, or breach in data security; |
• | our ability to match production volume to actual customer demand; |
• | our ability to obtain sufficient capital to meet our operating or other needs; and |
• | our ability to manage and minimize the impact of unfavorable legal proceedings. |
Many of these factors are beyond our control. Additionally, there can be no assurance that we will not incur new or additional unforeseen costs or risks in connection with the ongoing conduct of our business. Accordingly, any forward-looking statements included herein do not purport to be predictions of future events or circumstances and may not be realized.
For a discussion of important risks associated with an investment in our securities, including factors that could cause actual results to differ materially from expectations referred to in the forward-looking statements, see Item 1A, Risk Factors, of this document. We do not have any obligation to update publicly any forward-looking statements, whether as a result of new information, future events or otherwise.
1
PART I
Item 1. | Business |
Introduction
Maxwell was incorporated under the name Maxwell Laboratories, Inc. in 1965. The Company made an initial public offering of common stock in 1983, and changed its name to Maxwell Technologies, Inc. in 1996. Today, we develop, manufacture and market energy storage and power delivery products for transportation, industrial, information technology and other applications and microelectronic products for space and satellite applications. Our products are designed and manufactured to perform reliably with minimal maintenance for the life of the applications into which they are integrated. We believe that this “life-of-the-application” reliability gives our products a competitive advantage and enables them to command higher profit margins than commodity products. We focus on the following lines of high-reliability products:
• | Ultracapacitors: Our primary focus, ultracapacitors, are energy storage devices that possess a unique combination of high power density, extremely long operational life and the ability to charge and discharge very rapidly. Our ultracapacitor cells and multi-cell packs and modules provide energy storage and power delivery solutions for applications in multiple industries, including transportation, automotive, information technology, renewable energy and industrial electronics. |
• | High-Voltage Capacitors: Our CONDIS® high-voltage capacitors are designed and manufactured to perform reliably for decades in all climates. These products include grading and coupling capacitors and electric voltage transformers that are used to ensure the safety and reliability of electric utility infrastructure and other applications involving transport, distribution and measurement of high-voltage electrical energy. |
• | Radiation-Hardened Microelectronic Products: Our radiation-hardened microelectronic products for satellites and spacecraft include single board computers and components, such as high-density memory and data conversion modules. Many of these products incorporate our proprietary RADPAK® packaging and shielding technology and novel architectures that enable them to withstand the effects of environmental radiation and perform reliably in space. |
General Product Line Overview
Ultracapacitors
Ultracapacitors enhance the efficiency and reliability of devices or systems that generate or consume electrical energy. They differ from other energy storage and power delivery products in that they combine rapid charge/discharge capabilities typically associated with film and electrolytic capacitors with energy storage capacity generally associated with batteries. Although batteries store significantly more electrical energy than ultracapacitors, they cannot charge and discharge as rapidly and efficiently as ultracapacitors. Conversely, although electrolytic capacitors can deliver bursts of high power very rapidly, they have extremely limited energy storage capacity, and therefore cannot sustain power delivery for as much as a full second. Also, unlike batteries, which store electrical energy by means of a chemical reaction and experience gradual depletion of their energy storage and power delivery capability over hundreds to a few thousand charge/discharge cycles, ultracapacitors’ energy storage and power delivery mechanisms involve no chemical reaction, so they can be charged and discharged hundreds of thousands to millions of times with minimal performance degradation. This ability to store energy, deliver bursts of power and perform reliably for many years with little or no maintenance makes ultracapacitors an attractive energy-efficiency option for a wide range of energy-consuming and generating devices and systems.
Based on potential volumes, we believe that the transportation industry represents the largest current market opportunity for ultracapacitors. Transportation applications include braking energy recuperation and torque-augmentation systems for hybrid-electric buses, trucks and autos and electric rail vehicles, vehicle power network smoothing and stabilization, engine starting systems for internal combustion vehicles and burst power for stop-start idle elimination systems.
Our ultracapacitor products have become a standard and often preferred energy storage solution for transportation applications such as hybrid-electric transit buses and electric rail systems and industrial electronics applications such as wind energy, automated utility meters in “smart grid” systems and backup power for telecommunications and information technology installations.
To reduce manufacturing cost and improve the performance of our ultracapacitor products, we developed a proprietary, solvent-free, process to produce the carbon film electrode material that enhances product performance and durability and accounts for a significant portion of the cost of ultracapacitor cells. This process has enabled us to become a low-cost producer of electrode material, and our favorable cost position has enabled us to price our product aggressively versus competitors and market electrode material to other ultracapacitor manufacturers. Although we do not intend to license this electrode technology
2
to other ultracapacitor or electrode manufacturers, we have licensed our proprietary cell architecture to manufacturers in China, Taiwan and Korea to expand and accelerate acceptance of ultracapacitor products in large and rapidly growing global markets.
High-Voltage Capacitors
High-voltage grading and coupling capacitors and electronic voltage transformers are used mainly in the electric utility industry. Grading and coupling capacitors are key components of circuit breakers that prevent high-voltage arcing that can damage switches, step-down transformers and other equipment that transmits or distributes high-voltage electrical energy in electric utility infrastructure and high-voltage laboratories. Electronic voltage transformers measure voltage and power levels in electric utility infrastructure. The market for these products consists of expansion, upgrading and maintenance of existing infrastructure and new infrastructure installations in developing countries. Such installations are capital-intensive and frequently are subject to regulation, availability of government funding and general economic conditions. For example, while North America has a large installed base of electric utility infrastructure, and has experienced power interruptions and supply problems, utility deregulation, government budget deficits, and other factors have limited recent capital spending in what historically has been a very large market for utility infrastructure components. We believe that projects to increase the availability of electrical energy in developing countries and infrastructure modernization and renovation in developed countries may continue to drive increasing demand for our high-voltage products in the years to come.
Radiation-Hardened Microelectronics
Radiation-hardened microelectronic products are used almost exclusively in space and satellite applications. Because satellites and spacecraft are extremely expensive to manufacture and launch, and space missions typically span years or even decades, and because it is impractical or impossible to repair or replace malfunctioning parts, the industry demands electronic components that are virtually failure-free. As satellites and spacecraft routinely encounter ionizing radiation from solar flares and other natural sources, onboard microelectronic components must be able to withstand such radiation and continue to perform reliably. For that reason, suppliers of components for space applications historically used only special radiation-hardened silicon in the manufacture of such components. However, the space market is relatively small and the process of producing “rad-hard” silicon is long and very expensive. In addition, because it takes several years to produce a rad-hard version of a new semiconductor, components using rad-hard silicon many times are several generations behind their current commercial counterparts in terms of density, processing power and functionality.
To address the performance gap between rad-hard and commercial silicon and provide components with both increased functionality and significantly greater processing power, Maxwell and a few other specialty components suppliers have developed shielding, packaging, and other radiation mitigation techniques that allow sensitive commercial semiconductors to withstand space radiation effects and perform as reliably as components incorporating rad-hard semiconductors. Although this market is limited in size, the value proposition for high-performance, radiation-tolerant, components enables us to generate profit margins much higher than those for commodity electronic components.
Business Strategy
Our primary objective is to significantly increase the Company’s revenue and profit margins by creating and satisfying demand for ultracapacitor-based energy storage and power delivery solutions. To accomplish this, we are focusing on:
Establishing and expanding market opportunities for ultracapacitors by:
• | Collaborating with key existing and prospective customers to develop ultracapacitor-based solutions for high-volume and high-value applications; |
• | Demonstrating the efficiency, durability and safety of our ultracapacitor products through extensive internal and third-party testing; |
• | Integrating mathematical models for ultracapacitors into simulation software used by system designers; |
• | Participating in a broad array of working groups, consortia and industry standards committees to disseminate knowledge of, and promote the use of, ultracapacitors; and |
• | Manufacturing products that are environmentally compatible. |
Becoming a preferred ultracapacitor supplier by:
• | Being a low-cost producer and demonstrating ultracapacitors’ value proposition; |
• | Designing and manufacturing products with “life-of-the-application” durability; |
3
• | Building a robust supply chain through global sourcing; |
• | Achieving superior performance and manufacturing quality while reducing product cost; |
• | Developing and deploying enabling technologies and systems, including cell-to-cell and module-to-module balancing and integrated charging systems, among others; |
• | Marketing high-performance, low-cost electrode material to other manufacturers; and |
• | Establishing and maintaining broad and deep protections of key intellectual property. |
We also seek to expand market opportunities and revenue for our high-voltage capacitors and radiation-hardened microelectronic products. While these products address highly specialized applications, we are a technology leader in the market niches they serve, and thus are able to sell our products at attractive profit margins. To maintain and expand this competitive position we are leveraging our technological expertise to develop new products that not only meet the demands of our current markets, but also address additional applications. For example, in 2012, we introduced a line of high-voltage capacitors and electronic voltage transformers that operate at temperatures down to -60º C for electric utility grid installations in regions that experience extremely low temperatures.
Products and Applications
Our products incorporate our know-how and proprietary energy storage and power delivery and microelectronics technologies at both the component and system levels for specialized, high-value applications that demand “life-of-the-application” reliability.
Ultracapacitors
Ultracapacitors, also known as electrochemical double-layer capacitors (“EDLC”) or supercapacitors, store energy electrostatically by polarizing an organic salt solution within a sealed package. Although ultracapacitors are electrochemical devices, no chemical reaction is involved in their energy storage mechanism. Their electrostatic energy storage mechanism is fully reversible, allowing ultracapacitors to be rapidly charged and discharged hundreds of thousands to millions of times with minimal performance degradation, even in the most demanding heavy charge/discharge applications.
Compared with electrolytic capacitors, which have very low energy storage capacity and discharge power too rapidly to be suitable for many power delivery applications, ultracapacitors have much greater energy storage capacity and can deliver energy over time periods ranging from fractions of a second to several minutes.
Compared with batteries, which require minutes or hours to fully charge or discharge, ultracapacitors discharge and recharge in as little as fractions of a second. Although ultracapacitors store only about five to ten percent as much electrical energy as a battery of comparable size, they can deliver or absorb electric energy up to 100 times more rapidly than batteries. Because they operate reliably through hundreds of thousands to millions of deep discharge cycles, compared with only hundreds to a few thousand equivalent cycles for batteries, ultracapacitors have significantly higher lifetime energy throughput, which equates to significantly lower cost on a life cycle basis.
We link our ultracapacitor cells together in multi-cell modules to satisfy energy storage and power delivery requirements of varying voltages. Both individual cells and multi-cell products can be charged from any primary energy source, such as a battery, generator, fuel cell, solar panel, wind turbine or electrical outlet. Virtually any device or system whose intermittent peak power demands are greater than its average continuous power requirement is a candidate for an ultracapacitor-based energy storage and power delivery solution.
Our ultracapacitor products have significant advantages over batteries, including:
• | the ability to charge and discharge up to 100 times faster; |
• | significantly lower weight per unit of power delivery; |
• | higher charge/discharge turnaround efficiency, minimizing energy loss; |
• | the ability to operate reliably and continuously in extreme temperatures (-40º C to +65º C); |
• | minimal to no maintenance requirements; |
• | “life of the application” durability; and |
• | minimal environmental issues associated with disposal because they contain no heavy metals. |
4
With no moving parts and no chemical reactions involved in their energy storage mechanism, ultracapacitors provide a simple, highly reliable, “solid state-like” solution to buffer short-term mismatches between power available and power required. Additionally, ultracapacitors offer the advantage of storing energy in the same form in which it is used, as electricity.
Emerging applications, including increasing use of electric power in vehicles and growing demand for highly reliable, maintenance-free, backup power for telecommunications, information technology and industrial installations, are creating significant opportunities for more efficient and reliable energy storage and power delivery products. In many applications, power demand varies widely from moment to moment, and peak power demand typically is much greater than the average power requirement. For example, automobiles require 10 times more power to accelerate than to maintain a constant speed, and forklifts require more power to lift a heavy pallet of material than to move from place to place within a warehouse.
Engineers historically have addressed transient peak power requirements by over-sizing the engine, battery or other primary energy source to satisfy all of a system’s power demands, including demands that occur infrequently and may last only fractions of a second. Sizing a primary power source to meet brief peak power requirements, rather than for average power requirements, is costly and inefficient. When a primary energy source is coupled with ultracapacitors, which can deliver or absorb brief bursts of high power on demand for periods of time ranging from fractions of a second to several minutes, the primary energy source can be smaller, lighter and less expensive.
The following diagram depicts the separation of a primary energy storage source from a peak power delivery component to satisfy the requirements of a particular application. Components that enable this separation allow designers to optimize the size, efficiency and cost of the entire electrical power system.
Peak Power Application Model
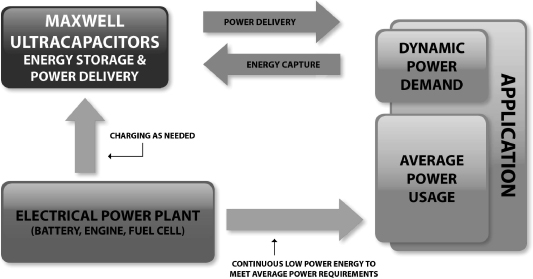
Although batteries remain the most widely used component for both energy storage and peak power delivery, ultracapacitors, more advanced batteries and flywheels now enable system designers to separate and optimize these functions. Based in part on our ultracapacitor products’ declining cost, high performance and “life-of-the-application” durability, they are becoming a preferred solution for many energy storage and power delivery applications.
We offer our ultracapacitor cells with capacitances ranging from 1 to 3,400 farads. Applications such as hybrid-electric bus, truck and auto drive trains, electric rail systems and UPS systems require integrated energy storage systems consisting of up to hundreds of ultracapacitor cells. To facilitate adoption of ultracapacitors for these larger systems, we have developed integration technologies, including proprietary electrical balancing and thermal management systems and interconnect
5
technologies. We hold patents for certain of these technologies. We offer a broad range of standard multi-cell modules. Our current standard multi-cell products each incorporate from six to 60 of our cells to provide “plug and play” solutions for applications requiring from 16 to 160 volts, and these modules are designed to be linked together for higher voltage applications.
High-Voltage Capacitors
Electric utility infrastructure includes switches, circuit breakers, step-down transformers and measurement instruments that transmit, distribute and measure high-voltage electrical energy. High-voltage capacitors are used to protect these systems from high-voltage arcing. With operational lifetimes measured in decades, these applications require high reliability and durability.
Through our acquisition in 2002 of Montena Components Ltd., now known as Maxwell Technologies SA, and its CONDIS® line of high-voltage capacitor products, Maxwell has more than 30 years of experience in this industry, and is the world’s largest producer of such products for use in utility infrastructure. Engineers with specific expertise in high-voltage systems develop, design and test our high-voltage capacitor products in our development and production facility in Rossens, Switzerland. Our high-voltage capacitors are produced through a proprietary assembly and automated winding process to ensure consistent quality and reliability. Since our acquisition of this business, we have upgraded and expanded our high-voltage capacitor production facility to double its output capacity and significantly shorten order-to-delivery intervals.
We sell our high-voltage capacitor products to large systems integrators, which install and service power plants and electrical utility infrastructure worldwide.
Radiation-Hardened Microelectronic Products
Manufacturers of satellites and other spacecraft require microelectronic components and sub-systems that meet specific functional requirements and can withstand exposure to gamma rays, hot electrons and protons and other environmental radiation encountered in space. In the past, microelectronic components and systems for such special applications used only specially fabricated radiation-hardened silicon. However, the process of designing and producing rad-hard silicon is lengthy and expensive, and there are only a few specialty semiconductor wafer fabricators, so supplies of rad-hard silicon are limited. Therefore, there is demand for space-qualified components made with higher-performance, lower-cost commercial silicon, protected by shielding and other radiation mitigation techniques. Producing our components and systems incorporating radiation-protected commercial silicon requires expertise in power electronics, circuit design, silicon selection, radiation shielding and quality assurance testing.
We design, manufacture and market radiation-hardened microelectronic products, including single-board computers and components such as memory and power modules, for the space and satellite markets. Using highly adaptable, proprietary, packaging and shielding technology and other radiation mitigation techniques, we design and manufacture products that allow satellite and spacecraft manufacturers to use powerful, low cost, commercial semiconductors that are protected with the level of radiation mitigation required for reliable performance in the specific orbit or environment in which they are to be deployed.
Manufacturing
Our internal manufacturing operations are conducted in production facilities located in San Diego, California, Peoria, Arizona, and Rossens, Switzerland. We have made substantial capital investments to outfit and expand our internal production facilities and incorporate mechanization and automation techniques and processes. We have trained our manufacturing personnel in advanced operational techniques, added information technology infrastructure and implemented new business processes and systems to increase our manufacturing capacity and improve efficiency, planning and product quality. Our ultracapacitor electrode material is produced at our San Diego and Peoria facilities, where we have installed new electrode fabrication equipment that quadrupled production capacity between 2009 and 2014. We outsource the assembly of our 60 mm diameter large cell ultracapacitors, and subsequently, assembly of large cell-based multi-cell modules to Belton Technology Group (“Belton”), a contract manufacturer based in Shenzhen, China. In 2011, Belton installed a new large cell assembly line that doubled its previous production capacity, and a third line was installed in 2013. In 2010, we outsourced assembly of our mid-size “D-cell” ultracapacitor products and D-cell-based multi-cell modules to the Tianjin Lishen Battery Joint-Stock Co. Ltd. Company (“Lishen”), one of China’s largest producers of lithium-ion batteries, based in Tianjin. With the completion of the above-noted electrode and large cell ultracapacitor capacity expansions, we believe that we have sufficient capacity to meet near-term demand for all of our product lines.
6
Ultracapacitors
We currently produce 10-farad prismatic ultracapacitor cells and our new engine start module, on production lines in our San Diego and Peoria facilities, respectively. As noted above, we have outsourced assembly of all other cell types and multi-cell modules to contract manufacturers in Asia. To reduce cost, simplify assembly and facilitate automation, we have redesigned our ultracapacitor products to incorporate lower-cost materials and to reduce both the number of parts in a finished cell and the number of manufacturing process steps required to produce them. We intend to continue using outsourced cell and module assembly in countries with low-cost labor, but plan to continue to produce our proprietary electrode material only in internal production facilities to ensure protection of our intellectual property.
We produce electrode material for our own ultracapacitor products, and for sale to other ultracapacitor manufacturers, such as Yeong-Long Technologies Co., Ltd., (“YEC”) and Shanghai Sanjiu Electric Equipment Company, Ltd., at our San Diego and Peoria locations. In 2012, we completed the installation of an advanced carbon powder processing system as part of a major electrode capacity expansion in San Diego, and we completed installation of a similar system in our Peoria, Arizona facility in 2013. These new facilities give us sufficient capacity to support both our current ultracapacitor production requirements and external electrode demand in the near term. As demand increases, additional increments of electrode production capacity can be added within a year through the utilization of established equipment vendors. We intend to continue producing this proprietary material internally, and do not contemplate licensing our solvent-free electrode fabrication process to ultracapacitor electrode customers or competing suppliers of such material.
High-Voltage Capacitors
We produce our high-voltage grading and coupling capacitors and electronic voltage transformers in our Rossens, Switzerland facility. We believe we are the only high-voltage capacitor producer that manufactures its products with stacking, assembly and automated winding processes. This enables us to produce consistent, high quality and highly reliable products, and gives us sufficient capacity to satisfy anticipated global customer demand. Using advanced demand-based techniques, we upgraded the assembly portion of the process to a “cell-based,” “just-in-time” design in 2004, doubling our production capacity without adding direct labor, and significantly shortening order-to-delivery intervals. This upgrade and subsequent capacity expansion also enabled us to manufacture products for the electronic voltage transformer, which we did not previously serve.
Radiation-Hardened Microelectronics Products
We produce our radiation-hardened microelectronics products in our San Diego production facility. We have re-engineered our production processes for microelectronic products, resulting in substantial reductions in cycle time and a significant increase in yield. This facility maintains the QML-V and QML-Q certifications issued by the Department of Defense procurement agency.
Our microelectronics production operations include die characterization, packaging and electrical, environmental and life testing. As a result of manufacturing cycle time reductions and operator productivity increases achieved over the past several years, we believe that this facility is capable of significantly increasing its current output with minimal additional direct labor or capital expenditure, and therefore, that we have ample capacity to meet foreseeable demand in the space and satellite markets.
Suppliers
We generally purchase components and materials, such as carbon powder, certain electronic components, dielectric materials, silicon die, and ceramic insulators from a number of suppliers. For certain products, we rely on a limited number of suppliers or a single supplier for a number of reasons, including notably, the cost effectiveness of doing business with a single supplier. Although we believe there are alternative sources for some of the components and materials that we currently obtain from a single source, there can be no assurance that we will be able to identify and qualify alternative suppliers in a timely and cost effective manner. Therefore, for certain critical components, we utilize mitigation strategies such as, for example, maintaining an inventory of safety stock on our own premises in an effort to minimize the impact of an unforeseen disruption in supply from these outside parties.
Marketing and Sales
We market and sell our products worldwide through both direct and indirect sales channels for incorporation by integrators and OEM customers into a wide range of end products. Because the introduction of products based on emerging technologies requires customer acceptance of new and unfamiliar technical approaches, and because many OEM customers have rigorous vendor qualification processes, the design-in process and initial sale of our products often takes months or even years.
7
Our principal marketing strategy is to identify applications for which our products and technology offer a compelling value proposition, to become a preferred vendor on the basis of service and price, and to negotiate supply agreements that enable us to establish long-term relationships with key OEM and integrator customers. As these design-in sales tend to be technical and engineering-intensive, we organize market-specific teams composed of sales, applications engineering and other technical and operational personnel to work closely with our customers across multiple disciplines to satisfy their requirements for form, fit, function and environmental needs. As time-to-market often is a primary motivation for our customers to use our products, the initial sale and design-in process typically evolves into ongoing account management to ensure on-time delivery, responsive technical support and problem-solving.
We design and conduct discrete marketing programs intended to position and promote each of our product lines. These include trade shows, seminars, advertising, product publicity, distribution of product literature, internet websites and “social media.” We employ marketing communications specialists and outside consultants to develop and implement our marketing programs, design and develop marketing materials, negotiate advertising media purchases, write and place product press releases and manage our marketing websites.
We have an alliance with YEC to assemble and market small cell ultracapacitor products. In addition, we sell electrode material to YEC, both for Maxwell-branded products and for incorporation into YEC’s own ultracapacitor products, and to Shanghai Sanjiu Electric Equipment Company, which has licensed some of our large cell designs and has introduced its own brand of ultracapacitor products in China.
Competition
Each of our product lines has competitors, some of whom have longer operating histories, significantly greater financial, technical, marketing and other resources, greater name recognition and larger installed customer bases than we have. In some of the target markets for our emerging technologies, we face competition both from products utilizing well-established, existing technologies and other novel or emerging technologies.
Ultracapacitors
Our ultracapacitor products have two types of competitors: other ultracapacitor suppliers and purveyors of energy storage and power delivery solutions based on batteries or other technologies. Although a number of companies are developing ultracapacitor products and technology, our principal competitors in the supply of ultracapacitor or supercapacitor products are Panasonic, a division of Matsushita Electric Industrial Co., Ltd., NessCap Co., Ltd., LS Mtron, a unit of LS Cable, Supreme Power Solutions Co., Ltd., Vina Technology Company, Ltd., Samxon, a unit of Man Yue Technology Holdings, Ltd., and Ioxus, Inc. The key competitive factors in the ultracapacitor industry are price, performance (energy stored and power delivered per unit volume), durability and reliability, operational lifetime and overall breadth of product offerings. We believe that our ultracapacitor products and electrode material compete favorably with respect to all of these competitive factors. However, the hybrid transit vehicle market for ultracapacitors in China, a region which has historically represented a significant portion of our sales, has recently become more competitive with respect to pricing, which may cause us to lower our prices to remain competitive, or may reduce our market share. In addition, the recent increase in the number of competitors in the hybrid transit vehicle market in China may drive down our market share.
Ultracapacitors also compete with products based on other technologies, including advanced batteries in power quality and peak power applications, and flywheels, thermal storage and batteries in backup energy storage applications. We believe that ultracapacitors’ durability, long life, performance and value give them a competitive advantage over these alternative choices in many applications. In addition, integration of ultracapacitors with some of these competing products may provide optimized solutions that neither product can provide by itself. For example, Tier 1 auto parts supplier Continental AG designed a combined solution incorporating ultracapacitors with a battery for engine starting in a stop-start idle elimination system for “micro hybrid” autos that was introduced by French automaker PSA Peugeot Citroen in 2010, and has now been installed in more than one million cars.
High-Voltage Capacitors
Maxwell, through its acquisition in 2002 of Montena Components Ltd., now known as Maxwell Technologies SA, with its CONDIS® line of high-voltage capacitor products, is the world’s largest producer of high-voltage capacitors for use in electric utility infrastructure. Our principal competitors in the high-voltage capacitor markets are in-house production groups of certain of our customers and other independent manufacturers, such as the Coil Product Division of Trench Limited in Canada and Europe and Hochspannungsgeräte Porz GmbH in Germany. We believe that we compete favorably, both as a consistent supplier of highly reliable high-voltage capacitors, and in terms of our expertise in high-voltage systems design. Over the last ten years, our largest customer has transitioned from producing its grading and coupling capacitors internally to outsourcing substantially all of its requirements to us.
8
Radiation-Hardened Microelectronic Products
Our radiation-hardened single-board computers and components compete with the products of traditional radiation-hardened integrated circuit suppliers such as Honeywell, BAE Systems and Aeroflex. We also compete with commercial integrated circuit suppliers with product lines that have inherent radiation tolerance characteristics, such as Texas Instruments, Analog Devices and Atmel in Europe. Our proprietary radiation-hardening technologies enable us to provide flexible, high function, cost-competitive, radiation-hardened products based on the most advanced commercial electronic circuits and processors. In addition, we compete with component product offerings from high reliability packaging houses such as Micross Components, Microsemi Corporation and Teledyne Microelectronics, a unit of Teledyne Technologies, Inc.
Research and Development
We maintain active research and development programs to improve existing products and develop new products. For the year ended December 31, 2014, our research and development expenditures totaled approximately $26.3 million, compared with $22.5 million and $21.7 million in the years ended December 31, 2013 and December 31, 2012, respectively. In general, we focus our research and product development activities on:
• | designing and producing products that perform reliably for the life of the end products or systems into which they are integrated; |
• | making our products less expensive to produce so as to improve our profit margins and to enable us to reduce prices so that our products can penetrate new, price-enabled applications; |
• | designing our products to have superior technical performance; |
• | designing our products to be compact and light; and |
• | designing new products that provide novel solutions to expand our market opportunities. |
Most of our current research, development and engineering activities are focused on material science, including activated carbon, electrolyte, electrically conducting and dielectric materials, ceramics and radiation-tolerant silicon and ceramic composites to reduce cost and improve performance, reliability and ease of manufacture. Additional efforts are focused on product design and manufacturing engineering and manufacturing processes for high-volume manufacturing.
Ultracapacitors
The principal focus of our ultracapacitor development activities is to increase power and energy density, reduce internal resistance, extend operational life and reduce manufacturing cost. Our ultracapacitor designs focus on low-cost, high-capacity cells in standard sizes ranging from 1 to 3,400 farads, and corresponding multi-cell modules based on various form factors.
High-Voltage Capacitors
The principal focus of our high-voltage capacitor development efforts is to enhance performance and reliability while reducing the size, weight and manufacturing cost of our products. We also are directing our design efforts to develop high-voltage capacitors for additional applications.
Microelectronic Products
The principal focus of our microelectronics product development activities is on circuit design, shielding and other radiation-hardening techniques that allow the use of powerful commercial silicon components in space and satellite applications that require ultra-high reliability. We also focus on creating system solutions that overcome the basic failure mechanisms of individual components through architectural approaches, including redundancy, mitigation and correction. This involves expertise in system architecture, including algorithm and microcode development, circuit design and the physics of radiation effects on silicon electronic components.
Intellectual Property
We place a strong emphasis on inventing, protecting and exploiting proprietary technologies, processes and designs which bring intrinsic value and uniqueness to our product portfolio. We place a high priority on obtaining patents to provide the broadest and strongest possible protection for our products, technologies and other strategic initiatives. Our continued success will depend in part on our ability to protect our existing patents and to secure patent protection on developing technologies. As of December 31, 2014, we held 95 issued U.S. patents and 20 published pending U.S. patent applications which relate to our core technologies, processes and designs. Of these issued patents, 62 relate to our ultracapacitor products and technology, six relate to our high-voltage capacitor products and technology, and 27 relate to our microelectronics products and technology.
9
Our pending and any future patent applications may not survive the challenges of patent prosecution in the jurisdictions in which we file throughout the world; however, our strategy is to focus on countries generating revenue as well as markets which we deem key to our business strategies and objectives. We routinely seek patent protection in the United States and the principal countries of Europe and Asia. At present, with the exception of microcode architectures within our radiation-hardened microelectronics product line, we do not rely on licenses from any third parties to produce our products.
Our existing patent portfolios and pending patent applications relate primarily to:
Ultracapacitors
• | compositions of the electrode, including its formulation, design and fabrication techniques; |
• | physical cell package designs as well as the affiliated processes used in cell assembly; |
• | cell-to-cell and module-to-module interconnect technologies that minimize equivalent series resistance and enhance the functionality, performance and longevity of ultracapacitor products including system level electronics; and |
• | module and system designs that facilitate applications of ultracapacitor technology. |
Microelectronics
• | system architectures that enable commercial silicon products to be used in radiation-intense space environments; |
• | technologies and designs that improve packaging densities while mitigating the effect of radiation on commercial silicon; |
• | radiation-mitigation techniques that improve performance while protecting sensitive commercial silicon from the effects of environmental radiation in space; and |
• | fault-tolerant computer systems with a plurality of processors which avoid deficiencies typically experienced by similar systems due to ionizing radiation. |
High-Voltage Capacitors
• | manufacture of capacitors in a manner which significantly reduces exposure of internal components to impurities, moisture and other undesirable materials in an effort to avoid longer manufacturing times and reduced performance characteristics without these technical advancements. |
Historically, our high-voltage capacitor products have been based on our know-how and trade secrets rather than on patents. We filed our first patent application covering our high-voltage capacitor technology in 2003, and we continue to pursue patent protection in addition to trade secret protection of certain aspects of our products’ design and production.
While our primary strategy for protecting our proprietary technologies, processes and designs is related to obtaining patents, we also apply for trademark registrations which identify us as the source of the products. Additionally, we promote our technologies, processes and designs in association with these registered trademarks to further distinguish our products from those of our competitors. As of December 31, 2014, we had twelve formal trademark registrations within the U.S.
Establishing and protecting proprietary products and technologies is a key element of our corporate strategy. Although we attempt to protect our intellectual property rights through patents, trademarks, copyrights, trade secrets and other measures, there can be no assurance that these steps will be adequate to prevent infringement, misappropriation or other misuse by third parties, or will be adequate under the laws of some foreign countries, which may not protect our intellectual property rights to the same extent as do the laws of the U.S.
We use employee and third-party confidentiality and nondisclosure agreements to protect our trade secrets and unpatented know-how. We require each of our employees to enter into a proprietary rights and nondisclosure agreement in which the employee agrees to maintain the confidentiality of all our proprietary information and, subject to certain exceptions, to assign to us all rights in any proprietary information or technology made or contributed by the employee during his or her employment with us. In addition, we regularly enter into nondisclosure agreements with third parties, such as potential product development partners and customers, to protect any information disclosed in the pursuit of securing possible fruitful business endeavors.
10
Financial Information by Geographic Areas
Year ending December 31, | |||||||||||||||||||||
2014 | 2013 | 2012 | |||||||||||||||||||
Amount | Percent | Amount | Percent | Amount | Percent | ||||||||||||||||
(Dollars in thousands) | |||||||||||||||||||||
Revenues from external customers located in: | |||||||||||||||||||||
China | $ | 89,143 | 48 | % | $ | 92,817 | 48 | % | $ | 74,054 | 46 | % | |||||||||
United States | 23,758 | 13 | % | 29,090 | 15 | % | 26,473 | 17 | % | ||||||||||||
Germany | 16,384 | 9 | % | 25,935 | 13 | % | 25,119 | 16 | % | ||||||||||||
All other countries (1) | 57,301 | 30 | % | 45,692 | 24 | % | 33,612 | 21 | % | ||||||||||||
Total | $ | 186,586 | 100 | % | $ | 193,534 | 100 | % | $ | 159,258 | 100 | % | |||||||||
_____________
(1) | Revenue from external customers located in countries included in “All other countries” do not individually comprise more than 10% of total revenues for any of the years presented. |
Year ending December 31, | |||||||||||||||||||||
2014 | 2013 | 2012 | |||||||||||||||||||
Amount | Percent | Amount | Percent | Amount | Percent | ||||||||||||||||
(Dollars in thousands) | |||||||||||||||||||||
Long-lived assets: | |||||||||||||||||||||
United States | $ | 28,013 | 72 | % | $ | 33,740 | 74 | % | $ | 24,239 | 67 | % | |||||||||
China | 4,991 | 13 | % | 5,444 | 12 | % | 6,340 | 17 | % | ||||||||||||
Switzerland | 5,663 | 15 | % | 6,422 | 14 | % | 5,862 | 16 | % | ||||||||||||
Total | $ | 38,667 | 100 | % | $ | 45,606 | 100 | % | $ | 36,441 | 100 | % | |||||||||
Revenues by Product Line
Year ending December 31, | |||||||||||||||||||||
2014 | 2013 | 2012 | |||||||||||||||||||
Amount | Percent | Amount | Percent | Amount | Percent | ||||||||||||||||
(Dollars in thousands) | |||||||||||||||||||||
Ultracapacitors | $ | 135,637 | 73 | % | $ | 136,277 | 71 | % | $ | 95,953 | 60 | % | |||||||||
High-voltage capacitors | 40,361 | 21 | % | 43,339 | 22 | % | 45,574 | 29 | % | ||||||||||||
Microelectronic products | 10,588 | 6 | % | 13,918 | 7 | % | 17,731 | 11 | % | ||||||||||||
Total | $ | 186,586 | 100 | % | $ | 193,534 | 100 | % | $ | 159,258 | 100 | % | |||||||||
Risks Attendant to Foreign Operations and Dependence
We have substantial operations in Switzerland, and we derive a significant portion of our revenues from sales to customers located outside the U.S. We expect our international sales to continue to represent a significant amount of our future revenues. As a result, our business will continue to be subject to certain risks, such as those imposed by domestic laws and regulations related to topics such as export controls and interactions with foreign officials as well as foreign government regulations, including, notably, changes in tax laws, tax treaties, tariffs and freight rates. To the extent that we are unable to respond effectively to political, economic and other conditions in the countries where we operate and do business, our results of operations and financial condition could be materially adversely affected. Some of our business partners also have international operations and are subject to the risks described above. Even if we are able to successfully manage the risks of international operations, our business may be adversely affected if our business partners are not able to successfully manage these risks as well.
Having substantial international operations also increases the complexity of managing our financial reporting and internal controls and procedures. Additionally, as a result of our extensive international operations and significant revenue generated
11
outside the U.S., the dollar amount of our current and future revenues, expenses and debt may be materially affected by fluctuations in foreign currency exchange rates. Similarly, assets and liabilities of our Swiss subsidiary that are not denominated in its functional currency are subject to effects of currency fluctuations, which may affect our reported earnings. Also, changes in the mix of income from our domestic and foreign operations, expiration of tax holidays and changes in tax laws and regulations could increase our tax expense. If we are unable to manage these risks effectively, it could impair our ability to achieve our targets for revenues and profitability.
As a result of our status as a publicly traded company within the U.S., we are subject to the U.S. Foreign Corrupt Practices Act (“FCPA”), which prohibits companies from making improper payments to foreign officials for the purpose of obtaining or keeping business. Additionally, as a result of our international operations, we could also be subject to the anti-bribery laws of other jurisdictions which vary slightly from jurisdiction to jurisdiction and may be different than the FCPA. If we fail to comply with anti-bribery laws and regulations, we could be subject to civil and/or criminal penalties as well as expenses related to any internal investigation.
Backlog
Product backlog as of December 31, 2014 was approximately $18.9 million, compared with $28.1 million as of December 31, 2013. Backlog consists of firm orders for products that will be delivered within 12 months. The actual amount of backlog at any particular time may not be a meaningful indicator of future business prospects as this amount is impacted by a number of factors including potential cancellations of orders by our customers.
Significant Customers
One customer, Shenzhen Xinlikang Supply China Management Co. Ltd., accounted for 20% of total revenue, 22% of total revenue and 18% of total revenue in the years ended December 31, 2014, 2013 and 2012, respectively.
Government Regulation
Due to the nature of our operations, including, notably, the use of hazardous substances in some of our manufacturing and research and development activities, we are subject to stringent federal, state and local laws, rules, regulations and policies governing workplace safety and environmental protection. These include the use, generation, manufacture, storage, air emission, effluent discharge, handling and disposal of certain materials and wastes. In the course of our historical operations, materials or wastes may have spilled or been released from properties owned or leased by us or on or under other locations where these materials and wastes have been taken for disposal. These properties and the materials and wastes spilled, released, or disposed thereon are subject to environmental laws which may impose strict liability, without regard to fault or the legality of the original conduct, for remediation of contamination resulting from such releases. Under such laws and regulations, we could be required to remediate previously spilled, released, or disposed substances or wastes, or to make capital improvements to prevent future contamination. Failure to comply with such laws and regulations also could result in the assessment of substantial administrative, civil and criminal penalties and even the issuance of injunctions restricting or prohibiting our activities. It is also possible that implementation of stricter environmental laws and regulations in the future could result in additional costs or liabilities to us as well as the industry in general. While we believe we are in substantial compliance with existing environmental laws and regulations, we cannot be certain that we will not incur substantial costs in the future.
In addition, certain of our microelectronics products are subject to International Traffic in Arms export regulations when they are sold to customers outside the U.S. We routinely obtain export licenses for such product shipments outside the U.S.
Employees
As of December 31, 2014, we had 510 employees in five countries, as follows: 320 full-time, three part-time and 32 temporary employees in the U.S.; 88 full-time and 16 part-time employees, and seven temporary employees, in Switzerland; 34 full-time employees in China; nine full-time employees in Germany, and one full-time employee in Korea. We are unable to estimate the percent of our Swiss employees that are members of a labor union, as Swiss law prohibits employers from inquiring into the union status of employees. We consider our relations with our employees to be good.
12
Available Information
We file annual, quarterly and current reports, proxy statements and other information with the Securities and Exchange Commission (“SEC”). Our SEC filings are available free of charge to the public over the Internet at the SEC’s website at http://www.sec.gov. Our SEC filings are also available free of charge on our website at http://www.maxwell.com as soon as reasonably practicable following the time that they are filed with the SEC. You may also read and copy any document we file with the SEC at the SEC’s Public Reference Room at 450 Fifth Street, NW, Washington, DC 20549. You may obtain information on the operation of the Public Reference Room by calling the SEC at 1-800-SEC-0330. The information found on our website is not part of this or any report that we file with the SEC.
13
Item 1A. Risk Factors
An investment in our common stock involves a high degree of risk. Our business, financial condition and results of operations could be seriously harmed if potentially adverse developments, some of which are described below, materialize and cannot be resolved successfully. In any such case, the market price of our common stock could decline and you may lose all or part of your investment in our common stock.
The risks and uncertainties described below are not the only ones we face. Additional risks and uncertainties, including those not presently known to us or that we currently deem immaterial, may also result in decreased revenues, increased expenses or other adverse impacts that could result in a decline in the price of our common stock. You should also refer to the other information set forth in this Annual Report on Form 10-K, including our consolidated financial statements and the related notes.
A substantial percentage of our total revenue depends on the sale of products within a small number of vertical markets and a small number of geographic regions, and the decline in the size of a vertical market or reduction of consumption within a geographic region, could impede our growth and profitability.
Sales within a relatively small number of vertical markets and a small number of geographic regions make up a large portion of our revenues. Our ability to grow our sales within this limited number of markets and regions depends on our ability to compete on price, delivery and quality. If a particular market into which we sell experiences a decline, then our customers will decrease their own consumption of our products thereby reducing our revenues. For example, if consumers are no longer accepting of start-stop systems within passenger automobiles, then our direct customers will no longer consume products from us for incorporation into such applications. Additionally, a substantial portion of our revenues stems from sales to customers within a limited number of geographic regions including, notably, China and Germany. If certain factors were to arise including, for example, a catastrophic event or shift in economic health and stability within a particular region, then customers within these regions may reduce their consumption of our products resulting in reduced revenues for us.
Many of our customers are currently the benefactors of government funding or government subsidies.
Our products are currently sold into a limited number of vertical markets, some of which are either directly funded by or partially subsidized with government funding. Our ultracapacitor products provide numerous technology and environmental benefits for many of the applications in which our customers are using these products. As the use of our technology in certain applications is still relatively immature, the costs associated with producing the products is high as compared with the more mature solutions. However, many government entities have determined that they view certain prevailing interests, including, for example, reduction of pollution, to outweigh the economic costs associated with incorporating these clean technologies and therefore are willing to allocate government funding to encourage companies to produce goods which reduce pollution and energy consumption. For example, a large portion of our current ultracapacitor business is concentrated in the Chinese hybrid transit vehicle and wind energy markets, which are heavily dependent on government regulation and subsidy. These markets may experience slower rates of growth when there are changes or delays in government policies and subsidy programs that support our sales into these markets. In mid-2013, the Chinese government subsidy program which provided subsidies for diesel-electric hybrid buses concluded. The Chinese government then put into a place a new subsidy program which did not include subsidies for diesel-electric hybrid buses. However, our Chinese bus customers then began incorporating our ultracapacitor products into plug-in hybrid buses, which are subsidized by the new subsidy program. The current subsidy program is scheduled to expire at the end of 2015, although it may be renewed or replaced.
Similarly, our microelectronics and high-voltage capacitor products are primarily consumed by markets which are either directly funded by or controlled by the respective government bodies in the jurisdictions where our customers do business. For example, our microelectronics products are used in the space community which is ultimately run by the space agencies of the respective governments. Likewise, our high-voltage capacitor products are largely used for electric utility infrastructures which are largely controlled by the respective governments supplying power and electricity to its populations. If these government entities elect to change their policies on government subsidies or decide to cancel or reduce certain government funding programs, then our customers could cancel or reduce orders for our products.
Downward pressures on product pricing could adversely impact our financial condition and operating results or even result in loss of revenue in exchange for avoidance of such gross margin pressures.
We strive to manage gross margin for the products we sell. There can be no assurance that targeted gross margin percentage levels will be achieved. In general, gross margins will remain under downward pressure due to increased competition as well as a potential shift in our sales mix with respect to low margin business and high margin business. For
14
example, if we increase sales of our products into markets which traditionally have lower margin rates than our current business, such as the automotive and consumer markets, we may be forced to reduce our margins to remain competitive in these markets. Further, we are beginning to experience significant downward pricing pressure in the Chinese hybrid transit vehicle market, which has historically represented a significant portion of our sales, as a result of increased competition mainly from local Chinese competitors. If our cost reduction efforts do not keep pace with these price pressures, or if we continue to pursue certain vertical markets and reduce our margins to maintain or increase sales, then we could experience degradation in our overall profit margins. In addition, gross margins could be negatively impacted by an increase in raw materials, components and labor costs.
Our business is subject to risks related to its international operations including the risk that we will be unable to adequately comply with the changing rules and regulations in countries where our business is conducted.
We derive a significant portion of our revenue and earnings from international operations. Such operations outside the U.S. are subject to special risks and restrictions, including: fluctuations in currency values and foreign currency exchange rates, import and export requirements and trade policy, anti-corruption laws, tax laws (including U.S. taxes on foreign subsidiaries), foreign exchange controls and cash repatriation restrictions, data privacy requirements, labor laws, anti-competition regulations, and other potentially detrimental domestic and foreign governmental practices or policies affecting U.S. companies doing business abroad. Compliance with these U.S. and foreign laws and regulations increases the costs of doing business in foreign jurisdictions and these costs may continue to increase in the future as a result of changes in such laws and regulations or in their interpretation. Furthermore, we have implemented policies and procedures designed to ensure compliance with these laws and regulations, but there can be no assurance that our employees, contractors, or agents will not violate such laws and regulations or our policies. For example, in 2014, based upon events occurring in the Ukraine, the U.S. Department of State and U.S. Department of Commerce instituted a policy to not issue export licenses for product shipments to Russia. Our products which require export licenses, including, notably, our microelectronics products, are restricted from being shipped to customers within Russia without such export licenses. Additionally, as political turmoil continues to progress between Russia and Ukraine, additional sanctions against Russia are being issued by numerous governing bodies throughout the world. Any violations of rules and regulations could individually or in the aggregate materially adversely affect our financial condition or operating results. Some of our business partners also have international operations and are subject to the risks described above. Even if we are able to successfully manage the risks of international operations, our business may be adversely affected if our business partners are not able to successfully manage these risks.
Our success could be negatively impacted if we fail to control, oversee and direct foreign subsidiaries and their operations.
We currently own foreign subsidiaries located within Europe and Asia where the employees and cultures represent certain vast differences from employees and cultures within the United States where our corporate headquarters is situated. While the cultural values and philosophies of the people located in Europe and portions of Asia are generally viewed to be in alignment with that of U.S. persons, there are still some significant differences. For example, the respective European data privacy laws take a harsher position regarding the protection of employee personal data and, consequently, there is less information shared with the U.S. parent corporation regarding employees working for our European subsidiaries. Additionally, the human resources and the systems our foreign entities use can be vastly different; notably, our Swiss, German, Korean, and Chinese subsidiaries utilize a primary language other than English for communications. Having substantial international operations also increases the complexity of managing our financial reporting and internal controls and procedures. If we are unable to manage these risks effectively, it could negatively impact our operating performance and our reputation.
Our exposure to fluctuations in foreign currency exchange rates arising from international operations could harm our financial condition and operating results.
As a result of our extensive international operations and significant revenue generated outside the U.S., the dollar amount of our current and future revenues, expenses and debt may be materially affected by fluctuations in foreign currency exchange rates. Similarly, assets and liabilities of our Swiss subsidiary that are not denominated in its functional currency are subject to effects of currency fluctuations, which may materially affect our reported earnings. Our primary exposure to movements in foreign currency exchange rates relates to non-U.S. dollar denominated sales in Europe as well as non-U.S. dollar denominated operating expenses incurred throughout the world. Weakening of foreign currencies relative to the U.S. dollar will adversely affect the U.S. dollar value of our foreign currency-denominated sales and earnings, and generally will lead us to raise international pricing, potentially reducing demand for our products. In some circumstances, due to competition or other reasons, we may decide not to raise local prices to the full extent to offset unfavorable exchange rate fluctuations, or at all, which would adversely affect the U.S. dollar value of our foreign currency denominated sales and earnings. Conversely, a strengthening of foreign currencies, while generally beneficial to our foreign currency-denominated sales and earnings, could
15
cause us to realize a reduction in our overall gross margin as the U.S. dollar value of our foreign currency-denominated expenses increases. In January 2015, the Swiss National Bank removed its policy previously put in place to limit the strengthening of the Swiss Franc against the Euro. The value of the Swiss Franc against many other currencies, increased significantly upon this policy change. As a result, the prices for our high-voltage products, which are denominated in Swiss Franc, became less affordable to customers that trade in these other currencies. This could result in a decline in future sales of our high-voltage products, or we could be required to reduce our prices, and thereby our profit margins, to maintain our market share. However, we are taking measures to limit the impact of this situation, including a strong focus on cost savings opportunities.
Our business activities are subject to the U.S. Foreign Corrupt Practices Act (“FCPA”) and other anti-bribery laws. If we fail to comply with anti-bribery laws and regulations, we could be subject to civil and/or criminal penalties as well as further expenses related to an additional internal investigation.
Due to our status as a U.S. issuer, we are subject to the FCPA, which prohibits companies from making, promising or offering improper payments or other things of value to foreign officials for the purpose of obtaining or retaining business or a business advantage. During 2009 and 2010, we conducted an internal review into the nature of certain payments made to an independent third-party sales agent in China with respect to sales of our high-voltage capacitor products produced by our Swiss subsidiary, Maxwell SA. In January 2011, we reached settlements with the SEC and Department of Justice (“DOJ”) with respect to charges asserted by the SEC and DOJ relating to this matter, which required us to pay monetary fines totaling $14.4 million, and to implement additional remedial measures to strengthen our compliance program concerning anti-bribery. As of January 2013, all monetary fines were paid in full. As part of the settlement with the DOJ, we entered into a three-year deferred prosecution agreement (“DPA”) with the DOJ, which expired at the end of its term in February 2014, resulting in the charges against us being dismissed with prejudice.
Due to our significant operations in Switzerland, we are also subject to Swiss anti-bribery regulations. In August 2013, our Swiss subsidiary was served with a search warrant from the Swiss federal prosecutor’s office and which seized certain materials from our premises for keeping at the prosecutor’s office. Based on reviewing the items to be seized on the search warrant presented by the Swiss prosecutor’s office, we believe this action to be related to the same or similar facts and circumstances as the FCPA action previously settled with the SEC and the DOJ. Our failure to achieve a favorable result in these proceedings could have a material adverse impact on our financial condition and results of operation.
We depend upon component and product manufacturing and logistical services provided by third parties, many of whom are located outside of the U.S.
Substantially all of our components and products are manufactured in whole or in part by a few third-party manufacturers. Many of these manufacturers are located outside of the U.S. and are all located within a relatively small geographic location. If a catastrophic event occurs within this area, or the social or economic conditions shift within this geography, we could experience business interruptions, delayed delivery of products, or other adverse impacts to our ongoing business. We have also outsourced much of our transportation and logistics management. While these arrangements may lower operating costs, they also reduce our direct control over production and distribution. Such diminished control could have an adverse effect on the quality or quantity of our products as well as our flexibility to respond to changing conditions. In addition, we rely on third-party manufacturers to adhere to the terms and conditions of the agreements in place with each party. For example, although arrangements with such manufacturers may contain provisions for warranty expense reimbursement, we may remain responsible to the customer for warranty service in the event of product defects. Any unanticipated product defect or warranty liability, whether pursuant to arrangements with contract manufacturers or otherwise, could adversely affect our reputation, financial condition and operating results.
16
To remain competitive and stimulate customer demand, we must introduce and commercialize new products successfully as well as adequately educate our prospective customers on the products we offer.
Our ability to compete successfully depends heavily on our ability to ensure a continuing and timely introduction of innovative new products and technologies to the marketplace. We believe that we are unique in that we are a technology leader for the technologies we deliver and typically must first educate the customer regarding the implementation of our solution in their systems before the customer is capable of designing in our products. As a result, we must make significant investments in research and development efforts as well as sales and marketing efforts, including applications engineering resources. By contrast, many of our competitors, including some which are well capitalized with significant financial resources at their disposal, seek to compete primarily through aggressive pricing and very low cost structures. If we are unable to continue to develop and sell innovative new products or if we are unable to effectively educate the prospective customer on the value proposition offered by the implementation of our products, then our ability to maintain a competitive advantage could be negatively affected and our financial condition and operating results could be adversely affected.
Competition in the energy storage domain has significantly affected, and will continue to affect, our sales.
Many companies are engaged in or are starting to engage in designing, developing and producing energy storage solutions as a consequence of the movement towards clean energy solutions in both the commercial and public sectors. Consequently, more companies are pursuing opportunities in the energy storage domain and are beginning to compete in the markets in which we do business. The success of these new competitors could render our products less competitive, resulting in reduced sales compared with our expectations or past results. Certain companies which recently initiated efforts to enter the markets in which we do business, including, notably, in China, possess greater access to capital resources or utilize different product development strategies which vary in both time to market and innovation methodologies. Consequently, these companies could develop products that are superior to ours, more competitively priced than ours or faster to market than ours. Additionally, significant amounts of U.S. government funds are being invested in the development of batteries with better performance characteristics or lower manufacturing costs than battery technologies currently on the market and, consequently, these new, advanced batteries that include power delivery functionality could compete for market share with our ultracapacitor products. Moreover, as the market leader for certain markets for energy storage, competitors often follow our lead in the advancement of technologies for energy storage or customers attempt to facilitate second sources of comparable products, thereby requiring us to innovate rapidly in order to continue to serve as the market leader. The success of the products offered by our competitors could reduce our market share, thereby negatively impacting our financial results.
The successful management of new market applications and new product introductions will be necessary for our growth.
Given our position as the technology leader for certain products and solutions we offer, we have a considerable number of new product concepts in the pipeline. A critical component of our growth strategy is dependent upon our ability to effectively and accurately determine which new products or applications to pursue. Pursuing product applications targeted at a specific customer base should enable our products to cross over from a more narrow range of acceptance by early technology adopters to acceptance by a majority of customers in the application space. Commercial success frequently depends on being the first provider to identify the applicable market opportunities. Consequently, if we are not able to fund our research and development activities appropriately and deliver new products which address the needs of the markets we serve on a timely basis, our growth prospects will be harmed. Additionally, we must balance the benefits of gaining market acceptance in new or existing markets with the goal of optimizing growth and profitability. That is, it is critical to ensure that the products and markets we select for development are aimed at large volume or high profile applications which can provide a significant return on our investment. If we fail to identify and pursue the appropriate markets for our products, our growth potential and operating results could be adversely affected.
Our success depends largely on the acquisition of, as well as the continued availability and service of, key personnel.
Much of our future success depends on the continued availability and service of key personnel, including our senior executive management team as well as highly-skilled employees in technical, marketing and staff positions. Due to the complexity and immaturity of the technologies involved in the products we produce and the markets we serve, we may be unable to find the right personnel with the background needed to serve our goals and objectives. As a market leader for the technologies we develop, there are limited opportunities to hire personnel from competitors or other technology companies with substantial background and experience in our technology fields. Consequently, we seek to hire individuals who are capable of performing well in an environment with limited resources and references to past experiences. We may struggle to find such talented personnel who also thrive in a high growth business atmosphere and who are capable of keeping pace with
17
the rapidly changing environment encouraged by the technologies we create and the markets we serve. These uniquely talented personnel are in high demand in the technology industry and competition for acquiring such individuals is intense. Some of our scientists and engineers are the key developers of our products and technologies and are recognized as leaders in their area of expertise. Without attracting and retaining personnel with the appropriate skill sets, we could fail to maintain our technological and competitive advantage.
Our inability to manage rapid growth in personnel, including development and training of such personnel in an immature industry, as well as to map out succession planning, could impede our success.
Our business has grown rapidly. This growth has placed, and any future growth would continue to place, a significant strain on our limited personnel, management and other resources. Also, due to the anticipated growth in demand for our products and the technical expertise needed by our personnel, we face risks related to managing the addition of personnel in such a growth environment. We may fail to accurately gauge the growth in personnel required at the appropriate time without incurring the additional cost of the additional personnel before they are needed. We will also need to determine how to best add this new talent and transfer information and know-how without sacrificing the ongoing demands of the business. For example, each new hire will need to learn quickly about our products and technologies. Since there is limited information available in the public domain, this information will need to be passed from existing personnel to new personnel all while the existing personnel continue to complete their ongoing job duties. Additionally, our ability to grow management talent below the senior executive level will be imperative to achieving our goals. In a smaller organization, the senior executive management team is capable of handling and being involved in several tasks and decision making forums. However, as we make significant progress toward meeting our growth targets, the time constraints will be felt more severely by the senior executive team and some of the tasks they are currently capable of handling on their own will need to be transferred to the management team reporting to them. Accordingly, growing the next level of management and identifying key personnel for succession planning will become critical to our ongoing success.
Our success as a reliable supplier to our customers is highly dependent upon our ability to effectively manage our reliance upon certain suppliers of key component parts, finished goods and specialty equipment.
Because we currently obtain certain key components including, but not limited to binder, separator, paper, aluminum piece parts, die, printed circuit boards and certain finished goods, including, notably, ultracapacitor finished goods, from single or limited sources, we are subject to significant supply and pricing risks. If the particular supplier is unable to provide the appropriate quantity and/or quality of the raw material or the finished goods at the prices required, then we will be unable to produce and deliver our goods to customers, thereby losing out on revenue generation and, potentially, incurring penalties for failing to timely perform. For example, a substantial portion of our revenue is generated from finished goods supplied to us from a single contract manufacturer. If this contract manufacturer is unable to supply the finished goods to us to meet our customer demand, then we could be forced to decline acceptance of customer orders, which could lead to, among other things, a reputation that we are an unreliable supplier and a decline in future demand for our products. Additionally, if we are not aware of potential constraints upon our contract manufacturer for these finished goods before we enter into binding supply commitments with our own customers, then we could be required to pay damages to the customers. While we have established mitigation strategies to attempt to minimize the likelihood and impact of an inability to supply finished goods due to supplier constraints, we cannot be certain that such mitigation strategies will eliminate an adverse effect to our financial condition.
Additionally, we use some custom components that are not common to the rest of the industries served by our suppliers and which are often available from only one source. Also, when a component or product uses new technologies, initial capacity constraints may exist until the particular supplier's yield has matured or manufacturing capacity has increased. Continued availability of these components at acceptable prices, or at all, may be affected if those suppliers decide to concentrate on the production of common components instead of components customized to meet our unique requirements. If the supply of a key single-sourced component for a new or existing product were delayed or constrained, if such components were available only at significantly higher prices, or if a key manufacturing vendor delayed shipments of completed products to us, then our financial condition and operating results could be adversely affected.
Conversely, diversifying our supplier base to ensure that we have multiple suppliers for each key raw material typically involves additional costs including, but not limited to: higher prices for the raw materials as a direct consequence of purchasing lower volumes from each supplier; additional costs associated with qualifying additional suppliers; and increased resource expense in managing an additional supplier for factors including quality, timely delivery and other standards. If we fail to balance the interests between the reliance upon a single supplier and expense associated with diversifying the supply chain base, then our actual gross profit could fail to meet our targets.
18
Our products and services may experience quality or implementation problems from time to time that could result in decreased sales and operating margin, and could tarnish our reputation.
In the case of our ultracapacitor products, we sell relatively new technology which could contain defects in design or manufacture, or could be implemented incorrectly in the end use application. As a direct consequence of the immaturity of this technology, we are still learning about the technology and the potential quality issues that could arise during operation in certain applications. Additionally, we are still learning, along with our customers, how the products will operate in the systems into which our customers are incorporating our products. Consequently, we are not always capable of anticipating the quality or implementation problems which the products may experience in the field. Products sold into high performance environments such as heavy transportation and automotive markets could experience additional operating characteristics that could unexpectedly interfere with the intended operation of our products. For example, if the end use application is in an environment which subjects the products to levels of vibration above our internal design and qualification levels, then the products could fail to achieve the customer’s performance requirements. With this sometimes limited understanding of the applicability and operation of our products in varying end user applications, our customers may perceive our products as exhibiting quality problems, which could harm our reputation. We strive to respond quickly in modifying our products to accommodate more stringent performance characteristics desired by our customers or necessary for new applications of our products. As such, the release time of next generation products can be relatively quick and we may assume additional risks associated with expediting the release of new or modified products.
We are also building our infrastructure to adequately and efficiently handle any potential recall and the reverse logistics involved in returning our products to our facilities in the event that any defects are found. There can be no assurance that we will be able to detect and fix all defects in the products we sell or will be able to efficiently handle all issues related to product returns or implementation concerns. As we continue to pursue additional vertical markets, we are gaining a better understanding of certain business practices of these markets with respect to potential product recalls. For example, certain portions of the transportation industry are sensitive to product recall issues as they relate to both government regulations as well as customer satisfaction and safety. Failure to successfully prevent a defect in our products which prompts a recall or a failure to successfully manage expenses associated with any recalls could cause lost revenue, harm to our reputation, and significant warranty and other expenses, and result in an adverse impact on our financial condition and operating results.
Efforts to protect our intellectual property rights and to defend claims against us could increase our costs and will not always succeed; any failures could adversely affect sales and profitability and restrict our ability to do business.
Intellectual property (“IP”) rights are crucial to maintaining our competitive advantage and growing our business. We endeavor to obtain and protect our intellectual property rights which we feel will allow us to retain or advance our competitive advantage in the marketplace. However, there can be no assurance that we will be able to adequately identify and protect the portions of IP which are strategic to our business. Generally, when strategic IP rights are identified, we will seek formal protection in jurisdictions in which our products are produced or used, jurisdictions in which competitors are producing or importing their products, and jurisdictions into which our products are imported. Different nations may provide limited rights and inconsistent duration of protection for our products. Additionally, we may be unable to obtain protection for or defend our IP in key jurisdictions. For example, the patent prosecution and enforcement system within China is less mature than the systems in other jurisdictions and therefore we may be more limited in our ability to enforce our rights. This disadvantage would likely be compounded by the challenge of any enforcement attempts by us as a foreign entity seeking protection against a Chinese company infringing on our IP in China.
Even if protection is obtained, competitors or others in the chain of commerce may raise legal challenges to our rights or illegally infringe our rights, including through means that may be difficult to prevent or detect. For example, a certain portion of our IP portfolio is related to unique process steps performed during the manufacture of our products which are not readily recognizable in the physical embodiment of the final product. It may be difficult to identify and prove that a competitor is infringing on our rights to such process steps. Further, we are required to divulge certain of our IP to our business partners to enable them to provide quality products or raw materials to us. To the extent that such disclosure occurs in China or other jurisdictions in which the ability to protect IP is more limited, existing or new competitors in this region could begin to use our IP in the development of their own products, which could reduce our competitive edge. Even in jurisdictions in which IP is highly valued, and therefore protected, the financial burden of asserting or defending our IP rights could prove to be cost prohibitive for us thereby putting us in a position in which we must sacrifice our competitive edge.
In addition, because of the rapid pace of technology advancements, and the confidentiality of patent applications in some jurisdictions, competitors may be issued patents stemming from pending patent applications that were unknown to us prior to issuance of the patents. This could reduce the value of our commercial or pipeline products or, to the extent they cover key technologies on which we have unknowingly relied, require that we seek to obtain a license or cease using the technology, no
19
matter how valuable to our business. We may not be able to obtain such a license on acceptable terms. The extent to which we succeed or fail in our efforts to protect our intellectual property will affect our financial condition and results of operations.
Our inability to effectively identify, enter into, manage and benefit from strategic alliances, may limit our ability to pursue certain growth objectives and/or strategies.
Our reputation is important to our growth and success. As a leader in an emerging technology industry, we recognize the value in identifying, selecting and managing key strategic alliances. We are mainly focusing our business on the specific products we deliver and pursuit of strategic alliances with other companies could allow us to provide customers with integrated or other new products, services, or technology advancements derived from the alliances. To be successful, we must first be able to define and identify opportunities which align with our growth plan. Additionally, we cannot be certain that our alliance partners will provide us with the support we anticipate, that such alliance or other relationships will be successful in advancing technology, or that any alliances or other relationships will be successful in manufacturing and marketing new or improved products. Our success is also highly dependent upon our ability to manage the respective parameters of all strategic alliances, promote the benefits to us, and to not prohibit or discourage other opportunities which may be beneficial to us in the future. Also, certain provisions of alliance agreements may include restrictions that limit our ability to independently pursue or exploit the developments under such strategic alliances. Currently, we have alliances with several partners both in the U.S. and throughout the world. We anticipate that future alliances may also be with foreign partners or entities. As a result, such alliances may be subject to the political climate and economies of the foreign countries where such partners reside and operate. If the strategic alliances we pursue are not successful, our business and prospects could be negatively affected.
Should a catastrophic event or other significant business interruption occur at any of our facilities, we could face significant reconstruction or remediation costs, penalties, third-party liability and loss of production capacity, which could adversely affect our business.
Weather conditions, natural disasters or other catastrophic events could cause significant disruptions in operations, including, specifically, disruptions at our manufacturing facilities or those of our major suppliers or customers. In turn, the quality, cost and volumes of the products we produce and sell could be unexpectedly, negatively affected, which will impact our sales and profitability. Natural disasters or industrial accidents could also damage our manufacturing facilities or infrastructure, or those of our major suppliers or major customers, which could affect our costs, production volumes and demand for our products. For example, currently, our sole manufacturing facilities for our microelectronics products are located in San Diego, California, an area known for natural wildfires and earthquakes. However, we have implemented certain mitigation strategies to ensure that certain components and processes involved in the manufacture of these component materials and finished goods are somehow temporarily available so as to reduce the impact of such a catastrophic event.
War, terrorism, geopolitical uncertainties, public health issues, and other business interruptions have caused and could cause damage or disruption to international commerce and the global economy, and thus could have a strong negative effect on us, our suppliers, logistics providers, manufacturing partners and customers. Our business operations could be subject to interruption by power shortages, terrorist attacks and other hostile acts, labor disputes, public health issues, and other events beyond our control. Such events could decrease demand for our products, make it difficult or impossible for us to produce and deliver products to our customers, or to receive components from our suppliers, thereby creating delays and inefficiencies in our supply chain. Should major public health issues, including pandemics, arise, we could be negatively affected by more stringent employee travel restrictions, additional limitations in freight services, governmental actions limiting the movement of products between regions, and disruptions in the operations of our manufacturing partners and component suppliers. The majority of our research and development activities, our corporate headquarters, information technology systems, and other critical business operations, including certain component suppliers and manufacturing partners, are in locations that could be affected by natural disasters. In the event of a natural disaster, losses could be incurred and significant recovery time could be required to resume operations and our financial condition and operating results could be materially adversely affected. While we may purchase insurance policies to cover the direct economic impact experienced following a natural disaster occurring at one of our own facilities, there can be no assurance that such insurance policies will cover the full extent of our financial loss nor will they cover losses which are not economic in nature such as, for example, our business and reputation as a reliable supplier.
We may be subject to information technology systems failures, network disruptions and breaches in data security.
Information technology system failures, network disruptions and breaches of data security could disrupt our operations by impeding the manufacture or shipment of products, the processing of transactions or reporting of financial results, or by causing an unintentional disclosure of confidential information. In the ordinary course of our business, we collect and store sensitive data in our data centers and on our networks, including intellectual property, proprietary business information, and
20
personal information of our business partners and employees. Despite our security measures, our information technology and infrastructure may be vulnerable to attacks by hackers or breached due to employee error, malfeasance or other disruptions. Any such breach could compromise our networks and the information stored there could be accessed, publicly disclosed, lost or stolen. While management has taken steps to address these concerns by implementing certain data and system redundancy, hardening and fail-over along with other network security and internal control measures, there can be no assurance that the measures we have implemented to date would be sufficient in the event of a system failure, loss of data or security breach. As a result, in the event of such a failure, loss of data or security breach, our financial condition and operating results could be adversely affected.
Security breaches and other disruptions could compromise our information and expose us to liability, which would cause our business and reputation to suffer.
In the ordinary course of our business, we collect and store sensitive data, including intellectual property, our proprietary business information and that of our customers, suppliers and business partners, and personally identifiable information of our customers and employees, in our data centers and on our networks. The secure processing, maintenance and transmission of this information is critical to our operations and business strategy. Despite our security measures, our information technology and infrastructure may be vulnerable to attacks by hackers or breached due to employee error, malfeasance or other disruptions. Any such breach could compromise our networks and the information stored there could be accessed, publicly disclosed, lost or stolen. Any such access, disclosure or other loss of information could result in legal claims or proceedings, liability under laws that protect the privacy of personal information, regulatory penalties, disruption of our operations and the services we provide to customers, and damage to our reputation, which could adversely affect our financial results and competitive position.
Our ability to match our production plans for our ultracapacitor products to the level of product actually demanded by customers has a significant effect on our sales, costs and growth potential.
Customers' decisions are affected by market, economic and government regulation conditions which can be difficult to accurately gauge in advance. In addition, many of the markets for our ultracapacitor products are within emerging industries as well as within project-oriented business models and, as such, it can be difficult to predict our future customer demand. Failure to provide customers and channel partners with demanded quantities of our products could reduce our sales. Conversely, increased capacity which exceeds actual customer demands for our products increases our costs and, consequently, reduces our profit margins on the products delivered. Although we have implemented policies and procedures for refining our forecasting methods, including a more sophisticated mechanism for gauging the sales pipeline to better project timing of new customer demand, there can be no assurance that these policies and procedures will provide accurate intelligence to align our production plans with customer demands. As a result of all of these factors, we could fail to meet revenue or profit margin targets.
Our reputation could be damaged as a result of negative publicity due to the restatement of prior periods financial statements contained within our Annual Report on Form 10-K for the fiscal year ended December 31, 2012, and the underlying business causes of such restatement.
We depend upon our reputation to compete for customers, suppliers, investors, strategic partners and personnel. Unfavorable publicity can damage our reputation and negatively impact our economic performance. Our restatement of our prior periods financial statements contained within our Annual Report on Form 10-K for the fiscal year ended December 31, 2012, and the underlying business causes of such restatement, could damage our reputation. For example, as a result of our restated financial statements and the underlying facts which caused the restatement of our financial statements, we, along with some of our past and present directors and officers, were named as defendants in certain shareholder lawsuits, including, notably, a securities class action lawsuit and a shareholder derivative lawsuit, both of which are pending in federal court in San Diego under the captions In re Maxwell Technologies, Inc., Securities Litigation and In re Maxwell Technologies, Inc. Derivative Litigation, respectively. As these lawsuits are concluding, the plaintiffs have and are expected to continue to make allegations within public documents which may portray us in an unfavorable light. There can be no assurance that unfavorable publicity arising from the forgoing will not have a material adverse effect on our business.
We may not be able to obtain sufficient capital to meet our operating or other needs, which could require us to change our business strategy and result in decreased profitability and a loss of customers.
We believe that in the future we may need a substantial amount of additional capital for a number of potential purposes in furtherance of our strategic missions and growth objectives. For example, to meet potential growth in demand for our products, particularly for our ultracapacitor products, we will need to spend significant amounts of resources on customized production equipment. Further, additional capital may be required to execute on our strategies related to continued expansion into
21
commercial markets, development of new products and technologies, and acquisitions of new or complementary businesses, product lines or technologies. Cash generated by our operations may not be sufficient to cover these investments.
In the future, there can be no assurance that financing will be available to us on acceptable terms, or at all. If adequate funds are not available when needed, we may be required to change or delay our planned growth, which could result in decreased revenues and profits and loss of customers. Also, if we are to raise additional funds by issuing equity, the issuance of additional shares will result in dilution to our current stockholders. If additional financing is accomplished by the issuance of debt, the service cost, or interest, will reduce net income or increase net loss, and we may also be required to issue warrants to purchase shares of common stock in connection with issuing such debt.
Unfavorable results of legal proceedings could materially adversely affect us.
We are subject to various legal proceedings and claims that have arisen out of the ordinary conduct of our business and are not yet resolved, and additional claims may arise in the future. Results of legal proceedings cannot be predicted with certainty. Regardless of merit, litigation may be both time-consuming and disruptive to our operations and could cause significant expense and diversion of management attention. From time to time, we are involved in major lawsuits concerning intellectual property, torts, contracts, shareholder litigation, administrative and regulatory proceedings and other matters, as well as governmental inquiries and investigations, the outcomes of which may be significant to our results of operations and may limit our ability to engage in our business activities. In recognition of these considerations, we may enter into material settlements to avoid ongoing costs and efforts in defending or pursuing a matter. Should we fail to prevail in certain matters, or should several of these matters be resolved against us in the same reporting period, we may be faced with significant monetary damages or injunctive relief against us that could adversely affect our business, financial condition and operating results. While we have insurance related to our business operations, it may not apply to or fully cover any liabilities we incur as a result of these lawsuits. We record reserves for potential liabilities where we believe the liability to be probable and reasonably estimable. However, our actual costs may be materially different from these estimates.
For example, as articulated in Item 3 - Legal Proceedings, we have several pending legal matters in the form of both government and regulatory investigations as well as civil lawsuits. These lawsuits could be, in addition to requiring the payment of an economic damages claim as well as other indemnification obligations, be both time-consuming and disruptive to our business. Additionally, our reputation could be harmed as a result of the allegations asserted in public statements and court documents throughout the course of the action. Consequently, our financial condition or operating results could be materially adversely affected.
The issuance of shares of our common stock could result in the loss of our ability to use our net operating losses.
As of December 31, 2014, we had U.S. federal tax and state tax net operating loss carryforwards of approximately $157.7 million and $64.6 million, respectively. Realization of any benefit from our tax net operating losses is dependent on both our ability to generate future taxable income as well as the absence of certain “ownership changes” to our common stock. An “ownership change,” as defined in the applicable federal income tax rules, would place significant limitations, on an annual basis, on the use of such net operating losses to offset any future taxable income we may generate. The issuance of shares of our common stock, including the issuance of shares of common stock upon future conversion or exercise of outstanding stock options, could cause such an “ownership change.” Such limitations triggered by an “ownership change,” in conjunction with the net operating loss expiration provisions, could effectively eliminate our ability to use a substantial portion of our net operating loss carryforwards to offset any future taxable income.
Our stock price continues to be volatile.
Our stock has at times experienced substantial price volatility due to a number of factors, including but not limited to the various factors set forth in this "Risk Factors" section, as well as variations between our actual and anticipated financial results, announcements by us or our competitors, and uncertainty about future global economic conditions. The stock market as a whole also has experienced extreme price and volume fluctuations that have affected the market price of many technology companies in ways that may have been unrelated to these companies' operating performance. Furthermore, we believe our stock price may reflect certain future growth and profitability expectations. If we fail to meet these expectations then our stock price may significantly decline which could have an adverse impact on investor confidence and employee retention.
22
Anti-takeover provisions in our certificate of incorporation and bylaws could prevent certain transactions and could make a takeover more difficult.
Some provisions in our certificate of incorporation and bylaws could make it more difficult for a third-party to acquire control of us, even if such change in control would be beneficial to our stockholders. We have a classified board of directors, which means that our directors are divided into three classes that are elected to three-year terms on a staggered basis. Since the three-year terms of each class overlap the terms of the other classes of directors, the entire board of directors cannot be replaced in any one year. Furthermore, our certificate of incorporation contains a “fair price provision” which may require a potential acquirer to obtain the consent of our board to any business combination involving us. Our certificate of incorporation and bylaws also contain provisions barring stockholder action by written consent unless first approved by a majority of the disinterested directors, and the calling by stockholders of a special meeting. Amendment of such provisions requires a super majority vote by the stockholders, except with the consent of the board of directors and a majority of the disinterested directors in certain circumstances. The provisions of our certificate of incorporation and bylaws could delay, deter or prevent a merger, tender offer, or other business combination or change in control involving us that stockholders might consider to be in their best interests. This includes offers or attempted takeovers that could result in our stockholders receiving a premium over the market price for their shares of our common stock.
Item 1B. | Unresolved Staff Comments |
None.
Item 2. | Properties |
Our primary operations are in San Diego, California, Peoria, Arizona and Rossens, Switzerland. In San Diego, we occupy a 45,000 square foot manufacturing facility under a lease that expires in July 2017. In addition, we have a 36,400 square foot facility in San Diego for our principal research and development operations under a lease that expires in December 2018. We also occupy a 30,500 square foot corporate office located in San Diego under a lease that expires in December 2022 and we have one additional five-year renewal option thereafter. Our Peoria, Arizona facility occupies 123,000 square feet under a lease that expires in June 2022 and we have two additional five-year options thereafter. We also lease a research, manufacturing and marketing facility in Rossens, Switzerland occupying 60,800 square feet under a lease that expires in December 2019 and we have two additional five-year renewal options thereafter.
We have a 9,600 square foot sales office in Shanghai, China under a lease expiring in December 2016, and have a priority right with the landlord to renew the lease term for this facility. We also have small sales offices in Munich, Germany and Seoul, South Korea.
We believe that we have sufficient space to support forecasted increases in production volume and that our facilities are adequate to meet our needs for the foreseeable future. For additional information regarding our expected capital expenditures in fiscal 2015, see Item 7, Management's Discussion and Analysis of Financial Condition and Results of Operations-Liquidity and Capital Resources.
Over the past several years, we have made substantial capital investments to outfit and expand our internal production facilities and incorporate mechanization and automation techniques and processes. Additionally, we have trained our manufacturing personnel in the necessary operational techniques. With the completion of certain upgrades and expansions in recent years, and other upgrades and capacity expansions currently underway, along with our contract manufacturing relationships with Belton Technology Group and Tianjin Lishen Battery Joint-Stock Co. Ltd. in China, we believe that we have sufficient capacity to meet near-term demand for all of our product lines.
23
Item 3. | Legal Proceedings |
FCPA Matter
As a result of being publicly traded in the U.S., we are subject to the U.S. Foreign Corrupt Practices Act (“FCPA”), which prohibits companies from making improper payments to foreign officials for the purpose of obtaining or retaining business. Beginning in 2009, we conducted an internal review into payments made to our former independent sales agent in China with respect to sales of our high-voltage capacitor products produced by our Swiss subsidiary. In January 2011, we reached settlements with the SEC and the U.S. Department of Justice (“DOJ”) with respect to charges asserted by the SEC and DOJ relating to the anti-bribery, books and records, internal controls, and disclosure provisions of the FCPA and other securities laws violations. We settled civil charges with the SEC, agreeing to an injunction against further violations of the FCPA. Under the terms of the settlement with the SEC, we agreed to pay a total of approximately $6.4 million in profit disgorgement and prejudgment interest. We settled civil and criminal charges with the DOJ by entering into a three-year deferred prosecution agreement (“DPA”) and agreeing to pay a total of $8.0 million in penalties. Further, under the terms of each agreement, we have submitted periodic reports to the SEC and DOJ on our internal compliance program concerning anti-bribery. As of January 25, 2013, all monetary penalties had been paid in full for each settlement described above and, in early February 2014, the DPA expired on its own terms. A judgment of dismissal was issued by the District Judge for the matter in the U.S. District Court for the Southern District of California on March 28, 2014.
On October 15, 2013, we received an informal notice from the DOJ that an indictment against the former Senior Vice President and General Manager of our Swiss subsidiary had been filed in the United States District Court for the Southern District of California. The indictment is against the individual, a former officer, and not against us and we do not foresee that further penalties or fines could be assessed against us as a corporate entity for this matter. However, we may be required throughout the term of the action to advance the legal fees and costs incurred by the individual defendant and to incur other financial obligations. While we maintain directors’ and officers’ insurance policies which are intended to cover legal expenses related to our indemnification obligations in situations such as these, we cannot determine if and to what extent the insurance policy will cover the legal fees for this matter. Accordingly, the legal fees that may be incurred by us in defending this former officer could have a material impact on our financial condition and results of operation.
Swiss Bribery Matter
In August 2013, our Swiss subsidiary was served with a search warrant from the Swiss federal prosecutor’s office. At the end of the search, the Swiss federal prosecutor presented us with a listing of the materials gathered by the representatives and then removed the materials from our premises for keeping at the prosecutor’s office. By reviewing the items to be seized on the search warrant presented by the Swiss prosecutor’s office, we believe this action to be related to the same or similar facts and circumstances as the FCPA action previously settled with the SEC and the DOJ. During initial discussions, the Swiss prosecutor has acknowledged both the existence of our DPA with the DOJ and our cooperation efforts thereunder, both of which should have a positive impact on discussions going forward. Additionally, other than the activities previously reviewed in conjunction with the SEC and DOJ matters under the FCPA, we have no reason to believe that additional facts or circumstances are under review by the Swiss authorities. At such an early stage in the investigation, we are currently unable to determine the extent to which we will be subject to fines in accordance with Swiss bribery laws and what additional expenses will be incurred in order to defend this matter. As such, we cannot determine whether there is a reasonable possibility that a loss will be incurred nor can we estimate the range of any such potential loss. Accordingly, we have not accrued an amount for any potential loss associated with this action, but an adverse result could have a material adverse impact on our financial condition and results of operation.
Securities Matter
In early 2013, we voluntarily provided information to the United States Attorney's Office for the Southern District of California and the U.S. Securities and Exchange Commission related to our announcement that we intended to file restated financial statements for fiscal years 2011 and 2012. We are currently cooperating with the US authorities in connection with these investigations. At this preliminary stage, we cannot predict the ultimate outcome of this action, nor can we estimate the range of potential loss. Accordingly, we have not accrued an amount for any potential loss associated with this action, but an adverse result could have a material adverse impact on our financial condition and results of operation.
24
Securities Class Action Matter
From March 13, 2013 through April 19, 2013, four purported shareholder class actions were filed in the United States District Court for the Southern District of California against us and certain of our current and former officers. These actions were entitled Foster v. Maxwell Technologies, Inc., et al., Case No. 13-cv-0580 (S.D. Cal. filed March 13, 2013), Weinstein v. Maxwell Technologies, Inc., et al., No. 13-cv-0686 (S.D. Cal. filed March 21, 2013), Abanades v. Maxwell Technologies, Inc., et al., No. 13-cv-0867 (S.D. Cal. filed April 11, 2013), and Mebarak v. Maxwell Technologies, Inc., et al., No. 13-cv-0942 (S.D. Cal. filed April 19, 2013). The complaints alleged that the defendants made false and misleading statements regarding our financial performance and business prospects and overstated our reported revenue. The complaints purported to assert claims for violations of Section 10(b) and 20(a) of the Securities Exchange Act of 1934 and SEC Rule 10b-5 on behalf of all persons who purchased our common stock between April 28, 2011 and March 7, 2013, inclusive. The complaints sought unspecified monetary damages and attorneys' fees and costs. On May 13, 2013, four prospective lead plaintiffs filed motions to consolidate the four actions and to be appointed lead plaintiff and, on October 24, 2013, the court issued a written order consolidating the case under the heading In re Maxwell Technologies, Inc., Securities Litigation. On January 16, 2014, the lead plaintiff filed a consolidated and amended complaint which slightly adjusted the class period to April 29, 2011 to March 19, 2013. In response, we and the individual defendants filed a motion to dismiss the complaint, which the lead plaintiff opposed. On May 5, 2014, the court granted us motion to dismiss but granted the lead plaintiff leave to amend its complaint. The lead plaintiff filed an amended complaint on June 4, 2014, adding an additional claim under Section 10(b) alleging that the defendants were involved in a scheme to violate federal securities laws. We and individual defendants filed motions to dismiss on July 10, 2014. On October 6, 2014, the parties executed a stipulation of settlement, which included an all-in settlement value of $3.3 million. On November 3, 2014, the court granted preliminary approval of the settlement. At a hearing on February 5, 2015, the court granted final approval of the settlement. Based on this settlement, we have an accrued liability recorded of $3.3 million, which is included in “accounts payable and accrued liabilities,” as of December 31, 2014. As our insurance carrier would cover this potential settlement, we have a corresponding receivable from our insurance carrier recorded in the amount of $3.3 million, which is included in “trade and other accounts receivable,” as of December 31, 2014.
Federal Shareholder Derivative Matter
On April 23, 2013 and May 7, 2013, two shareholder derivative actions were filed in the United States District Court for the Southern District of California, entitled Kienzle v. Schramm, et al., Case No. 13-cv-0966 (S.D. Cal. filed April 23, 2013) and Agrawal v. Cortes, et al., Case No. 13-cv-1084 (S.D. Cal. filed May 7, 2013). The complaints name as defendants certain of our current and former officers and directors and name us as a nominal defendant. The complaints allege that the individual defendants caused or allowed us to issue false and misleading statements about our financial condition, operations, management, and internal controls and falsely represented that we maintained adequate controls. The complaints assert causes of action for breach of fiduciary duty, abuse of control, gross mismanagement, waste of corporate assets and unjust enrichment. The lawsuits seek unspecified damages, an order directing us to take all necessary actions to reform and improve our corporate governance and internal procedures, restitution and disgorgement of profits, benefits, and other compensation, attorneys' and experts' fees, and costs and expenses. On June 10, 2013, the parties filed a joint motion to consolidate the two actions. On September 26, 2013, the plaintiffs filed a motion to stay this case until the resolution of the similar derivative action pending in the California Superior Court for the County of San Diego. We and individual defendants opposed this motion to stay. On October 30, 2013, the court issued two orders consolidating the two cases under the heading In re Maxwell Technologies, Inc. Derivative Litigation, which had been mutually agreed upon by all parties, and denying the plaintiffs’ motion to stay their own federal derivative case. The lead plaintiffs filed their consolidated and amended complaint on January 30, 2014. In response, we and the individual defendants filed motions to dismiss the complaint, which the lead plaintiffs opposed. On May 28, 2014, the court granted our motion to dismiss but granted the lead plaintiffs leave to amend their complaint. The lead plaintiffs filed an amended complaint on July 11, 2014, to which we and individual defendants filed motions to dismiss on August 18, 2014. On September 19, 2014, the parties entered into a memorandum of understanding concerning settlement of this matter related to certain corporate governance reforms to be implemented and/or maintained by us. This memorandum of understanding does not address any monetary amounts to be paid to the lead plaintiffs in exchange for the benefit conferred to us as a result of the corporate governance reforms. Negotiations have been initiated with respect to the monetary amounts to be paid to lead plaintiffs and such preliminary amounts have been in the range of $650,000 to $1.5 million. However, negotiations regarding the monetary amounts to be paid to the lead plaintiffs reached an impasse and the lead plaintiffs elected to proceed with submitting to the court for determination of the applicable fee to be paid. On December 10, 2014, the parties signed a stipulation of settlement, which did not include the monetary amounts to be paid to the lead plaintiffs. On January 6, 2015, the court granted preliminary approval of the settlement. This preliminary approval triggered requirements for us to issue certain notices, each of which have been completed. A hearing is scheduled for March 16, 2015, for the court to determine if final approval of the settlement should be granted. As we believe that settlement within this range is probable, but do not believe that a specific amount within this range represents a better estimate, we have an accrued liability recorded for the low end of this range in the amount of $650,000, which is included in “accounts payable and accrued liabilities” as of December 31, 2014.
25
As our insurance carrier would cover this potential settlement, we have a corresponding receivable from our insurance carrier recorded in the amount of $650,000, which is included in “trade and other accounts receivable,” as of December 31, 3014.
State Shareholder Derivative Matter
On April 11, 2013 and April 18, 2013, two shareholder derivative actions were filed in California Superior Court for the County of San Diego, entitled Warsh v. Schramm, et al., Case No. 37-2013-00043884 (San Diego Sup. Ct. filed April 11, 2013) and Neville v. Cortes, et al., Case No. 37-2013-00044911-CU-BT-CTL (San Diego Sup. Ct. filed April 18, 2013). The complaints name as defendants certain of our current and former officers and directors as well as our former auditor McGladrey LLP. We are named as a nominal defendant. The complaints allege that the individual defendants made or caused us to make false and/or misleading statements regarding our financial condition, and failed to disclose material adverse facts about our business, operations and prospects. The complaints assert causes of action for breaches of fiduciary duty for disseminating false and misleading information, failing to maintain internal controls, and failing to properly oversee and manage the company, as well as for unjust enrichment, abuse of control, gross mismanagement, professional negligence and accounting malpractice, and aiding and abetting breaches of fiduciary duty. The lawsuits seek unspecified damages, an order directing us to take all necessary actions to reform and improve our corporate governance and internal procedures, restitution and disgorgement of profits, benefits and other compensation, attorneys' and experts' fees, and costs and expenses. On May 7, 2013, the court consolidated the two actions. We filed a motion to stay the consolidated action on July 2, 2013. On September 27, 2013, the court heard oral arguments on the motion to stay and continued the hearing on this motion until the resolution of the motion to stay pending in the federal derivative action referenced above. Given the outcome of the above-detailed federal derivative lawsuit, we informed the state court of the federal court order denying the federal plaintiffs’ motion to stay. Consequently, on November 1, 2013, the state court stayed the state derivative action pending before it until the resolution of the federal derivative case. The stipulation of settlement in the federal shareholder derivative matter contemplates that this action will be dismissed with prejudice in the event that settlement receives final approval by the federal court.
Shareholder Demand Letter Matter
On April 9, 2013, Stephen Neville, a purported shareholder of the Company, sent a demand letter to us to inspect our books and records pursuant to California Corporations Code Section 1601. The demand sought inspection of documents related to our March 7, 2013 announcement that we would be restating our previously-issued financial statements for 2011 and 2012, board minutes and committee materials, and other documents related to our board or management discussions regarding revenue recognition from January 1, 2011 to the present. We responded by letter dated April 19, 2013, explaining why we believed that the demand did not appear to be proper. Following receipt of a second letter from Mr. Neville dated April 23, 2013, we explained by letter dated April 29, 2013 why we continue to believe that the inspection demand appears improper. We have not received a further response from Mr. Neville regarding the inspection demand. In conjunction with the state court derivative action referenced above, Mr. Neville filed two motions to compel production of the documents and materials originally sought in the demand letter. On September 27, 2013, the court heard oral arguments on the motions to compel and, in line with the continuance on the motion to stay in the state shareholder derivative matter referenced above, likewise continued the hearing on the motions to compel, pending resolution of the motions to stay in both the federal and state derivative actions referenced above. On November 15, 2013, the purported shareholder, Mr. Neville, filed a petition for writ of mandate requesting that the state court order us to comply with the inspection demand. We responded to this writ on January 15, 2014, claiming that the inspection demand is improper on numerous grounds and simultaneously filing a demurrer to the shareholder inspection demand action in its entirety. On July 18, 2014, the court ruled against the Company’s demurrer but left open issues pertaining to the documents to be provided, if any, under the purported shareholder inspection demand. The court set a further hearing in this matter for April 10, 2015. The stipulation of settlement in the federal shareholder derivative matter contemplates that this action will be dismissed with prejudice in the event that settlement receives final approval by the federal court.
Item 4. | Mine Safety Disclosures. |
Not applicable.
26
PART II
Item 5. | Market for the Registrant’s Common Equity, Related Stockholder Matters and Issuer Purchases of Equity Securities |
Our common stock has been quoted on the NASDAQ Global Market under the symbol “MXWL” since 1983. The following table sets forth the high and low sale prices per share of our common stock as reported on the NASDAQ Global Market for the periods indicated.
High | Low | |||||||
Year Ended December 31, 2014 | ||||||||
First Quarter | $ | 15.29 | $ | 7.11 | ||||
Second Quarter | 18.20 | 13.02 | ||||||
Third Quarter | 15.24 | 8.52 | ||||||
Fourth Quarter | 11.66 | 7.29 | ||||||
Year Ended December 31, 2013 | ||||||||
First Quarter | $ | 10.89 | $ | 5.10 | ||||
Second Quarter | 7.80 | 4.92 | ||||||
Third Quarter | 9.72 | 7.22 | ||||||
Fourth Quarter | 9.14 | 6.82 | ||||||
As of February 10, 2015, there were 299 registered holders of our common stock, and 321 registered holders of restricted common stock that was granted under our equity compensation plans. Because many of our shares of common stock are held by brokers or other institutions on behalf of stockholders, we are unable to estimate the total number of stockholders represented by the record holders.
Dividend Policy
We have never declared or paid cash dividends on our capital stock. We currently anticipate that any earnings will be retained for the development and expansion of our business and, therefore, we do not anticipate paying cash dividends on our capital stock in the foreseeable future. Also, over the remaining term of our Equipment Term Loan, which is scheduled to be repaid by April 2015, we are not permitted to declare or pay dividends.
Recent Sales of Unregistered Securities
None.
Equity Compensation Plans
The information required by this item is incorporated by reference to Part III, Item 12, Security Ownership of Certain Beneficial Owners and Management and Related Stockholders Matters, included in this Annual Report on Form 10-K.
Issuer Purchases of Equity Securities
None.
27
Stock Performance Graph
The following graph shows a five-year comparison of cumulative total return (equal to dividends plus stock appreciation) for our Common Stock, the NASDAQ Composite Index and the Russell 2000. Total stockholder returns for prior periods are not an indication of future investment returns.
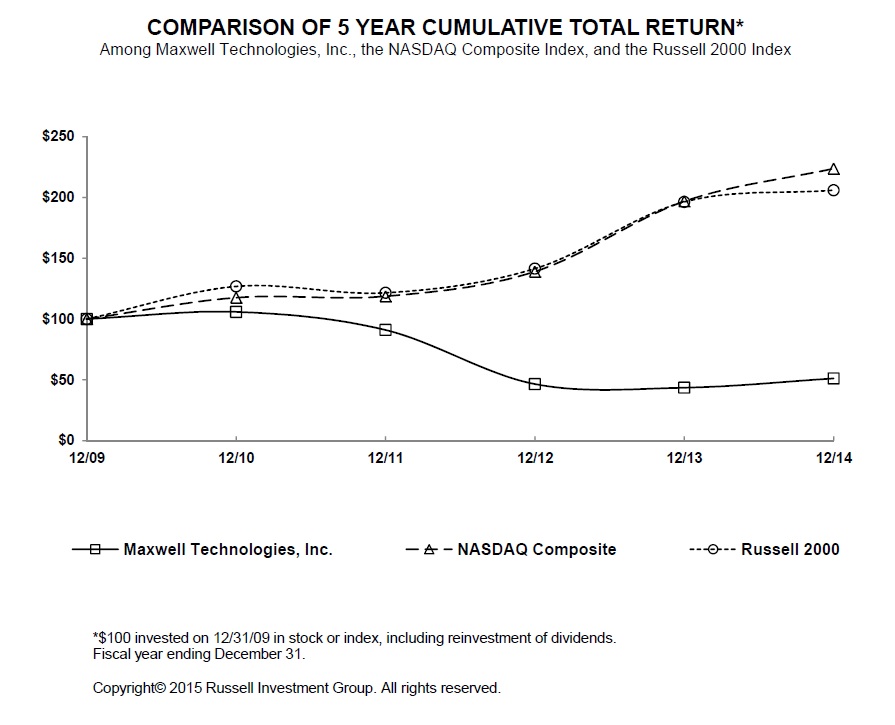
28
Item 6. | Selected Financial Data |
The selected consolidated financial data presented below is for each fiscal year in the five-year period ended December 31, 2014. The financial data for the years ended December 31, 2014, 2013 and 2012 are derived from, and are qualified by reference to, the audited consolidated financial statements that are included in this Annual Report on Form 10-K. The financial data for the years ended December 31, 2011 and 2010 are derived from audited, consolidated financial statements which are not included in this Annual Report on Form 10-K.
Years Ended December 31, | ||||||||||||||||||||
2014 | 2013 | 2012 | 2011 | 2010 | ||||||||||||||||
(In thousands, except per share data) | ||||||||||||||||||||
Consolidated Statement of Operations Data: | ||||||||||||||||||||
Total revenue | $ | 186,586 | $ | 193,534 | $ | 159,258 | $ | 147,176 | $ | 121,882 | ||||||||||
Net income (loss) | $ | (6,272 | ) | $ | 6,340 | $ | 7,174 | $ | (1,438 | ) | $ | (6,056 | ) | |||||||
Net income (loss) per share | ||||||||||||||||||||
Basic | $ | (0.21 | ) | $ | 0.22 | $ | 0.25 | $ | (0.05 | ) | $ | (0.23 | ) | |||||||
Diluted | $ | (0.21 | ) | $ | 0.22 | $ | 0.25 | $ | (0.05 | ) | $ | (0.23 | ) | |||||||
As of December 31, | ||||||||||||||||||||
2014 | 2013 | 2012 | 2011 | 2010 | ||||||||||||||||
(In thousands) | ||||||||||||||||||||
Consolidated Balance Sheet Data: | ||||||||||||||||||||
Total assets | $ | 186,600 | $ | 190,087 | $ | 176,472 | $ | 154,746 | $ | 149,811 | ||||||||||
Cash and cash equivalents | $ | 24,732 | $ | 30,647 | $ | 28,739 | $ | 29,289 | $ | 47,829 | ||||||||||
Short-term borrowings and current portion of long-term debt | $ | 15,549 | $ | 7,914 | $ | 9,452 | $ | 5,431 | $ | 3,511 | ||||||||||
Long-term debt, excluding current portion | $ | 20 | $ | 100 | $ | 83 | $ | 68 | $ | 12,608 | ||||||||||
Stockholders’ equity | $ | 126,953 | $ | 140,210 | $ | 124,933 | $ | 101,044 | $ | 88,023 | ||||||||||
Shares outstanding | 29,846 | 29,563 | 29,162 | 28,174 | 27,182 | |||||||||||||||
29
Item 7. | Management’s Discussion and Analysis of Financial Condition and Results of Operations |
The following discussion of our financial condition and results of operations for the years ended December 31, 2014, 2013 and 2012 should be read in conjunction with our consolidated financial statements and the related notes included in Item 8, Financial Statements and Supplementary Data, of this Annual Report on Form 10-K. In addition, the discussion contains forward-looking statements that are subject to risks and uncertainties, including estimates based on our judgment. These estimates include, but are not limited to, assessing the collectability of accounts receivable, applied and unapplied production costs, production capacities, the usage and recoverability of inventories and long-lived assets, deferred income taxes, the incurrence of warranty obligations, stock compensation expense, impairment of goodwill, strategies, future revenues and other operating results, cash balances and access to liquidity, the probability that the performance criteria of equity awards will be met and accruals for estimated losses from legal matters. For further discussion regarding forward looking statements, see the section of this Annual Report on Form 10-K entitled Special Note Regarding Forward-Looking Statements.
Management’s Discussion and Analysis of Financial Condition and Results of Operations (“MD&A”) is designed to provide a reader of our financial statements with a narrative from the perspective of our management on our financial condition, results of operations, liquidity and certain other factors that may affect our future results. Our MD&A is presented in the following sections:
• | Executive Overview |
• | 2014 Highlights |
• | Results of Operations |
• | Liquidity and Capital Resources |
• | Contractual Obligations |
• | Critical Accounting Estimates |
• | Impact of Inflation |
• | Pending Accounting Pronouncements |
• | Off Balance Sheet Arrangements |
Executive Overview
Maxwell is a global leader in developing, manufacturing and marketing energy storage and power delivery products for transportation, industrial, information technology and other applications and microelectronic products for space and satellite applications. Our products are designed and manufactured to perform reliably with minimal maintenance for the life of the applications into which they are integrated. We believe that this "life-of-the-application" reliably gives our products a competitive advantage and enables them to command higher profit margins than commodity products. We have three product lines: ultracapacitors with applications in multiple industries, including transportation, automotive, information technology, renewable energy and consumer and industrial electronics; high-voltage capacitors applied mainly in electrical utility infrastructure; and radiation-hardened microelectronic products for space and satellite applications.
Our primary objective is to grow revenue and profit margins by creating and satisfying demand for ultracapacitor-based energy storage and power delivery solutions. We are focusing on establishing and expanding market opportunities for ultracapacitors and being the preferred supplier for ultracapacitor products worldwide. We believe that the transportation industry represents the largest market opportunity for ultracapacitors, primarily for applications related to engine starting, electrical system augmentation, and braking energy recuperation and hybrid electric drive systems for transit buses, trucks and autos, and electric rail vehicles. Backup power and power quality applications, including instantly available power for uninterruptible power supply systems, and stabilizing the output of renewable energy generation systems may also represent significant market opportunities.
We also seek to expand market opportunities and revenue for our high-voltage capacitors and radiation-hardened microelectronic products. The market for high-voltage capacitors consists mainly of expansion, upgrading and maintenance of existing electrical utility infrastructure and new infrastructure installations in developing countries. Such installations are capital-intensive and frequently are subject to regulation, availability of government funding and general economic conditions. Although the market for microelectronics products for space and satellite applications is relatively small, the specialized nature of these products and the requirement for failure-free reliability allows us to generate profit margins significantly higher than those for commodity electronic components.
30
In 2014, revenues were $186.6 million compared with $193.5 million in 2013, representing an overall decrease of 4%. The decrease is primarily attributable to lower revenues for our high-voltage capacitor products which were down 7% from 2013, and lower revenues for our microelectronic products, which were down 24% from 2013. Revenues for our high-voltage capacitor products decreased by $3.0 million to $40.4 million in 2014 compared with $43.3 million in 2013, as we are currently experiencing reduced global demand for these products. Revenues for our microelectronics products decreased by $3.3 million to $10.6 million in 2014 compared with $13.9 million in 2013. During 2014, there were fewer space and satellite programs, or delays in such programs, which incorporate our microelectronics products.
Revenues for our ultracapacitor products of $135.6 million in 2014 were relatively comparable with revenues of $136.3 million in 2013. However, 2013 ultracapacitor revenues included $11.3 million related to the recognition of revenue on prior year’s ultracapacitor shipments, net of amount shipped in 2013 for which revenue was deferred at the end of the year. In 2014, ultracapacitor sales for rail transit, wind energy, and automotive applications increased significantly, which was offset by a decline in sales for Chinese hybrid transit vehicle applications.
Overall gross profit margin for fiscal year 2014 decreased to 37% compared with 39% in 2013 primarily related to the decreases in revenues for our high-voltage capacitor and our microelectronic products, resulting in a higher proportion of our overall sales volume being attributable to our ultracapacitor products, which earn lower margins than the other product lines. Operating expenses increased to 38% of revenue for 2014 from 35% of revenue for 2013 primarily due to the decrease in revenues and an increase in research and development spending.
As of December 31, 2014, we had cash and cash equivalents of $24.7 million. Management believes that this available cash balance will be sufficient to fund our operations, obligations as they become due, and capital investments for at least the next twelve months. In the future, we may decide to supplement existing cash and planned cash flow from operations by borrowing additional funds or by issuing additional debt or equity.
Going forward, we will continue to focus on growing our business and strengthening our market leadership and brand recognition through further penetration of existing markets, entry into new markets and development of new products. Our primary focus will be to grow our ultracapacitor business by increasing sales into primary applications, including automotive, transportation, renewable energy and backup power. In order to achieve our growth objectives, we will need to overcome risks and challenges facing our business.
A significant challenge we face is our ability to manage dependence on a small number of vertical markets, including some that are driven by government policies and subsidy programs. For example, a large portion of our current ultracapacitor business is concentrated in the Chinese hybrid transit bus and wind energy markets, which are heavily dependent on government regulation and subsidy. These markets may decline or experience slower rates of growth when there are changes or delays in government policies and subsidy programs. In mid-2013, the Chinese government subsidy program which provided subsidies for diesel-electric hybrid buses concluded. The Chinese government then put into a place a new subsidy program which did not include subsidies for diesel-electric hybrid buses. However, our Chinese bus customers then began incorporating our ultracapacitor products into plug-in hybrid buses, which are subsidized by the new subsidy program. The current subsidy program is scheduled to expire at the end of 2015, although it may be renewed or replaced.
More recently, we are beginning to experience significant competition and pricing pressure in the Chinese hybrid transit vehicle market, which has historically represented a significant portion of our sales, mainly as a result of increased competition from local Chinese competitors. In order to remain competitive, we may be required to lower our prices and provide more favorable sales terms to our customers. We remain focused on reducing the cost of producing our ultracapacitors in order to offset in part the lower prices we may be required to offer in this particular market. However, initially, our cost reduction efforts are not expected to fully offset the impact of these lower prices, therefore, our profit margins are expected to decline in the near term.
Although we believe the long-term prospects for the automotive, wind and hybrid bus markets remain positive, we are pursuing growth opportunities for our products in other vertical markets, including applications for backup power, power quality and heavy vehicle engine starting, in order to further diversify our market presence and augment our long-term growth prospects.
Other significant risks and challenges we face include the ability to achieve profitability; the ability to develop our management team, product development infrastructure and manufacturing capacity to facilitate growth; competing technologies that may capture market share and interfere with our planned growth; and hiring, developing and retaining key personnel critical to the execution of our strategy. We will be attentive to these risks and will focus on developing new products and promoting the value proposition of our products versus competing technologies and trying to grow our revenues and profits in the years to come.
31
2014 Highlights
During 2014, we continued to focus on introducing new products, winning new customers, new product applications, increasing production capacity to meet anticipated future demand, reducing product costs, making capital investments to facilitate growth, and improving production processes. Some of these efforts are described below:
• | In February, we announced that we supplied seven powerful single board computers that are providing processing power for the European Space Agency's Gaia Satellite, which lifted off on December 19, 2013. |
• | Also in February, we announced that we are supplying ultracapacitor-based Engine Start Modules to Idle Free Systems, Inc., a leader in anti-idling solutions for the trucking industry, to provide cranking power for a new anti-idling system into vocational markets across North America. |
• | In March, we introduced our ultracapacitor-based Engine Start Module for medium duty diesel trucks. Consistent with the current Engine Start Module, the new product provides the same benefits to class 3 through 6 medium duty trucks. |
• | In April, we announced that we are supplying ultracapacitors to ABB, the global leader in power and automation solutions. ABB will incorporate Maxwell ultracapacitors in a new hybrid version of its high-efficiency energy recovery and storage system for the light rail system serving the greater Philadelphia area. |
• | In May, we announced that our Board of Directors appointed Dr. Franz Fink, President and Chief Executive Officer, as well as to the Board of Directors. |
• | In June, we introduced our new 2.85 volt, 3400-farad ultracapacitor cell which incorporates our DuraBlueTM Advanced Shock and Vibration Technology, and is our newest innovation in ultracapacitor reliability and performance. |
• | In August, we introduced our new Electronic Voltage Transformer (EVT) for smart grid applications. Our EVT provides integrators and utilities with a smaller, lower-weight solution for compact substations and provides more accurate grid measurement. |
• | Also in August, we announced that Win Inertia, an engineering firm specializing in power electronics, energy storage and control and communication systems, is using our ultracapacitors for a stationary wayside braking energy recuperation system at an electric rail system in Cerro Negro, Spain. |
• | In October, we announced that we had won an Energy Storage North America (ESNA) Innovation Award, which honors energy storage projects in North America that help solve the challenge of creating a stable and dynamic electricity grid. Maxwell's project to provide ultracapacitors to ABB, the global leader in power and automation solutions, allows Philadelphia-area rail lines to be more energy efficient. The project earned the ESNA Innovation Award in the mobility project category. |
• | Also in October, we announced a joint development agreement with Corning Incorporated with the goal of advancing the state of capacitive energy storage technology by addressing the challenges frequently cited by ultracapacitor customers, including energy density, lifetime, operating environment, form factor and cost. |
• | In November, we announced that we were awarded a $2.68 million cost-shared technology development contract by the United States Advanced Battery Consortium LLC (USABC) to develop a high-performance hybrid ultracapacitor/lithium-ion battery for stop-start idle-elimination micro-hybrid autos. |
32
Results of Operations
The following table presents certain statement of operations data expressed as a percentage of revenue for the periods indicated:
Years Ended December 31, | |||||||||
2014 | 2013 | 2012 | |||||||
Total revenue | 100 | % | 100 | % | 100 | % | |||
Cost of revenue | 63 | % | 61 | % | 59 | % | |||
Gross profit | 37 | % | 39 | % | 41 | % | |||
Operating expenses: | |||||||||
Selling, general and administrative | 24 | % | 23 | % | 21 | % | |||
Research and development | 14 | % | 12 | % | 14 | % | |||
Total operating expenses | 38 | % | 35 | % | 35 | % | |||
Operating income | (1 | )% | 4 | % | 6 | % | |||
Other income, net | — | % | — | % | — | % | |||
Income from operations before income taxes | (1 | )% | 4 | % | 6 | % | |||
Income tax provision | 2 | % | 1 | % | 1 | % | |||
Net income (loss) | (3 | )% | 3 | % | 5 | % | |||
Year Ended December 31, 2014 Compared with Year Ended December 31, 2013
Net loss reported for 2014 was $6.3 million, or $0.21 per share, compared with net income of $6.3 million, or $0.22 per diluted share, in 2013. Revenue decreased 4% in 2014 compared with 2013, although revenues in 2013 included $11.3 million related to the recognition of revenue on prior year’s ultracapacitor shipments, net of amount shipped in 2013 for which revenue was deferred at the end of the year. Gross profit declined as a percentage of revenue from 39% in 2013 to 37% in 2014. Total operating expenses increased to 38% of revenue in 2014 compared with 35% in 2013.
Revenue and Gross Profit
The following table presents revenue, cost of revenue and gross profit for the years ended December 31, 2014 and 2013 (in thousands, except percentage):
Year Ended December 31, 2014 | Year Ended December 31, 2013 | ||||||||||||||||||||
Amount | % of Revenue | Amount | % of Revenue | Decrease | % Change | ||||||||||||||||
Revenue | $ | 186,586 | 100 | % | $ | 193,534 | 100 | % | $ | (6,948 | ) | (4 | )% | ||||||||
Cost of revenue | 118,146 | 63 | % | 118,241 | 61 | % | (95 | ) | — | % | |||||||||||
Gross profit | $ | 68,440 | 37 | % | $ | 75,293 | 39 | % | $ | (6,853 | ) | (9 | )% | ||||||||
Revenue in 2014 decreased 4% to $186.6 million, compared with $193.5 million in 2013. Ultracapacitor product revenue was $135.6 million in 2014, compared with $136.3 million in the prior year. However, revenues in 2013 included the $11.3 million related to the recognition of revenue on prior year’s ultracapacitor shipments, net of amount shipped in 2013 for which revenue was deferred at the end of the year. In 2014, ultracapacitor sales for rail transit, wind energy, and automotive applications increased significantly, which was offset by a decline in sales for Chinese hybrid transit vehicle applications. The decline in sales in the Chinese hybrid transit vehicle market primarily related to the expiration of a Chinese government subsidy program for diesel-electric hybrid buses in the middle of 2013. The Chinese government then put into a place a new subsidy program which did not include subsidies for diesel-electric hybrid buses. However, our Chinese bus customers then began incorporating our ultracapacitor products into plug-in hybrid buses, which are subsidized by the new subsidy program. The current subsidy program is scheduled to expire at the end of 2015, although it may be renewed or replaced.
Sales of high-voltage capacitor products totaled $40.4 million for 2014, down 7% from the $43.3 million recorded in 2013, as we experienced a reduction in global demand for our high-voltage products in 2014. Revenue from our microelectronic products totaled $10.6 million for 2014, down 24% from the $13.9 million recorded in 2013. During 2014, there were fewer space and satellite programs, or delays in such programs, which incorporate our microelectronics products.
33
A substantial amount of our revenue is generated through our Swiss subsidiary which has a functional currency of the Swiss Franc. As such, reported revenue can be materially impacted by the changes in exchange rates between the Swiss Franc and the U.S. Dollar, our reporting currency. Due to the weakening of the U.S. Dollar against the Swiss Franc during 2014 compared with 2013, revenue was positively impacted by $356,000.
The following table presents revenue mix by product line for the years ended December 31, 2014 and 2013:
Year Ended December 31, | ||||||
2014 | 2013 | |||||
Ultracapacitors | 73 | % | 71 | % | ||
High-voltage capacitors | 21 | % | 22 | % | ||
Microelectronics products | 6 | % | 7 | % | ||
Total | 100 | % | 100 | % | ||
Gross profit in 2014 decreased $6.9 million, or 9%, to $68.4 million compared with 2013.The decrease in gross profit in absolute dollars related primarily to a decrease in the volume of ultracapacitor revenues, as we recognized $11.3 million in revenue in 2013 related to previous year's sales, a decline in microelectronics product sales, as well as a decline in the average selling prices for our ultracapacitor products in 2014 compared with 2013.
As a percentage of revenue, gross profit decreased to 37% in 2014 compared with 39% in 2013. This decrease in gross profit as a percentage of revenue was primarily a result of the decrease in sales for our high-voltage capacitor and microelectronics products, which earn higher margins than our ultracapacitor products. Additionally, the decrease in gross profit as a percentage of revenues was affected by the decline in ultracapacitor average selling prices.
Selling, General and Administrative Expense
The following table presents selling, general and administrative expense for the years ended December 31, 2014 and 2013 (in thousands, except percentage):
Year Ended December 31, 2014 | Year Ended December 31, 2013 | ||||||||||||||||||||
Amount | % of Revenue | Amount | % of Revenue | Decrease | % Change | ||||||||||||||||
Selling, general and administrative | $ | 43,857 | 24 | % | $ | 44,195 | 23 | % | $ | (338 | ) | (1 | )% | ||||||||
Selling, general and administrative expenses were 24% of revenue for 2014, up from 23% in 2013, while total expenses decreased by $338,000, or 1% in 2014 compared with 2013. The decrease in absolute dollars was primarily driven by a decrease in legal, audit, tax and consulting fees which were higher in 2013 by $4.7 million, mainly related to the audit committee's investigation, our internal review and the restatement of previously issued financial statements. This impact was offset by an increase in labor expenses of $1.5 million in 2014 compared with 2013, primarily related to additional headcount for sales and marketing. Additionally, recruiting expenses increased by $822,000, primarily due to the search for our new chief executive officer and additional staff for our San Diego and Asia facilities. In addition, advertising and promotion expenses increased by $819,000, mainly related to an increased focus on advertising for our newer engine starting product, and travel expenses increased by $658,000, mainly related to customer relations and sales efforts. Despite the decline in absolute dollars, selling, general and administrative expenses increased to 24% of revenue for 2014, up from 23% for 2013, as a result of the lower revenues for 2014.
Research and Development Expense
The following table presents research and development expense for the years ended December 31, 2014 and 2013 (in thousands, except percentage):
Year Ended December 31, 2014 | Year Ended December 31, 2013 | ||||||||||||||||||||
Amount | % of Revenue | Amount | % of Revenue | Increase | % Change | ||||||||||||||||
Research and development | $ | 26,320 | 14 | % | $ | 22,542 | 12 | % | $ | 3,778 | 17 | % | |||||||||
34
Research and development expenses were 14% of revenue for 2014, up from 12% in 2013, while total expenses increased by $3.8 million, or 17% in 2014 compared with 2013. The increase in absolute dollars was primarily driven by increases of $1.8 million in labor expenses and $1.8 million in contracted research and development services. These increases were to support efforts to improve manufacturing processes and to develop and enhance products. In addition to the increase in absolute dollars, research and development expenses increased to 14% of revenue in 2014 up from 12% in 2013, as both expenses were higher and revenues were lower in 2014.
Provision for Income Taxes
The effective tax rate differs from the statutory U.S. federal income tax rate of 34% primarily due to foreign income tax and the valuation allowance against the Company’s domestic deferred tax assets.
We recorded an income tax provision of $4.3 million for the year ended December 31, 2014 compared with $2.2 million for the year ended December 31, 2013. This provision is primarily related to taxes on income generated by our Swiss subsidiary. As a result of changes in business circumstances in the fourth quarter of 2014, the Company changed its estimate of the amount of foreign earnings considered permanently reinvested. Therefore, during the quarter ended December 31, 2014, we recorded a $1.6 million deferred tax expense associated with a portion of the unremitted earnings of a foreign subsidiary that are not considered permanently reinvested. In the event that we repatriate these earnings, this withholding tax would become payable. The Company has established a valuation allowance against its U.S. federal and state deferred tax assets, as well as the deferred tax asset of a foreign subsidiary, due to the uncertainty surrounding the realization of such assets as evidenced by the cumulative losses from operations through December 31, 2014. Management periodically evaluates the recoverability of the deferred tax assets and at such time as it is determined that it is more likely than not that deferred assets are realizable, the valuation allowance will be reduced accordingly.
At December 31, 2014, we have a cumulative valuation allowance recorded offsetting our worldwide net deferred tax assets of $64.2 million, of which the significant majority represents the valuation allowance on our U.S. net deferred tax asset. We have established a valuation allowance against our U.S. federal and state deferred tax assets due to the uncertainty surrounding the realization of such assets. Management periodically evaluates the recoverability of the deferred tax assets and at such time as it is determined that it is more likely than not that U.S. deferred tax assets are realizable, the valuation allowance will be reduced accordingly.
Year Ended December 31, 2013 Compared with Year Ended December 31, 2012
Net income reported for 2013 was $6.3 million, or $0.22 per diluted share, compared with net income of $7.2 million, or $0.25 per diluted share, in 2012. Revenue grew 22% in 2013 compared with 2012, while gross profit declined as a percentage of revenue from 41% in 2012 to 39% in 2013. Total operating expenses were generally consistent in 2013 compared with 2012.
Revenue and Gross Profit
The following table presents revenue, cost of revenue and gross profit for the years ended December 31, 2013 and 2012 (in thousands, except percentage):
Year Ended December 31, 2013 | Year Ended December 31, 2012 | ||||||||||||||||||||
Amount | % of Revenue | Amount | % of Revenue | Increase | % Change | ||||||||||||||||
Revenue | $ | 193,534 | 100 | % | $ | 159,258 | 100 | % | $ | 34,276 | 22 | % | |||||||||
Cost of revenue | 118,241 | 61 | % | 94,206 | 59 | % | 24,035 | 26 | % | ||||||||||||
Gross profit | $ | 75,293 | 39 | % | $ | 65,052 | 41 | % | $ | 10,241 | 16 | % | |||||||||
Revenue in 2013 increased 22% to $193.5 million, compared with $159.3 million in 2012. Ultracapacitor product revenue increased by 42% to $136.3 million in 2013, compared with $96.0 million in the prior year. This increase in revenues for our ultracapacitor products was primarily influenced by increased sales into the hybrid transit vehicle and wind energy markets. In addition, the increase in ultracapacitor revenues was partially due to the net impact of deferring revenue on certain sales arrangements which resulted in $11.3 million in additional revenue in 2013. For 2012, there was a net decrease to ultracapacitor revenues of $6.1 million related to the net impact of revenue deferrals.
Sales of high-voltage capacitor products totaled $43.3 million for 2013, down 5% from the $45.6 million recorded in 2012, while revenue from our microelectronic products, which tend to vary widely, totaled $13.9 million for 2013, down 22% from the $17.7 million recorded in 2012.
35
A substantial amount of our revenue is generated through our Swiss subsidiary which has a functional currency of the Swiss Franc. As such, reported revenue can be materially impacted by the changes in exchange rates between the Swiss Franc and the U.S. Dollar, our reporting currency. Due to the weakening of the U.S. Dollar against the Swiss Franc during 2013 compared with 2012, revenue was positively impacted by $391,000.
The following table presents revenue mix by product line for the years ended December 31, 2013 and 2012:
Year Ended December 31, | ||||||
2013 | 2012 | |||||
Ultracapacitors | 71 | % | 60 | % | ||
High-voltage capacitors | 22 | % | 29 | % | ||
Microelectronics products | 7 | % | 11 | % | ||
Total | 100 | % | 100 | % | ||
Gross profit in 2013 increased $10.2 million, or 16%, to $75.3 million compared with 2012. As a percentage of revenue, gross profit decreased to 39% in 2013 compared with 41% in 2012. The decrease in gross profit as a percent of revenue was primarily due to sales mix, where a higher proportion of our overall sales volume was attributable to our ultracapacitor products, which earn lower margins than our other product lines. Of the increase in gross profit in absolute dollars, $11.7 million related to an increase in sales which was partially offset by a $1.6 million increase to our reserve for excess and obsolete inventory and a $464,000 reserve for product rework costs.
Selling, General & Administrative Expense
The following table presents selling, general and administrative expense for the years ended December 31, 2013 and 2012 (in thousands, except percentage):
Year Ended December 31, 2013 | Year Ended December 31, 2012 | ||||||||||||||||||||
Amount | % of Revenue | Amount | % of Revenue | Increase | % Change | ||||||||||||||||
Selling, general and administrative | $ | 44,195 | 23 | % | $ | 33,656 | 21 | % | $ | 10,539 | 31 | % | |||||||||
Selling, general and administrative expenses were 23% of revenue in 2013, compared with 21% in 2012, while total expenses increased by $10.5 million, or 31%. The increase in absolute dollars was primarily driven by an increase in legal expenses of $3.0 million, an increase in audit and tax fees of $1.7 million and an increase of $790,000 in consulting expenses, mainly related to the audit committee's investigation, our internal review and the restatement of previously issued financial statements. Further, there was an increase of $3.2 million in payroll expenses related to increased headcount, including the retention of a chief operating officer. In addition, there was an increase in bonus expense of $1.7 million, as the performance targets under our 2013 bonus program were substantially achieved, whereas there was no bonus expense recorded in 2012 as the performance targets under our 2012 bonus program were not achieved.
Research and Development Expense
The following table presents research and development expense for the years ended December 31, 2013 and 2012 (in thousands, except percentage):
Year Ended December 31, 2013 | Year Ended December 31, 2012 | ||||||||||||||||||||
Amount | % of Revenue | Amount | % of Revenue | Increase | % Change | ||||||||||||||||
Research and development | $ | 22,542 | 12 | % | $ | 21,700 | 14 | % | $ | 842 | 4 | % | |||||||||
Research and development expenses were 12% of revenue in 2013, compared with 14% in 2012, while total expenses increased by $22.5 million in 2013 compared with $21.7 million in 2012, an increase of approximately $842,000 or 4%. As a percentage of revenues, research and development expenses were 12% in 2013 compared with 14% in 2012. The increase in absolute dollars was primarily driven by an increase in facility costs of $843,000 due to continued expansion of our research and development facilities.
36
Provision for Income Taxes
We recorded an income tax provision of $2.2 million for the year ended December 31, 2013 compared with $2.3 million for the year ended December 31, 2012. This provision was primarily related to taxes on income generated by our Swiss subsidiary. Unremitted earnings of foreign subsidiaries were included in the consolidated financial statements without giving effect to the United States taxes that may be payable. We have established a valuation allowance against our U.S. federal and state deferred tax assets, as well as the deferred tax assets of a certain foreign subsidiaries, due to the uncertainty surrounding the realization of such assets as evidenced by the cumulative losses from operations through December 31, 2013. Management periodically evaluates the recoverability of the deferred tax assets and at such time as it is determined that it is more likely than not that deferred assets are realizable, the valuation allowance will be reduced accordingly.
Liquidity and Capital Resources
Changes in Cash Flow
The following table summarizes our cash flows from operating, investing and financing activities for each of the past three fiscal years (in thousands):
Years Ended December 31, | ||||||||||||
2014 | 2013 | 2012 | ||||||||||
Total cash provided by (used in): | ||||||||||||
Operating activities | $ | (6,163 | ) | $ | 19,891 | $ | (1,146 | ) | ||||
Investing activities | (6,975 | ) | (16,850 | ) | (15,200 | ) | ||||||
Financing activities | 9,563 | (1,356 | ) | 15,569 | ||||||||
Effect of exchange rate changes on cash and cash equivalents | (2,340 | ) | 223 | 227 | ||||||||
Increase (decrease) in cash and cash equivalents | $ | (5,915 | ) | $ | 1,908 | $ | (550 | ) | ||||
Net cash used in operating activities was $6.2 million in 2014, compared with net cash provided by operating activities of $19.9 million in 2013 and net cash used in operating activities of $1.1 million in 2012. Operating cash flows for 2014 related primarily to a net loss of $6.3 million, which included non-cash charges of $15.2 million. In addition, there was an increase in accounts receivable of $15.1 million, and an increase in inventory of $1.5 million. The increase in accounts receivable was primarily due to sales growth as well as shipment linearity, where shipments were more weighted to the last two months of 2014. The increase in inventories primarily relates to lower demand in the fourth quarter of 2014 than anticipated.
The decrease in operating cash flows for 2014 compared with 2013 relates primarily to the net loss of $6.3 million along with non-cash charges of $15.2 million for 2014 versus net income of $6.3 million along with non-cash charges of $14.8 million in 2013. Further, 2014 cash flows were affected by an increase in accounts receivable of $15.1 million as compared with a decrease of $3.7 million in accounts receivable in 2013.
Net cash used in investing activities was $7.0 million for the year ended December 31, 2014, compared with $16.9 million in 2013 and $15.2 million in 2012. Capital expenditures in 2014 were primarily focused on investments in increased production capacity, including equipment for our manufacturing facilities in San Diego, California and Peoria, Arizona and our contract manufacturing operations in Shenzhen, China, as well as investments in our corporate research and development center in San Diego, California. Cash used in investing activities in 2013 and 2012 was primarily focused on investments to increase production capacity, including equipment for our manufacturing facilities in Peoria, Arizona and Rossens, Switzerland, as well as investments in our corporate research and development facility in San Diego, California.
Net cash provided by financing activities was $9.6 million for the year ended December 31, 2014, compared with net cash used in financing activities of $1.4 million in 2013 and net cash provided by financing activities of $15.6 million in 2012. During the year ended December 31, 2014, net cash provided by financing activities primarily resulted from net borrowing on long term and short term debt of $8.1 million, and cash proceeds from our stock-based compensation plans of $1.4 million. During the year ended December 31, 2013, net cash used in financing activities primarily resulted from net payments on long term and short term debt of $1.7 million, offset by cash proceeds from our stock-based compensation plans of $412,000. During the year ended December 31, 2012, net cash provided by financing activities primarily resulted from the issuance of common stock under a secondary security offering of $10.3 million, net proceeds on long term and short term debt of $3.8 million, and cash proceeds associated with our stock-based compensation plans of $1.8 million.
37
Liquidity
As of December 31, 2014, we had approximately $24.7 million in cash and cash equivalents, and working capital of $62.0 million. Management believes that available cash balances will be sufficient to fund our operations, obligations as they become due, and capital equipment expenditures for at least the next twelve months. In addition, we may choose to issue additional debt or equity to supplement our existing cash balances.
We have a total of $15.6 million of debt outstanding as of December 31, 2014, of which $9.9 million is outstanding under a $10.0 million line of credit and $559,000 is outstanding under an equipment term loan with the same bank. These amounts are immediately callable by the bank as a result of the event of noncompliance discussed below. The line of credit was otherwise scheduled to expire on February 28, 2015, and the equipment term loan was scheduled to mature on April 30, 2015.
We are working with the bank and expect to be able to able to obtain a waiver for the event of default and extend the term of this credit facility and do not expect that the outstanding debt obligation will be called by the bank.
On June 3, 2014, we filed a shelf registration statement on Form S-3 with the SEC to, from time to time, sell up to $125 million of our common stock, warrants, debt securities or units. To date, we have not raised any funds under this shelf registration statement. In the future, we may decide to supplement existing cash and planned cash flows by borrowing additional funds or by issuing additional debt or equity.
Capital expenditures are expected to be approximately $6.5 million in 2015. Approximately 50% of our planned capital spending is focused on product research and development and 30% is focused on improving manufacturing processes. The remaining planned capital spending will support information technology infrastructure and improvements to our facilities.
As of December 31, 2014, the amount of cash and short-term investments held by foreign subsidiaries was $17.4 million. If these funds are needed for our operations in the U.S. in the future, we may be required to accrue and pay taxes to repatriate a portion of these funds at a rate of approximately 5%. For the year ended December 31, 2014, we recorded a $1.6 million deferred tax expense associated with a portion of the unremitted earnings of a foreign subsidiary that are not considered permanently reinvested.
Credit Facility
In December 2011, we obtained a secured credit facility in the form of a revolving line of credit (the “Revolving Line of Credit”) and an equipment term loan (the “Equipment Term Loan”) (together, the “Credit Facility”). As amended, the Revolving Line of Credit is available up to a maximum of $10.0 million. In general, amounts borrowed under the Credit Facility are secured by a lien on all of our assets other than our intellectual property. In addition, under the credit agreement, as amended, we are required to pledge 100% of our equity interests in our Swiss subsidiary. We have also agreed not to encumber any of our intellectual property. The agreement contains certain restrictive covenants that limit our ability to, amongst other things; (i) incur additional indebtedness or guarantees; (ii) create liens or other encumbrances on our property; (iii) enter into a merger or similar transaction; (iv) invest in another entity; (v) declare or pay dividends; and (vi) invest in fixed assets in excess of a defined dollar amount. Repayment of amounts owed pursuant to the Credit Facility may be accelerated in the event that we are in violation of any of the representations, warranties and covenants made in the credit agreement, including certain financial covenants. The financial covenants that we must meet during the term of the credit agreement, as amended, include quarterly minimum liquidity ratios, minimum cash requirements and net loss targets. Borrowings under the Credit Facility bear interest, payable monthly, at either (i) the bank's prime rate or (ii) LIBOR plus 2.25%, at our option subject to certain limitations. Further, we incur an unused commitment fee, payable quarterly, equal to 0.25% per annum of the average daily unused amount of the Revolving Line of Credit.
The Equipment Term Loan was available to finance 80% of eligible equipment purchases made between April 1, 2011 and April 30, 2012. During this period, we borrowed $5.0 million under the Equipment Term Loan. During 2014, we borrowed $9.9 million under the Revolving Line of Credit.
As of December 31, 2013, we were not in compliance with the financial covenant pertaining to the quarterly EBITDA target for the quarter ended December 31, 2013. As a result of this noncompliance, borrowings outstanding under the Credit Facility were classified as a current obligation in the consolidated balance sheet as of December 31, 2013.
As of December 31, 2014, we were not in compliance with the financial covenant pertaining to the quarterly net loss target of not more than $1.0 million for the quarter ended December 31, 2014. As a result of this noncompliance, borrowings outstanding under the Credit Facility are immediately callable by the bank. The Revolving Line of Credit was otherwise scheduled to expire on February 28, 2015, and the Equipment Term Loan was scheduled to mature on April 30, 2015.
As of December 31, 2014, $9.9 million was outstanding under the Revolving Line of Credit and the applicable interest rate was LIBOR plus 3.00% (3.25% as of December 31, 2014). The amount outstanding under the Revolving Line of Credit is
38
scheduled to be repaid by February 28, 2015. As of December 31, 2014, $559,000 was outstanding under the Equipment Term Loan and the applicable interest rate was LIBOR plus 2.25% (2.5% as of December 31, 2014). Principal and interest under the Equipment Term Loan are payable in 36 equal monthly installments such that the Equipment Term Loan is fully repaid by the maturity date of April 30, 2015, but may be prepaid in whole or in part at any time.
Short-term borrowings
Maxwell’s Swiss subsidiary, Maxwell SA, has a 3.0 million Swiss Franc-denominated (approximately $3.0 million as of December 31, 2014) short-term loan agreement with a Swiss bank, which renews semi-annually and bears interest at 1.4%. Borrowings under the short-term loan agreement are unsecured and as of December 31, 2014 and 2013, the full amount of the loan was drawn. In addition, Maxwell SA has a 2.0 million Swiss Franc-denominated (approximately $2.0 million as of December 31, 2014) credit agreement with this same Swiss bank, which renews annually and bears interest at 1.7%. Borrowings under the credit agreement are unsecured and as of December 31, 2014 and 2013, the full amount available under the credit line was drawn.
Maxwell SA also has a 1.0 million Swiss Franc-denominated (approximately $1.0 million as of December 31, 2014) credit agreement with another Swiss bank, and the available balance of the line can be withdrawn or reduced by the bank at any time. As of December 31, 2014 and 2013, no amounts were drawn under the credit line. Interest rates applicable to any draws on the line will be determined at the time of draw.
Other long-term borrowings
Maxwell SA has various financing agreements for vehicles. These agreements are for up to an original three-year repayment period with interest rates ranging from 1.9% to 5.1%. At December 31, 2014 and 2013, $82,000 and $179,000, respectively, was outstanding under these agreements.
Dividends
Over the remaining term of the Equipment Term Loan, which is scheduled to be repaid by April 2015, we are not permitted to declare or pay dividends.
Contractual Obligations
Payment due by period (in thousands) | ||||||||||||||||||||
Total | Less than 1 Year | 1–3 Years | 3–5 Years | More than 5 Years | ||||||||||||||||
Operating lease obligations (1) | $ | 20,479 | $ | 4,278 | $ | 7,957 | $ | 4,571 | $ | 3,673 | ||||||||||
Purchase commitments (2) | 6,916 | 6,916 | — | — | — | |||||||||||||||
Debt obligations (3) | 15,993 | 15,972 | 21 | — | — | |||||||||||||||
Pension benefit payments (4) | 31,252 | 1,824 | 1,813 | 1,437 | 26,178 | |||||||||||||||
Deferred tax liability on undistributed earnings of foreign subsidiary (5) | 1,590 | — | — | 1,590 | — | |||||||||||||||
Research and development contract (6) | 5,140 | 1,270 | 3,870 | — | — | |||||||||||||||
Total | $ | 81,370 | $ | 30,260 | $ | 13,661 | $ | 7,598 | $ | 29,851 | ||||||||||
____________
(1) | Operating lease obligations primarily represent building leases. |
(2) | Purchase commitments primarily represent the value of non-cancelable purchase orders and an estimate of purchase orders that if canceled would result in a significant penalty. |
(3) | Debt obligations represent long-term and short-term borrowings and interest payable of $424,000. |
(4) | Pension benefit payments represent the expected amounts to be paid for pension benefits. |
(5) | For the year ended December 31, 2014, we recorded a $1.6 million deferred tax expense associated with a portion of the unremitted earnings of a foreign subsidiary that are not considered permanently reinvested. |
(6) | Amount represents estimated contractual commitments under a research and development arrangement. |
39
Critical Accounting Estimates
We consider an accounting estimate to be critical if: 1) the accounting estimate requires us to make assumptions about matters that were uncertain at the time the accounting estimate was made and 2) changes in the estimate are reasonably likely to occur from period to period, or use of different estimates that we reasonably could have used in the current period, would have a material impact on our financial condition or results of operations.
Also see Note 1, Summary of Significant Accounting Policies, in Part II, Item 8, Financial Statements and Supplementary Data, of this Annual Report on Form 10-K, which discusses the significant accounting policies.
We believe the following are either (i) critical accounting policies that require us to make significant estimates or assumptions in the preparation of our consolidated financial statements or (ii) other key accounting policies that may require us to make difficult or subjective judgments.
Revenue Recognition
Nature of Estimates Required. Sales revenue is primarily derived from the sale of products directly to customers. Product revenue is recognized when all of the criteria for revenue recognition are met. Customer agreements and other terms of the sale are evaluated to determine when the criteria for revenue recognition have been met, and therefore when revenue should be recognized. Revenue recognition is deferred until all the criteria for revenue recognition have been met.
Assumptions and Approach Used. Product revenue is recognized when all of the following criteria are met: (1) persuasive evidence of an arrangement exists according to customer contracts or sales documents; (2) title and risk of loss pass to the customer according to the order's shipping terms; (3) price is deemed fixed or determinable and free of significant contingencies or uncertainties; and (4) collectability is reasonably assured. Customer contracts, or purchase orders and order confirmations, are generally used to determine the existence of an arrangement. Shipping terms determine when the passage of title and risk of loss have occurred. We assess whether a price is fixed or determinable based upon the payment terms associated with the transaction. We assess the collectability of accounts receivable based primarily upon creditworthiness of the customer as determined by credit checks and analysis, as well as the customer’s payment history. If we determine that a particular sale does not meet all of the above criteria for revenue recognition, revenue is not recognized until all of the criteria are determined to have been achieved. For example, if we determine that collectability is not reasonably assured at the time of sale, we defer revenue recognition, typically until the period in which cash is received from the customer.
Beginning in the fourth quarter of 2011, for three distributors of our products, we offered extended payment terms which allowed these distributors to pay us after they received payment from their customer, with respect to certain sales transactions. Also beginning in the fourth quarter of 2011, for one other distributor of our products, we offered return rights and profit margin protection with respect to certain sales transactions. Therefore, for these four distributors, we determined that the revenue recognition criteria were not met at the time of delivery, as there was no fixed or determinable price, nor was collection reasonably assured, at least with respect to certain sales transactions. As a result, for the three distributors provided with extended payment terms, which did not provide for a fixed or determinable price, we determined to defer the recognition of revenue on all sales beginning in the fourth quarter of 2011 to the period in which cash is received. For the one distributor provided with return rights and profit margin protection, for which we could not estimate exposure, we determined to defer the recognition of revenue on all sales beginning in the fourth quarter of 2011 until the distributor confirmed to us that it was not entitled to any further returns or credits. During the third quarter of 2013, this distributor confirmed to us that it was not entitled to any further returns or credits, therefore, previously deferred revenue related to this distributor was recognized in the quarter ended September 30, 2013. Although we had deferred revenue for a significant amount of sales to these four distributors in prior years, the amount of deferred revenue related to these distributors as of December 31, 2013 and 2014 is insignificant.
In addition to the revenue arrangements discussed in the preceding paragraph, revenue is not recognized for any sales that do not meet the revenue recognition criteria at the time of sale. Revenue is recognized once all of the criteria for revenue recognition are determined to have been met. For example, if we do not believe that collection of the sales price is reasonably assured at the time of sale, we defer revenue recognition until cash is received.
As of December 31, 2014 and December 31, 2013, cumulative sales totaling $445,000 and $4.5 million, respectively, had not yet been recognized as revenue. We have recorded the cost basis of inventory shipped to customers prior to the achievement of the revenue recognition criteria of approximately $184,000 and $2.5 million at December 31, 2014 and 2013, respectively, in "inventory" in the consolidated balance sheets.
Total deferred revenue in our consolidated balance sheets as of December 31, 2013 and 2012 of $703,000 and $1.0 million, respectively, relates to cash received from customers on sales for which the revenue recognition criteria were not achieved, customer advances, as well as other less significant customer arrangements requiring the deferral of revenue.
40
Excess and Obsolete Inventory
Nature of Estimates Required. Estimates are principally based on assumptions regarding the ability to sell the items in our inventory. Due to the uncertainty and potential volatility inherent in these estimates, changes in our assumptions could materially affect our results of operations.
Assumptions and Approach Used. Our estimate for excess and obsolete inventory is evaluated on a quarterly basis and is based on rolling historical inventory usage and assumptions regarding future product demand. As actual levels of inventory change or specific products become slow moving or obsolete, our estimated reserve may materially change.
Pension
Nature of Estimates Required. We use several significant assumptions within the actuarial models utilized in measuring the pension benefit obligation and to estimate the fair values of real estate assets held by the pension plan.
Assumptions and Approach Used. The discount rate and expected return on assets are estimates impacting plan expense and asset and liability measurement. We evaluate these critical assumptions at least annually. In addition, we appraise the fair value of real estate assets annually. We periodically evaluate other assumptions involving demographic factors, which are used to measure the pension obligation, such as retirement age, mortality and turnover, and update them to reflect our experience and expectations for the future. Actual results in any given year will often differ from actuarial assumptions because of economic and other factors. The projected benefit obligation as of December 31, 2014 was $33.0 million and the fair value of plan assets was $40.4 million. The Company does not have any rights to the assets of the plan.
Stock-Based Compensation
Nature of Estimates Required. Our stock-based compensation awards include stock options, restricted stock, restricted stock units, and shares issued under our employee stock purchase plan. We record compensation expense for our stock-based compensation awards in accordance with the criteria set forth in the Stock Compensation Subtopic of the Financial Accounting Standards Board ("FASB") Accounting Standards Codification ("ASC"). Under the guidance, the fair value of each employee stock option is estimated on the date of grant using an option pricing model that meets certain requirements. Although we have not granted stock options since 2013, we use the Black-Scholes option pricing model to estimate the fair value of stock option grants. The determination of the fair value of stock options utilizing the Black-Scholes model is affected by our stock price and a number of assumptions, including expected volatility, expected life, risk-free interest rate and expected dividends.
The fair value of restricted stock and restricted stock units ("RSU") is based on the closing market price of our common stock on the date of grant. Compensation expense equal to the fair value of each restricted stock or RSU award is recognized ratably over the requisite service period. For restricted stock or RSU awards with vesting contingent on the achievement of Company performance conditions, we use the requisite service period that is most likely to occur. The requisite service period is estimated based on the expected achievement date of the performance condition. If it is unlikely that a performance condition will be achieved, no compensation expense is recognized unless it is later determined that achievement of the performance condition is likely. The requisite service period may be adjusted for changes in the expected outcomes of the related performance conditions, with the impact of such changes recognized as a cumulative adjustment in the consolidated statement of operations in the period in which the expectation changes.
In 2014, we issued market-condition RSU awards to certain members of executive management. Since the vesting of the market-condition RSUs is dependent on stock price performance, the fair values of these awards were estimated using a Monte-Carlo valuation model. The determination of the fair value of market-condition RSUs utilizing a Monte-Carlo valuation model was affected by our stock price and a number of assumptions, including expected volatility, expected life, risk-free interest rate and expected dividends.
Stock-based compensation expense recognized in the consolidated statement of operations is based on equity awards ultimately expected to vest. The FASB ASC requires forfeitures to be estimated at the time of grant and revised, if necessary, in subsequent periods with a cumulative catch up adjustment if actual forfeitures differ from those estimates.
Assumptions and Approach Used. In determining the value of stock option and market-condition RSU grants, we estimate an expected dividend yield of zero because we have never paid cash dividends and have no present intention to pay cash dividends. In addition, over the remaining term of the Equipment Term Loan, which is scheduled to be fully repaid by April 2015, we are not permitted to declare or pay dividends. The expected term calculation is based on the actual life of historical stock option grants. Expected volatility is based on our historical stock prices using a mathematical formula to measure the standard deviation of the change in the natural logarithm of our underlying stock price over a period of time commensurate with the expected term. The risk-free interest rate is derived from the zero coupon rate on U.S. Treasury instruments with a term commensurate with the award's expected term.
41
For restricted stock or RSU awards with vesting contingent on the achievement of Company performance conditions, the amount of compensation expense is estimated based on the expected achievement of the performance condition. This requires us to make estimates of the likelihood of the achievement of Company performance conditions, which is highly judgmental. We base our judgments as to the expected achievement of Company performance conditions based on the financial projections of the Company that are used by management for business purposes, which represent our best estimate of expected Company performance. If it is unlikely that a performance condition will be achieved, no compensation expense is recognized unless is later determined that achievement of the performance condition is likely. Further, the requisite service period is estimated based on the expected achievement date of the performance condition.
We evaluate the assumptions used to value stock-based awards on a quarterly basis. If factors change and we employ different assumptions, stock-based compensation expense may differ significantly from what we have recorded in the past. If there are any modifications or cancellations of stock-based awards, we may be required to accelerate, increase or decrease any remaining, unrecognized stock-based compensation expense. To the extent that we grant additional stock-based awards, compensation expense will increase in relation to the fair value of the additional grants. Compensation expense may be significantly impacted in the future to the extent our estimates differ from actual results.
Income Taxes
Nature of Estimates Required. We record an income tax valuation allowance when the realization of certain deferred tax assets, including net operating losses, is not likely. Not included in the net operating loss deferred tax asset is approximately $10.0 million of gross deferred tax asset attributable to stock option exercises, restricted stock grants, and disqualifying dispositions of both incentive stock options and stock issued under the Company's ESPP. According to a provision within ASC 718, Stock Compensation, concerning when tax benefits related to excess stock option deductions can be credited to paid-in capital, the related valuation allowance cannot be reversed, even if the facts and circumstances indicate it is more likely than not that the deferred tax asset can be realized. The valuation allowance will only be reversed as the related deferred tax asset is applied to reduce taxes payable.
We do not record deferred income taxes on the portion of undistributed earnings of our foreign subsidiaries that are considered indefinitely reinvested based on our decision to permanently reinvest some of these undistributed earnings. We may be subject to income and withholding taxes if earnings of the foreign subsidiaries were distributed. Additional withholding taxes of approximately $3.8 million would be payable upon remittance of all previously unremitted earnings at December 31, 2014. As a result of changes in business circumstances in the fourth quarter of 2014, the Company changed its estimate of the amount of foreign earnings considered permanently reinvested. Therefore, during the quarter ended December 31, 2014, we recorded a $1.6 million deferred tax expense associated with a portion of the unremitted earnings of a foreign subsidiary that management no longer considers permanently reinvested. In the event that we repatriate these earnings, this withholding tax would become payable.
Assumptions and Approach Used. Deferred income taxes arise from temporary differences between tax and financial statement recognition of revenue and expense. In evaluating our ability to recover our deferred tax assets within the jurisdiction from which they arise, we consider all available positive and negative evidence, including scheduled reversals of deferred tax liabilities, projected future taxable income, tax-planning strategies, and results of recent operations. Significant judgments and estimates are required in this evaluation. If we determine that we are able to realize a portion or all of these deferred tax assets in the future, we will record an adjustment to increase their recorded value and a corresponding adjustment to increase income or additional paid in capital, as appropriate, in that same period.
Commitments and Contingencies
Nature of Estimates Required. We are involved in litigation, regulatory and other proceedings and claims. We prosecute and defend these matters aggressively. However, there are many uncertainties associated with any litigation, and there can be no assurance that these actions or other third-party claims against us will be resolved without costly litigation and/or substantial settlement charges.
Assumptions and Approach Used. We disclose information concerning contingent liabilities with respect to these claims and proceedings for which an unfavorable outcome is more than remote. We recognize liabilities for these claims and proceedings as appropriate based upon the probability of loss and our ability to estimate losses and to fairly present, in conjunction with the disclosures of these matters in our consolidated financial statements, management’s view of our exposure. We review outstanding claims and proceedings with external counsel as appropriate to assess probability and estimates of loss. We will recognize a liability related to claims and proceedings at such time as an unfavorable outcome becomes probable and the amount can be reasonably estimated. When the reasonable estimate is a range, the recognized liability will be the best estimate within the range. If no amount in the range is a better estimate than any other amount, the minimum amount of the range will be recognized.
42
We re-evaluate these assessments each quarter or as new and significant information becomes available to determine whether a liability should be recognized or if any existing liability should be adjusted. The actual cost of ultimately resolving a claim or proceeding may be substantially different from the amount of the recognized liability. In addition, because it is not permissible to recognize a liability until the loss is both probable and estimable, in some cases there may be insufficient time to recognize a liability prior to the actual incurrence of the loss (upon verdict and judgment at trial, for example, or in the case of a quickly negotiated settlement).
Impact of Inflation
We believe that inflation has not had a material impact on our results of operations for any of our fiscal years in the three-year period ended December 31, 2014. However, there can be no assurance that future inflation would not have an adverse impact on our operating results and financial condition.
Recent Accounting Pronouncements
In May 2014, the Financial Accounting Standards Board (“FASB”) issued Accounting Standards Update ("ASU") No. 2014-09, Revenue from Contracts with Customers (“ASU 2014-09”). The standard provides companies with a single model for accounting for revenue arising from contracts with customers and supersedes current revenue recognition guidance, including industry-specific revenue guidance. The core principle of the model is to recognize revenue when control of the goods or services transfers to the customer, as opposed to recognizing revenue when the risks and rewards transfer to the customer under the existing revenue guidance. ASU 2014-09 is effective for annual reporting periods beginning after December 15, 2016. Early adoption is not permitted. The guidance permits companies to either apply the requirements retrospectively to all prior periods presented, or apply the requirements in the year of adoption, through a cumulative adjustment. We are in the process of evaluating the impact of adoption on our consolidated financial statements.
In August 2014, the FASB issued ASU No. 2014-15, Disclosure of Uncertainties About an Entity’s Ability to Continue as a Going Concern. The standard requires management to perform interim and annual assessments of an entity’s ability to continue as a going concern within one year of the date the financial statements are issued and provides guidance on determining when and how to disclose going concern uncertainties in the financial statements. Certain disclosures will be required if conditions give rise to substantial doubt about an entity’s ability to continue as a going concern. ASU 2014-15 applies to all entities and is effective for annual and interim reporting periods ending after December 15, 2016, with early adoption permitted. We do not expect that the adoption of this standard will have a material effect on our financial statements.
Off Balance Sheet Arrangements
None.
Item 7A. | Quantitative and Qualitative Disclosures about Market Risk |
We face exposure to financial market risks, including adverse movements in foreign currency exchange rates and changes in interest rates. These exposures may change over time and could have a material adverse impact on our financial results. We have not entered into or invested in any instruments that are subject to market risk, except as follows:
Foreign Currency Risk
Our primary foreign currency exposure is related to our subsidiary in Switzerland. Maxwell SA has Euro and local currency (Swiss Franc) revenue and operating expenses, as well as local currency loans. Changes in these currency exchange rates impact the reported amount (U.S. dollar) of revenue, expenses and debt. As part of our risk management strategy, we use forward contracts to hedge certain foreign currency exposures. Our objective is to offset gains and losses resulting from these exposures with gains and losses on the forward contracts, thereby reducing volatility of earnings. We use the forward contracts to hedge certain monetary assets and liabilities, primarily receivables and payables, denominated in a foreign currency. The change in fair value of these instruments represents a natural hedge as their gains and losses partially offset the changes in the fair value of the underlying monetary assets and liabilities due to movements in currency exchange rates. As of December 31, 2014, the impact of a theoretical detrimental change in foreign currency exchange rates of 10% on the foreign currency forward contracts would result in a hypothetical loss of $4.4 million, however, considering the offsetting impact of such a theoretical change in exchange rates on the underlying assets and liabilities being hedged, the hypothetical loss is only $20,000, which would be recorded in income from continuing operations in the consolidated statement of operations. For local currency debt carried by our Swiss subsidiary, the impact of a hypothetical 10% detrimental change in foreign currency exchange rates would result in a hypothetical loss of $575,000, which would be recorded in accumulated other comprehensive income on the consolidated balance sheet.
43
Interest Rate Risk
At December 31, 2014, we had approximately $15.6 million in debt, $20,000 of which is classified as long-term debt. Changes in interest rates may affect the consolidated balance sheet and statement of operations. The impact on earnings or cash flow during the next fiscal year from a change of 100 basis points (or 1%) in the interest rate would have a $156,000 effect on interest expense.
Fair Value Risk
We have a net pension asset of $7.4 million at December 31, 2014, including plan assets of $40.4 million, which are recorded at fair value. The plan assets consist of 55% debt and equity securities, 40% real estate and 5% cash and cash equivalents. The fair value measurement of the real estate is subject to the real estate market forces in Switzerland. The fair value of debt and equity securities is determined based on quoted prices in active markets for identical assets and is subject to interest rate risk. We manage our risk by having a diversified portfolio. See Note 11 to the consolidated financial statements for further discussion on the pension assets.
44
Item 8. | Financial Statements and Supplementary Data |
Our consolidated financial statements and notes thereto appear on pages 47 to 77 of this Annual Report on Form 10-K.
MAXWELL TECHNOLOGIES, INC.
INDEX TO CONSOLIDATED FINANCIAL STATEMENTS
Page | |
Financial Statement Schedule: | |
45
REPORT OF INDEPENDENT REGISTERED PUBLIC ACCOUNTING FIRM
To the Board of Directors and Stockholders
Maxwell Technologies, Inc.
San Diego, California
We have audited the accompanying consolidated balance sheets of Maxwell Technologies, Inc. as of December 31, 2014 and 2013, and the related consolidated statements of operations, comprehensive income (loss), stockholders’ equity and cash flows for each of the three years in the period ended December 31, 2014. In connection with our audits of the financial statements, we have also audited the financial statement schedule listed in the accompanying index. These financial statements and schedule are the responsibility of the Company’s management. Our responsibility is to express an opinion on these financial statements and schedule based on our audits.
We conducted our audits in accordance with the standards of the Public Company Accounting Oversight Board (United States). Those standards require that we plan and perform the audit to obtain reasonable assurance about whether the financial statements are free of material misstatement. An audit includes examining, on a test basis, evidence supporting the amounts and disclosures in the financial statements, assessing the accounting principles used and significant estimates made by management, as well as evaluating the overall presentation of the financial statements and schedule. We believe that our audits provide a reasonable basis for our opinion.
In our opinion, the consolidated financial statements referred to above present fairly, in all material respects, the financial position of Maxwell Technologies, Inc. as of December 31, 2014 and 2013, and the results of its operations and its cash flows for each of the three years in the period ended December 31, 2014, in conformity with accounting principles generally accepted in the United States of America. Also, in our opinion, the related financial statement schedule, when considered in relation to the basic consolidated financial statements taken as a whole, presents fairly in all material respects the information set forth therein.
We also have audited, in accordance with the standards of the Public Company Accounting Oversight Board (United States), Maxwell Technologies, Inc.’s internal control over financial reporting as of December 31, 2014, based on criteria established in Internal Control—Integrated Framework (2013) issued by the Committee of Sponsoring Organizations of the Treadway Commission (COSO), and our report dated February 12, 2015 expressed an unqualified opinion thereon.
/s/ BDO USA, LLP
San Diego, California
February 12, 2015
46
MAXWELL TECHNOLOGIES, INC.
CONSOLIDATED BALANCE SHEETS
(in thousands, except per share data)
December 31, | ||||||||
2014 | 2013 | |||||||
ASSETS | ||||||||
Current assets: | ||||||||
Cash and cash equivalents | $ | 24,732 | $ | 30,647 | ||||
Trade and other accounts receivable, net of allowance for doubtful accounts of $143 and $134 at December 31, 2014 and 2013, respectively | 43,698 | 29,869 | ||||||
Inventories, net | 44,856 | 44,736 | ||||||
Prepaid expenses and other current assets | 2,426 | 2,314 | ||||||
Total current assets | 115,712 | 107,566 | ||||||
Property and equipment, net | 39,223 | 44,941 | ||||||
Goodwill | 23,599 | 25,978 | ||||||
Pension asset | 7,362 | 10,568 | ||||||
Other non-current assets | 704 | 1,034 | ||||||
Total assets | $ | 186,600 | $ | 190,087 | ||||
LIABILITIES AND STOCKHOLDERS’ EQUITY | ||||||||
Current liabilities: | ||||||||
Accounts payable and accrued liabilities | $ | 27,011 | $ | 25,616 | ||||
Accrued employee compensation | 9,348 | 8,788 | ||||||
Deferred revenue and customer deposits | 703 | 1,043 | ||||||
Short-term borrowings and current portion of long-term debt | 15,549 | 7,914 | ||||||
Deferred tax liability | 1,111 | 890 | ||||||
Total current liabilities | 53,722 | 44,251 | ||||||
Deferred tax liability, long-term | 3,304 | 2,125 | ||||||
Long-term debt, excluding current portion | 20 | 100 | ||||||
Other long-term liabilities | 2,601 | 3,401 | ||||||
Total liabilities | 59,647 | 49,877 | ||||||
Commitments and contingencies (Note 10 and Note 12) | ||||||||
Stockholders’ equity: | ||||||||
Common stock, $0.10 par value per share, 40,000 shares authorized; 29,846 and 29,563 shares issued and outstanding at December 31, 2014 and 2013, respectively | 2,982 | 2,953 | ||||||
Additional paid-in capital | 277,314 | 271,928 | ||||||
Accumulated deficit | (158,066 | ) | (151,794 | ) | ||||
Accumulated other comprehensive income | 4,723 | 17,123 | ||||||
Total stockholders’ equity | 126,953 | 140,210 | ||||||
Total liabilities and stockholders’ equity | $ | 186,600 | $ | 190,087 | ||||
The accompanying notes are an integral part of these consolidated financial statements.
47
MAXWELL TECHNOLOGIES, INC.
CONSOLIDATED STATEMENTS OF OPERATIONS
(in thousands, except per share data)
Years Ended December 31, | ||||||||||||
2014 | 2013 | 2012 | ||||||||||
Revenue | $ | 186,586 | $ | 193,534 | $ | 159,258 | ||||||
Cost of revenue | 118,146 | 118,241 | 94,206 | |||||||||
Gross profit | 68,440 | 75,293 | 65,052 | |||||||||
Operating expenses: | ||||||||||||
Selling, general and administrative | 43,857 | 44,195 | 33,656 | |||||||||
Research and development | 26,320 | 22,542 | 21,700 | |||||||||
Total operating expenses | 70,177 | 66,737 | 55,356 | |||||||||
Income (loss) from operations | (1,737 | ) | 8,556 | 9,696 | ||||||||
Interest expense, net | 169 | 4 | 116 | |||||||||
Amortization of debt discount and prepaid debt costs | 20 | 60 | 57 | |||||||||
Income (loss) from operations before income taxes | (1,926 | ) | 8,492 | 9,523 | ||||||||
Income tax provision | 4,346 | 2,152 | 2,349 | |||||||||
Net income (loss) | $ | (6,272 | ) | $ | 6,340 | $ | 7,174 | |||||
Net income (loss) per share: | ||||||||||||
Basic | $ | (0.21 | ) | $ | 0.22 | $ | 0.25 | |||||
Diluted | $ | (0.21 | ) | $ | 0.22 | $ | 0.25 | |||||
Weighted average common shares outstanding: | ||||||||||||
Basic | 29,216 | 28,869 | 28,568 | |||||||||
Diluted | 29,216 | 28,903 | 28,709 | |||||||||
The accompanying notes are an integral part of these consolidated financial statements.
48
MAXWELL TECHNOLOGIES, INC.
CONSOLIDATED STATEMENTS OF COMPREHENSIVE INCOME (LOSS)
(in thousands)
Years Ended December 31, | |||||||||||||
2014 | 2013 | 2012 | |||||||||||
Net income (loss) | $ | (6,272 | ) | $ | 6,340 | $ | 7,174 | ||||||
Other comprehensive income (loss), net of tax: | |||||||||||||
Foreign currency translation adjustment | (10,445 | ) | 2,428 | 1,796 | |||||||||
Defined benefit pension plan, net of tax: | |||||||||||||
Actuarial gain (loss) on benefit obligation and plan assets, net of tax benefit of $922, tax provision of $597 and tax benefit of $39 for the years ended December 31, 2014, 2013 and 2012, respectively | (2,358 | ) | 2,785 | (352 | ) | ||||||||
Amortization of deferred loss, net of tax benefit of $32 and $26 for the years ended December 31, 2013 and 2012, respectively | — | 148 | 190 | ||||||||||
Amortization of prior service cost, net of tax benefit of $39, $8 and $5 for the years ended December 31, 2014, 2013 and 2012, respectively | 101 | 36 | 39 | ||||||||||
Settlements and plan changes, net of tax provision of $118, tax benefit of $173 and tax provision of $30 for the years ended December 31, 2014, 2013 and 2012, respectively | 302 | (805 | ) | 228 | |||||||||
Other comprehensive income (loss), net of tax | (12,400 | ) | 4,592 | 1,901 | |||||||||
Comprehensive income (loss) | $ | (18,672 | ) | $ | 10,932 | $ | 9,075 | ||||||
The accompanying notes are an integral part of these consolidated financial statements.
49
MAXWELL TECHNOLOGIES, INC.
CONSOLIDATED STATEMENTS OF STOCKHOLDERS’ EQUITY
(in thousands)
Shares | Amount | Additional Paid-in Capital | Accumulated Deficit | Accumulated Other Comprehensive Income | Total Stockholders’ Equity | ||||||||||||||||||
Balance at December 31, 2011 | 28,174 | $ | 2,815 | $ | 252,907 | $ | (165,308 | ) | $ | 10,630 | $ | 101,044 | |||||||||||
Common stock issued under employee benefit plans | 227 | 22 | 1,740 | — | — | 1,762 | |||||||||||||||||
Share-based compensation | 204 | 20 | 3,068 | — | — | 3,088 | |||||||||||||||||
Proceeds from issuance of common stock, net | 573 | 57 | 10,226 | — | — | 10,283 | |||||||||||||||||
Repurchase and cancellation of shares | (16 | ) | (1 | ) | (318 | ) | — | — | (319 | ) | |||||||||||||
Net income | — | — | — | 7,174 | — | 7,174 | |||||||||||||||||
Foreign currency translation adjustments | — | — | — | — | 1,796 | 1,796 | |||||||||||||||||
Pension adjustment, net of tax provision of $22 | — | — | — | — | 105 | 105 | |||||||||||||||||
Balance at December 31, 2012 | 29,162 | 2,913 | 267,623 | (158,134 | ) | 12,531 | 124,933 | ||||||||||||||||
Common stock issued under employee benefit plans | 67 | 7 | 405 | — | — | 412 | |||||||||||||||||
Share-based compensation | 359 | 36 | 3,944 | — | — | 3,980 | |||||||||||||||||
Repurchase and cancellation of shares | (25 | ) | (3 | ) | (44 | ) | — | — | (47 | ) | |||||||||||||
Net income | — | — | — | 6,340 | — | 6,340 | |||||||||||||||||
Foreign currency translation adjustments | — | — | — | — | 2,428 | 2,428 | |||||||||||||||||
Pension adjustment, net of tax provision of $464 | — | — | — | — | 2,164 | 2,164 | |||||||||||||||||
Balance at December 31, 2013 | 29,563 | 2,953 | 271,928 | (151,794 | ) | 17,123 | 140,210 | ||||||||||||||||
Common stock issued under employee benefit plans | 175 | 18 | 1,432 | — | — | 1,450 | |||||||||||||||||
Share-based compensation | 312 | 31 | 3,933 | — | — | 3,964 | |||||||||||||||||
Repurchase and cancellation of shares | (204 | ) | (20 | ) | 21 | — | — | 1 | |||||||||||||||
Net loss | — | — | — | (6,272 | ) | — | (6,272 | ) | |||||||||||||||
Foreign currency translation adjustments | — | — | — | — | (10,445 | ) | (10,445 | ) | |||||||||||||||
Pension adjustment, net of tax benefit of $765 | — | — | — | — | (1,955 | ) | (1,955 | ) | |||||||||||||||
Balance at December 31, 2014 | 29,846 | $ | 2,982 | $ | 277,314 | $ | (158,066 | ) | $ | 4,723 | $ | 126,953 | |||||||||||
The accompanying notes are an integral part of these consolidated financial statements.
50
MAXWELL TECHNOLOGIES, INC.
CONSOLIDATED STATEMENTS OF CASH FLOWS
(in thousands)
Years Ended December 31, | ||||||||||||
2014 | 2013 | 2012 | ||||||||||
Operating activities: | ||||||||||||
Net income (loss) | $ | (6,272 | ) | $ | 6,340 | $ | 7,174 | |||||
Adjustments to reconcile net income (loss) to net cash from operating activities: | ||||||||||||
Depreciation | 11,159 | 8,880 | 7,051 | |||||||||
Amortization of intangible assets | 203 | 299 | 441 | |||||||||
Amortization of debt discount and prepaid debt costs | 20 | 60 | 57 | |||||||||
Pension cost | 319 | 20 | 437 | |||||||||
Stock-based compensation expense | 3,967 | 3,980 | 3,088 | |||||||||
Gain on foreign currency exchange rates | (2,126 | ) | — | — | ||||||||
Provision for (recovery of) losses on accounts receivable | 20 | (35 | ) | (245 | ) | |||||||
Provision for (recovery of) losses on inventory | 910 | 1,622 | (1,335 | ) | ||||||||
Provision for warranties | 717 | — | — | |||||||||
Changes in operating assets and liabilities: | ||||||||||||
Trade and other accounts receivable | (15,100 | ) | 3,729 | (4,914 | ) | |||||||
Inventories | (1,520 | ) | (4,568 | ) | (6,955 | ) | ||||||
Prepaid expenses and other assets | (99 | ) | 129 | 333 | ||||||||
Pension asset | (724 | ) | — | — | ||||||||
Deferred tax liability, long term | 2,250 | 994 | 550 | |||||||||
Accounts payable and accrued liabilities | 144 | (2,559 | ) | (8,500 | ) | |||||||
Deferred revenue and customer deposits | 46 | (5,365 | ) | 5,378 | ||||||||
Accrued employee compensation | 651 | 4,018 | (1,699 | ) | ||||||||
Other long-term liabilities | (728 | ) | 2,347 | (2,007 | ) | |||||||
Net cash provided by (used in) operating activities | (6,163 | ) | 19,891 | (1,146 | ) | |||||||
Investing activities: | ||||||||||||
Purchases of property and equipment | (6,975 | ) | (16,850 | ) | (15,200 | ) | ||||||
Net cash used in investing activities | (6,975 | ) | (16,850 | ) | (15,200 | ) | ||||||
Financing activities: | ||||||||||||
Principal payments on long-term debt and short-term borrowings | (7,164 | ) | (10,430 | ) | (9,638 | ) | ||||||
Proceeds from long-term and short-term borrowings | 15,279 | 8,709 | 13,481 | |||||||||
Repurchase of shares | — | (47 | ) | (319 | ) | |||||||
Proceeds from issuance of common stock under equity compensation plans | 1,448 | 412 | 1,762 | |||||||||
Proceeds from issuance of common stock under secondary security offering | — | — | 10,283 | |||||||||
Net cash provided by (used in) financing activities | 9,563 | (1,356 | ) | 15,569 | ||||||||
Increase (decrease) in cash and cash equivalents from operations | (3,575 | ) | 1,685 | (777 | ) | |||||||
Effect of exchange rate changes on cash and cash equivalents | (2,340 | ) | 223 | 227 | ||||||||
Increase (decrease) in cash and cash equivalents | (5,915 | ) | 1,908 | (550 | ) | |||||||
Cash and cash equivalents at beginning of year | 30,647 | 28,739 | 29,289 | |||||||||
Cash and cash equivalents at end of year | $ | 24,732 | $ | 30,647 | $ | 28,739 | ||||||
Cash paid for: | ||||||||||||
Interest | $ | 223 | $ | 190 | $ | 174 | ||||||
Income taxes | $ | 3,304 | $ | 1,950 | $ | 1,594 | ||||||
Supplemental schedule of noncash investing and financing activities: | ||||||||||||
Purchases of property and equipment included in accounts payable and accrued liabilities | $ | 889 | $ | 575 | $ | 593 | ||||||
The accompanying notes are an integral part of these consolidated financial statements.
51
MAXWELL TECHNOLOGIES, INC.
NOTES TO CONSOLIDATED FINANCIAL STATEMENTS
Unless the context otherwise requires, all references to “Maxwell,” the “Company,” “we,” “us,” and “our” refer to Maxwell Technologies, Inc. and its subsidiaries, and all references to “Maxwell SA” refer to our Swiss Subsidiary, Maxwell Technologies, SA.
Note 1—Description of Business and Summary of Significant Accounting Policies
Description of Business
Maxwell Technologies, Inc. is a Delaware corporation originally incorporated in 1965 under the name Maxwell Laboratories, Inc. In 1983, the Company completed an initial public offering, and in 1996, changed its name to Maxwell Technologies, Inc. The Company is headquartered in San Diego, California, has three manufacturing facilities located in San Diego, California; Rossens, Switzerland; and Peoria, Arizona. In addition, the Company has two contract manufacturers located in China. Maxwell operates as single operating segment, which is comprised of three product lines:
• | Ultracapacitors: Our primary focus, ultracapacitors, are energy storage devices that possess a unique combination of high power density, extremely long operational life and the ability to charge and discharge very rapidly. Our ultracapacitor cells and multi-cell packs and modules provide highly reliable energy storage and power delivery solutions for applications in multiple industries, including transportation, automotive, information technology, renewable energy and industrial electronics. |
• | High-Voltage Capacitors: Our CONDIS® high-voltage capacitors are designed and manufactured to perform reliably for decades in all climates. These products include grading and coupling capacitors and electronic voltage transformers that are used to ensure the safety and reliability of electric utility infrastructure and other applications involving transport, distribution and measurement of high-voltage electrical energy. |
• | Radiation-Hardened Microelectronic Products: Our radiation-hardened microelectronic products for satellites and spacecraft include single board computers and components, such as high-density memory and data conversion modules. Many of these products incorporate our proprietary RADPAK® packaging and shielding technology and novel architectures that enable them to withstand the effects of environmental radiation and perform reliably in space. |
The Company’s products are designed and manufactured to perform reliably for the life of the products and systems into which they are integrated. The Company achieves high reliability through the application of proprietary technologies and rigorously controlled design, development, manufacturing and test processes.
Financial Statement Presentation
The accompanying consolidated financial statements include the accounts of Maxwell Technologies, Inc. and its subsidiaries and have been prepared in accordance with accounting principles generally accepted in the United States (“U.S. GAAP”). All intercompany transactions and account balances have been eliminated in consolidation.
Liquidity
As of December 31, 2014, the Company had approximately $24.7 million in cash and cash equivalents. Management believes the available cash balance will be sufficient to fund its operations, obligations as they become due, and capital investments for at least the next twelve months.
Reclassifications
Certain prior period amounts in the consolidated balance sheets have been reclassified to conform to the current period presentation. These reclassifications include combining amounts that previously were separately disclosed as intangible assets, net with other non-current assets and amounts separately disclosed as accrued warranty with accounts payable and accrued liabilities. These reclassifications do not impact reported net income (loss) and do not otherwise have a material impact on the presentation of the overall financial statements.
Use of Estimates
The preparation of financial statements in conformity with accounting principles generally accepted in the United States of America requires management to make estimates and assumptions that affect reported amounts and related disclosures.
52
These estimates include, but are not limited to, assessing the collectability of accounts receivable, applied and unapplied production costs, production capacities, the usage and recoverability of inventories and long-lived assets, including deferred income taxes, the incurrence of warranty obligations, impairment of goodwill and other intangible assets, estimation of the cost to complete certain projects, accruals for estimated losses from legal matters, and estimation of the value of stock-based compensation awards, including the probability that the performance criteria of restricted stock awards will be met.
Revenue Recognition
Revenue is derived primarily from the sale of manufactured products directly to customers. Product revenue is recognized, according to the guidelines of the Securities and Exchange Commission (“SEC”) Staff Accounting Bulletin (“SAB”) Numbers 101, Revenue Recognition in Financial Statements, and 104, Revenue Recognition, when all of the following criteria are met: (1) persuasive evidence of an arrangement exists (upon contract signing or receipt of an authorized purchase order from a customer); (2) title passes to the customer at either shipment from the Company’s facilities or receipt at the customer facility, depending on shipping terms; (3) customer payment is deemed fixed or determinable and free of contingencies or significant uncertainties; and (4) collectability is reasonably assured. This policy has been consistently applied from period to period.
Beginning in the fourth quarter of 2011, for three distributors of the Company's products, the Company offered extended payment terms which allowed these distributors to pay the Company after they received payment from their customer, with respect to certain sales transactions. Also beginning in the fourth quarter of 2011, for one other distributor of the Company's products, the Company offered return rights and profit margin protection with respect to certain sales transactions. Therefore, for these four distributors, the Company determined that the revenue recognition criteria of SAB 101 and 104 were not met at the time of shipment, as there was no fixed or determinable price, nor was collection reasonably assured, at least with respect to certain sales transactions. As a result, for the three distributors provided with extended payment terms, which did not provide for a fixed or determinable price, the Company deferred the recognition of revenue on all sales beginning in the fourth quarter of 2011 to the period in which cash is received. For the one distributor provided with return rights and profit margin protection, for which the Company could not estimate exposure, the Company deferred the recognition of revenue on all sales beginning in the fourth quarter of 2011 until the distributor confirmed to the Company that it was not entitled to any further returns or credits. During the third quarter of 2013, this distributor confirmed to the Company that it was not entitled to any further returns or credits, therefore, previously unrecognized revenue related to this distributor was recognized in the quarter ended September 30, 2013. Although the Company had deferred revenue recognition for a significant amount of sales to these four distributors through the quarter ended September 30, 2013, subsequent to this date the amount of deferred revenue related to these distributors has been insignificant.
In addition to the deferred revenue arrangements discussed in the preceding paragraph, revenue is not recognized for sales that do not meet the revenue recognition criteria at the time of sale. Revenue is recognized once all of the criteria for revenue recognition are determined to have been met. For example, if the Company does not believe that collection of the sales price is reasonably assured at the time of sale, it defers revenue recognition until cash is received.
As of December 31, 2014 and December 31, 2013, cumulative sales totaling $445,000 and $4.5 million, respectively, had not yet been recognized as revenue. The Company has recorded the cost basis of inventory shipped to customers prior to the achievement of the revenue recognition criteria of approximately $184,000 and $2.5 million at December 31, 2014 and 2013, respectively, in "inventory" in the consolidated balance sheets.
If the Company receives cash payment from the customer prior to the achievement of the revenue recognition criteria, the amount received from the customer is recorded as deferred revenue in the consolidated balance sheets. Total deferred revenue and customer deposits in the consolidated balance sheets as of December 31, 2014 and 2013 of $703,000 and $1.0 million, respectively, relates to cash received from customers on sales for which the revenue recognition criteria had not been achieved, customer advances, as well as other less significant customer arrangements requiring the deferral of revenue.
Cash and Cash Equivalents
The Company invests its excess cash in debt instruments of the U.S. Government and its agencies, bank certificates of deposit, commercial paper and high-quality corporate issuers. All highly liquid instruments with an original maturity of three months or less from purchase are considered cash equivalents.
Accounts Receivable and Allowance for Doubtful Accounts
Trade receivables are stated at gross invoiced amount less an allowance for uncollectible accounts. The allowance for doubtful accounts reflects management’s best estimate of probable losses inherent in the accounts receivable balance.
53
Management determines the allowance for doubtful accounts based on known troubled accounts, historical experience and other currently available evidence.
Inventories, net
Inventories are stated at the lower of cost (first-in first-out basis) or market. Finished goods and work-in-process inventory values include the cost of raw materials, labor and manufacturing overhead. Consigned inventory includes finished goods delivered to customers for which the related sale has not met the revenue recognition criteria and revenue has not been recognized. Inventory when written down to market value establishes a new cost basis and its value is not subsequently increased based upon changes in underlying facts and circumstances. The Company makes adjustments to reduce the cost of inventory to its net realizable value, if required, for estimated excess or obsolete inventories. Factors influencing these adjustments include inventories on-hand compared with historical and estimated future sales for existing and new products and assumptions about the likelihood of obsolescence. Unabsorbed costs are treated as expense in the period incurred.
Property and Equipment
Property and equipment are carried at cost and are depreciated using the straight-line method. Depreciation is provided over the estimated useful lives of the related assets (three to ten years). Leasehold improvements are depreciated over the shorter of their estimated useful life or the term of the lease. Leasehold improvements funded by landlords are recorded as property and equipment, which is depreciated over the shorter of the estimated useful life of the asset or the lease term, and deferred rent, which is amortized over the lease term. As of December 31, 2014 and 2013, the net book value of leasehold improvements funded by landlords was $2.5 million and $2.7 million, respectively. As of December 31, 2014 and 2013, the unamortized balance of deferred rent related to landlord funding of leasehold improvements was $2.7 million, which is included in "accounts payable and accrued liabilities" and "other long-term liabilities" in the consolidated balance sheets.
Goodwill
Goodwill, which represents the excess of the cost of an acquired business over the net fair value assigned to its assets and liabilities, is not amortized. Instead, goodwill is assessed for impairment under the Intangibles—Goodwill and Other Topic of the FASB ASC. The Company has established December 31 as the annual impairment test date. The Company first makes a qualitative assessment as to whether goodwill is impaired and if it is more likely than not that goodwill is impaired, the Company performs a two-step quantitative impairment analysis to determine if goodwill is impaired. The Company may also determine to skip the qualitative assessment in any year and move directly to the quantitative test. No impairments of goodwill were reported during the years ended December 31, 2014, 2013 and 2012.
Impairment of Long-Lived Assets
Property and equipment are reviewed for impairment whenever events or changes in circumstances indicate the carrying value of the assets may not be recoverable. If the Company determines that the carrying value of the asset is not recoverable, a permanent impairment charge is recorded for the amount by which the carrying value of the long-lived asset exceeds its fair value. No impairments of property and equipment were recorded during the years ended December 31, 2014, 2013 and 2012.
Warranty Obligation
The Company provides warranties on all product sales. The majority of the Company’s warranties are for one to four years in the normal course of business. The Company accrues for the estimated warranty costs at the time of sale based on historical warranty experience plus any known or expected changes in warranty exposure. As of December 31, 2014 and 2013, the accrued warranty liability included in "accounts payable and accrued liabilities" in the consolidated balance sheets was $716,000 and $180,000, respectively.
Income Taxes
Deferred income taxes are provided on a liability method in accordance with the Income Taxes Topic of the FASB ASC, whereby deferred tax assets are recognized for deductible temporary differences and deferred tax liabilities are recognized for taxable temporary differences. Under this method, deferred income taxes are recorded to reflect the tax consequences on future years of temporary differences between the tax basis of assets and liabilities and their reported amounts at each period end. If it is more likely than not that some portion or all of a deferred tax asset will not be realized, a valuation allowance is recognized. The guidance also provides criteria for the recognition, measurement, presentation and disclosures of uncertain tax positions. A tax benefit from an uncertain tax position may be recognized if it is “more likely than not” that the position is sustainable based solely on its technical merits.
54
Concentration of Credit Risk
The Company maintains cash balances at various financial institutions primarily in California and in Switzerland. In California, cash balances commonly exceed the $250,000 Federal Deposit Insurance Corporation insurance limit. In Switzerland, the banks where the Company has cash deposits are either government-owned, or in the case of cash deposited with non-government banks, deposits are insured up to 100,000 Swiss Francs. The Company has not experienced any losses in such accounts and management believes that the Company is not exposed to any significant credit risk with respect to such cash and cash equivalents.
Financial instruments, which subject the Company to potential concentrations of credit risk, consist principally of the Company’s accounts receivable. The Company’s accounts receivable result from product sales to customers in various industries and in various geographical areas, both domestic and foreign. The Company performs credit evaluations of its customers and generally requires no collateral. One customer, Shenzhen Xinlikang Supply China Management Co. LTD., accounted for 20% of total revenues in 2014, 22% of total revenues in 2013, and 18% of total revenues in 2012. There were no customers that accounted for more than 10% of accounts receivable as of December 31, 2014. Two customers, Shenzhen Xinlikang Supply China Management Co. LTD and Continental Automotive Hungary Kft., accounted for 13% and 11%, respectively, of total accounts receivable as of December 31, 2013.
Research and Development Expense
Research and development expenditures are expensed in the period incurred. Third-party funding of research and development expense under cost-sharing arrangements is recorded as an offset to research and development expense in the period the expenses are incurred. Research and development expense was $26.3 million, $22.5 million and $21.7 million, net of third-party funding under cost-sharing arrangements of $1.0 million, $1.3 million and $1.9 million, for the years ended December 31, 2014, 2013 and 2012, respectively.
Advertising Expense
Advertising costs are expensed in the period incurred. Advertising expense was $1.4 million, $884,000 and $1.2 million for the years ended December 31, 2014, 2013 and 2012, respectively.
Shipping and Handling Expense
The Company recognizes shipping and handling expenses as a component of cost of revenue. Total shipping and handling expense included in cost of revenue was $1.5 million, $1.3 million, and $1.4 million for the years ended December 31, 2014, 2013 and 2012, respectively.
Foreign Currencies
The Company’s primary foreign currency exposure is related to its subsidiary in Switzerland, which has Euro and local currency (Swiss Franc) revenue and operating expenses, and local currency loans. Changes in these currency exchange rates impact the reported U.S. dollar amount of revenue, expenses and debt. The functional currency of the Swiss subsidiary is the Swiss Franc. Assets and liabilities of the Swiss subsidiary are translated at month-end exchange rates, and revenues, expenses, gains and losses are translated at rates of exchange that approximate the rate in effect at the time of the transaction. Any translation adjustments resulting from this process are presented separately as a component of accumulated other comprehensive income within stockholders’ equity in the consolidated balance sheets. Foreign currency transaction gains and losses are reported in "cost of revenue" and "selling, general and administrative" expense in the consolidated statements of operations.
Foreign Currency Derivative Instruments
As part of its risk management strategy, the Company uses forward contracts to hedge certain foreign currency exposures. The Company's objective is to partially offset gains or losses resulting from these exposures with opposing gains or losses on the forward contracts, thereby reducing volatility of earnings created by these foreign currency exposures. In accordance with the Derivatives and Hedging Topic of the FASB ASC, the fair values of the forward contracts are estimated at each period end based on quoted market prices and are recorded as a net asset or liability on the consolidated balance sheets. Any gains or losses recognized on these contracts are recorded in “cost of revenue” and “selling, general and administrative” expense in the consolidated statements of operations.
55
Net Income (Loss) per Share
In accordance with the Earnings Per Share Topic of the FASB ASC, basic net income (loss) per share is calculated using the weighted average number of common shares outstanding during the period. Diluted net income per share includes the impact of additional common shares that would have been outstanding if dilutive potential common shares were issued. Potentially dilutive securities are not considered in the calculation of diluted net loss per share, as their inclusion would be anti-dilutive. The following table sets forth the computation of basic and diluted net income (loss) per share (in thousands, except per share data):
Years Ended December 31, | ||||||||||||
2014 | 2013 | 2012 | ||||||||||
Numerator | ||||||||||||
Net income (loss) | $ | (6,272 | ) | $ | 6,340 | $ | 7,174 | |||||
Denominator | ||||||||||||
Weighted average common shares outstanding | 29,216 | 28,869 | 28,568 | |||||||||
Effect of potentially dilutive securities | ||||||||||||
Options to purchase common stock | — | 16 | 115 | |||||||||
Restricted stock awards | — | 3 | 10 | |||||||||
Restricted stock unit awards | — | 14 | 2 | |||||||||
Employee stock purchase plan | — | 1 | 14 | |||||||||
Weighted average common shares outstanding, assuming dilution | 29,216 | 28,903 | 28,709 | |||||||||
Net income (loss) per share | ||||||||||||
Basic | $ | (0.21 | ) | $ | 0.22 | $ | 0.25 | |||||
Diluted | $ | (0.21 | ) | $ | 0.22 | $ | 0.25 | |||||
The following table summarizes instruments that may be convertible into common shares that are not included in the denominator used in the diluted net income (loss) per share calculation because to do so would be anti-dilutive (in thousands):
Common Stock | 2014 | 2013 | 2012 | ||||||
Outstanding options to purchase common stock | 672 | 790 | 504 | ||||||
Unvested restricted stock awards | 528 | 424 | 319 | ||||||
Unvested restricted stock unit awards | 224 | — | 20 | ||||||
Employee stock purchase plan awards | 9 | 1 | — | ||||||
Stock-Based Compensation
The Company has issued stock-based compensation awards to its employees and non-employee directors, including stock options, restricted stock, restricted stock units, and shares under an employee stock purchase plan. The Company records compensation expense for stock-based awards in accordance with the criteria set forth in the Stock Compensation Subtopic of the FASB ASC. Although the Company has not granted stock options since 2013, the Company used the Black-Scholes option pricing model to estimate the fair value of historical stock option grants. The determination of the fair value of stock options utilizing the Black-Scholes model was affected by the Company’s stock price and a number of assumptions, including expected volatility, expected term, risk-free interest rate and expected dividends.
The fair value of restricted stock and restricted stock units with service-based or performance-based vesting is based on the closing market price of the Company’s common stock on the date of grant. Compensation expense equal to the fair value of each restricted stock award is recognized ratably over the requisite service period. For restricted stock and restricted stock unit awards with vesting contingent on Company performance conditions, the Company uses the requisite service period that is most likely to occur. The requisite service period is estimated based on the expected achievement date of the performance condition. If it is unlikely that a performance condition will be achieved, no compensation expense is recognized unless is later determined that achievement of the performance condition is likely. The requisite service period may be adjusted for changes in the expected outcomes of the related performance conditions, with the impact of such changes recognized as a cumulative adjustment in the consolidated statement of operations in the period in which the expectation changes.
In 2014, the Company issued market-condition restricted stock units to certain members of executive management. Since the vesting of the market-condition restricted stock units is dependent on stock price performance, the fair values of these
56
awards were estimated using a Monte-Carlo valuation model. The determination of the fair value of market-condition restricted stock units utilizing a Monte-Carlo valuation model was affected by the Company’s stock price and a number of assumptions, including expected volatility, expected life, risk-free interest rate and expected dividends.
Share-based compensation expense recognized in the consolidated statement of operations is based on equity awards ultimately expected to vest. The FASB ASC requires forfeitures to be estimated at the time of grant and revised, if necessary, in subsequent periods with a cumulative catch up adjustment if actual forfeitures differ from those estimates. For market-condition awards, because the effect of the market-condition is reflected as a discount to the awards fair value at grant date, subsequent forfeitures do not result in a reversal of expense.
Recent Accounting Pronouncements
In May 2014, the Financial Accounting Standards Board (“FASB”) issued Accounting Standards Update ("ASU") No. 2014-09, Revenue from Contracts with Customers (“ASU 2014-09”). The standard provides companies with a single model for accounting for revenue arising from contracts with customers and supersedes current revenue recognition guidance, including industry-specific revenue guidance. The core principle of the model is to recognize revenue when control of the goods or services transfers to the customer, as opposed to recognizing revenue when the risks and rewards transfer to the customer under the existing revenue guidance. ASU 2014-09 is effective for annual reporting periods beginning after December 15, 2016. Early adoption is not permitted. The guidance permits companies to either apply the requirements retrospectively to all prior periods presented, or apply the requirements in the year of adoption, through a cumulative adjustment. The Company is in the process of evaluating the impact of adoption on its consolidated financial statements.
In August 2014, the FASB issued ASU No. 2014-15, Disclosure of Uncertainties About an Entity’s Ability to Continue as a Going Concern. The standard requires management to perform interim and annual assessments of an entity’s ability to continue as a going concern within one year of the date the financial statements are issued and provides guidance on determining when and how to disclose going concern uncertainties in the financial statements. Certain disclosures will be required if conditions give rise to substantial doubt about an entity’s ability to continue as a going concern. ASU 2014-15 applies to all entities and is effective for annual and interim reporting periods ending after December 15, 2016, with early adoption permitted. The Company does not expect that the adoption of this standard will have a material effect on its financial statements.
Business Enterprise Information
The Company operates as a single operating segment. According to the FASB ASC Topic Disclosures about Segments of an Enterprise and Related Information, operating segments are defined as components of an enterprise for which separate financial information is evaluated regularly by the chief operating decision maker ("CODM") in deciding how to allocate resources and in assessing performance. The Company’s CODM is the Chief Executive Officer who evaluates the Company’s financial information and resources and assesses performance on a consolidated basis.
57
Revenues by product line and geographic area are presented below (in thousands):
Year ending December 31, | ||||||||||||
2014 | 2013 | 2012 | ||||||||||
Revenues by product line: | ||||||||||||
Ultracapacitors | $ | 135,637 | $ | 136,277 | $ | 95,953 | ||||||
High-voltage capacitors | 40,361 | 43,339 | 45,574 | |||||||||
Microelectronic products | 10,588 | 13,918 | 17,731 | |||||||||
Total | $ | 186,586 | $ | 193,534 | $ | 159,258 | ||||||
Year ending December 31, | ||||||||||||
2014 | 2013 | 2012 | ||||||||||
Revenues from external customers located in: | ||||||||||||
China | $ | 89,143 | $ | 92,817 | $ | 74,054 | ||||||
United States | 23,758 | 29,090 | 26,473 | |||||||||
Germany | 16,384 | 25,935 | 25,119 | |||||||||
All other countries (1) | 57,301 | 45,692 | 33,612 | |||||||||
Total | $ | 186,586 | $ | 193,534 | $ | 159,258 | ||||||
_____________
(1) | Revenue from external customers located in countries included in “All other countries” do not individually comprise more than 10% of total revenues for any of the years presented. |
Long-lived assets by geographic location are as follows (in thousands):
December 31, | ||||||||||||
2014 | 2013 | 2012 | ||||||||||
Long-lived assets: | ||||||||||||
United States | $ | 28,013 | $ | 33,740 | $ | 24,239 | ||||||
China | 4,991 | 5,444 | 6,340 | |||||||||
Switzerland | 5,663 | 6,422 | 5,862 | |||||||||
Total | $ | 38,667 | $ | 45,606 | $ | 36,441 | ||||||
58
Note 2—Balance Sheet Details (in thousands):
December 31, | ||||||||
2014 | 2013 | |||||||
Inventories, net: | ||||||||
Raw material and purchased parts | $ | 23,042 | $ | 18,921 | ||||
Work-in-process | 2,522 | 2,374 | ||||||
Finished goods | 23,127 | 24,521 | ||||||
Consigned finished goods | 184 | 2,490 | ||||||
Reserves | (4,019 | ) | (3,570 | ) | ||||
Total inventories, net | $ | 44,856 | $ | 44,736 | ||||
Property and equipment, net: | ||||||||
Machinery, furniture and office equipment | $ | 72,323 | $ | 63,528 | ||||
Computer hardware and software | 12,003 | 10,672 | ||||||
Leasehold improvements | 16,661 | 10,576 | ||||||
Construction in progress | 2,715 | 15,701 | ||||||
Property and equipment, gross | 103,702 | 100,477 | ||||||
Less accumulated depreciation and amortization | (64,479 | ) | (55,536 | ) | ||||
Total property and equipment, net | $ | 39,223 | $ | 44,941 | ||||
Accounts payable and accrued liabilities: | ||||||||
Accounts payable | $ | 12,544 | $ | 15,356 | ||||
Income tax payable | 1,852 | 2,366 | ||||||
Accrued warranty | 716 | 180 | ||||||
Other accrued liabilities | 11,899 | 7,714 | ||||||
Total accounts payable and accrued liabilities | $ | 27,011 | $ | 25,616 | ||||
Foreign Currency Translation Adjustment | Defined Benefit Pension Plan | Accumulated Other Comprehensive Income | Affected Line Item in the Statement of Operations | |||||||||||
Accumulated other comprehensive income: | ||||||||||||||
Balance at December 31, 2013 | $ | 18,804 | $ | (1,681 | ) | $ | 17,123 | |||||||
Other comprehensive income before reclassification | (10,445 | ) | — | (10,445 | ) | |||||||||
Amounts reclassified from accumulated other comprehensive income (loss) | — | (1,955 | ) | (1,955 | ) | Cost of Sales, Selling, General and Administrative and Research and Development Expense | ||||||||
Net other comprehensive income for the year ended December 31, 2014 | (10,445 | ) | (1,955 | ) | (12,400 | ) | ||||||||
Balance at December 31, 2014 | $ | 8,359 | $ | (3,636 | ) | $ | 4,723 | |||||||
59
Note 3—Goodwill
The Company reviews goodwill for impairment annually according to the Intangibles—Goodwill and Other Topic of the FASB ASC. The Company makes a qualitative evaluation about the likelihood of goodwill impairment and if it concludes that it is more likely than not that the carrying amount of a reporting unit is greater than its fair value, then it will be required to perform the first step of the two-step quantitative impairment test. Otherwise, performing the two-step impairment test is unnecessary. The first step consists of estimating the fair value and comparing the estimated fair value with the carrying value of the reporting unit. If the fair value is less than the carrying value, a second step is performed to compute the amount of the impairment by determining an implied fair value of goodwill. The implied fair value of goodwill is the residual fair value derived by deducting the fair value of a reporting unit’s assets and liabilities from its estimated total fair value, which was calculated in step one. An impairment charge would represent the excess of the carrying amount of the reporting unit’s goodwill over the implied fair value of the goodwill. The guidance requires goodwill to be reviewed annually at the same time every year or when an event occurs or circumstances change such that it is reasonably possible that an impairment may exist. The Company selected December 31 as its annual testing date. As a result of the Company’s annual assessments as of December 31, 2014, 2013, and 2012, no impairment was indicated.
The change in the carrying amount of goodwill during 2013 and 2014 was as follows (in thousands):
Balance at December 31, 2012 | $ | 25,416 | |
Foreign currency translation adjustments | 562 | ||
Balance at December 31, 2013 | 25,978 | ||
Foreign currency translation adjustments | (2,379 | ) | |
Balance at December 31, 2014 | $ | 23,599 | |
Note 4—Fair Value Measurement
The Company records certain financial instruments at fair value in accordance with the Fair Value Measurements and Disclosures Topic of the FASB ASC. As of December 31, 2014, the financial instruments to which this topic applied were financial instruments for foreign currency forward contracts. As of December 31, 2014, the fair value of these foreign currency forward contracts was a liability of $1.6 million, which is recorded in “accounts payable and accrued liabilities” in the consolidated balance sheet. The fair value of these derivative instruments is measured using models following quoted market prices in active markets for identical instruments, which is a Level 2 input under the fair value hierarchy of the Fair Value Measurements and Disclosures Topic of the FASB ASC. All forward contracts as of December 31, 2014 matured on January 5, 2015 or February 3, 2015. Also see Note 6, Foreign Currency Derivative Instruments and Note 11, Pension and Other Postretirement Benefit Plans, of this Annual Report on Form 10-K, for further discussion of fair value measurements.
The carrying value of short-term and long-term borrowings approximates fair value because of the relative short maturity of these instruments and the interest rates the Company could currently obtain.
Note 5—Borrowings
Credit facility
In December 2011, the Company obtained a secured credit facility in the form of a revolving line of credit (the “Revolving Line of Credit”) and an equipment term loan (the “Equipment Term Loan”) (together, the “Credit Facility”). As amended, the Revolving Line of Credit is available up to a maximum of $10.0 million. In general, amounts borrowed under the Credit Facility are secured by a lien on all of the Company’s assets other than its intellectual property. In addition, under the credit agreement, as amended, the Company pledged 100% of its equity interests in its Swiss subsidiary. The Company has also agreed not to encumber any of its intellectual property. The agreement contains certain restrictive covenants that limit the Company’s ability to, amongst other things; (i) incur additional indebtedness or guarantees; (ii) create liens or other encumbrances on its property; (iii) enter into a merger or similar transaction; (iv) invest in another entity; (v) declare or pay dividends; and (vi) invest in fixed assets in excess of a defined dollar amount. Repayment of amounts owed pursuant to the Credit Facility may be accelerated in the event that the Company is in violation of any of the representations, warranties and covenants made in the credit agreement, including certain financial covenants. The financial covenants that the Company must meet during the term of the credit agreement, as amended, include quarterly minimum liquidity ratios, quarterly cash requirements and quarterly net loss targets. Borrowings under the Credit Facility bear interest, payable monthly, at either (i) the bank's prime rate or (ii) LIBOR plus 2.25%, at the Company's option subject to certain limitations. Further, the Company incurs an unused commitment fee, payable quarterly, equal to 0.25% per annum of the average daily unused amount of the Revolving Line of Credit.
60
The Equipment Term Loan was available to finance 80% of eligible equipment purchases made between April 1, 2011 and April 30, 2012. During this period, the Company borrowed $5.0 million under the Equipment Term Loan. During 2014, the Company borrowed $9.9 million under the Revolving Line of Credit.
As of December 31, 2013, the Company was not in compliance with the financial covenant pertaining to the quarterly EBITDA target for the quarter ended December 31, 2013. As a result of this noncompliance, borrowings outstanding under the Credit Facility were classified as a current obligation in the consolidated balance sheet as of December 31, 2013.
As of December 31, 2014, we were not in compliance with the financial covenant pertaining to the quarterly net loss target of not more than $1.0 million for the quarter ended December 31, 2014. As a result of this noncompliance, borrowings outstanding under the Credit Facility are immediately callable by the bank. The Revolving Line of Credit was otherwise scheduled to expire on February 28, 2015, and the Equipment Term Loan was scheduled to mature on April 30, 2015.
As of December 31, 2014, $9.9 million was outstanding under the Revolving Line of Credit and the applicable interest rate was LIBOR plus 3.00% (3.25% as of December 31, 2014). The amount outstanding under the Revolving Line of Credit is scheduled to be repaid by February 28, 2015. As of December 31, 2014, $559,000 was outstanding under the Equipment Term Loan and the applicable interest rate was LIBOR plus 2.25% (2.5% as of December 31, 2014). Principal and interest under the Equipment Term Loan are payable in 36 equal monthly installments such that the Equipment Term Loan is fully repaid by the maturity date of April 30, 2015, but may be prepaid in whole or in part at any time.
Short-term borrowings
Maxwell’s Swiss subsidiary, Maxwell SA, has a 3.0 million Swiss Franc-denominated (approximately $3.0 million as of December 31, 2014) short-term loan agreement with a Swiss bank, which renews semi-annually and bears interest at 1.4%. Borrowings under the short-term loan agreement are unsecured and as of December 31, 2014 and 2013, the full amount of the loan was drawn. In addition, Maxwell SA has a 2.0 million Swiss Franc-denominated (approximately $2.0 million as of December 31, 2014) credit agreement with the same Swiss bank, which renews annually and bears interest at 1.7%. Borrowings under the credit agreement are unsecured and as of December 31, 2014 and 2013, the full amount available under the credit line was drawn.
Maxwell SA also has a 1.0 million Swiss Franc-denominated (approximately $1.0 million as of December 31, 2014) credit agreement with another Swiss bank, and the available balance of the line can be withdrawn or reduced by the bank at any time. As of December 31, 2014 and 2013, no amounts were drawn under the credit line. Interest rates applicable to any draws on the line will be determined at the time of draw.
Other long-term borrowings
Maxwell SA has various financing agreements for vehicles. These agreements are for up to an original three-year repayment period with interest rates ranging from 1.9% to 5.1%. At December 31, 2014 and 2013, $82,000 and $179,000, respectively, was outstanding under these agreements.
The following table summarizes debt outstanding (in thousands):
December 31, 2014 | December 31, 2013 | |||||||
Revolving Line of Credit | $ | 9,900 | $ | — | ||||
Equipment Term Loan | $ | 559 | $ | 2,236 | ||||
Maxwell SA short-term loan | 3,017 | 3,359 | ||||||
Maxwell SA credit agreement | 2,011 | 2,240 | ||||||
Maxwell SA auto leases | 82 | 179 | ||||||
Total debt | 15,569 | 8,014 | ||||||
Less current portion | (15,549 | ) | (7,914 | ) | ||||
Total debt, excluding current portion | $ | 20 | $ | 100 | ||||
Contractually scheduled payments due on borrowings subsequent to December 31, 2014 are as follows (in thousands):
2015 | $ | 15,549 | |
2016 | 20 | ||
Total debt | $ | 15,569 | |
61
Note 6—Foreign Currency Derivative Instruments
Maxwell uses forward contracts to hedge certain monetary assets and liabilities, primarily receivables and payables, denominated in a foreign currency. The change in fair value of these instruments represents a natural hedge as gains and losses offset the changes in the fair value of the underlying monetary assets and liabilities due to movements in currency exchange rates. These contracts generally expire in one month. These contracts are considered economic hedges but are not designated as hedges under the Derivatives and Hedging Topic of the FASB ASC, therefore, the change in the fair value of the instruments is recognized currently in the consolidated statement of operations.
The net gains and losses on foreign currency forward contracts included in "cost of revenue" and "selling, general and administrative" expense in the consolidated statements of operations are as follows (in thousands):
Year Ended December 31, | ||||||||||||
2014 | 2013 | 2012 | ||||||||||
Cost of revenue | $ | 9 | $ | 27 | $ | (2 | ) | |||||
Selling, general and administrative | (5,274 | ) | 332 | 395 | ||||||||
Total gain (loss) | $ | (5,265 | ) | $ | 359 | $ | 393 | |||||
The net gains and losses on foreign currency derivative contracts were partially offset by net gains and losses on the underlying monetary assets and liabilities. Foreign currency gains and losses on those underlying monetary assets and liabilities included in "cost of revenue" and "selling, general and administrative" expense in the consolidated statements of operations are as follows (in thousands):
Year Ended December 31, | ||||||||||||
2014 | 2013 | 2012 | ||||||||||
Cost of revenue | $ | (13 | ) | $ | (24 | ) | $ | 13 | ||||
Selling, general and administrative | 4,404 | (985 | ) | (997 | ) | |||||||
Total gain (loss) | $ | 4,391 | $ | (1,009 | ) | $ | (984 | ) | ||||
As of December 31, 2014, the total notional amount of foreign currency forward contracts not designated as hedges was $54.2 million.
The following table presents gross amounts, amounts offset and net amounts presented in the consolidated balance sheets for the Company's derivative instruments measured at fair value (in thousands):
December 31, 2014 | December 31, 2013 | |||||||
Gross amounts of recognized asset (liability) | $ | (1,993 | ) | $ | 373 | |||
Gross amounts offset in the consolidated balance sheets | 350 | 9 | ||||||
Net amount of recognized asset (liability) presented in the consolidated balance sheets | $ | (1,643 | ) | $ | 382 | |||
The Company has the legal right to offset these recognized assets and liabilities upon settlement of the derivative instruments. All of the forward contracts outstanding at December 31, 2014 matured on January 5, 2015 or February 3, 2015. For additional information, refer to Note 4, Fair Value Measurements.
62
Note 7—Stock Plans
Equity Incentive Plans
The Company has two active share-based compensation plans as of December 31, 2014: the 2004 Employee Stock Purchase Plan (“ESPP”) and the 2013 Omnibus Equity Incentive Plan (the “Incentive Plan”), as approved by the stockholders. Under the Incentive Plan, incentive stock options, non-qualified stock options, restricted stock awards and restricted stock units have been granted to employees and non-employee directors. Generally, these awards vest over periods of one to four years. In addition, equity awards have been issued to senior management where vesting of the award is tied to Company performance or market conditions. The Company’s policy is to issue new shares of its common stock upon the exercise of stock options, vesting of restricted stock units or granting of restricted stock awards to employees.
The Company’s Incentive Plan currently provides for an equity incentive pool of 3,750,000 shares. Shares reserved for issuance are replenished by forfeited shares. Additionally, equity awards forfeited under the Company’s 2005 equity incentive plan and 1995 stock option plan are added to the total shares available for issuance under the Incentive Plan.
For the year ended December 31, 2014, the tax benefit associated with stock option exercises, restricted stock unit vesting, restricted stock grants, and disqualifying dispositions of both incentive stock options and stock issued under the Company’s ESPP, was approximately $2.2 million. No tax benefit was recognized in 2014, 2013 or 2012, because excess tax benefits were not realized by the Company.
Stock Options
Beginning in 2011, the Company ceased granting stock options to its employees as part of its annual equity incentive award program. However, during 2013, the Company granted a total of 175,306 stock options, of which 100,306 were one-time stock option awards to various employees. The remaining 75,000 stock options issued in 2013 related to the retention of a chief operating officer, of which 56,250 unvested options were cancelled upon his resignation in the third quarter of 2014. There were no stock options granted in 2014. The Company may determine to grant stock options in the future under the Incentive Plan.
The following table summarizes total aggregate stock option activity for the period December 31, 2013 through December 31, 2014:
Number of Shares | Weighted Average Exercise Price | Weighted Average Remaining Contractual Term (in years) | Aggregate Intrinsic Value | ||||||||||
Balance at December 31, 2013 | 862,306 | $ | 11.24 | ||||||||||
Granted | — | — | |||||||||||
Exercised | (102,795 | ) | 9.43 | ||||||||||
Canceled | (87,500 | ) | 7.55 | ||||||||||
Balance at December 31, 2014 | 672,011 | $ | 12.00 | 3.23 | $ | 315,561 | |||||||
Vested or expected to vest at December 31, 2014 | 672,011 | $ | 12.00 | 3.23 | $ | 315,561 | |||||||
Exercisable at December 31, 2014 | 672,011 | $ | 12.00 | 3.23 | $ | 315,561 | |||||||
The number of shares exercisable at December 31, 2014, 2013 and 2012 was 672,011, 759,936 and 807,146, respectively, with weighted average exercise prices of $12.00, $11.51 and $11.53, respectively.
The weighted-average grant date fair value of stock options granted during the year ended December 31, 2013 was $7.56. No stock options were granted during the years ended December 31, 2014 and 2012. The total intrinsic value of options exercised during the years ended December 31, 2014, 2013 and 2012 was $638,000, $18,000 and $1.5 million, respectively. Cash proceeds from option exercises for the year ended December 31, 2014 was $970,000.
As of December 31, 2014, there was $172,000, or $133,000 adjusted for estimated forfeitures, of total unrecognized compensation cost related to stock options. The cost is expected to be recognized over a weighted average period of less than one year.
63
Restricted Stock Awards
In the first quarter of 2011, the Company began granting restricted stock awards to its employees as part of its annual equity incentive award program, in replacement of stock options which had historically been broadly granted to employees. Generally, vesting of restricted stock awards is contingent upon a period of service, typically four years. In addition, the Company granted restricted stock awards to executive management with vesting contingent upon specified Company performance conditions. Beginning in the second quarter of 2014, the Company ceased granting restricted stock awards and began granting restricted stock unit awards to employees and executive management as part of its annual equity incentive award program.
The following table summarizes restricted stock award activity for the period December 31, 2013 through December 31, 2014 (in thousands, except for per share dollar amounts):
Nonvested Shares | Shares | Weighted Average Grant Date Fair Value | |||||
Nonvested at December 31, 2013 | 524 | $ | 12.88 | ||||
Granted | 256 | 14.21 | |||||
Vested | (136 | ) | 15.82 | ||||
Forfeited | (116 | ) | 8.31 | ||||
Nonvested at December 31, 2014 | 528 | $ | 13.77 | ||||
The weighted average grant date fair value of restricted stock awards granted during the years ended December 31, 2014, 2013 and 2012 was $14.21, $10.20 and $20.60, respectively. For the year ended December 31, 2014, the total grant date fair value of service-based restricted stock awards granted was $3.6 million. No performance-based restricted stock awards were granted in 2014.
Share awards released during the years ended December 31, 2014, 2013 and 2012 were 136,000, 98,000 and 77,000 respectively. Service-based share awards vested in 2014, 2013 and 2012 had a vest date fair value of $1.2 million, $916,000 and $1.1 million, respectively. No performance-based share awards vested in 2014, 2013 or 2012. As of December 31, 2014, there was $821,000 of unrecognized compensation cost, or $643,000 net of estimated forfeitures, related to nonvested restricted stock awards. The cost is expected to be recognized over a weighted average period of 2.2 years.
Restricted Stock Units
Non-employee director restricted stock units
Non-employee directors receive an annual restricted stock unit award (“RSU”), normally in February of each year, as partial consideration for their annual retainer compensation. These awards vest in full one year from the date of grant provided the non-employee director provides continued service.
The total grant date fair value of service-based restricted stock unit awards granted during the year ended December 31, 2014 to non-employee directors was $595,000. The weighted average grant date fair value of these restricted stock unit awards granted during the years ended December 31, 2014, 2013 and 2012 was $9.03, $10.25 and $20.65, respectively. As of December 31, 2014, there was $86,000 of unrecognized compensation cost related to nonvested restricted stock unit awards granted to non-employee directors. The Company estimates that none of these outstanding RSU awards will be forfeited. The cost is expected to be recognized over a weighted average period of 0.2 year.
Employee restricted stock units
Beginning in the second quarter of 2014, the Company ceased granting restricted stock awards and began granting restricted stock units to employees as part of its annual equity incentive award program. Each restricted stock unit represents the right to receive one unrestricted share of the Company’s common stock upon vesting. During the year ended December 31, 2014, the Company granted 193,000 restricted stock unit awards to employees of which 73,000 were service-based restricted stock units vesting in equal installments over four years of continuous service with an average grant date value of $14.81 per share, 70,000 were market-condition restricted stock units vesting upon the achievement of certain stock price thresholds and the completion of three years of continuous employment from the date of grant with an average grant date fair value of $15.03 per share, and 50,000 were performance-based restricted stock units vesting contingent upon specified Company performance conditions with an average grant date fair value of $10.85 per share. Since the vesting of the market-condition restricted stock units is dependent on stock price performance, the fair values of these awards were estimated using a Monte-Carlo valuation model with the following weighted-average assumptions:
64
Market price at grant per share | $ | 15.03 | ||
Expected dividends | $ | — | ||
Expected volatility | 65 | % | ||
Risk-free interest rate | 0.86 | % | ||
Fair value per unit | $ | 7.71 | ||
The following table summarizes the amount of compensation expense recognized for employee restricted stock unit awards for the years ended December 31, 2014. No restricted stock unit awards were granted to employees in 2013 and 2012 (in thousands):
Year Ended December 31, | ||||
2014 | ||||
Service-based restricted stock units | $ | 137 | ||
Performance-based restricted stock units | 28 | |||
Market-condition restricted stock units | 90 | |||
Total compensation expense recognized for employee restricted stock units | $ | 255 | ||
Employee Stock Purchase Plan
In 2013, the Company amended and restated the 2004 Employee Stock Purchase Plan (“ESPP”). Pursuant to the ESPP, the aggregate number of shares of common stock which may be purchased shall not exceed 1,000,000 shares of common stock of the Company. As of December 31, 2014, the Company has issued a total of 525,252 shares of common stock from the current ESPP. For the years ended December 31, 2014 and 2013, the Company issued 93,588 and 28,464 shares, respectively, under the ESPP.
The ESPP permits substantially all employees to purchase common stock through payroll deductions, at 85% of the lower of the trading price of the stock at the beginning or at the end of each six-month offering period commencing on January 1 and July 1. The number of shares purchased is based on participants’ contributions made during the offering period.
The fair value of the “look back” option for ESPP shares issued during the offering period is estimated using the Black-Scholes valuation model for a call and a put option. The share price used for the model is a 15% discount on the stock price on the first day of the offering period; the number of shares to be purchased is calculated based on employee contributions, and by using the following weighted-average assumptions:
Year Ended December 31, | ||||||||||||
2014 | 2013 | 2012 | ||||||||||
Expected dividends | $ | — | $ | — | $ | — | ||||||
Stock price on valuation date | 8.47 | 7.77 | 11.96 | |||||||||
Expected volatility | 77 | % | 46 | % | 71 | % | ||||||
Risk-free interest rate | 0.08 | % | 0.07 | % | 0.10 | % | ||||||
Expected life (in years) | 0.4 | 0.3 | 0.5 | |||||||||
Fair value per share | $ | 4.56 | $ | 2.45 | $ | 4.16 | ||||||
The intrinsic value of shares of the Company’s stock purchased pursuant to the ESPP for offering periods within the years ended December 31, 2014, 2013 and 2012 was $449,000, $33,000 and $191,000, respectively.
65
Stock-based Compensation Expense
Compensation cost for stock options, restricted stock, restricted stock units and the ESPP is as follows (in thousands):
Year Ended December 31, | ||||||||||||
2014 | 2013 | 2012 | ||||||||||
Stock options | $ | 52 | $ | 827 | $ | 978 | ||||||
Restricted stock | 2,536 | 2,491 | 1,427 | |||||||||
Restricted stock units | 867 | 592 | 421 | |||||||||
ESPP | 512 | 70 | 262 | |||||||||
Total stock-based compensation expense | $ | 3,967 | $ | 3,980 | $ | 3,088 | ||||||
Stock-based compensation cost included in cost of revenue; selling, general and administrative expense; and research and development expense is as follows (in thousands):
Year Ended December 31, | ||||||||||||
2014 | 2013 | 2012 | ||||||||||
Cost of revenue | $ | 740 | $ | 1,079 | $ | 701 | ||||||
Selling, general and administrative | 2,362 | 2,140 | 1,835 | |||||||||
Research and development | 865 | 761 | 552 | |||||||||
Total stock-based compensation expense | $ | 3,967 | $ | 3,980 | $ | 3,088 | ||||||
Share Reservations
The following table summarizes the reservation of shares under the Company's stock-based compensation plans as of December 31, 2014:
2013 Omnibus Equity Incentive Plan | 1,574,258 | |
2004 Employee Stock Purchase Plan | 474,748 | |
2005 Omnibus Equity Incentive Plan | 672,011 | |
Total | 2,721,017 | |
Note 8—Shelf Registration Statement
On June 3, 2014, the Company filed a shelf registration statement on Form S-3 with the U.S. Securities and Exchange Commission ("SEC") to, from time to time, sell up to an aggregate of $125 million of any combination of its common stock, warrants, debt securities or units. On June 30, 2014, the registration statement was declared effective by the SEC, which will allow the Company to access the capital markets for the three year period following this effective date. As of December 31, 2014, no securities have been issued under the Company's shelf registration statement. Net proceeds, terms and pricing of each offering of securities issued under the shelf registration statement will be determined at the time of such offerings.
Note 9—Income Taxes
For financial reporting purposes, net income before income taxes includes the following components (in thousands):
Years Ended December 31, | ||||||||||||
2014 | 2013 | 2012 | ||||||||||
United States | $ | (19,301 | ) | $ | (5,270 | ) | $ | (5,994 | ) | |||
Foreign | 17,375 | 13,762 | 15,517 | |||||||||
Total | $ | (1,926 | ) | $ | 8,492 | $ | 9,523 | |||||
66
The provision for income taxes based on income before income taxes is as follows (in thousands):
Years Ended December 31, | ||||||||||||
2014 | 2013 | 2012 | ||||||||||
Federal: | ||||||||||||
Current | $ | — | $ | (258 | ) | $ | (190 | ) | ||||
Deferred | (5,608 | ) | 222 | 6,873 | ||||||||
(5,608 | ) | (36 | ) | 6,683 | ||||||||
State: | ||||||||||||
Current | 6 | 6 | 7 | |||||||||
Deferred | 853 | 88 | 1,653 | |||||||||
859 | 94 | 1,660 | ||||||||||
Foreign: | ||||||||||||
Current | 2,453 | 2,022 | 2,135 | |||||||||
Deferred | 1,944 | 311 | (95 | ) | ||||||||
4,397 | 2,333 | 2,040 | ||||||||||
(Decrease) increase in valuation allowance | 4,698 | (239 | ) | (8,034 | ) | |||||||
Tax provision | $ | 4,346 | $ | 2,152 | $ | 2,349 | ||||||
The provision for income taxes in the accompanying consolidated statements of operations differs from the amount calculated by applying the statutory income tax rate to income (loss) from continuing operations before income taxes. The primary components of such difference are as follows (in thousands):
Years Ended December 31, | ||||||||||||
2014 | 2013 | 2012 | ||||||||||
Taxes at federal statutory rate | $ | (655 | ) | $ | 2,888 | $ | 3,054 | |||||
State taxes, net of federal benefit | (90 | ) | (29 | ) | (23 | ) | ||||||
Effect of tax rate differential for foreign subsidiary | (3,570 | ) | (2,531 | ) | (2,695 | ) | ||||||
Valuation allowance, including tax benefits of stock activity | 4,698 | (239 | ) | (8,034 | ) | |||||||
Foreign taxes on unremitted earnings | 1,590 | — | — | |||||||||
Stock-based compensation | 621 | 460 | 242 | |||||||||
Prior year true-up Subpart F income | — | — | 2,484 | |||||||||
Return to provision adjustments | 536 | (920 | ) | 3,568 | ||||||||
Subpart F income inclusion | 1,167 | 2,446 | 3,110 | |||||||||
Other | 49 | 77 | 643 | |||||||||
Tax provision | $ | 4,346 | $ | 2,152 | $ | 2,349 | ||||||
The Company has established a valuation allowance against its U.S. federal and state deferred tax assets due to the uncertainty surrounding the realization of such assets as evidenced by the cumulative losses from operations through December 31, 2014. Management periodically evaluates the recoverability of the deferred tax assets. At such time as it is determined that it is more likely than not that deferred assets are realizable, the valuation allowance will be reduced accordingly and recorded as a tax benefit, with the exception of $15.5 million which will impact additional paid in capital as discussed below. The Company has recorded a valuation allowance of $64.2 million as of December 31, 2014 to reflect the estimated amount of deferred tax assets that may not be realized. The Company increased its valuation allowance by $4.7 million for the year ended December 31, 2014.
At December 31, 2014, the Company has federal and state net operating loss carryforwards of approximately $157.7 million and $64.6 million, respectively. The federal tax loss carryforwards will begin to expire in 2020 and the state tax loss carryforwards will begin to expire in 2015. In addition, the Company has research and development and other tax credit carryforwards for federal and state income tax purposes as of December 31, 2014 of $5.1 million and $6.6 million, respectively. The federal credits will begin to expire in 2019 unless utilized and the state credits have an indefinite life. Pursuant to Internal Revenue Code Sections 382 and 383, use of the Company’s federal net operating loss and credit carryforwards may be limited due to a cumulative change in ownership of more than 50% within a three-year period.
Excess tax benefits associated with stock option exercises, restricted stock grants, and disqualifying dispositions of both incentive stock options and stock issued from the Company’s Employee Stock Purchase Plan in the amount of $4.1 million and
67
$3.4 million, for 2014 and 2013, respectively, did not reduce current income taxes payable and, accordingly, are not included in the deferred tax asset relating to net operating loss carryforwards, but are included with the federal and state net operating loss carryforwards disclosed in this footnote. The tax benefits associated with stock option deductions from 1998 to 2005 in the amount of $15.5 million were not recorded in additional paid-in capital because their realization was not more likely than not to occur and, consequently, a valuation allowance was recorded against the entire benefit.
The Company has been granted a tax holiday in Switzerland, which is effective as of January 1, 2012 for 10 years. The tax holiday is conditional upon the Company meeting certain employment and investment thresholds. The impact of this tax holiday decreased foreign taxes by $665,000 and $733,000 for 2014 and 2013, respectively. The benefit of the tax holiday on net income per diluted share was $0.02 and $0.03 for 2014 and 2013, respectively.
The Company records U.S. income taxes on the undistributed earnings of foreign subsidiaries unless the subsidiaries’ earnings are considered indefinitely reinvested outside of the U.S. As a result of changes in business circumstances, the Company changed its' estimate of amounts considered permanently reinvested. As a result, in 2014, the Company recorded a deferred tax liability of $1.6 million associated with $31.8 million of unremitted earnings of a foreign subsidiary that are no longer considered indefinitely reinvested. In the event that the Company repatriates these funds, this withholding tax would become payable. As of December 31, 2014, the cumulative amount of undistributed earnings considered indefinitely reinvested was $39.2 million. Determination of the amount of any unrecognized deferred income tax liability on the excess of the financial reporting basis over the tax basis of investments in foreign subsidiaries is not practicable because of the complexities of the hypothetical calculation.
Items that give rise to significant portions of the deferred tax accounts are as follows (in thousands):
December 31, | ||||||||
2014 | 2013 | |||||||
Deferred tax assets: | ||||||||
Tax loss carryforwards | $ | 54,551 | $ | 55,109 | ||||
Tax credit carryforwards | 19 | 19 | ||||||
Uniform capitalization, contract and inventory related reserves | 1,728 | 1,493 | ||||||
Accrued vacation | 669 | 632 | ||||||
Stock-based compensation | 1,428 | 1,235 | ||||||
Intangible assets | 1,364 | 1,032 | ||||||
Deferred revenue | 149 | 179 | ||||||
Unrealized gains and losses | 1,780 | — | ||||||
Other | 2,668 | 1,721 | ||||||
Total | 64,356 | 61,420 | ||||||
Deferred tax liabilities: | ||||||||
Inventory deduction | (206 | ) | (290 | ) | ||||
Pension assets | (1,476 | ) | (2,125 | ) | ||||
Allowance for doubtful accounts | (407 | ) | (405 | ) | ||||
Tax basis depreciation less book depreciation | (192 | ) | (1,989 | ) | ||||
Withholding tax on undistributed earnings of foreign subsidiary | (1,590 | ) | — | |||||
Other | (241 | ) | (1 | ) | ||||
Total | (4,112 | ) | (4,810 | ) | ||||
Net deferred tax assets before valuation allowance | 60,244 | 56,610 | ||||||
Valuation allowance | (64,199 | ) | (59,501 | ) | ||||
Net deferred tax liabilities | $ | (3,955 | ) | $ | (2,891 | ) | ||
As of December 31, 2014 and 2013, deferred tax assets of $460,000 and $124,000, respectively were included in other non-current assets in the consolidated balance sheet.
The Company adopted the provisions of section 740-10 of the Accounting for Uncertainty in Income Taxes Topic of the FASB ASC on January 1, 2007. Of the total unrecognized tax benefits at December 31, 2014, approximately $11.7 million was recorded as a reduction to deferred tax assets, which caused a corresponding reduction in the Company’s valuation allowance of $11.7 million. To the extent unrecognized tax benefits are recognized at a time when a valuation allowance does not exist, the recognition of the tax benefit would reduce the effective tax rate. The Company does not anticipate that the amount of
68
unrecognized tax benefits as of December 31, 2014 will change materially within the 12 month period following December 31, 2014.
A reconciliation of the beginning and ending amount of unrecognized tax benefits is as follows (in thousands):
Balance at December 31, 2013 | $ | 12,634 | |
Increase in current period positions | 890 | ||
Decrease in prior period positions | (1,585 | ) | |
Balance at December 31, 2014 | $ | 11,939 | |
The Company recognizes interest and penalties as a component of income tax expense. Interest and penalties for the years ended December 31, 2014 and 2013 were $34,000, and $126,000, respectively, and for the year ended December 31, 2012 interest and penalties were insignificant.
The Company’s U.S. federal income tax returns for tax years subsequent to 2009 are subject to examination by the Internal Revenue Service and its state income tax returns subsequent to 2008 are subject to examination by state tax authorities. The Company’s foreign tax returns subsequent to 2004 are subject to examination by the foreign tax authorities.
Net operating losses from years for which the statute of limitations has expired (2008 and prior for federal and 2007 and prior for state) could be adjusted in the event that the taxing jurisdictions challenge the amounts of net operating loss carryforwards from such years.
Note 10—Leases
Rental expense amounted to $5.6 million, $5.1 million and $3.7 million for the years ended December 31, 2014, 2013 and 2012, respectively, and was incurred primarily for facility leases. Future annual minimum rental commitments as of December 31, 2014 are as follows (in thousands):
Fiscal Years | |||
2015 | $ | 4,278 | |
2016 | 4,307 | ||
2017 | 3,650 | ||
2018 | 2,273 | ||
2019 | 2,298 | ||
Thereafter | 3,673 | ||
Total | $ | 20,479 | |
Note 11—Pension and Other Postretirement Benefit Plans
Foreign Plan
The Compensation—Retirement Benefits Subtopic of the FASB ASC requires balance sheet recognition of the total over funded or underfunded status of pension and postretirement benefit plans. Under the guidance, actuarial gains and losses, prior service costs or credits, and any remaining transition assets or obligations that have not been recognized under previous accounting standards must be recognized as a component of accumulated other comprehensive income within stockholders’ equity, net of tax effects, until they are amortized as a component of net periodic benefit cost (income).
The Company’s plan is regulated by the Swiss Government and is funded by the employees and the Company. The pension benefit is based on compensation, length of service and credited investment earnings. The plan guarantees both a minimum rate of return as well as minimum annuity purchase rates. The Company’s funding policy with respect to the pension plan is to contribute the amount required by Swiss law, using the required percentage applied to the employee’s compensation. In addition, participating employees are required to contribute to the pension plan. The Company made pension contributions of $720,000, $722,000 and $732,000 in 2014, 2013 and 2012, respectively; 45% of the total contributions to the plan each year are made by the employees. This plan has a measurement date of December 31. The Company does not have any rights to the assets of the plan.
The net pension asset decreased from $10.6 million to $7.4 million during the year ended December 31, 2014. The decrease in plan assets was a result of a significant number of employee departures and the corresponding benefits paid from account balances, and the effect of foreign currency translation on the fair value of the plan at year end. The increase in the
69
benefit obligation was affected by a substantial actuarial loss resulting from assumption changes made to reflect current market conditions. This loss was offset by the both the large amount of benefits paid and the effect of foreign currency translation on the projected benefit obligation at year end. The accumulated benefit obligation was approximately $31.3 million and $30.8 million as of December 31, 2014 and 2013, respectively. The plan is fully funded and continues to be in a surplus condition.
The following table reflects changes in the pension benefit obligation and plan assets for the years ended December 31, 2014 and 2013 (in thousands):
Pension Benefits | ||||||||
Years ended December 31, | ||||||||
2014 | 2013 | |||||||
Change in benefit obligation: | ||||||||
Benefit obligation at beginning of year | $ | 32,577 | $ | 29,956 | ||||
Service cost | 846 | 831 | ||||||
Interest cost | 697 | 504 | ||||||
Plan participant contributions | 593 | 602 | ||||||
Benefits paid | (3,018 | ) | (717 | ) | ||||
Actuarial loss (gain) | 4,974 | (405 | ) | |||||
Administrative expenses paid | — | 978 | ||||||
Effect of foreign currency translation | (3,663 | ) | 828 | |||||
Projected benefit obligation at end of year | 33,006 | 32,577 | ||||||
Changes in plan assets: | ||||||||
Fair value of plan assets at beginning of year | 43,145 | 36,895 | ||||||
Actual return on plan assets | 3,478 | 4,532 | ||||||
Company contributions | 720 | 722 | ||||||
Plan participant contributions | 593 | 602 | ||||||
Benefits paid | (3,018 | ) | (717 | ) | ||||
Effect of foreign currency translation | (4,550 | ) | 1,111 | |||||
Fair value of plan assets at end of year | 40,368 | 43,145 | ||||||
Funded status at end of year | $ | 7,362 | $ | 10,568 | ||||
Amounts recognized in the consolidated balance sheets consist of (in thousands):
As of December 31, | ||||||||
2014 | 2013 | |||||||
Net long-term pension asset | $ | 7,362 | $ | 10,568 | ||||
Accumulated other comprehensive loss consists of the following: | ||||||||
Net prior service cost | 853 | 865 | ||||||
Net loss | 3,897 | 1,430 | ||||||
Accumulated other comprehensive loss before taxes | $ | 4,750 | $ | 2,295 | ||||
70
The components of net periodic pension cost (income) and other amounts recognized in other comprehensive income (loss) before taxes are as follows (in thousands):
Years ended December 31, | ||||||||||||
2014 | 2013 | 2012 | ||||||||||
Components of net periodic pension cost: | ||||||||||||
Service cost | $ | 846 | $ | 831 | $ | 671 | ||||||
Interest cost | 697 | 504 | 651 | |||||||||
Expected return on plan assets | (1,784 | ) | (1,539 | ) | (1,403 | ) | ||||||
Prior service cost amortization | 140 | 44 | 44 | |||||||||
Deferred loss amortization | — | 180 | 216 | |||||||||
Settlement cost | 420 | — | 258 | |||||||||
Net periodic pension cost | $ | 319 | $ | 20 | $ | 437 | ||||||
Other amounts recognized in other comprehensive income (loss) before income taxes are as follows: | ||||||||||||
Prior service cost amortization | $ | (140 | ) | $ | (44 | ) | $ | (44 | ) | |||
Gain on value of plan assets | (1,695 | ) | (2,977 | ) | (1,268 | ) | ||||||
Actuarial (gain) loss on benefit obligation | 4,975 | (405 | ) | 1,659 | ||||||||
Plan change | — | 978 | — | |||||||||
Settlement | (420 | ) | — | (258 | ) | |||||||
Deferred loss amortization | — | (180 | ) | (216 | ) | |||||||
Total recognized in other comprehensive income (loss), before taxes | $ | 2,720 | $ | (2,628 | ) | $ | (127 | ) | ||||
Total recognized in net periodic pension cost and other comprehensive income (loss), before taxes | $ | 3,039 | $ | (2,608 | ) | $ | 310 | |||||
Assumptions used to determine the benefit obligation and net periodic pension cost are as follows:
Pension Benefits | ||||||
Years ended December 31, | ||||||
2014 | 2013 | |||||
Weighted-average assumptions used to determine benefit obligation: | ||||||
Discount rate | 1.00 | % | 2.25 | % | ||
Rate of compensation increase | 2.50 | % | 2.50 | % | ||
Measurement date | 12/31/2014 | 12/31/2013 | ||||
Weighted-average assumptions used to determine net periodic pension cost: | ||||||
Discount rate | 2.25 | % | 1.75 | % | ||
Expected long-term return on plan assets | 4.25 | % | 4.25 | % | ||
Rate of compensation increase | 2.50 | % | 2.50 | % | ||
Percentage of the fair value of total plan assets held in each major category of plan assets: | ||||||
Equity securities | 33 | % | 36 | % | ||
Debt securities | 22 | % | 21 | % | ||
Real estate | 40 | % | 40 | % | ||
Other | 5 | % | 3 | % | ||
Total | 100 | % | 100 | % | ||
The pension plan’s overall strategy and investment policy is managed by the board of the plan. The overall long-term rate is based on the target asset allocation of 15% Swiss bonds, 10% non-Swiss hedged bonds, 10% Swiss equities, 15% global equities, 40% real estate, 5% emerging market equities, 4% alternative investments and 1% cash and other short-term investments.
The 2015 expected future long-term rate of return is estimated to be 3.75%, which is based on historical asset rates of returns for each asset allocation classification at a 0.8% rate for Swiss bonds, 1.0% for hedged foreign bonds, 3.7% for real estate, 4.1% for Swiss equities, 5.5% for unhedged global equities, 5.3% unhedged emerging markets, 2.33% for alternative investments and 1.3% for cash. The 2014 expected long-term rate of return was 4.25% and was based on the historical asset
71
rates of return of 0.4% for Swiss bonds, 7.40% for unhedged emerging markets, 1.0% for hedged foreign bonds, 4.8% for real property, 5.6% for Swiss equities and 6.5% for unhedged global equities, 2.8% for alternative investments and 1.4% for cash.
Expected amortization during the year ending December 31, 2015 is as follows (in thousands): | |||
Amortization of net prior service costs | $ | 132 | |
The following benefit payments, which reflect expected future service, as appropriate, are expected to be paid (in thousands):
2015 | $ | 1,823 | |
2016 | 1,813 | ||
2017 | 1,437 | ||
2018 | 1,563 | ||
2019 | 1,342 | ||
Years 2020 through 2024 | 7,027 | ||
Total | $ | 15,005 | |
The Company expects to contribute approximately $555,000 to the pension plan in 2015.
Investment objectives:
The primary investment goal of the pension plan is to achieve a total annualized return of 3.75% over the long-term. The investments are evaluated, compared and benchmarked to plans with similar investment strategies. The plan also attempts to minimize risk by not having any single security or class of securities with a disproportionate impact on the plan. As a guideline, assets are diversified by asset classes (equity, fixed income, real estate, and alternative investments).
The fair values of the plans assets at December 31, 2014, by asset category, are as follows (in thousands):
Fair Value Measurements at | ||||||||||||||||
December 31, 2014 | ||||||||||||||||
Total | Active Market Prices (Level 1) | Significant Observable Inputs (Level 2) | Significant Unobservable Inputs (Level 3) | |||||||||||||
Asset category | ||||||||||||||||
Cash: | ||||||||||||||||
Held in Swiss Franc, Euro and USD | $ | 973 | $ | 973 | $ | — | $ | — | ||||||||
Equity securities: | ||||||||||||||||
Investment funds | 23,320 | 23,320 | — | — | ||||||||||||
Real estate investment fund | 16,049 | — | — | 16,049 | ||||||||||||
Fixed income / Bond Securities | ||||||||||||||||
Fixed income / Bond securities: | — | — | — | — | ||||||||||||
Real estate investments: | ||||||||||||||||
Real estate investment in specific properties 100% owned by the plan | — | — | — | — | ||||||||||||
Other assets (accounts receivable, assets at real estate management company) | 26 | — | 26 | — | ||||||||||||
Net assets of pension plan | $ | 40,368 | $ | 24,293 | $ | 26 | $ | 16,049 | ||||||||
Fair Value of Assets
Level 1: Observable inputs such as quoted prices in active markets for identical assets.
Level 2: Inputs other than quoted prices that are observable for the asset or liability, either directly or indirectly. These include quoted prices for similar assets or liabilities in active markets and quoted prices for identical or similar assets or liabilities in markets that are not active.
Level 3: Unobservable inputs that reflect the reporting entity’s own assumptions. These investments can include; real estate owned by the Pension Plan stated at fair market valuations provided by a third-party independent to the Plan and the
72
Company; real estate investment that has potential long term investment liquidation processes; hedge funds that might have monthly, quarterly or annual restraints on redemptions or may require advance notice for a redemption
For those financial instruments with significant Level 3 inputs, the following table summarizes the activity for the year by investment type:
Description | Real estate investments | |||
Beginning balance, December 31, 2013 | $ | 16,405 | ||
Total unrealized gains included in net gain (1) | 1,431 | |||
Foreign currency translation adjustments | (1,787 | ) | ||
Beginning balance, December 31, 2014 | $ | 16,049 | ||
_____________
(1) | Total unrealized gains are reported as a component of the pension adjustment in accumulated other comprehensive income in the consolidated statement of stockholders’ equity. |
U.S. Plan
The Company has a postretirement benefit plan covering its employees in the United States. Substantially all U.S. employees are eligible to elect coverage under a contributory employee savings plan which provides for Company matching contributions based on one-half of employee contributions up to certain plan limits. The Company’s matching contributions under this plan totaled $547,000, $506,000 and $486,000 for the years ended December 31, 2014, 2013 and 2012, respectively.
Note 12—Legal Proceedings
Although the Company expects to incur significant legal fees in connection with the below legal proceedings, the Company is unable to estimate the amount of such legal fees and therefore, such fees will be expensed in the period the legal services are performed.
FCPA Matter
As a result of being publicly traded in the U.S., the Company is subject to the U.S. Foreign Corrupt Practices Act (“FCPA”), which prohibits companies from making improper payments to foreign officials for the purpose of obtaining or retaining business. Beginning in 2009, the Company conducted an internal review into payments made to its former independent sales agent in China with respect to sales of its high-voltage capacitor products produced by its Swiss subsidiary. In January 2011, the Company reached settlements with the SEC and the U.S. Department of Justice (“DOJ”) with respect to charges asserted by the SEC and DOJ relating to the anti-bribery, books and records, internal controls, and disclosure provisions of the FCPA and other securities laws violations. The Company settled civil charges with the SEC, agreeing to an injunction against further violations of the FCPA. Under the terms of the settlement with the SEC, the Company agreed to pay a total of approximately $6.4 million in profit disgorgement and prejudgment interest. The Company settled civil and criminal charges with the DOJ by entering into a three-year deferred prosecution agreement (“DPA”) and agreeing to pay a total of $8.0 million in penalties. Further, under the terms of each agreement, the Company has submitted periodic reports to the SEC and DOJ on its internal compliance program concerning anti-bribery. As of January 25, 2013, all monetary penalties had been paid in full for each settlement described above and, in early February 2014, the DPA expired on its own terms. A judgment of dismissal was issued by the District Judge for the matter in the U.S. District Court for the Southern District of California on March 28, 2014.
On October 15, 2013, the Company received an informal notice from the DOJ that an indictment against the former Senior Vice President and General Manager of its Swiss subsidiary had been filed in the United States District Court for the Southern District of California. The indictment is against the individual, a former officer, and not against the Company and the Company does not foresee that further penalties or fines could be assessed against it as a corporate entity for this matter. However, the Company may be required throughout the term of the action to advance the legal fees and costs incurred by the individual defendant and to incur other financial obligations. While the Company maintains directors’ and officers’ insurance policies which are intended to cover legal expenses related to its indemnification obligations in situations such as these, the Company cannot determine if and to what extent the insurance policy will cover the legal fees for this matter. Accordingly, the legal fees that may be incurred by the Company in defending this former officer could have a material impact on its financial condition and results of operation.
73
Swiss Bribery Matter
In August 2013, the Company's Swiss subsidiary was served with a search warrant from the Swiss federal prosecutor’s office. At the end of the search, the Swiss federal prosecutor presented the Company with a listing of the materials gathered by the representatives and then removed the materials from its premises for keeping at the prosecutor’s office. By reviewing the items to be seized on the search warrant presented by the Swiss prosecutor’s office, the Company believes this action to be related to the same or similar facts and circumstances as the FCPA action previously settled with the SEC and the DOJ. During initial discussions, the Swiss prosecutor has acknowledged both the existence of the Company's DPA with the DOJ and its cooperation efforts thereunder, both of which should have a positive impact on discussions going forward. Additionally, other than the activities previously reviewed in conjunction with the SEC and DOJ matters under the FCPA, the Company has no reason to believe that additional facts or circumstances are under review by the Swiss authorities. At such an early stage in the investigation, the Company is currently unable to determine the extent to which it will be subject to fines in accordance with Swiss bribery laws and what additional expenses will be incurred in order to defend this matter. As such, the Company cannot determine whether there is a reasonable possibility that a loss will be incurred nor can it estimate the range of any such potential loss. Accordingly, the Company has not accrued an amount for any potential loss associated with this action, but an adverse result could have a material adverse impact on its financial condition and results of operation.
Securities Matter
In early 2013, the Company voluntarily provided information to the United States Attorney's Office for the Southern District of California and the U.S. Securities and Exchange Commission related to its announcement that it intended to file restated financial statements for fiscal years 2011 and 2012. The Company is currently cooperating with the US authorities in connection with these investigations. At this preliminary stage, the Company cannot predict the ultimate outcome of this action, nor can it estimate the range of potential loss. Accordingly, the Company has not accrued an amount for any potential loss associated with this action, but an adverse result could have a material adverse impact on its financial condition and results of operation.
Securities Class Action Matter
From March 13, 2013 through April 19, 2013, four purported shareholder class actions were filed in the United States District Court for the Southern District of California against the Company and certain of its current and former officers. These actions were entitled Foster v. Maxwell Technologies, Inc., et al., Case No. 13-cv-0580 (S.D. Cal. filed March 13, 2013), Weinstein v. Maxwell Technologies, Inc., et al., No. 13-cv-0686 (S.D. Cal. filed March 21, 2013), Abanades v. Maxwell Technologies, Inc., et al., No. 13-cv-0867 (S.D. Cal. filed April 11, 2013), and Mebarak v. Maxwell Technologies, Inc., et al., No. 13-cv-0942 (S.D. Cal. filed April 19, 2013). The complaints alleged that the defendants made false and misleading statements regarding its financial performance and business prospects and overstated the Company's reported revenue. The complaints purported to assert claims for violations of Section 10(b) and 20(a) of the Securities Exchange Act of 1934 and SEC Rule 10b-5 on behalf of all persons who purchased the Company's common stock between April 28, 2011 and March 7, 2013, inclusive. The complaints sought unspecified monetary damages and attorneys' fees and costs. On May 13, 2013, four prospective lead plaintiffs filed motions to consolidate the four actions and to be appointed lead plaintiff and, on October 24, 2013, the court issued a written order consolidating the case under the heading In re Maxwell Technologies, Inc., Securities Litigation. On January 16, 2014, the lead plaintiff filed a consolidated and amended complaint which slightly adjusted the class period to April 29, 2011 to March 19, 2013. In response, the Company and the individual defendants filed a motion to dismiss the complaint, which the lead plaintiff opposed. On May 5, 2014, the court granted the Company’s motion to dismiss but granted the lead plaintiff leave to amend its complaint. The lead plaintiff filed an amended complaint on June 4, 2014, adding an additional claim under Section 10(b) alleging that the defendants were involved in a scheme to violate federal securities laws. The Company and individual defendants filed motions to dismiss on July 10, 2014. On October 6, 2014, the parties executed a stipulation of settlement, which included an all-in settlement value of $3.3 million. On November 3, 2014, the court granted preliminary approval of the settlement. At a hearing on February 5, 2015, the court granted final approval of the settlement. Based on this settlement, the Company has an accrued liability recorded of $3.3 million, which is included in “accounts payable and accrued liabilities,” as of December 31, 2014. As the Company’s insurance carrier would cover this potential settlement, the Company has a corresponding receivable from the insurance carrier recorded in the amount of $3.3 million, which is included in “trade and other accounts receivable,” as of December 31, 2014.
74
Federal Shareholder Derivative Matter
On April 23, 2013 and May 7, 2013, two shareholder derivative actions were filed in the United States District Court for the Southern District of California, entitled Kienzle v. Schramm, et al., Case No. 13-cv-0966 (S.D. Cal. filed April 23, 2013) and Agrawal v. Cortes, et al., Case No. 13-cv-1084 (S.D. Cal. filed May 7, 2013). The complaints name as defendants certain of the Company's current and former officers and directors and names the Company as a nominal defendant. The complaints allege that the individual defendants caused or allowed the Company to issue false and misleading statements about its financial condition, operations, management, and internal controls and falsely represented that it maintained adequate controls. The complaints assert causes of action for breach of fiduciary duty, abuse of control, gross mismanagement, waste of corporate assets and unjust enrichment. The lawsuits seek unspecified damages, an order directing the Company to take all necessary actions to reform and improve its corporate governance and internal procedures, restitution and disgorgement of profits, benefits, and other compensation, attorneys' and experts' fees, and costs and expenses. On June 10, 2013, the parties filed a joint motion to consolidate the two actions. On September 26, 2013, the plaintiffs filed a motion to stay this case until the resolution of the similar derivative action pending in the California Superior Court for the County of San Diego. The Company and individual defendants opposed this motion to stay. On October 30, 2013, the court issued two orders consolidating the two cases under the heading In re Maxwell Technologies, Inc. Derivative Litigation, which had been mutually agreed upon by all parties, and denying the plaintiffs’ motion to stay their own federal derivative case. The lead plaintiffs filed their consolidated and amended complaint on January 30, 2014. In response, the Company and the individual defendants filed motions to dismiss the complaint, which the lead plaintiffs opposed. On May 28, 2014, the court granted the Company’s motion to dismiss but granted the lead plaintiffs leave to amend their complaint. The lead plaintiffs filed an amended complaint on July 11, 2014, to which the Company and individual defendants filed motions to dismiss on August 18, 2014. On September 19, 2014, the parties entered into a memorandum of understanding concerning settlement of this matter related to certain corporate governance reforms to be implemented and/or maintained by the Company. This memorandum of understanding does not address any monetary amounts to be paid to the lead plaintiffs in exchange for the benefit conferred to the Company as a result of the corporate governance reforms. Negotiations have been initiated with respect to the monetary amounts to be paid to lead plaintiffs and such preliminary amounts have been in the range of $650,000 to $1.5 million. However, negotiations regarding the monetary amounts to be paid to the lead plaintiffs reached an impasse and the lead plaintiffs elected to proceed with submitting to the court for determination of the applicable fee to be paid. On December 10, 2014, the parties signed a stipulation of settlement, which did not include the monetary amounts to be paid to the lead plaintiffs. On January 6, 2015, the court granted preliminary approval of the settlement. This preliminary approval triggered requirements for the Company to issue certain notices, each of which have been completed. A hearing is scheduled for March 16, 2015, for the court to determine if final approval of the settlement should be granted. As the Company believes that settlement within this range is probable, but does not believe that a specific amount within this range represents a better estimate, the Company has an accrued liability recorded for the low end of this range in the amount of $650,000, which is included in “accounts payable and accrued liabilities” as of December 31, 2014. As the Company’s insurance carrier would cover this potential settlement, the Company has a corresponding receivable from the insurance carrier recorded in the amount of $650,000, which is included in “trade and other accounts receivable,” as of December 31, 3014.
State Shareholder Derivative Matter
On April 11, 2013 and April 18, 2013, two shareholder derivative actions were filed in California Superior Court for the County of San Diego, entitled Warsh v. Schramm, et al., Case No. 37-2013-00043884 (San Diego Sup. Ct. filed April 11, 2013) and Neville v. Cortes, et al., Case No. 37-2013-00044911-CU-BT-CTL (San Diego Sup. Ct. filed April 18, 2013). The complaints name as defendants certain of the Company's current and former officers and directors as well as its former auditor McGladrey LLP. The Company is named as a nominal defendant. The complaints allege that the individual defendants made or caused the Company to make false and/or misleading statements regarding its financial condition, and failed to disclose material adverse facts about its business, operations and prospects. The complaints assert causes of action for breaches of fiduciary duty for disseminating false and misleading information, failing to maintain internal controls, and failing to properly oversee and manage the Company, as well as for unjust enrichment, abuse of control, gross mismanagement, professional negligence and accounting malpractice, and aiding and abetting breaches of fiduciary duty. The lawsuits seek unspecified damages, an order directing the Company to take all necessary actions to reform and improve its corporate governance and internal procedures, restitution and disgorgement of profits, benefits and other compensation, attorneys' and experts' fees, and costs and expenses. On May 7, 2013, the court consolidated the two actions. The Company filed a motion to stay the consolidated action on July 2, 2013. On September 27, 2013, the court heard oral arguments on the motion to stay and continued the hearing on this motion until the resolution of the motion to stay pending in the federal derivative action referenced above. Given the outcome of the above-detailed federal derivative lawsuit, the Company informed the state court of the federal court order denying the federal plaintiffs’ motion to stay. Consequently, on November 1, 2013, the state court stayed the state derivative action pending before it until the resolution of the federal derivative case. The stipulation of settlement in the federal shareholder derivative matter contemplates that this action will be dismissed with prejudice in the event that settlement receives final approval by the federal court.
75
Shareholder Demand Letter Matter
On April 9, 2013, Stephen Neville, a purported shareholder of the Company, sent a demand letter to the Company to inspect its books and records pursuant to California Corporations Code Section 1601. The demand sought inspection of documents related to the Company's March 7, 2013 announcement that it would be restating its previously-issued financial statements for 2011 and 2012, board minutes and committee materials, and other documents related to its board or management discussions regarding revenue recognition from January 1, 2011 to the present. The Company responded by letter dated April 19, 2013, explaining why it believed that the demand did not appear to be proper. Following receipt of a second letter from Mr. Neville dated April 23, 2013, the Company explained by letter dated April 29, 2013 why it continues to believe that the inspection demand appears improper. The Company has not received a further response from Mr. Neville regarding the inspection demand. In conjunction with the state court derivative action referenced above, Mr. Neville filed two motions to compel production of the documents and materials originally sought in the demand letter. On September 27, 2013, the court heard oral arguments on the motions to compel and, in line with the continuance on the motion to stay in the state shareholder derivative matter referenced above, likewise continued the hearing on the motions to compel, pending resolution of the motions to stay in both the federal and state derivative actions referenced above. On November 15, 2013, the purported shareholder, Mr. Neville, filed a petition for writ of mandate requesting that the state court order the Company to comply with the inspection demand. The Company responded to this writ on January 15, 2014, claiming that the inspection demand is improper on numerous grounds and simultaneously filing a demurrer to the shareholder inspection demand action in its entirety. On July 18, 2014, the court ruled against the Company’s demurrer but left open issues pertaining to the documents to be provided, if any, under the purported shareholder inspection demand. The court set a further hearing in this matter for April 10, 2015. The stipulation of settlement in the federal shareholder derivative matter contemplates that this action will be dismissed with prejudice in the event that settlement receives final approval by the federal court.
76
Note 13—Unaudited Quarterly Financial Information
Quarter Ended | ||||||||||||||||||||||||
March 31 | June 30 | September 30 | December 31 | |||||||||||||||||||||
(in thousands except per share data) | ||||||||||||||||||||||||
Year Ended December 31, 2014 | ||||||||||||||||||||||||
Operating: | ||||||||||||||||||||||||
Total revenue | $ | 46,001 | $ | 46,074 | $ | 41,593 | $ | 52,918 | ||||||||||||||||
Gross profit | 17,870 | 16,600 | 15,470 | 18,500 | ||||||||||||||||||||
Net income (loss) | 319 | (a) | (1,181 | ) | (b) | (3,292 | ) | (c) | (2,118 | ) | (d) | |||||||||||||
Basic and diluted net income (loss) per share | $ | 0.01 | $ | (0.04 | ) | $ | (0.11 | ) | $ | (0.07 | ) | |||||||||||||
Quarter Ended | ||||||||||||||||||||||||
March 31 | June 30 | September 30 | December 31 | |||||||||||||||||||||
(in thousands except per share data) | ||||||||||||||||||||||||
Year Ended December 31, 2013 | ||||||||||||||||||||||||
Operating: | ||||||||||||||||||||||||
Total revenue | $ | 47,748 | $ | 55,610 | $ | 51,197 | $ | 38,979 | ||||||||||||||||
Gross profit | 18,230 | 21,576 | 21,113 | 14,374 | ||||||||||||||||||||
Net income (loss) | (278 | ) | (e) | 3,405 | (f) | 6,027 | (g) | (2,814 | ) | (h) | ||||||||||||||
Basic and diluted net income (loss) per share | $ | (0.01 | ) | $ | 0.12 | $ | 0.21 | $ | (0.10 | ) | ||||||||||||||
_____________
(a) | Includes a non-cash expense for stock-based compensation of $755,000. |
(b) | Includes a non-cash expense for stock-based compensation of $1.2 million. |
(c) | Includes a non-cash expense for stock-based compensation of $1.0 million. |
(d) | Includes a non-cash deferred tax expense of $1.6 million in connection with the probable repatriation of a portion of the unremitted earnings of a foreign subsidiary and a non-cash expense for stock-based compensation of $1.0 million. |
(e) | Includes a non-cash expense for stock-based compensation of $1.0 million. |
(f) | Includes a non-cash expense for stock-based compensation of $946,000. |
(g) | Includes a non-cash expense for stock-based compensation of $719,000. |
(h) | Includes a non-cash expense for stock-based compensation of $1.4 million. |
77
Schedule II
Valuation and Qualifying Accounts (in thousands)
Balance at the Beginning of the Year ($) | Charged to Expense ($) | Acquisitions/ Transfers and Other ($) | Write-offs Net of Recoveries ($) | Balance at the End of the Year ($) | |||||||||||
Allowance for Doubtful Accounts: | |||||||||||||||
December 31, 2012 | 450 | 193 | 2 | (488 | ) | 157 | |||||||||
December 31, 2013 | 157 | 22 | — | (45 | ) | 134 | |||||||||
December 31, 2014 | 134 | 61 | — | (52 | ) | 143 | |||||||||
Allowance for Excess and Obsolete Inventories: | |||||||||||||||
December 31, 2012 | 3,276 | 963 | 8 | (2,306 | ) | 1,941 | |||||||||
December 31, 2013 | 1,941 | 2,023 | 12 | (406 | ) | 3,570 | |||||||||
December 31, 2014 | 3,570 | 892 | (24 | ) | (419 | ) | 4,019 | ||||||||
78
Item 9. | Changes in and Disagreements with Accountants on Accounting and Financial Disclosure |
None.
Item 9A. | Controls and Procedures |
Evaluation of Disclosure Controls and Procedures
We are committed to maintaining disclosure controls and procedures designed to ensure that information required to be disclosed in our periodic reports filed under the Securities and Exchange Act of 1934 (the “Exchange Act”) is recorded, processed, summarized and reported within the time periods specified in the SEC’s rules and forms, and that such information is accumulated and communicated to our management, including our Principal Executive Officer and Principal Financial Officer, as appropriate, to allow for timely decisions regarding required disclosure.
Under the supervision and with the participation of our management, including our Principal Executive Officer and Principal Financial Officer, we conducted an evaluation of the effectiveness of the design and operation of our disclosure controls and procedures as of December 31, 2014, as such term is defined under Rules 13a-15(e) and 15d-15(e) promulgated under the Exchange Act. Based on this evaluation, our Principal Executive Officer and Principal Financial Officer concluded that our disclosure controls and procedures were effective as of the end of the period covered by this Annual Report on Form 10-K.
Management’s Annual Report on Internal Control over Financial Reporting
Our management is responsible for establishing and maintaining adequate internal control over financial reporting, as such term is defined in Exchange Act Rules 13a-15(f) and 15d-15(f). Under the supervision and with the participation of our management, including our principal executive officer and principal financial officer, we conducted an evaluation of the effectiveness of our internal control over financial reporting based on the framework in Internal Control—Integrated Framework (2013) issued by the Committee of Sponsoring Organizations of the Treadway Commission.
Because of its inherent limitations, internal control over financial reporting is not intended to provide absolute assurance that a misstatement of our financial statements would be prevented or detected. Also, projections of any evaluation of effectiveness to future periods are subject to the risk that controls may become inadequate because of changes in conditions or because the degree of compliance with policies or procedures may deteriorate. Based on our evaluation under the framework in Internal Control—Integrated Framework (2013), management concluded that our internal control over financial reporting was effective as of December 31, 2014.
BDO USA, LLP, the independent registered public accounting firm that audited the consolidated financial statements of Maxwell in this Annual Report on Form 10-K, has issued an unqualified opinion on the effectiveness of our internal controls over financial reporting as of December 31, 2014 which is included in this Item under the heading “Report of Independent Registered Public Accounting Firm”.
Changes in Internal Control Over Financial Reporting
There have been no changes in our internal control over financial reporting that occurred during our last fiscal quarter that has materially affected, or is reasonably likely to materially affect, our internal control over financial reporting.
79
REPORT OF INDEPENDENT REGISTERED PUBLIC ACCOUNTING FIRM
Board of Directors and Stockholders
Maxwell Technologies, Inc.
San Diego, California
We have audited Maxwell Technologies, Inc.’s internal control over financial reporting as of December 31, 2014, based on criteria established in Internal Control - Integrated Framework (2013) issued by the Committee of Sponsoring Organizations of the Treadway Commission (the COSO criteria). Maxwell Technologies, Inc.’s management is responsible for maintaining effective internal control over financial reporting and for its assessment of the effectiveness of internal control over financial reporting, included in the accompanying “Item 9A, Management’s Annual Report on Internal Control over Financial Reporting”. Our responsibility is to express an opinion on the company’s internal control over financial reporting based on our audit.
We conducted our audit in accordance with the standards of the Public Company Accounting Oversight Board (United States). Those standards require that we plan and perform the audit to obtain reasonable assurance about whether effective internal control over financial reporting was maintained in all material respects. Our audit included obtaining an understanding of internal control over financial reporting, assessing the risk that a material weakness exists, and testing and evaluating the design and operating effectiveness of internal control based on the assessed risk. Our audit also included performing such other procedures as we considered necessary in the circumstances. We believe that our audit provides a reasonable basis for our opinion.
A company’s internal control over financial reporting is a process designed to provide reasonable assurance regarding the reliability of financial reporting and the preparation of financial statements for external purposes in accordance with generally accepted accounting principles. A company’s internal control over financial reporting includes those policies and procedures that (1) pertain to the maintenance of records that, in reasonable detail, accurately and fairly reflect the transactions and dispositions of the assets of the company; (2) provide reasonable assurance that transactions are recorded as necessary to permit preparation of financial statements in accordance with generally accepted accounting principles, and that receipts and expenditures of the company are being made only in accordance with authorizations of management and directors of the company; and (3) provide reasonable assurance regarding prevention or timely detection of unauthorized acquisition, use, or disposition of the company’s assets that could have a material effect on the financial statements.
Because of its inherent limitations, internal control over financial reporting may not prevent or detect misstatements. Also, projections of any evaluation of effectiveness to future periods are subject to the risk that controls may become inadequate because of changes in conditions, or that the degree of compliance with the policies or procedures may deteriorate.
In our opinion, Maxwell Technologies, Inc. maintained, in all material respects, effective internal control over financial reporting as of December 31, 2014, based on the COSO criteria.
We also have audited, in accordance with the standards of the Public Company Accounting Oversight Board (United States), the consolidated balance sheets of Maxwell Technologies, Inc. as of December 31, 2014 and 2013, and the related consolidated statements of operations, comprehensive income (loss), stockholders’ equity, and cash flows for each of the three years in the period ended December 31, 2014, and our report dated February 12, 2015 expressed an unqualified opinion thereon.
/s/ BDO USA, LLP
San Diego, California
February 12, 2015
80
Item 9B. | Other Information |
None.
81
PART III
Item 10. | Directors, Executive Officers and Corporate Governance |
The information required by this item will be set forth in the Proxy Statement and is incorporated in this Annual Report on Form 10-K by reference.
Item 11. | Executive Compensation |
The information required by this item will be set forth in the Proxy Statement and is incorporated in this Annual Report on Form 10-K by reference.
Item 12. | Security Ownership of Certain Beneficial Owners and Management and Related Stockholder Matters |
The information required by this item will be set forth in the Proxy Statement and is incorporated in this Annual Report on Form 10-K by reference.
Item 13. | Certain Relationships and Related Transactions, and Director Independence |
The information required by this item will be set forth in the Proxy Statement and is incorporated in this Annual Report on Form 10-K by reference.
Item 14. | Principal Accounting Fees and Services |
The information required by this item will be set forth in the Proxy Statement and is incorporated in this Annual Report on Form 10-K by reference.
82
PART IV
Item 15. | Exhibits and Financial Statement Schedules |
(a) | Documents filed as part of this report. |
1. | Financial Statements. The consolidated financial statements required by this item are submitted in a separate section beginning on page 47 of this Annual Report on Form 10-K. |
2. | Financial Statement Schedules. The financial statement schedule entitled “Valuation and Qualifying Accounts” required by this item is submitted in a separate section beginning on page 78 of this Annual Report on Form 10-K. |
3. | Exhibits. |
Exhibit Number | Description of Document | ||
3.1 | Restated Certificate of Incorporation of Registrant. (8) | ||
3.2 | Certificate of Amendment of Restated Certificate of Incorporation of Registrant, dated November 22, 1996. (6) | ||
3.3 | Certificate of Amendment of Restated Certificate of Incorporation of Registrant, dated February 9, 1998. (1) | ||
3.4 | Amended and Restated Bylaws of Registrant. (2) | ||
10.1 | 1995 Stock Option Plan of Registrant. (7) ** | ||
10.2 | Amendment No. One to Registrant’s 1995 Stock Option Plan dated March 19, 1997. (6) ** | ||
10.3 | Amendment No. Two to Registrant’s 1995 Stock Option Plan dated February 13, 1998. (11) ** | ||
10.4 | Amendment No. Three to Registrant’s 1995 Stock Option Plan dated January 28, 1999. (1) ** | ||
10.5 | Amendment No. Four to Registrant’s 1995 Stock Option Plan dated Nov. 22, 1999. (3) ** | ||
10.6 | Amendment No. Five to Registrant’s 1995 Stock Option Plan dated August 14, 2000. (10) ** | ||
10.7 | 1999 Director Stock Option Plan of Registrant. (3) ** | ||
10.8 | Stock Purchase and Barter Agreement by and between Registrant and Montena SA dated May 30, 2002. (4) | ||
10.9 | Amendment Number One to Stock Purchase and Barter Agreement by and between Registrant and Montena SA dated June 28, 2002. (4) | ||
10.10 | Amendment Number Two to the Stock Purchase and Barter Agreement by and between Registrant and Montena SA dated August 12, 2002. (5) | ||
10.11 | Indemnity Agreement for Directors of Registrant dated December 2004. (9) | ||
10.12 | Registrant’s 2005 Omnibus Equity Incentive Plan, as amended through May 6, 2010. (12) ** | ||
10.13 | Employment agreement effective as of March 23, 2009 between the Company and Kevin S. Royal. (13) ** | ||
10.14 | Form of Restricted Stock Unit Award Agreement. (14) ** | ||
10.15 | Form of Restricted Stock Agreement for Service-based Awards under the 2005 Omnibus Equity Incentive Plan, as amended through May 6, 2010. (16) ** | ||
10.16 | Form of Restricted Stock Agreement for Performance-based Awards under the 2005 Omnibus Equity Incentive Plan, as amended through May 6, 2010. (16) ** | ||
†10.17 | Credit Agreement, dated as of December 5, 2011, (the “Credit Agreement”) between Maxwell Technologies, Inc. and Wells Fargo Bank, N.A. (17) | ||
†10.18 | Security Agreement, dated as of December 5, 2011, by Maxwell Technologies, Inc. in favor of Wells Fargo Bank, N.A., pursuant to the Credit Agreement. (17) | ||
83
Exhibit Number | Description of Document | ||
†10.19 | Equipment Term Commitment Note, dated as of December 5, 2011, between Maxwell Technologies, Inc. and Wells Fargo Bank, N.A, pursuant to the Credit Agreement. (17) | ||
†10.20 | Revolving Line of Credit Note, dated as of December 5, 2011, by Maxwell Technologies, Inc. between Maxwell Technologies, Inc. and Wells Fargo Bank, N.A, pursuant to the Credit Agreement. (17 | ||
10.21 | Employment Agreement between the Registrant and John Warwick dated May 16, 2013 (18) ** | ||
10.22 | Forbearance Agreement, dated June 17, 2013, between Maxwell Technologies, Inc. and Wells Fargo Bank, N.A. (19) | ||
10.23 | Amended and Restated 2004 Employee Stock Purchase Plan of Registrant. (7) ** | ||
10.24 | Registrant’s 2013 Omnibus Equity Incentive Plan. (7) ** | ||
10.25 | First Amendment to Credit Agreement, dated as of October 31, 2013, between Maxwell Technologies, Inc. and Wells Fargo Bank, N.A. (20) | ||
10.26 | Second Amendment to Credit Agreement, dated as of December 5, 2013, between Maxwell Technologies, Inc. and Wells Fargo Bank, N.A. (20) | ||
10.27 | Third Amendment and Waiver to Credit Agreement, dated February 5, 2014, between Maxwell Technologies, Inc. and Wells Fargo Bank, N.A. (21) | ||
10.28 | Second Amended and Restated Credit Note dated February 5, 2014, between Maxwell Technologies, Inc. and Wells Fargo Bank, N.A. (21) | ||
10.29 | Forbearance Agreement dated February 27, 2014, between Maxwell Technologies, Inc. and Wells Fargo Bank, N.A. (21) | ||
10.30 | Third Amended and Restated Credit Note dated April 30, 2014, between Maxwell Technologies, Inc. and Wells Fargo Bank, N.A. (21) | ||
10.31 | Forbearance Agreement and Fourth Amended and Restated Credit Note dated April 30, 2014, between Maxwell Technologies, Inc. and Wells Fargo Bank, N.A. (21) | ||
10.32 | Forbearance and Fifth Amendment to Credit Agreement dated June 30, 2014, between Maxwell Technologies, Inc. and Wells Fargo Bank, N.A. (22) | ||
10.33 | Fourth Amended and Restated Revolving Credit Note dated June 30, 2014, between Maxwell Technologies, Inc. and Wells Fargo Bank, N.A. (22) | ||
10.34 | Sixth Amendment to Credit Note dated August 29, 2014, between Maxwell Technologies, Inc. and Wells Fargo Bank, N.A. (23) | ||
10.35 | Fifth Amended and Restated Revolving Credit Note dated August 29, 2014, between Maxwell Technologies, Inc. and Wells Fargo Bank, N.A. (23) | ||
10.36 | First Amendment to Security Agreement dated November 19, 2014, between Maxwell Technologies, Inc. and Wells Fargo Bank, N.A * | ||
10.37 | Seventh Amendment to Credit Note dated November 19, 2014, between Maxwell Technologies, Inc. and Wells Fargo Bank, N.A. * | ||
21.1 | List of Subsidiaries of Registrant. * | ||
23.1 | Consent of Independent Registered Public Accounting Firm. * | ||
31.1 | Certification of Chief Executive Officer pursuant to Rule 13a-14(a) (Section 302 Certification) as adopted pursuant to Section 302 of the Sarbanes-Oxley Act of 2002. * | ||
31.2 | Certification of Chief Financial Officer pursuant to Rule 13a-14(a) (Section 302 Certification) as adopted pursuant to Section 302 of the Sarbanes-Oxley Act of 2002. * | ||
32.1 | Certification of Chief Executive Officer pursuant to 18 U.S.C. Section 1350, as adopted pursuant to Section 906 of the Sarbanes-Oxley Act of 2002. * | ||
32.2 | Certification of Chief Financial Officer pursuant to 18 U.S.C. Section 1350, as adopted pursuant to Section 906 of the Sarbanes-Oxley Act of 2002. * | ||
84
Exhibit Number | Description of Document | ||
101 | The following financial statements and footnotes from the Maxwell Technologies, Inc. Annual Report on Form 10-K for the year ended December 31, 2014 formatted in Extensible Business Reporting Language (XBRL): (i) Consolidated Balance Sheets; (ii) Consolidated Statements of Operations; (iii) Consolidated Statements of Comprehensive Income (Loss); (iv) Consolidated Statements of Stockholders’ Equity; (v) Consolidated Statements of Cash Flows; and (vi) the Notes to Consolidated Financial Statements. * | ||
_________
† | Maxwell Technologies, Inc. has requested confidential treatment of certain information contained in this exhibit. Such information was filed separately with the Securities and Exchange Commission pursuant to an application for confidential treatment under 17 C.F.R. §§ 200.80(b)(4) and 240.24b-2. |
* | Filed herewith. |
** | Management contract or compensatory plan or arrangement of the company required to be filed as an exhibit. |
(1) | Incorporated herein by reference to Registrant’s Annual Report on Form 10-K for the fiscal year ended July 31, 1999 (SEC file no. 000-10964). |
(2) | Incorporated herein by reference to Registrant’s Current Report on Form 8-K filed with the SEC on December 16, 2013. |
(3) | Incorporated herein by reference to Registrant’s Transition Report on Form 10-K for the transition period from August 1, 1999 to December 31, 1999 (SEC file no. 001-15477). |
(4) | Incorporated herein by reference to Registrant’s Current Report on Form 8-K filed with the SEC on July 19, 2002 (SEC file no. 001-15477). |
(5) | Incorporated herein by reference to Registrant’s Current Report on Form 8-K filed with the SEC on September 18, 2002 (SEC file no. 001-15477). |
(6) | Incorporated herein by reference to Registrant’s Annual Report on Form 10-K for the fiscal year ended July 31, 1997 (SEC file no. 000-10964). |
(7) | Incorporated herein by reference to Registrant’s Schedule 14A for the 2013 Annual Meeting of Stockholders (SEC file no. 001-15477). |
(8) | Incorporated herein by reference to Registrant’s Annual Report on Form 10-K for the fiscal year ended July 31, 1987 (SEC file no. 000-10964). |
(9) | Incorporated herein by reference to Registrant’s Annual Report on Form 10-K for the fiscal year ended December 31, 2003 (SEC file no. 001-15477). |
(10) | Incorporated herein by reference to Registrant’s Annual Report on Form 10-K for the fiscal year ended December 31, 2000 (SEC file no. 001-15477). |
(11) | Incorporated herein by reference to Registrant’s Annual Report on Form 10-K for the fiscal year ended July 31, 1998 (SEC file no. 000-10964). |
(12) | Incorporated herein by reference to Registrant’s Current Report on Form 8-K filed with the SEC on May 10, 2010 (SEC file no. 001-15477). |
(13) | Incorporated herein by reference to Registrant’s Current Report on Form 10-Q filed with the SEC on May 5, 2009 (SEC file no. 001-15477). |
(14) | Incorporated herein by reference to Registrant’s Current Report on Form 10-Q filed with the SEC on August 10, 2009 (SEC file no. 001-15477). |
85
(15) | Incorporated herein by reference to Registrant’s Current Report on Form 10-Q filed with the SEC on November 5, 2009 (SEC file no. 001-15477). |
(16) | Incorporated herein by reference to Registrant’s Annual Reports on Form 10-K for the fiscal year ended December 31, 2010 (SEC file no. 001-15477). |
(17) | Incorporated herein by reference to Registrant’s Annual Reports on Form 10-K for the fiscal year ended December 31, 2011 (SEC file no. 001-15477). |
(18) | Incorporated herein by reference to Registrant’s Current Report on Form 8-K filed with the SEC on June 4, 2013 (SEC file no. 001-15477). |
(19) | Incorporated herein by reference to Registrant’s Current Report on Form 10-Q filed with the SEC on August 1, 2013 (SEC file no. 001-15477). |
(20) | Incorporated herein by reference to Registrant’s Annual Reports on Form 10-K for the fiscal year ended December 31, 2013 (SEC file no. 001-15477). |
(21) | Incorporated herein by reference to Registrant’s Current Report on Form 10-Q filed with the SEC on May 1, 2014 (SEC file no. 001-15477). |
(22) | Incorporated herein by reference to Registrant’s Current Report on Form 10-Q filed with the SEC on July 31, 2014 (SEC file no. 001-15477). |
(23) | Incorporated herein by reference to Registrant’s Current Report on Form 10-Q filed with the SEC on October 23, 2014 (SEC file no. 001-15477). |
(b) | See the exhibits required by this item under Item 15(a)(3) above. |
(c) | See the financial statement schedule required by this item under Item 15(a)(2) above. |
86
SIGNATURES
Pursuant to the requirements of Section 13 or 15(d) of the Securities Exchange Act of 1934, the registrant has duly caused this report to be signed on its behalf by the undersigned, thereunto duly authorized, on this 12th day of February 2015.
MAXWELL TECHNOLOGIES, INC. | |||
By: | /S/ FRANZ FINK | ||
Franz Fink President and Chief Executive Officer | |||
POWER OF ATTORNEY
KNOW ALL PERSONS BY THESE PRESENTS, that each of the undersigned hereby constitutes and appoints Franz Fink and Kevin S. Royal, jointly and severally, as his or her true and lawful attorneys-in-fact and agents, each with full power of substitution and resubstitution, for him or her and on his or her behalf to sign, execute and file this Annual Report on Form 10-K and any or all amendments to this Annual Report on Form 10-K, and to file the same, with all exhibits thereto and any and all documents required to be filed with respect therewith, with the Securities and Exchange Commission or any regulatory authority, granting unto such attorneys-in-fact and agents full power and authority to do and perform each and every act and thing requisite and necessary to be done in connection therewith and about the premises in order to effectuate the same as fully to all intents and purposes as he or she might or could do if personally present, hereby ratifying and confirming all that such attorneys-in-fact and agents, or his or her substitute or substitutes, may lawfully do or cause to be done.
Pursuant to the requirements of the Securities Exchange Act of 1934, this report has been signed below by the following persons on behalf of the registrant and in the capacities and on the dates indicated.
Signature | Title | Date | ||
/s/ FRANZ FINK | President and Chief Executive Officer | February 12, 2015 | ||
Franz Fink | (Principal Executive Officer) | |||
/s/ KEVIN S. ROYAL | Senior Vice President, Chief Financial Officer, Treasurer and Secretary | February 12, 2015 | ||
Kevin S. Royal | ||||
(Principal Financial and Accounting Officer) | ||||
/s/ MARK ROSSI | Director | February 12, 2015 | ||
Mark Rossi | ||||
/s/ ROBERT L. GUYETT | Director | February 12, 2015 | ||
Robert L. Guyett | ||||
/s/ JOSÉ CORTES | Director | February 12, 2015 | ||
José Cortes | ||||
/s/ BURKHARD GOESCHEL | Director | February 12, 2015 | ||
Burkhard Goeschel | ||||
/s/ ROGER HOWSMON | Director | February 12, 2015 | ||
Roger Howsmon | ||||
/s/ YON YOON JORDEN | Director | February 12, 2015 | ||
Yon Yoon Jorden | ||||
/s/ DAVID SCHLOTTERBECK | Director | February 12, 2015 | ||
David Schlotterbeck | ||||
87