Attached files
| file | filename |
|---|---|
| EX-99.1 - EXHIBIT 99.1 - Intrawest Resorts Holdings, Inc. | s000722x2_ex99-1.htm |
| 8-K - FORM 8-K - Intrawest Resorts Holdings, Inc. | s000722x2_8k.htm |
Exhibit 99.2

Intrawest Resorts Holdings, Inc. Fiscal 2015 Second Quarter Earnings Presentation February 6, 2015

Important Information 1 This document contains forward - looking statements . These forward - looking statements are based on current expectations, estimates and projections about the industry and markets in which Intrawest operates as well as the Company’s beliefs and assumptions regarding our operations and financial performance, all of which are subject to known and unknown risks, uncertainties and other factors that may cause our actual results, performance or achievements, industry results or market trends to differ materially from those expressed or implied by such forward - looking statements . Therefore any statements contained herein that are not statements of historical fact may be forward - looking statements and should be evaluated as such . Without limiting the foregoing, words such as “Expects”, “Anticipates”, “Should”, “Intends”, “Plans”, “Believes”, “Seeks”, “Estimates”, “Projects”, and variations of such words and similar expressions are intended to identify such forward - looking statements . These statements are not guarantees of future performance and involve certain risks, uncertainties and assumptions which are difficult to predict, including those described in Part I - Item 1 A, ‘‘Risk Factors’’ in our Annual Report on Form 10 - K for the fiscal year ended June 30 , 2014 filed with the SEC on September 23 , 2014 , as may be revised in subsequent SEC filings . Therefore , actual outcomes and results may differ materially from what is expressed or forecasted in such forward - looking statements . The actual performance of Intrawest may differ from the budget, projections and returns set forth herein and may differ materially . Certain information contained herein has been obtained from published and non - published sources . Such information has not been independently verified by Intrawest . Except where otherwise indicated, the information provided herein is based on matters as they exist as of the date of preparation and not as of any future date, and will not be updated or otherwise revised to reflect information that subsequently becomes available, or circumstances existing or changes occurring after the date hereof . This presentation includes certain non - GAAP financial measures, including Adjusted EBITDA (“Adj . EBITDA ”) . Non - GAAP financial measures such as Adj . EBITDA should be considered only as supplemental to, and not as superior to, financial measures prepared in accordance with GAAP . Please refer to our Current Report on Form 8 - K furnished February 6 , 2014 with the Securities and Exchange Commission for a reconciliation of the non - GAAP financial measures included in this presentation to the most directly comparable financial measures prepared in accordance with GAAP . We use Adj . EBITDA as a measure of our operating performance . Adj . EBITDA is a supplemental non - GAAP financial measure . Our board of directors and management team focus on Adj . EBITDA as a key performance and compensation measure . Adj . EBITDA assists us in comparing our performance over various reporting periods because it removes from our operating results the impact of items that our management believes do not reflect our core operating performance . The compensation committee of our board of directors will determine the annual variable compensation for certain members of our management team, based in part, on Adj . EBITDA . Adj . EBITDA is not a substitute for net income (loss), income (loss) from continuing operations, cash flows from operating activities or any other measure prescribed by GAAP . There are limitations to using non - GAAP measures such as Adj . EBITDA . Although we believe that Adj . EBITDA can make an evaluation of our operating performance more consistent because it removes items that do not reflect our core operations, other companies in our industry may define Adj . EBITDA differently than we do . As a result, it may be difficult to use Adj . EBITDA to compare the performance of those companies to our performance . Adj . EBITDA should not be considered as a measure of the income generated by our business or discretionary cash available to us to invest in the growth of our business . Our management compensates for these limitations by reference to our GAAP results and using Adj . EBITDA as a supplemental measure .

Growth Strategies 3 Significant Organic Growth from Existing Assets G rowth capex , pricing power, season pass program, and cross - selling resorts & CMH Acquisition & Alliance Opportunities Fragmented industry that favors multi - resort operators & multi - resort passes Opportunity to Re - Start Real Estate Business Upside from development of 1,140 + acres of prime land

▪ Skier visit growth of 2 . 2 % despite challenging early season conditions in the East ▪ Mountain Segment Revenue growth of 4 . 7 % largely driven by skier visits, select price increases, and increased season pass and frequency product sales ▪ Growth in lift and guest services revenue reflects successful pricing strategy, while still offering value that is recognized and appreciated by our guests Fiscal 2015 Second Quarter Highlights 4 Adjusted EBITDA in line with Guidance ▪ 100 % of Blue Mountain included in results for fiscal 2015 versus 50 % of Blue Mountain Adjusted EBITDA and no revenue or skier visits in fiscal 2014 ▪ Total Reportable Segment Revenue growth of 18 . 3 % to $ 120 . 1 mm, including Blue Mountain ▪ Breakeven Adjusted EBITDA in line with previous guidance ▪ S eason pass and frequency product sales were up 16 . 5 % compared to the same time last year 1 ▪ 7 % increase in the number of units sold and a 9 % increase in average yield per unit sold ▪ Strength in Colorado season pass sales demonstrates the value of our product offerings and the benefits of our strategic alliances Season Pass & Frequency Product Sales +16.5% Same Store Growth in Mountain (excluding Blue Mtn ) 1) As of Sunday, February 1, 2015 vs. Sunday, February 2, 2014. Includes Blue Mountain in both periods..

Fiscal 2015 Second Quarter Mountain Highlights 5 (US$mm) ▪ Lift Revenue increased 5.6% ▪ Lodging, Ski School, Retail and Rental, and Food and Beverage Revenue increased 7.3% ▪ Revenue from season pass and frequency products increased 10.7% ▪ Revenue from season p ass and f requency products comprised 45.6% of total lift revenue versus 42.7% in the prior year period ▪ Effective Ticket Price (“ETP”) increased 4.0% ▪ Total mountain revenue per skier visit increased 2.6% ▪ Mountain Adjusted EBITDA impacted by increased general and administrative expenses Highlights Excluding Blue

Q2 Actual vs. FY15 Actual Prior Year Prior Year Reportable Segment Revenue Mountain $94.7 $76.0 24.6% Adventure $10.2 $11.5 (11.2%) Real Estate $15.2 $13.9 8.8% Total $120.1 $101.4 18.3% Adjusted EBITDA Mountain $2.5 $3.1 (20.3%) Adventure ($4.8) ($3.1) 56.2% Real Estate $2.5 $1.7 49.6% Total $0.1 $1.7 (91.8%) Net Loss Attr. to Intrawest Resorts Holdings, Inc. ($31.1) ($121.1) 74.3% Capital Expenditures $16.5 $19.6 (15.7%) Fiscal 2015 Second Quarter Financial Highlights 6 (US$mm) Highlights ▪ Adventure Segment ~ Postponed trips at CMH resulting from limited early season snowfall and warm temperatures ~ Increased helicopter maintenance expenses and general and administrative expenses, partially offset by expense savings at CMH ▪ Real Estate Segment ~ Additional payments on financed sales of points at our vacation club business ~ Increase in our pro rata share of the EBITDA from our equity method investments in MHM and the Fairmont Chateau in Tremblant ▪ Net Loss improvement largely a result of lower interest expense due to our restructuring and refinancing in December of 2013
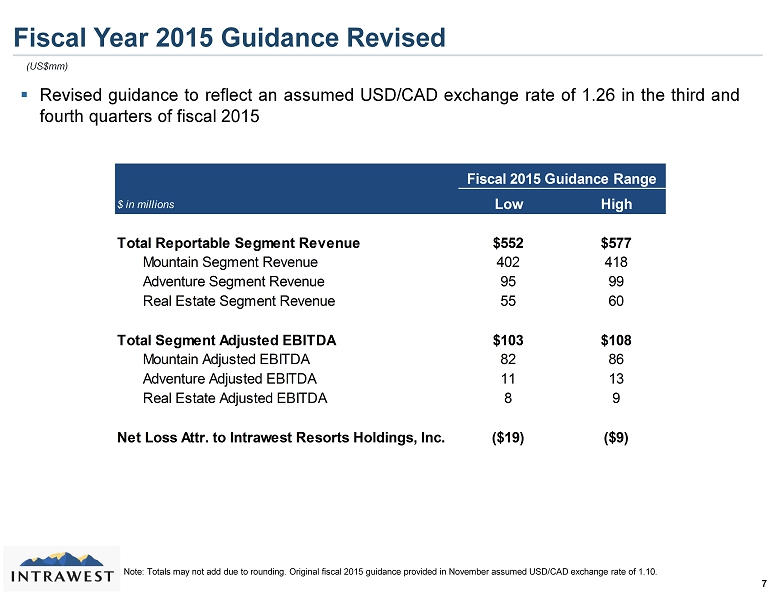
Fiscal Year 2015 Guidance Revised 7 Note: Totals may not add due to rounding. Original fiscal 2015 guidance provided in November assumed USD/CAD exchange rate of 1. 10. Fiscal 2015 Guidance Range % Change vs. Fiscal 2014 $ in millions Low High Total Reportable Segment Revenue $552 $577 Mountain Segment Revenue 402 418 Adventure Segment Revenue 95 99 Real Estate Segment Revenue 55 60 Total Segment Adjusted EBITDA $103 $108 Mountain Adjusted EBITDA 82 86 Adventure Adjusted EBITDA 11 13 Real Estate Adjusted EBITDA 8 9 Net Loss Attr. to Intrawest Resorts Holdings, Inc. ($19) ($9) (US$mm) ▪ Revised guidance to reflect an assumed USD/CAD exchange rate of 1 . 26 in the third and fourth quarters of fiscal 2015
Conclusion 8 Results in Line with Previous Guidance Same Store Mountain Revenue and Skier Visit Growth Evaluating Organic and External Growth Opportunities Revised Guidance for Impact of Strengthened US Dollar