Attached files
| file | filename |
|---|---|
| 8-K - FORM 8-K - Expedia Group, Inc. | d868087d8k.htm |
| EX-99.1 - EX-99.1 - Expedia Group, Inc. | d868087dex991.htm |
Exhibit 99.2

INVESTOR PRESENTATION February 5, 2015
Safe Harbor Forward-Looking Statements. This presentation contains “forward-looking statements” within the meaning of the Private Securities Litigation Reform Act of 1995. These statements are not guarantees of future performance. These forward-looking statements are based on management’s expectations as of February 5, 2015 and assumptions which are inherently subject to uncertainties, risks and changes in circumstances that are difficult to predict. The use of words such as “intends” and “expects,” among others, generally identifies forward-looking statements. However, these words are not the exclusive means of identifying such statements. In addition, any statements that refer to expectations, projections or other characterizations of future events or circumstances are forward-looking statements and may include statements relating to future revenues, expenses, margins, profitability, net income / (loss), earnings per share and other measures of results of operations and the prospects for future growth of Expedia, Inc.’s business. Actual results and the timing and outcome of events may differ materially from those expressed or implied in the forward-looking statements for a variety of reasons, including, among others: an increasingly competitive global environment; modifications to our current business models and practices or our adoption of new business models or practices in order to compete; changes in search engine algorithms and dynamics or other traffic-generating arrangements; declines or disruptions in the travel industry; our failure to maintain and expand our relationships and contractual agreements with travel suppliers or travel distribution partners; our failure to maintain and expand our brand awareness or increased costs to do so; our failure to adapt to technological developments or industry trends; risks relating to our operations in international markets, including China; adverse application of existing tax or unclaimed property laws, rules or regulations or implementation of new unfavorable laws, rules or regulations; adverse outcomes in legal proceedings to which we are a party; our failure to comply with current laws, rules and regulations, or changes to such laws, rules and regulations; determinations by U.S. and foreign tax authorities regarding our worldwide tax provision for income taxes; payments related risks, including credit card fraud; volatility in our stock price; liquidity constraints or our inability to access the capital markets when necessary; interruption or lack of redundancy in our information systems; failure to retain or motivate key personnel or hire, retain and motivate qualified personnel, including senior management; changes in control of the Company; management and director conflicts of interest; risks related to actions taken by our business partners and third party service providers, including failure to comply with our requirements or standards or the requirements or standards of governmental authorities, or any cessation of their operations; risks related to the failure of counterparties to perform on financial obligations; fluctuations in foreign exchange rates; our failure to comply with governmental regulation and other legal obligations related to our processing, storage, use and disclosure of personal data, and liabilities related to security breaches; risks related to our acquisitions, investments or significant commercial arrangements; risks related to our long-term indebtedness; our failure to effectively operate our businesses due to restrictive covenants in the agreements governing our indebtedness; our failure to protect our intellectual property from copying or use by others, including competitors; and other risks detailed in Expedia, Inc.’s public filings with the SEC, including our quarterly report on Form 10-K for the year ended December 31, 2014. Except as required by law, we undertake no obligation to update any forward-looking or other statements in this presentation, whether as a result of new information, future events or otherwise. Non-GAAP Measures. Reconciliations to GAAP measures of non-GAAP measures included in this presentation are included in the Appendix. These measures are intended to supplement, not substitute for, GAAP comparable measures. Investors are urged to consider carefully the comparable GAAP measures and reconciliations. Industry / Market Data. Industry and market data used in this presentation have been obtained from industry publications and sources as well as from research reports prepared for other purposes. We have not independently verified the data obtained from these sources and cannot assure you of the data’s accuracy or completeness. Trademarks & Logos. Trademarks and logos are the property of their respective owners. © 2015 Expedia, Inc. All rights reserved. CST: 2029030-50 July 2014
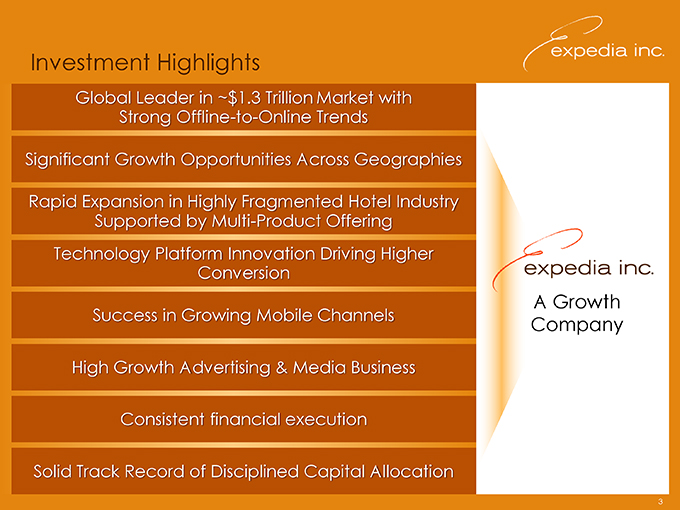
Investment Highlights Global Leader in ~$1.3 Trillion Market with Strong Offline-to-Online Trends Significant Growth Opportunities Across Geographies Rapid Expansion in Highly Fragmented Hotel Industry Supported by Multi-Product Offering Technology Platform Innovation Driving Higher Conversion A Growth Success in Growing Mobile Channels Company High Growth Advertising & Media Business Consistent financial execution Solid Track Record of Disciplined Capital Allocation
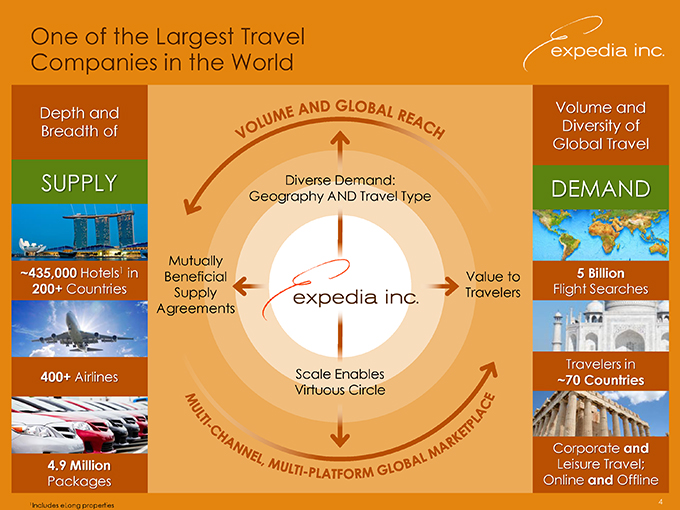
One of the Largest Travel Companies in the World Depth and Volume and Breadth of Diversity of Global Travel SUPPLY Diverse Demand: DEMAND Geography AND Travel Type 1 Mutually ~435,000 Hotels in Beneficial Value to 5 Billion 200+ Countries Supply Travelers Flight Searches Agreements Travelers in 400+ Airlines Scale Enables ~70 Countries Virtuous Circle Corporate and 4.9 Million Leisure Travel; Packages Online and Offline

Established Brands With Global Reach Trusted Brands #1 Full-Service A Leading Hotel A Leading Hotel A Leader in Global Online Travel Agency Specialist Globally Metasearch Company Corporate Travel 31 Sites in 89 Sites in Sites in Presence in 31 Countries1 68 Countries 49 Countries 64 Countries Brand Strength in EVERY Established Market Solid Foothold in Emerging Markets
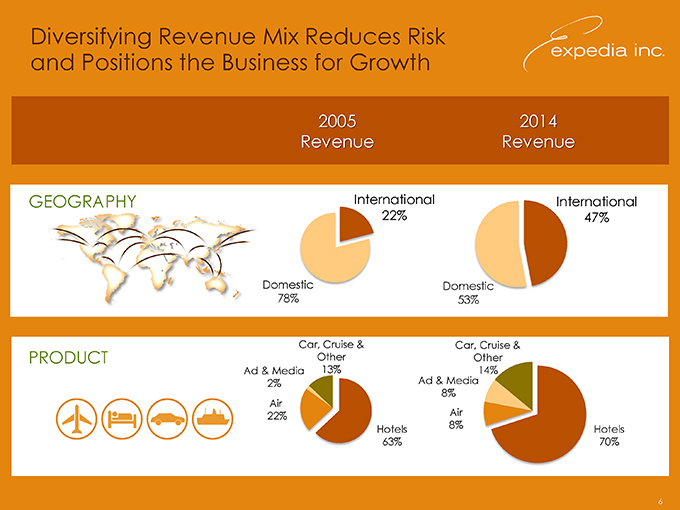
Diversifying Revenue Mix Reduces Risk and Positions the Business for Growth 2005 2014 Revenue Revenue GEOGRAPHY International International 22% 47% Domestic Domestic 78% 53% Car, Cruise & Car, Cruise & PRODUCT Other Other Ad & Media 13% 14% 2% Ad & Media Air 8% 22% Air Hotels 8% Hotels 63% 70%
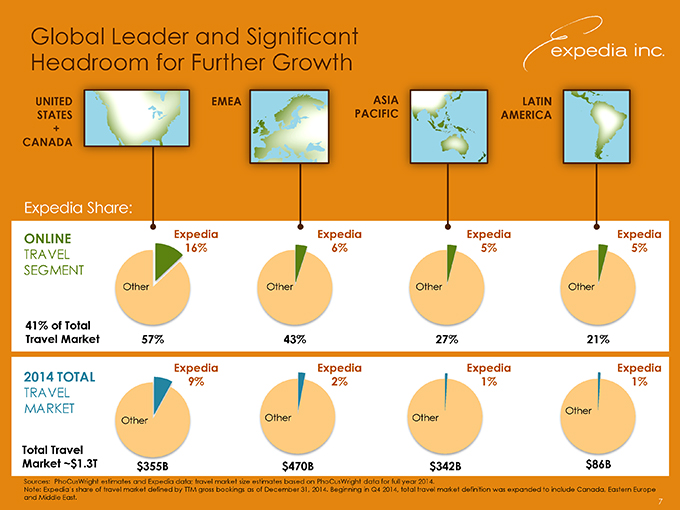
Global Leader and Significant Headroom for Further Growth UNITED EMEA ASIA LATIN STATES PACIFIC AMERICA + CANADA Expedia Share: ONLINE Expedia Expedia Expedia Expedia 16% 6% 5% 5% TRAVEL SEGMENT Other Other Other Other 41% of Total Travel Market 57% 43% 27% 21% Expedia Expedia Expedia Expedia 2014 TOTAL 9% 2% 1% 1% TRAVEL MARKET Other Other Other Other Total Travel Market ~$1.3T $355B $470B $342B $86B Sources: PhoCusWright estimates and Expedia data; travel market size estimates based on PhoCusWright data for full year 2014. Note: Expedia’s share of travel market defined by TTM gross bookings as of December 31, 2014. Beginning in Q4 2014, total travel market definition was expanded to include Canada, Eastern Europe and Middle East. 7
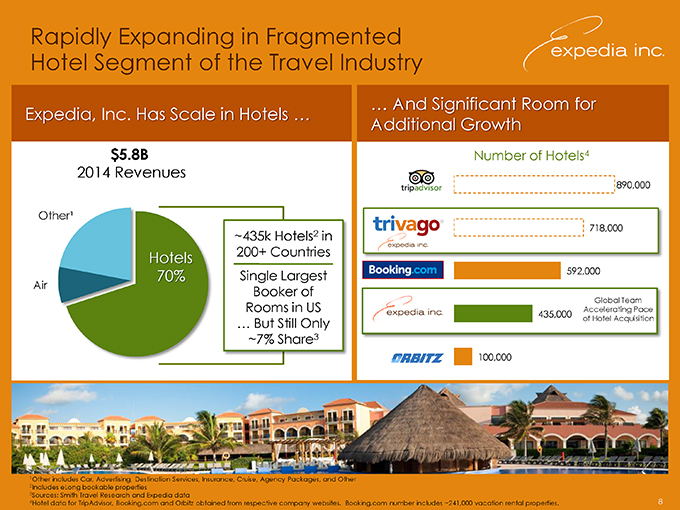
Rapidly Expanding in Fragmented Hotel Segment of the Travel Industry … And Significant Room for Expedia, Inc. Has Scale in Hotels … Additional Growth $5.8B Number of Hotels4 2014 Revenues 890,000 Other¹ 718,000 ~435k Hotels2 in Hotels 200+ Countries 70% Single Largest 592,000 Air Booker of Global Team Rooms in US 435,000 Accelerating Pace … But Still Only of Hotel Acquisition ~7% Share3 100,000

Have Completed Significant Technology Investments That Fortify the Business echnol pid Inn Powe ics … Conversion CENTRALIZED Customer Operations Technology CENTRALIZED Transactional Infrastructure: Financials / Order Management / Inventory Management

Industry Leading Mobile Initiatives Drive Traffic and Revenue The World Is Opening Up Significant Opportunities in Travel Changing … More than Unique Supply Deal and One in Four Value Proposition to Room Nights Customers: 24 x 7 Mobile Users Booked on a Up to 40% Off Just for Mobile PC-Connected Mobile Device Users … Expedia, Inc. Leads the Way Development in Mobile Innovation Expedia Hotels & Flights among Google’s Tripdeck feature on “Best Android Apps of 2014” FlightTrack 5 app for iOS and Android, Hotels.com is among Top 10 Free Travel Apps in allowing travelers to the iTunes Store easily track their flights in a simple itinerary, regardless of where FlightTrack 5 selected as “Best Travel App” by they booked Global Traveler

Significant Acceleration in the Advertising and Media Business ADVERTISING & MEDIA REVENUE $ Millions #1 hotel metasearch in Europe $479 $3191 $113 $131 $99 $109 2009 2010 2011 2012 2013 2014 ’09-’11 CAGR : 6.8% ’11-’14 CAGR : 61.8% Note: Reported numbers are net of any intercompany revenue 1 Controlling interest in trivago GmbH (“trivago”) acquired in March 2013
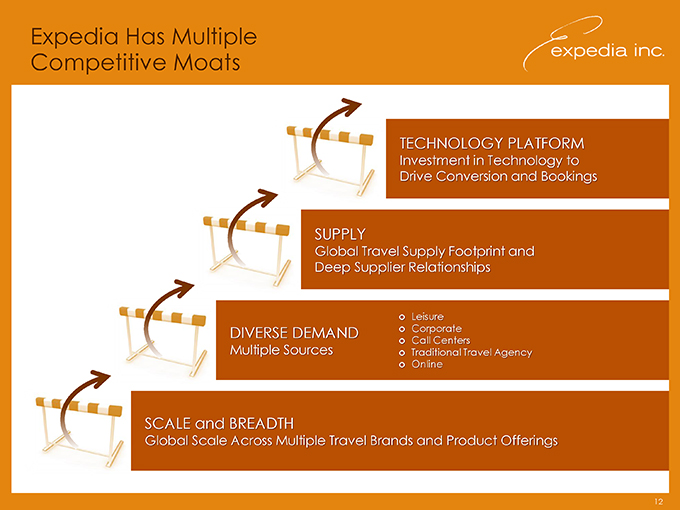
Expedia Has Multiple Competitive Moats TECHNOLOGY PLATFORM Investment in Technology to Drive Conversion and Bookings SUPPLY Global Travel Supply Footprint and Deep Supplier Relationships ? Leisure DIVERSE DEMAND ? Corporate ? Call Centers Multiple Sources ? Traditional Travel Agency ? Online SCALE and BREADTH Global Scale Across Multiple Travel Brands and Product Offerings
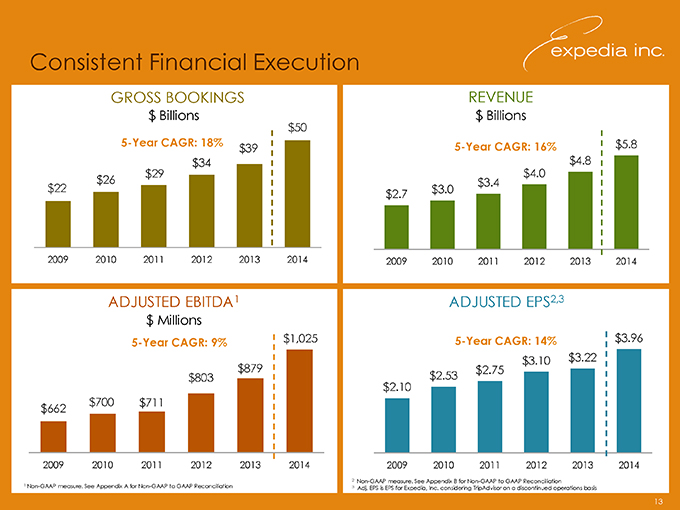
Consistent Financial Execution GROSS BOOKINGS REVENUE $ Billions $50 $ Billions 5-Year CAGR: 18% 5-Year CAGR: 16% $5.8 $39 $34 $4.8 $29 $4.0 $26 $3.4 $22 $3.0 $2.7 2009 2010 2011 2012 2013 2014 2009 2010 2011 2012 2013 2014 ADJUSTED EBITDA1 ADJUSTED EPS2,3 $ Millions 5-Year CAGR: 9% $1,025 5-Year CAGR: 14% $3.96 $879 $3.10 $3.22 $2.75 $803 $2.10 $2.53 $700 $711 $662 2009 2010 2011 2012 2013 2014 2009 2010 2011 2012 2013 2014 2 Non-GAAP measure. See Appendix B for Non-GAAP to GAAP Reconciliation 1 Non-GAAP measure. See Appendix A for Non-GAAP to GAAP Reconciliation 3 Adj. EPS is EPS for Expedia, Inc. considering TripAdvisor on a discontinued operations basis
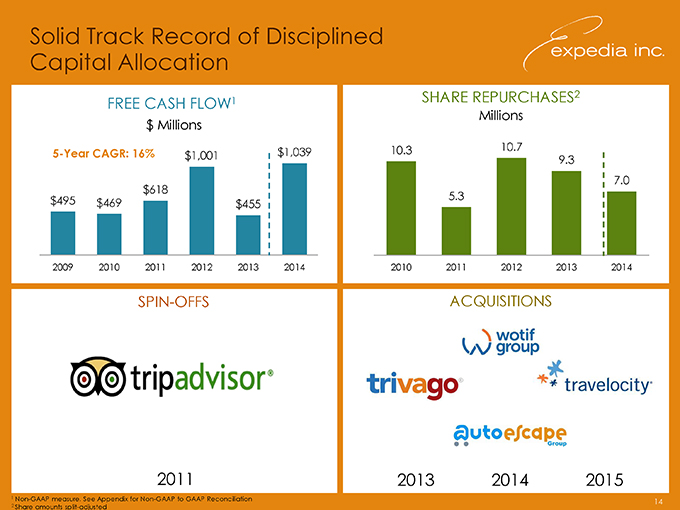
Solid Track Record of Disciplined Capital Allocation SHARE REPURCHASES2 FREE CASH FLOW1 Millions $ Millions $1,039 10.3 10.7 5-Year CAGR: 16% $1,001 9.3 7.0 $618 $495 5.3 $469 $455 2009 2010 2011 2012 2013 2014 2010 2011 2012 2013 2014 SPIN-OFFS ACQUISITIONS 2011 2013 2014 2015

Investment Highlights Global Leader in ~$1.3 Trillion Market with Strong Offline-to-Online Trends Significant Growth Opportunities Across Geographies Rapid Expansion in Highly Fragmented Hotel Industry Supported by Multi-Product Offering Technology Platform Innovation Driving Higher Conversion A Growth Success in Growing Mobile Channels Company High Growth Advertising & Media Business Consistent financial execution Solid Track Record of Disciplined Capital Allocation

APPENDICES
Non-GAAP Definitions Adjusted EBITDA is defined as operating income plus: (1) stock-based compensation expense, including compensation expense related to certain subsidiary equity plans; (2) acquisition-related impacts, including (i) amortization of intangible assets and goodwill and intangible asset impairment, (ii) gains (losses) recognized on changes in the value of contingent consideration arrangements; and (iii) upfront consideration paid to settle employee compensation plans of the acquiree; (3) certain infrequently occurring items, including restructuring; (4) items included in Legal reserves, occupancy tax and other, which includes reserves for potential settlement of issues related to transactional taxes (e.g. hotel and excise taxes), related to court decisions and final settlements, and charges incurred, if any, for monies that may be required to be paid in advance of litigation in certain transactional tax proceedings; (5) gains (losses) realized on revenue hedging activities that are included in other, net; and (6) depreciation. The above items are excluded from our Adjusted EBITDA measure because these items are noncash in nature, or because the amount and timing of these items is unpredictable, not driven by core operating results and renders comparisons with prior periods and competitors less meaningful. We believe Adjusted EBITDA is a useful measure for analysts and investors to evaluate our future ongoing performance as this measure allows a more meaningful comparison of our performance and projected cash earnings with our historical results from prior periods and to the results of our competitors. Moreover, our management uses this measure internally to evaluate the performance of our business as a whole and our individual business segments. In addition, we believe that by excluding certain items, such as stock-based compensation and acquisition-related impacts, Adjusted EBITDA corresponds more closely to the cash operating income generated from our business and allows investors to gain an understanding of the factors and trends affecting the ongoing cash earnings capabilities of our business, from which capital investments are made and debt is serviced. Adjusted EPS is defined as Adjusted Net Income divided by adjusted weighted average shares outstanding, which include dilution from options and warrants per the treasury stock method and include all shares relating to RSUs in shares outstanding for Adjusted EPS. This differs from the GAAP method for including RSUs, which treats them on a treasury method basis. Shares outstanding for Adjusted EPS purposes are therefore higher than shares outstanding for GAAP EPS purposes. We believe Adjusted EPS is useful to investors because it represents, on a per share basis, Expedia’s consolidated results, taking into account depreciation, which we believe is an ongoing cost of doing business, as well as other items which are not allocated to the operating businesses such as interest expense, taxes, foreign exchange gains or losses, and minority interest, but excluding the effects of certain expenses not directly tied to the core operations of our businesses. Adjusted Net Income and Adjusted EPS have similar limitations as Adjusted EBITDA. In addition, Adjusted Net Income does not include all items that affect our net income / (loss) and net income / (loss) per share for the period. Therefore, we think it is important to evaluate these measures along with our consolidated statements of operations.
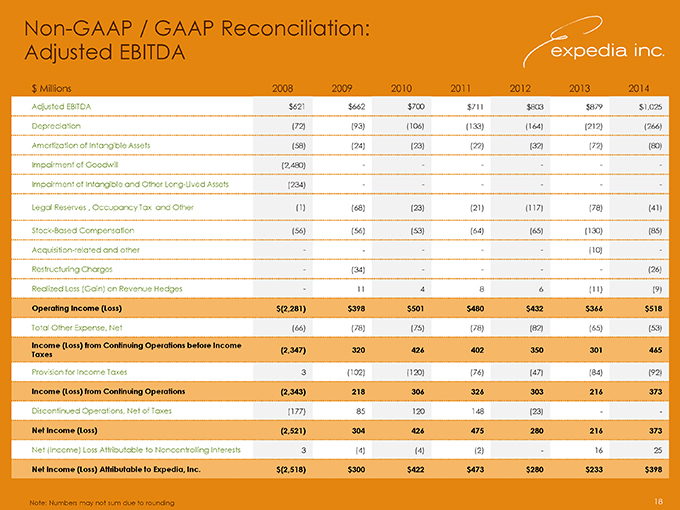
Non-GAAP / GAAP Reconciliation: Adjusted EBITDA $ Millions 2008 2009 2010 2011 2012 2013 2014 Adjusted EBITDA $621 $662 $700 $711 $803 $879 $1,025 Depreciation (72) (93) (106) (133) (164) (212) (266) Amortization of Intangible Assets (58) (24) (23) (22) (32) (72) (80) Impairment of Goodwill (2,480) — — — Impairment of Intangible and Other Long-Lived Assets (234) — — — Legal Reserves , Occupancy Tax and Other (1) (68) (23) (21) (117) (78) (41) Stock-Based Compensation (56) (56) (53) (64) (65) (130) (85) Acquisition-related and other — ——(10)—Restructuring Charges—(34) — — (26) Realized Loss (Gain) on Revenue Hedges—11 4 8 6 (11) (9) Operating Income (Loss) $(2,281) $398 $501 $480 $432 $366 $518 Total Other Expense, Net (66) (78) (75) (78) (82) (65) (53) Income (Loss) from Continuing Operations before Income (2,347) 320 426 402 350 301 465 Taxes Provision for Income Taxes 3 (102) (120) (76) (47) (84) (92) Income (Loss) from Continuing Operations (2,343) 218 306 326 303 216 373 Discontinued Operations, Net of Taxes (177) 85 120 148 (23) — Net Income (Loss) (2,521) 304 426 475 280 216 373 Net (Income) Loss Attributable to Noncontrolling Interests 3 (4) (4) (2)—16 25 Net Income (Loss) Attributable to Expedia, Inc. $(2,518) $300 $422 $473 $280 $233 $398
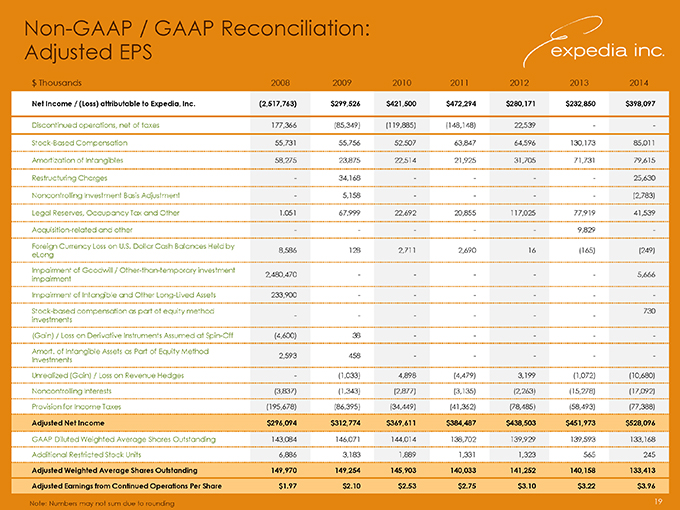
Non-GAAP / GAAP Reconciliation: Adjusted EPS $ Thousands 2008 2009 2010 2011 2012 2013 2014 Net Income / (Loss) attributable to Expedia, Inc. (2,517,763) $299,526 $421,500 $472,294 $280,171 $232,850 $398,097 Discontinued operations, net of taxes 177,366 (85,349) (119,885) (148,148) 22,539 — Stock-Based Compensation 55,731 55,756 52,507 63,847 64,596 130,173 85,011 Amortization of Intangibles 58,275 23,875 22,514 21,925 31,705 71,731 79,615 Restructuring Charges— 34,168— ——25,630 Noncontrolling Investment Basis Adjustment— 5,158— ——(2,783) Legal Reserves, Occupancy Tax and Other 1.051 67,999 22,692 20,855 117,025 77,919 41,539 Acquisition-related and other — ——9,829— Foreign Currency Loss on U.S. Dollar Cash Balances Held by 8,586 128 2,711 2,690 16 (165) (249) eLong Impairment of Goodwill / Other-than-temporary investment 2,480,470— — ——5,666 impairment Impairment of Intangible and Other Long-Lived Assets 233,900— — — — Stock-based compensation as part of equity method 730 — — — investments (Gain) / Loss on Derivative Instruments Assumed at Spin-Off (4,600) 38— — — Amort. of Intangible Assets as Part of Equity Method 2,593 458— — — Investments Unrealized (Gain) / Loss on Revenue Hedges— (1,033) 4,898 (4,479) 3,199 (1,072) (10,680) Noncontrolling Interests (3,837) (1,343) (2,877) (3,135) (2,263) (15,278) (17,092) Provision for Income Taxes (195,678) (86,395) (34,449) (41,362) (78,485) (58,493) (77,388) Adjusted Net Income $296,094 $312,774 $369,611 $384,487 $438,503 $451,973 $528,096 GAAP Diluted Weighted Average Shares Outstanding 143,084 146,071 144,014 138,702 139,929 139,593 133,168 Additional Restricted Stock Units 6,886 3,183 1,889 1,331 1,323 565 245 Adjusted Weighted Average Shares Outstanding 149,970 149,254 145,903 140,033 141,252 140,158 133,413 Adjusted Earnings from Continued Operations Per Share $1.97 $2.10 $2.53 $2.75 $3.10 $3.22 $3.96
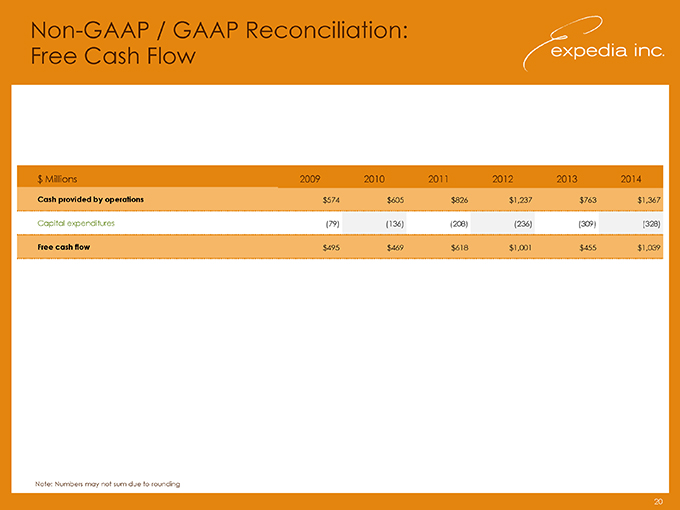
Non-GAAP / GAAP Reconciliation: Free Cash Flow $ Millions 2009 2010 2011 2012 2013 2014 Cash provided by operations $574 $605 $826 $1,237 $763 $1,367 Capital expenditures (79) (136) (208) (236) (309) (328) Free cash flow $495 $469 $618 $1,001 $455 $1,039