Attached files
| file | filename |
|---|---|
| 8-K - 8-K - PACCAR INC | d860011d8k.htm |
Exhibit 99.1

|
PACCAR Inc | |||
| Public Affairs Department | ||||
| P.O. Box 1518 | ||||
| Bellevue, WA 98009
| ||||
| Contact: | Ken Hastings | |||
| (425) 468-7530 | ||||
FOR IMMEDIATE RELEASE
PACCAR Reports Record Annual Revenues
Strong North American Truck Market Generates Higher Profits
January 30, 2015, Bellevue, Washington – “PACCAR reported record annual revenues of $18.99 billion and net income of $1.36 billion for 2014. PACCAR achieved the second best annual net profit in the company’s history and the 76th consecutive year of net income,” said Ron Armstrong, chief executive officer. “PACCAR’s financial results reflect the company’s premium-quality products and services, increased North American truck deliveries, and growth in aftermarket parts revenues and PACCAR Financial Services assets. I am very proud of our 23,300 employees who have delivered outstanding performance to our shareholders and customers.”
“PACCAR’s excellent profits and strong cash flow have enabled the company to invest in new innovative premium vehicles, expand its aftermarket distribution centers and enhance its production facilities,” added Armstrong. “PACCAR’s North American customers are benefiting from good economic growth, record freight tonnage, lower fuel prices and the excellent operating efficiency of Kenworth’s and Peterbilt’s industry-leading trucks. U.S. and Canada Class 8 truck industry retail sales in 2014 of 250,000 vehicles were the highest since 2006.”
Record Revenues and Higher Net Income
PACCAR achieved record revenues of $18.99 billion in 2014 compared to revenues of $17.12 billion in 2013. PACCAR reported net income of $1.36 billion ($3.82 per diluted share) in 2014, an increase of 16 percent compared to $1.17 billion ($3.30 per diluted share) earned last year. Fourth quarter 2014 net sales and financial service revenues were a quarterly record $5.12 billion, an 11 percent increase, compared to $4.60 billion for the same period in 2013. PACCAR earned $394.3 million ($1.11 per diluted share) for the fourth quarter of 2014, an 18 percent increase, compared to $334.2 million ($.94 per diluted share) in the fourth quarter of 2013. Shareholders’ equity was $6.75 billion at December 31, 2014.
Increased Dividends and Stock Repurchases
PACCAR declared cash dividends of $1.86 per share during 2014, including a special dividend of $1.00 per share. Total dividends per share declared in 2014 increased by nine percent compared to 2013. PACCAR has paid a dividend every year since 1941. PACCAR’s total shareholder return was 18.2 percent during 2014. In the past ten years, PACCAR’s annual shareholder return has averaged 9.9 percent, compared to the S&P 500 Index annual return of 7.7 percent. PACCAR’s shareholder return has exceeded the S&P 500 Index return for the previous one-, five-, ten- and twenty-year periods.
PACCAR repurchased 731,000 of its common shares for $42.7 million in 2014. Under the current Board of Directors resolution authorizing $300 million of stock repurchases, PACCAR has repurchased 5.72 million shares for $234.7 million. “PACCAR’s excellent net profits and strong cash flow make the company’s shares an attractive long-term investment. The stock repurchase program reflects the Board’s confidence in PACCAR’s successful global business growth,” said Bob Christensen, PACCAR president and chief financial officer.
Business Highlights – 2014
| • | PACCAR delivered 142,900 vehicles worldwide. |
| • | Peterbilt celebrated its 75-year anniversary and Kenworth delivered its one millionth truck. |
| • | DAF’s cab factory in Westerlo, Belgium, produced its one millionth DAF cab. |
| • | PACCAR Parts opened a new Parts Distribution Center (PDC) in Montreal, Canada, and celebrated the 20-year anniversary of the TRP all-makes aftermarket parts program. |
| • | PACCAR’s engine factory in Columbus, Mississippi, and Peterbilt’s truck factory in Denton, Texas, earned Frost & Sullivan’s Manufacturing Leadership Awards. |
| • | Kenworth’s T880 truck, equipped with the PACCAR MX-13 engine, earned “2015 Truck of the Year” from the American Truck Dealers. |
| • | DAF was awarded “Manufacturer of the Year” in the United Kingdom by GreenFleet magazine. |
| • | PACCAR was recognized as a technology leader by InformationWeek magazine’s “2014 Elite 100 Companies.” |
| • | PACCAR invested $438.7 million in capital projects and research and development. |
| • | PACCAR has implemented over 26,000 Six Sigma projects since 1997. |
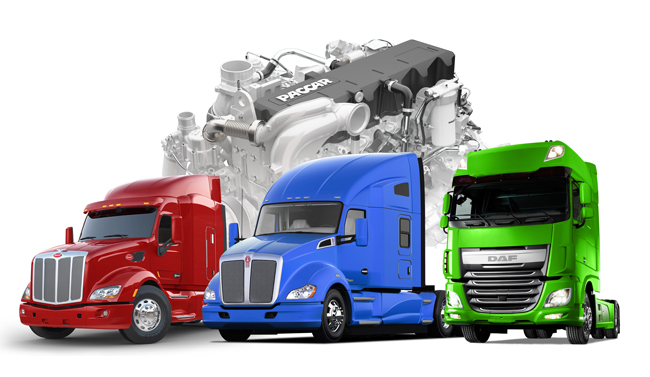
Peterbilt Model 579, Kenworth T680, DAF XF Euro 6 and PACCAR MX-13 Engine
Financial Highlights – Fourth Quarter 2014
Highlights of PACCAR’s financial results during the fourth quarter of 2014 include:
| • | Record quarterly consolidated net sales and revenues of $5.12 billion. |
| • | Net income of $394.3 million. |
| • | Cash provided by operations of $522.0 million. |
| • | Financial Services pretax income of $96.3 million. |
| • | Research and development expenses of $62.5 million. |
| • | Capital investments of $62.6 million. |
| • | Manufacturing cash and marketable securities of $2.94 billion at December 31, 2014. |
Financial Highlights – Full Year 2014
Highlights of PACCAR’s financial results during 2014 include:
| • | Record consolidated net sales and revenues of $18.99 billion. |
| • | Net income of $1.36 billion. |
| • | Record year-end shareholders’ equity of $6.75 billion. |
| • | Cash provided by operations of $2.12 billion. |
| • | Record PACCAR Parts revenues of $3.08 billion and pretax income of $496.7 million. |
| • | Record Financial Services pretax income of $370.4 million on assets of $11.92 billion. |
| • | Medium-term note (MTN) issuances of $1.58 billion. |
| • | Dividends declared of $660.1 million. |
Global Truck Markets
“Class 8 truck industry retail sales in the U.S. and Canada were 250,000 units in 2014, compared to the 212,000 vehicles sold in 2013,” said Dan Sobic, PACCAR executive vice president. “Truck demand is being driven by the improving economy and fleet expansion. In 2014, PACCAR achieved a Class 8 retail market share in the U.S. and Canada of 27.9 percent as customers benefited from Kenworth and Peterbilt vehicles’ excellent fuel efficiency and outstanding vehicle performance. Estimates for U.S. and Canada Class 8 truck industry retail sales in 2015 are in the range of 250,000-280,000 units, driven by further expansion of truck industry fleet capacity and economic growth,” added Sobic.
DAF is a leader in the European tractor market and is the overall market share leader in the U.K., the Netherlands and Hungary. “Our customers recognize DAF’s quality leadership, low operating costs and superior driver comfort,” said Harrie Schippers, DAF president. “Industry sales above 16-tonnes in Europe were 227,000 units in 2014 and DAF’s market share was 13.8 percent. It is estimated that European truck industry sales in the above 16-tonne market in 2015 will be in a range of 200,000-240,000 vehicles.”
DAF continues to review and prepare a response to the Statement of Objections issued by the European Commission in November 2014. The Statement expressed its preliminary view that all major European medium- and heavy-duty truck manufacturers had participated in anticompetitive practices in the European Union. The Commission indicated that it will seek to impose significant fines on the manufacturers. The Commission will review the manufacturers’ responses before issuing a decision. Any decision would be subject to appeal. The Company is unable to predict the outcome of this proceeding or to estimate the potential fine at this time.
Heavy-duty truck industry sales for South America in 2014 were 129,000 trucks. Heavy-duty truck industry sales in 2015 are estimated to be in a range of 110,000-130,000 units. “PACCAR delivered 3,600 vehicles in South America in 2014, a 37 percent increase compared to 2013. The production of DAF trucks in Brasil and the continued growth of the DAF Brasil dealer network will further enhance PACCAR’s vehicle sales in South America,” said Sam Means, PACCAR vice president.
Kenworth Celebrates One Millionth Truck Delivery
Kenworth produced its one millionth truck at its Chillicothe, Ohio, assembly facility in November. The truck was an aerodynamic Kenworth T680 Advantage powered by a PACCAR MX-13 engine. Kenworth employees celebrated the vehicle presentation to TransAm Trucking of Olathe, Kansas. “The production and delivery of our one millionth truck highlights another outstanding year for Kenworth. Everyone on the Kenworth team, since the company was founded in 1923, contributed to this milestone,” said Preston Feight, Kenworth general manager and PACCAR vice president.
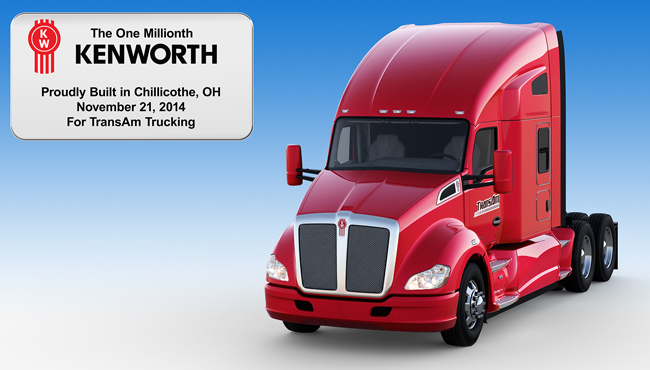
Kenworth Celebrates Production of One Millionth Truck
DAF Enhances Vehicle Transport Efficiency Leadership
DAF’s new Transport Efficiency program introduced several innovations that enhance vehicle performance and deliver fuel savings of up to five percent. Ron Bonsen, DAF sales director, said, “The PACCAR MX-13 and MX-11 engines have incorporated new technologies, including a more powerful engine brake, updated turbo, optimized fuel injection and enhanced software. The innovative Driver Performance Assistant, installed in the dash, increases fuel economy by displaying comprehensive feedback on fuel consumption and braking performance to the driver. Predictive Cruise Control uses advanced GPS technology to anticipate changes in road grades, while Predictive Shifting selects the ideal gear.”
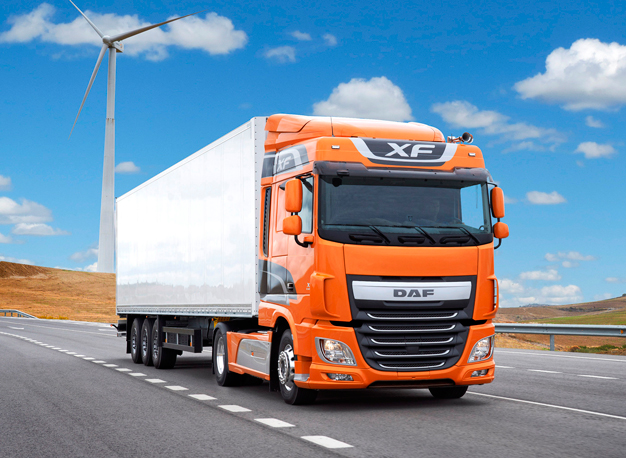
DAF XF with Transport Efficiency Technologies
Environmental Leadership
PACCAR is an environmental leader with its energy-efficient vehicles and manufacturing facilities. Kenworth, Peterbilt and DAF invest in industry-leading products and services to enable our customers to enhance the performance of their businesses. DAF was honored as “Manufacturer of the Year” by the U.K.’s GreenFleet magazine in 2014. DAF won the award for its exceptional Euro 6 design including the innovative Driver Performance Assistant. The GreenFleet Awards are held annually to recognize individuals and organizations who create innovative solutions to reduce the environmental impact of fleet transportation.
PACCAR Parts Achieves Record Revenues and Profit
“PACCAR’s aftermarket parts business achieved record annual revenues of $3.08 billion and pretax profit of $496.7 million in 2014,” said David Danforth, PACCAR Parts general manager and PACCAR vice president. “The growth in PACCAR’s aftermarket parts business has been driven by investments in distribution, technology and products. PACCAR Parts’ global TRP brand, targeted at all makes and models of trucks, trailers and buses, has contributed to increased parts business at our dealerships. Improving fleet utilization and the age of the North American truck fleet are also contributing to excellent parts and service business.”
“PACCAR’s 17 parts distribution centers support over 2,000 DAF, Kenworth and Peterbilt dealer locations to deliver industry-leading customer service,” added Danforth. “PACCAR opened a new distribution center in Montreal, Canada in 2014 and began construction of a new distribution center in Renton, Washington.”
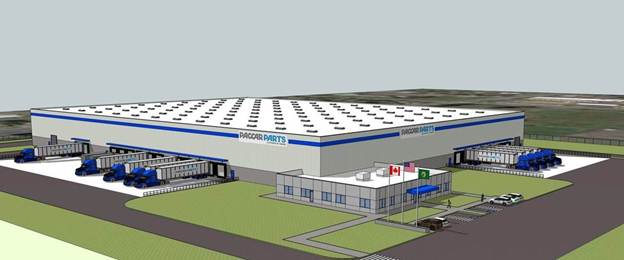
PACCAR Parts’ 160,000-square-foot Distribution Center in Renton, Washington
(Architectural Drawing)
PACCAR Engine Update
“PACCAR has installed over 75,000 PACCAR MX-13 engines in Kenworth and Peterbilt trucks in North America since the start of engine production in mid-2010,” said Craig Brewster, PACCAR vice president. “In the fourth quarter of 2014, the PACCAR MX-13 engine was installed in 37 percent of Kenworth and Peterbilt heavy-duty trucks.” Ron Borsboom, DAF director of engineering, added, “The PACCAR MX-11 engine, with an output of up to 440 hp and torque of 1,550 lb-ft., has been well-received by DAF customers, who appreciate the engine’s light weight, quietness, excellent fuel efficiency and reliability.”
Capital Investments Enhance Product Development and Operating Efficiency
PACCAR’s excellent long-term profits, strong balance sheet, and intense focus on quality, technology and productivity have enabled the company to invest $5.8 billion in world-class facilities, innovative products and new technologies during the past decade. “In 2014, capital of $223.1 million and R&D expenses of $215.6 million were invested in new products and increased manufacturing capacity,” said George West, PACCAR vice president. In 2015, capital expenditures of $300-$350 million are targeted for enhanced powertrain development and increased operating efficiency of company factories and distribution centers. Research and development expenses are estimated at $220-$260 million in 2015.
Financial Services Companies Achieve Record Annual Results
PACCAR Financial Services (PFS) has a portfolio of 166,000 trucks and trailers, with total assets of $11.92 billion. PacLease, a major full-service truck leasing company in North America and Europe with a fleet of over 38,000 vehicles, is included in this segment. “PFS profit increased due to higher asset balances and excellent portfolio performance in 2014,” said Bob Bengston, PACCAR senior vice president. PFS achieved fourth quarter 2014 pretax income of $96.3 million compared to $90.4 million earned in the fourth quarter of 2013. Fourth quarter 2014 revenues were $302.0 million compared to $299.5 million in the same quarter of 2013. For the full year, Financial Services pretax income was a record $370.4 million, an increase of nine percent compared to $340.2 million in 2013. Full year revenues were $1.20 billion compared to $1.17 billion for the same period a year ago.
“PACCAR’s excellent balance sheet, complemented by its A+/A1 credit ratings, enables PFS to offer competitive retail financing to Kenworth, Peterbilt and DAF dealers and customers in 22 countries on four continents,” said Todd Hubbard, PACCAR Financial Corp. president. PACCAR Financial Services has excellent access to the debt markets, issuing $1.58 billion in three-, four- and five-year term notes during 2014.
PACCAR is a global technology leader in the design, manufacture and customer support of high-quality light-, medium- and heavy-duty trucks under the Kenworth, Peterbilt and DAF nameplates. PACCAR also designs and manufactures advanced diesel engines, provides financial services and information technology, and distributes truck parts related to its principal business.
PACCAR will hold a conference call with securities analysts to discuss fourth quarter earnings on January 30, 2015, at 9:00 a.m. Pacific time. Interested parties may listen to the call by selecting “Q4 Webcast” at PACCAR’s homepage. The Webcast will be available on a recorded basis through February 6, 2015. PACCAR shares are traded on the Nasdaq Global Select Market, symbol PCAR. Its homepage is www.paccar.com.
This release contains “forward-looking statements” within the meaning of the Private Securities Litigation Reform Act. These statements are based on management’s current expectations and are subject to uncertainty and changes in circumstances. Actual results may differ materially from those included in these statements due to a variety of factors. More information about these factors is contained in PACCAR’s filings with the Securities and Exchange Commission.
# # #
PACCAR Inc
SUMMARY INCOME STATEMENTS
(in millions except per share amounts)
| Three Months Ended | Twelve Months Ended | |||||||||||||||
| December 31 | December 31 | |||||||||||||||
| 2014 | 2013 | 2014 | 2013 | |||||||||||||
| Truck, Parts and Other: |
||||||||||||||||
| Net sales and revenues |
$ | 4,817.1 | $ | 4,299.4 | $ | 17,792.8 | $ | 15,948.9 | ||||||||
| Cost of sales and revenues |
4,160.4 | 3,725.7 | 15,481.6 | 13,900.7 | ||||||||||||
| Research and development |
62.5 | 60.9 | 215.6 | 251.4 | ||||||||||||
| Selling, general and administrative |
116.6 | 124.2 | 465.2 | 465.3 | ||||||||||||
| Interest and other expense, net |
1.5 | .9 | 5.5 | 5.3 | ||||||||||||
|
|
|
|
|
|
|
|
|
|||||||||
| Truck, Parts and Other Income Before Income Taxes |
476.1 | 387.7 | 1,624.9 | 1,326.2 | ||||||||||||
| Financial Services: |
||||||||||||||||
| Revenues |
302.0 | 299.5 | 1,204.2 | 1,174.9 | ||||||||||||
| Interest and other |
179.3 | 188.2 | 722.2 | 727.6 | ||||||||||||
| Selling, general and administrative |
23.5 | 23.4 | 96.2 | 94.2 | ||||||||||||
| Provision for losses on receivables |
2.9 | (2.5 | ) | 15.4 | 12.9 | |||||||||||
|
|
|
|
|
|
|
|
|
|||||||||
| Financial Services Income Before Income Taxes |
96.3 | 90.4 | 370.4 | 340.2 | ||||||||||||
| Investment income |
5.3 | 6.8 | 22.3 | 28.6 | ||||||||||||
|
|
|
|
|
|
|
|
|
|||||||||
| Total Income Before Income Taxes |
577.7 | 484.9 | 2,017.6 | 1,695.0 | ||||||||||||
| Income taxes |
183.4 | 150.7 | 658.8 | 523.7 | ||||||||||||
|
|
|
|
|
|
|
|
|
|||||||||
| Net Income |
$ | 394.3 | $ | 334.2 | $ | 1,358.8 | $ | 1,171.3 | ||||||||
|
|
|
|
|
|
|
|
|
|||||||||
| Net Income Per Share: |
||||||||||||||||
| Basic |
$ | 1.11 | $ | .94 | $ | 3.83 | $ | 3.31 | ||||||||
|
|
|
|
|
|
|
|
|
|||||||||
| Diluted |
$ | 1.11 | $ | .94 | $ | 3.82 | $ | 3.30 | ||||||||
|
|
|
|
|
|
|
|
|
|||||||||
| Weighted Average Shares Outstanding: |
||||||||||||||||
| Basic |
354.7 | 354.6 | 355.0 | 354.2 | ||||||||||||
|
|
|
|
|
|
|
|
|
|||||||||
| Diluted |
355.8 | 355.6 | 356.1 | 355.2 | ||||||||||||
|
|
|
|
|
|
|
|
|
|||||||||
| Dividends declared per share |
$ | 1.22 | $ | 1.10 | $ | 1.86 | $ | 1.70 | ||||||||
|
|
|
|
|
|
|
|
|
|||||||||
PACCAR Inc
CONDENSED BALANCE SHEETS
(in millions)
| December 31 2014 |
December 31 2013 |
|||||||
| ASSETS |
||||||||
| Truck, Parts and Other: |
||||||||
| Cash and marketable debt securities |
$ | 2,937.1 | $ | 2,925.2 | ||||
| Trade and other receivables, net |
1,047.1 | 1,019.6 | ||||||
| Inventories, net |
925.7 | 813.6 | ||||||
| Property, plant and equipment, net |
2,313.3 | 2,513.3 | ||||||
| Equipment on operating leases and other, net |
1,478.3 | 1,823.7 | ||||||
| Financial Services Assets |
11,917.3 | 11,630.1 | ||||||
|
|
|
|
|
|||||
| $ | 20,618.8 | $ | 20,725.5 | |||||
|
|
|
|
|
|||||
| LIABILITIES AND STOCKHOLDERS’ EQUITY |
||||||||
| Truck, Parts and Other: |
||||||||
| Accounts payable, deferred revenues and other |
$ | 4,341.3 | $ | 4,302.0 | ||||
| Current portion of long-term debt |
150.0 | |||||||
| Financial Services Liabilities |
9,524.3 | 9,639.2 | ||||||
| STOCKHOLDERS’ EQUITY |
6,753.2 | 6,634.3 | ||||||
|
|
|
|
|
|||||
| $ | 20,618.8 | $ | 20,725.5 | |||||
|
|
|
|
|
|||||
| Common Shares Outstanding |
355.2 | 354.3 | ||||||
|
|
|
|
|
|||||
PACCAR Inc
CONDENSED CASH FLOW STATEMENTS
(in millions)
| Twelve Months Ended December 31 |
2014 | 2013 | ||||||
| OPERATING ACTIVITIES: |
||||||||
| Net income |
$ | 1,358.8 | $ | 1,171.3 | ||||
| Depreciation and amortization: |
||||||||
| Property, plant and equipment |
285.2 | 210.7 | ||||||
| Equipment on operating leases and other |
632.5 | 600.0 | ||||||
| Net change in trade receivables, inventory and payables |
(8.5 | ) | 86.2 | |||||
| Net increase in wholesale receivables on new trucks |
(232.8 | ) | (82.5 | ) | ||||
| All other operating activities, net |
88.4 | 390.0 | ||||||
|
|
|
|
|
|||||
| Net Cash Provided by Operating Activities |
2,123.6 | 2,375.7 | ||||||
| INVESTING ACTIVITIES: |
||||||||
| Payments for property, plant and equipment |
(298.2 | ) | (510.6 | ) | ||||
| Acquisitions of equipment for operating leases |
(1,239.1 | ) | (1,362.2 | ) | ||||
| Net increase in financial services receivables |
(265.5 | ) | (517.1 | ) | ||||
| Net increase in marketable securities |
(124.6 | ) | (101.2 | ) | ||||
| Proceeds from asset disposals |
395.5 | 340.1 | ||||||
|
|
|
|
|
|||||
| Net Cash Used in Investing Activities |
(1,531.9 | ) | (2,151.0 | ) | ||||
| FINANCING ACTIVITIES: |
||||||||
| Payments of cash dividends |
(623.8 | ) | (283.1 | ) | ||||
| Purchases of treasury stock |
(42.7 | ) | ||||||
| Proceeds from stock compensation transactions |
29.1 | 31.0 | ||||||
| Net increase in debt |
116.9 | 525.9 | ||||||
|
|
|
|
|
|||||
| Net Cash (Used in) Provided by Financing Activities |
(520.5 | ) | 273.8 | |||||
| Effect of exchange rate changes on cash |
(83.7 | ) | (20.8 | ) | ||||
|
|
|
|
|
|||||
| Net (Decrease) Increase in Cash and Cash Equivalents |
(12.5 | ) | 477.7 | |||||
| Cash and cash equivalents at beginning of period |
1,750.1 | 1,272.4 | ||||||
|
|
|
|
|
|||||
| Cash and cash equivalents at end of period |
$ | 1,737.6 | $ | 1,750.1 | ||||
|
|
|
|
|
|||||
PACCAR Inc
SEGMENT AND OTHER INFORMATION
(in millions)
| Three Months Ended | Twelve Months Ended | |||||||||||||||
| December 31 | December 31 | |||||||||||||||
| 2014 | 2013 | 2014 | 2013 | |||||||||||||
| Sales and Revenues: |
||||||||||||||||
| Truck |
$ | 3,999.2 | $ | 3,538.4 | $ | 14,594.0 | $ | 13,002.9 | ||||||||
| Parts |
788.7 | 730.0 | 3,077.5 | 2,822.2 | ||||||||||||
| Financial Services |
302.0 | 299.5 | 1,204.2 | 1,174.9 | ||||||||||||
| Other |
29.2 | 31.0 | 121.3 | 123.8 | ||||||||||||
|
|
|
|
|
|
|
|
|
|||||||||
| $ | 5,119.1 | $ | 4,598.9 | $ | 18,997.0 | $ | 17,123.8 | |||||||||
|
|
|
|
|
|
|
|
|
|||||||||
| Pretax Profit: |
||||||||||||||||
| Truck |
$ | 358.2 | $ | 290.8 | $ | 1,160.1 | $ | 936.7 | ||||||||
| Parts |
130.0 | 104.8 | 496.7 | 416.0 | ||||||||||||
| Financial Services |
96.3 | 90.4 | 370.4 | 340.2 | ||||||||||||
| Investment Income and Other |
(6.8 | ) | (1.1 | ) | (9.6 | ) | 2.1 | |||||||||
|
|
|
|
|
|
|
|
|
|||||||||
| $ | 577.7 | $ | 484.9 | $ | 2,017.6 | $ | 1,695.0 | |||||||||
|
|
|
|
|
|
|
|
|
|||||||||
|
GEOGRAPHIC REVENUE
(in millions)
|
| |||||||||||||||
| Three Months Ended | Twelve Months Ended | |||||||||||||||
| December 31 | December 31 | |||||||||||||||
| 2014 | 2013 | 2014 | 2013 | |||||||||||||
| United States and Canada |
$ | 3,088.8 | $ | 2,413.6 | $ | 11,581.8 | $ | 9,528.7 | ||||||||
| Europe |
1,312.5 | 1,587.2 | 4,835.7 | 4,967.2 | ||||||||||||
| Other |
717.8 | 598.1 | 2,579.5 | 2,627.9 | ||||||||||||
|
|
|
|
|
|
|
|
|
|||||||||
| $ | 5,119.1 | $ | 4,598.9 | $ | 18,997.0 | $ | 17,123.8 | |||||||||
|
|
|
|
|
|
|
|
|
|||||||||