Attached files
| file | filename |
|---|---|
| 8-K - CURRENT REPORT - Vista Outdoor Inc. | form8k.htm |
Exhibit 99.1

VISTA OUTDOOR Management Presentation JANUARY 29 – FEBRUARY 6, 2015
Forward Looking Statements This presentation contains forward-looking statements within the meaning of the Private Securities Litigation Reform Act of 1995; particularly statements regarding future financial and operating results of Vista Outdoor Inc. (the “Company”) and its business. These statements are based on management’s current expectations or beliefs, and are subject to uncertainty and changes in circumstances. Actual results may vary materially from those expressed or implied by the statements in this presentation due to changes in economic, business, competitive, technological, strategic and/or regulatory factors, and other factors affecting the operation of the Company’s business. More detailed information about these factors may be found in the Company’s filings with the Securities and Exchange Commission, including the Company’s Registration Statement on Form 10 and Current Reports on Form 8-K. The Company is under no obligation to, and expressly disclaims any such obligation to, update or alter its forward-looking statements, whether as a result of new information, future events or otherwise. Non-GAAP Measures Non-GAAP financial measures such as earnings before depreciation and amortization (“EBITDA”), Adjusted EBITDA and Adjusted EBITDA – Capex as included in this Presentation, are supplemental measures that are not calculated in accordance with Generally Accepted Accounting Principles (“GAAP”). We define Adjusted EBITDA as EBITDA adjusted for asset impairments, restructuring and severance costs, gains or losses on operating assets, and external costs related to mergers, acquisitions or dispositions. We believe that the presentation of EBITDA, Adjusted EBITDA and Adjusted EBITDA – Capex helps investors analyze underlying trends in our business, evaluate the performance of our business both on an absolute basis and relative to our peers and the broader market, provides useful information to both management and investors by excluding certain items that may not be indicative of the core operating results and operational strength of our business and helps investors evaluate our ability to service our debt. Please see the Appendix hereto for reconciliations of these Non-GAAP financial measures to their comparable GAAP financial measures. These non-GAAP financial measures have limitations as analytical and comparative tools and you should consider EBITDA, Adjusted EBITDA and Adjusted EBITDA – Capex in addition to, and not as a substitute for, operating income or any other measure of financial performance or liquidity reported in accordance with GAAP. Throughout the presentation, certain numbers will not sum to the total due to rounding. Non-Solicitation This communication shall not constitute an offer to sell or the solicitation of an offer to buy any securities, nor shall there be any sale of securities in any jurisdiction in which such offer, solicitation or sale would be unlawful. No offer of securities shall be made except by means of a prospectus meeting the requirements of Section 10 of the Securities Act of 1933, as amended.

Today’s Presenters and Agenda Mark DeYoung Chairman & CEO Stephen Nolan SVP, CFO Agenda Business Overview Key Growth Strategies Financial Overview Conclusion Appendix
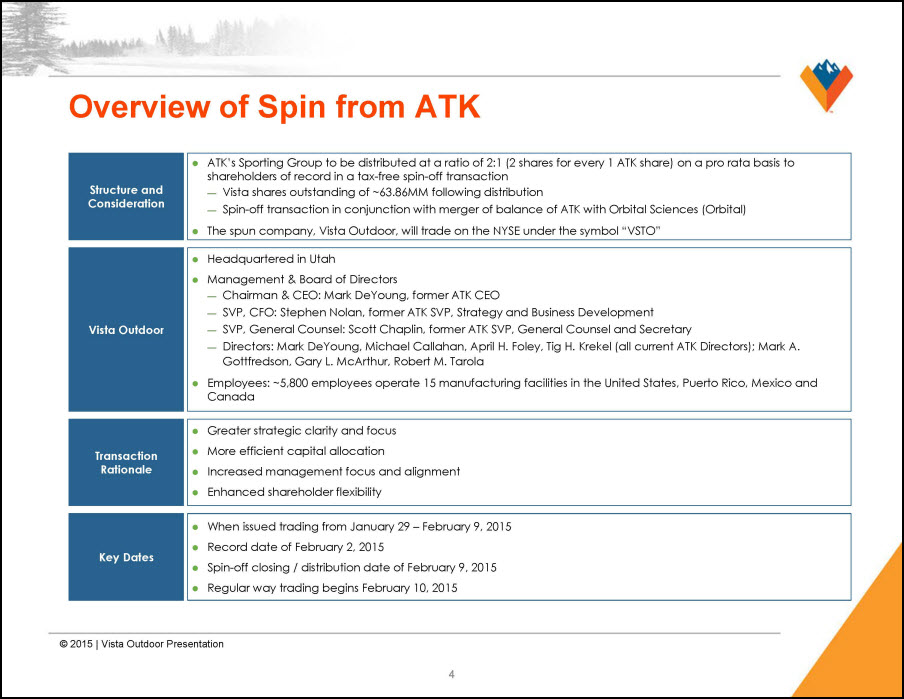
Overview of Spin from ATK Structure and Consideration ATK’s Sporting Group to be distributed at a ratio of 2:1 (2 shares for every 1 ATK share) on a pro rata basis to shareholders of record in a tax-free spin-off transaction Vista shares outstanding of ~63.86MM following distribution Spin-off transaction in conjunction with merger of balance of ATK with Orbital Sciences (Orbital) The spun company, Vista Outdoor, will trade on the NYSE under the symbol “VSTO” Vista Outdoor Headquartered in Utah Management & Board of Directors Chairman & CEO: Mark DeYoung, former ATK CEO SVP, CFO: Stephen Nolan, former ATK SVP, Strategy and Business Development SVP, General Counsel: Scott Chaplin, former ATK SVP, General Counsel and Secretary Directors: Mark DeYoung, Michael Callahan, April H. Foley, Tig H. Krekel (all current ATK Directors); Mark A. Gottfredson, Gary L. McArthur, Robert M. Tarola Employees: ~5,800 employees operate 15 manufacturing facilities in the United States, Puerto Rico, Mexico and Canada Transaction Rationale Greater strategic clarity and focus More efficient capital allocation Increased management focus and alignment Enhanced shareholder flexibility Key Dates When issued trading from January 29 – February 9, 2015 Record date of February 2, 2015 Spin-off closing / distribution date of February 9, 2015 Regular way trading begins February 10, 2015
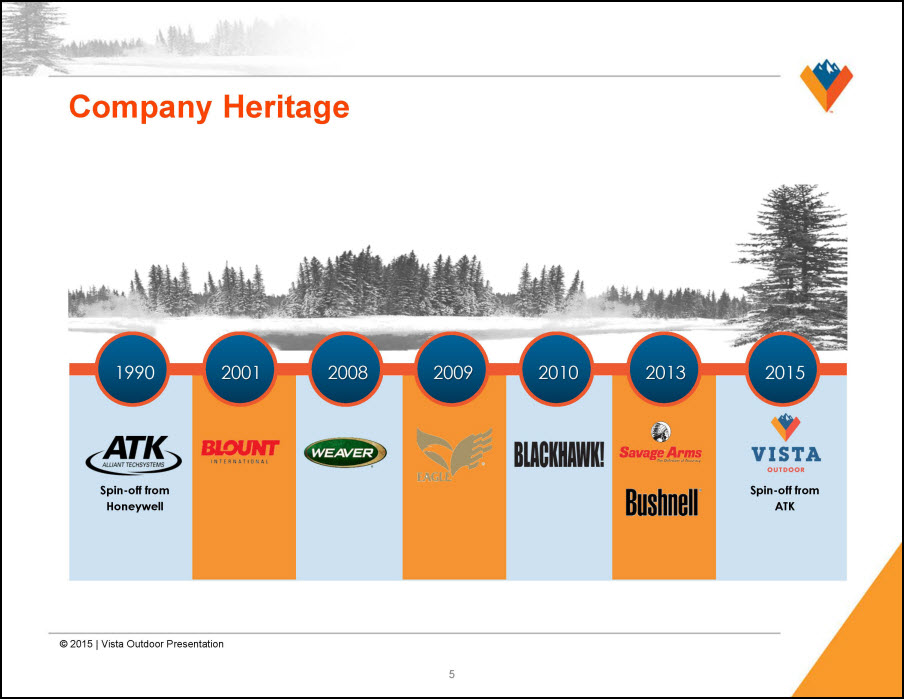
Company Heritage 1990 2001 2008 2009 2010 2013 2015 ATK Alliant Techsystems Blount International Weaver Eagle Blackhawk! Savage Arms Bushnell Vista Outdoor Spin-off from Honeywell Spin-off from ATK

Section 1 Business Overview Vista Outdoor
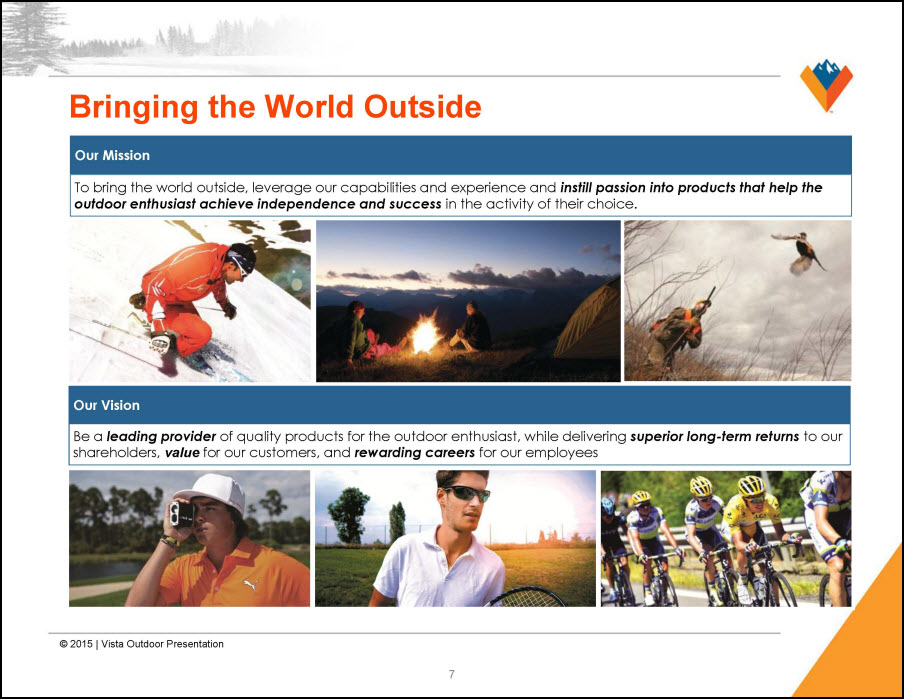
Bringing the World Outside Our Mission To bring the world outside, leverage our capabilities and experience and instill passion into products that help the outdoor enthusiast achieve independence and success in the activity of their choice. Our Vision Be a leading provider of quality products for the outdoor enthusiast, while delivering superior long-term returns to our shareholders, value for our customers, and rewarding careers for our employees
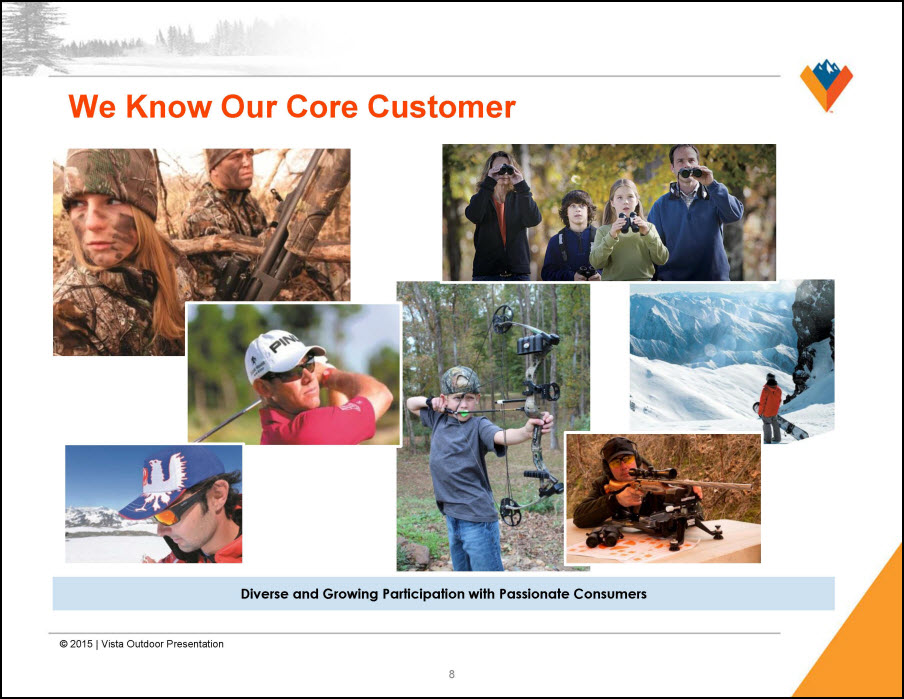
We Know Our Core Customer Diverse and Growing Participation with Passionate Consumers
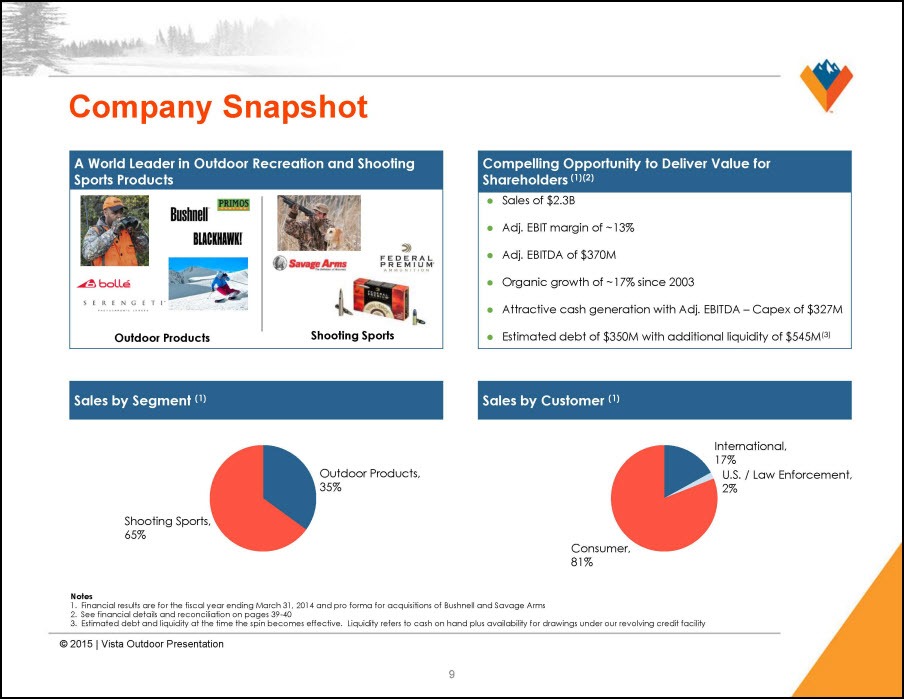
Company Snapshot A World Leader in Outdoor Recreation and Shooting Sports Products Outdoor Products Shooting Sports Compelling Opportunity to Deliver Value for Shareholders (1)(2) Sales of $2.3B Adj. EBIT margin of ~13% Adj. EBITDA of $370M Organic growth of ~17% since 2003 Attractive cash generation with Adj. EBITDA – Capex of $327M Estimated debt of $350M with additional liquidity of $545M(3) Sales by Segment (1) Shooting Sports, 65% Outdoor Products, 35% Sales by Customer (1) Consumer, 81% International, 17% U.S. / Law Enforcement, 2% Notes 1. Financial results are for the fiscal year ending March 31, 2014 and pro forma for acquisitions of Bushnell and Savage Arms 2. See financial details and reconciliation on pages 39-40 3. Estimated debt and liquidity at the time the spin becomes effective. Liquidity refers to cash on hand plus availability for drawings under our revolving credit facility
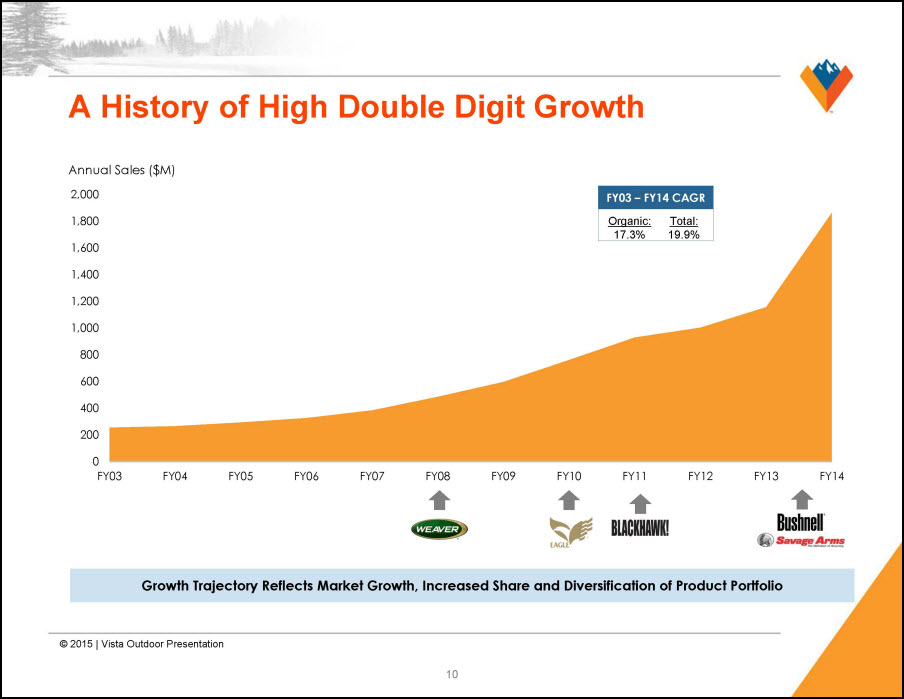
A History of High Double Digit Growth Annual Sales ($M) 2,000 1,800 1,600 1,400 1,200 1,000 800 600 400 200 0 FY03 FY04 FY05 FY06 FY07 FY08 FY09 FY10 FY11 FY12 FY13 FY14 FY03 – FY14 CAGR Organic: 17.3% Total: 19.9% Growth Trajectory Reflects Market Growth, Increased Share and Diversification of Product Portfolio
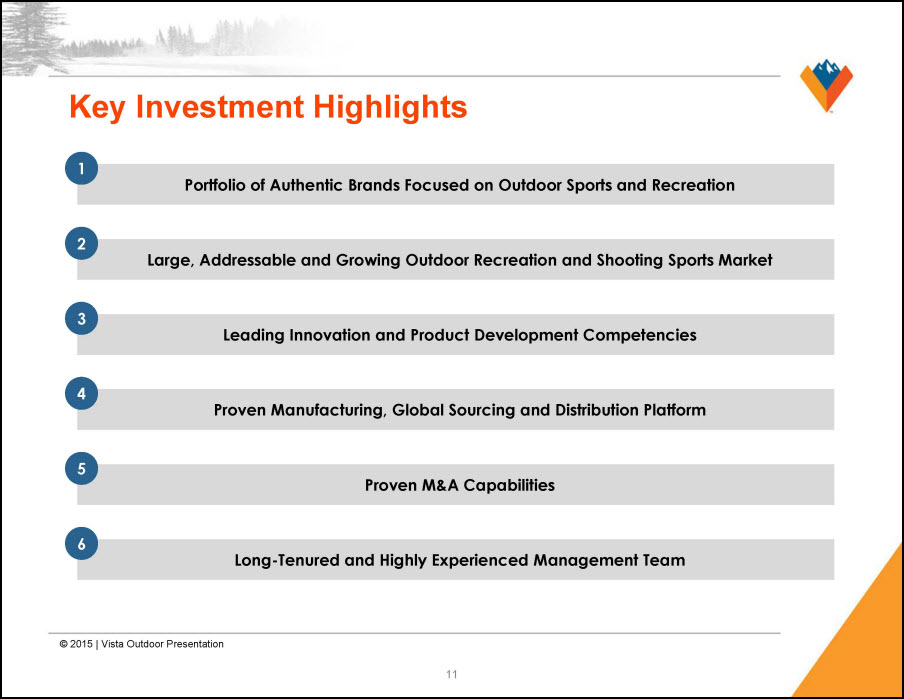
Key Investment Highlights 1 Portfolio of Authentic Brands Focused on Outdoor Sports and Recreation 2 Large, Addressable and Growing Outdoor Recreation and Shooting Sports Market 3 Leading Innovation and Product Development Competencies 4 Proven Manufacturing, Global Sourcing and Distribution Platform 5 Proven M&A Capabilities 6 Long-Tenured and Highly Experienced Management Team
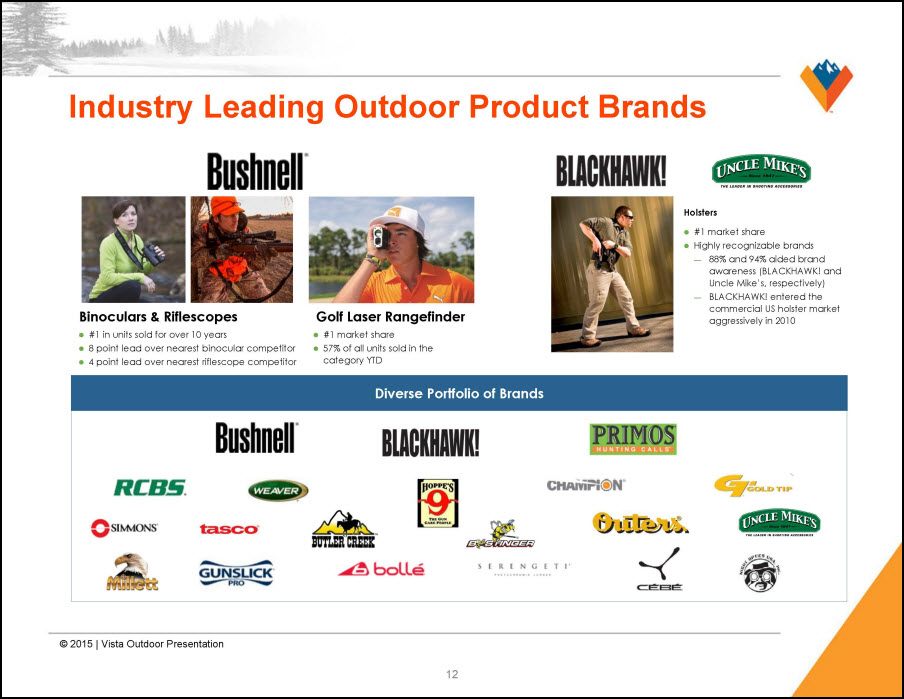
Industry Leading Outdoor Product Brands Binoculars & Riflescopes #1 in units sold for over 10 years 8 point lead over nearest binocular competitor 4 point lead over nearest riflescope competitor Golf Laser Rangefinder #1 market share 57% of all units sold in the category YTD Holsters #1 market share Highly recognizable brands 88% and 94% aided brand awareness (BLACKHAWK! and Uncle Mike's, respectively) BLACKHAWK! entered the commercial US holster market aggressively in 2010 Diverse Portfolio of Brands
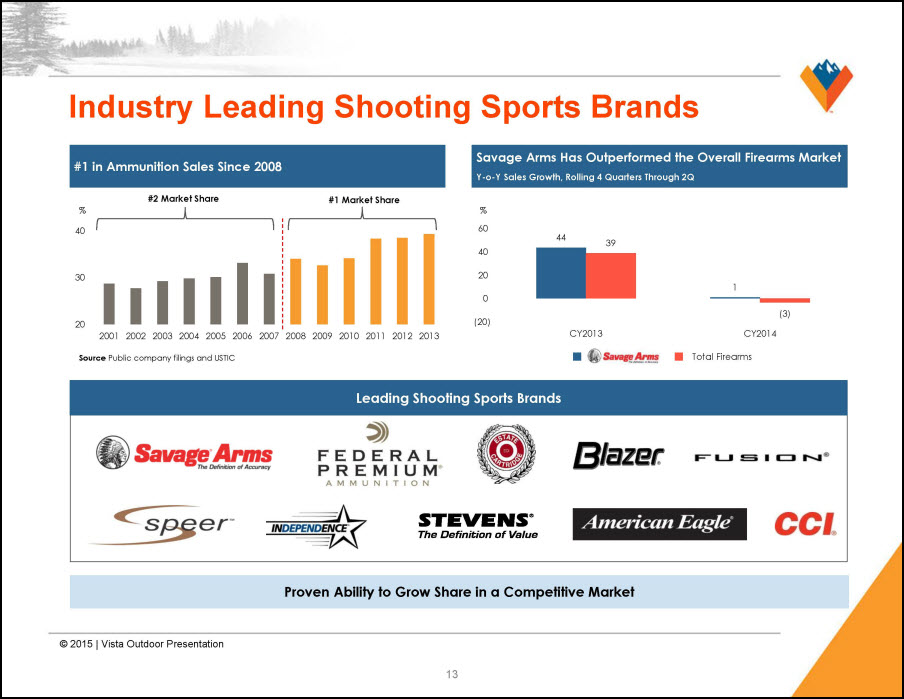
Industry Leading Shooting Sports Brands #1 in Ammunition Sales Since 2008 #2 Market Share #1 Market Share % 40 30 20 2001 2002 2003 2004 2005 2006 2007 2008 2009 2010 2011 2012 2013 Source Public company filings and USTIC Savage Arms Has Outperformed the Overall Firearms Market Y-o-Y Sales Growth, Rolling 4 Quarters Through 2Q % 60 40 20 0 (20) 44 39 CY2013 1 (3) CY2014 Total Firearms Leading Shooting Sports Brands Proven Ability to Grow Share in a Competitive Market
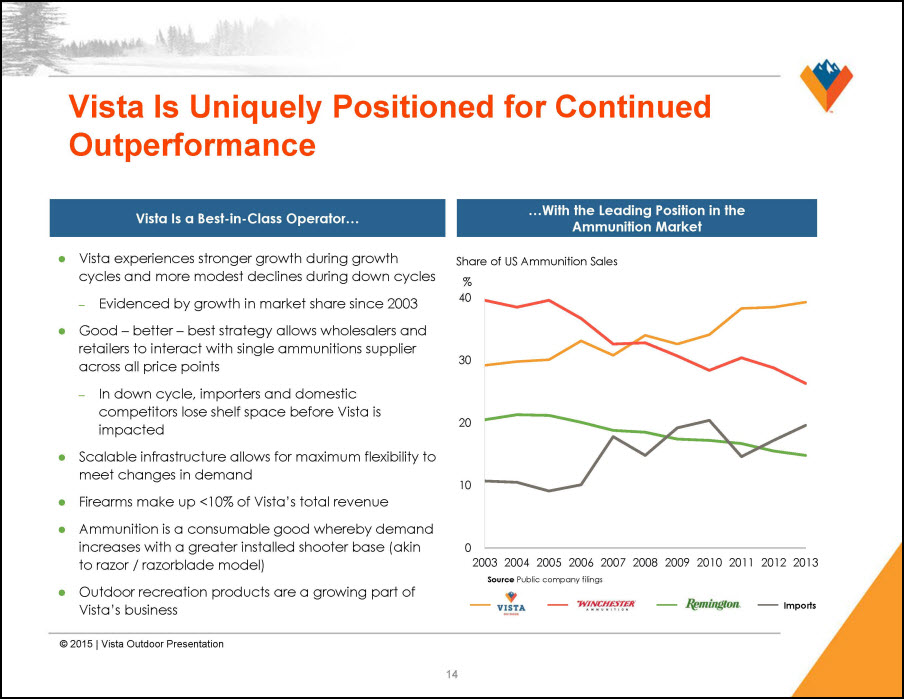
Vista Is Uniquely Positioned for Continued Outperformance Vista Is a Best-in-Class Operator… Vista experiences stronger growth during growth cycles and more modest declines during down cycles Evidenced by growth in market share since 2003 Good - better - best strategy allows wholesalers and retailers to interact with single ammunitions supplier across all price points In down cycle, importers and domestic competitors lose shelf space before Vista is impacted Scalable infrastructure allows for maximum flexibility to meet changes in demand Firearms make up <10% of Vista's total revenue Ammunition is a consumable good whereby demand increases with a greater installed shooter base (akin to razor / razorblade model) Outdoor recreation products are a growing part of Vista's business …With the Leading Position in the Ammunition Market Share of US Ammunition Sales %40 30 20 10 0 2003 2004 2005 2006 2007 2008 2009 2010 2011 2012 2013 Source Public company filings
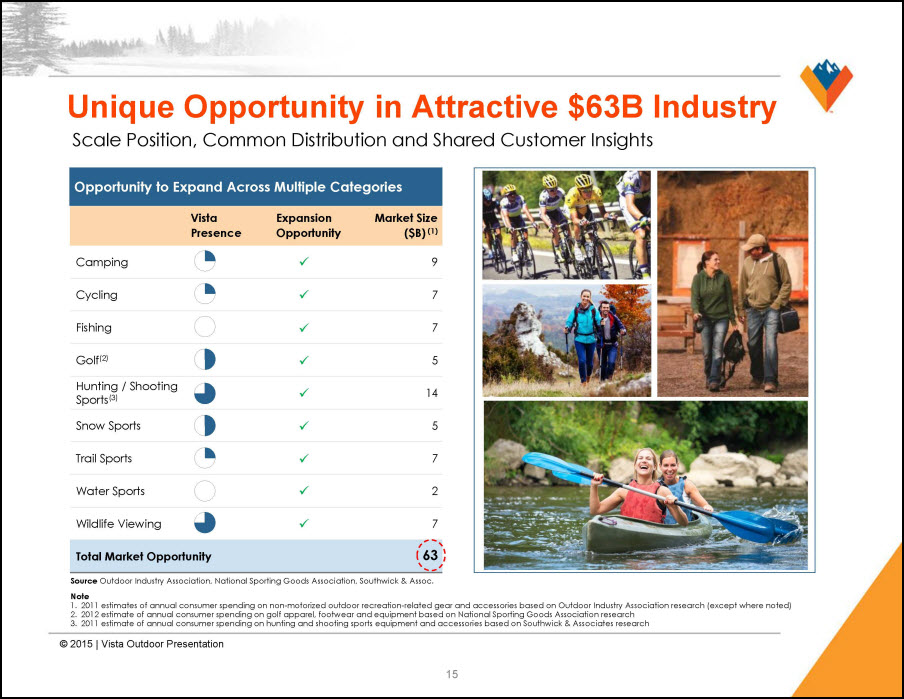
Unique Opportunity in Attractive $63B Industry Scale Position, Common Distribution and Shared Customer Insights Opportunity to Expand Across Multiple Categories Vista Presence Expansion Opportunity Market Size ($B) (1) Camping 9 Cycling 7 Fishing 7 Golf(2) 5 Hunting / Shooting Sports(3) 14 Snow Sports 5 Trail Sports 7 Water Sports 2 Wildlife Viewing 7 Total Market Opportunity 63 Source Outdoor Industry Association, National Sporting Goods Association, Southwick & Assoc. Note 1. 2011 estimates of annual consumer spending on non-motorized outdoor recreation-related gear and accessories based on Outdoor Industry Association research (except where noted) 2. 2012 estimate of annual consumer spending on golf apparel, footwear and equipment based on National Sporting Goods Association research 3. 2011 estimate of annual consumer spending on hunting and shooting sports equipment and accessories based on Southwick & Associates research
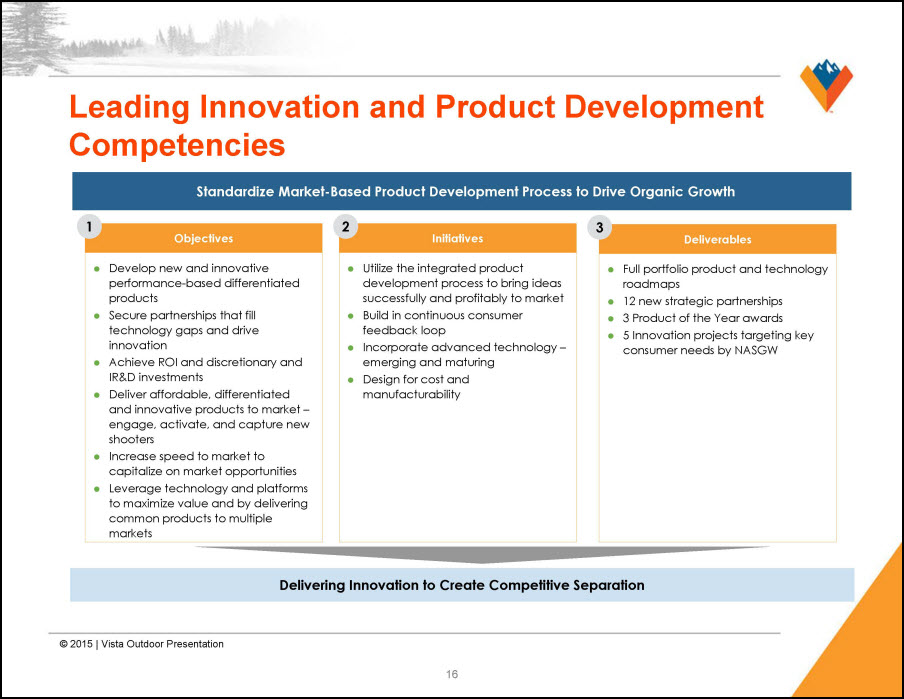
Leading Innovation and Product Development Competencies Standardize Market-Based Product Development Process to Drive Organic Growth 1 Objectives Develop new and innovative performance-based differentiated products Secure partnerships that fill technology gaps and drive innovation Achieve ROI and discretionary and IR&D investments Deliver affordable, differentiated and innovative products to market – engage, activate, and capture new shooters Increase speed to market to capitalize on market opportunities Leverage technology and platforms to maximize value and by delivering common products to multiple markets 2 Initiatives Utilize the integrated product development process to bring ideas successfully and profitably to market Build in continuous consumer feedback loop Incorporate advanced technology – emerging and maturing Design for cost and manufacturability 3 Deliverables Full portfolio product and technology roadmaps 12 new strategic partnerships 3 Product of the Year awards 5 Innovation projects targeting key consumer needs by NASGW Delivering Innovation to Create Competitive Separation
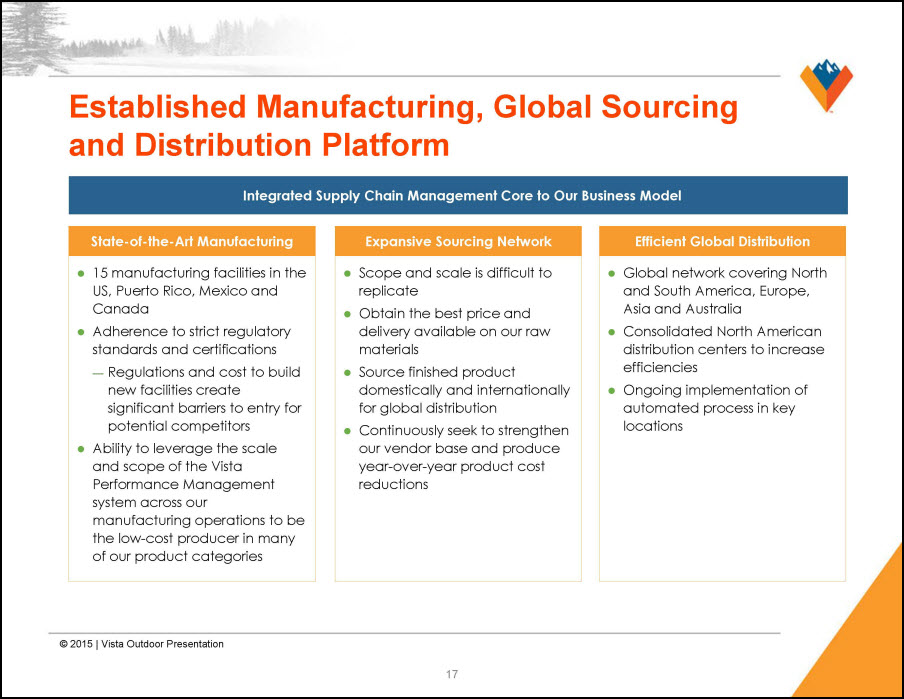
Established Manufacturing, Global Sourcing and Distribution Platform Integrated Supply Chain Management Core to Our Business Model State-of-the-Art Manufacturing 15 manufacturing facilities in the US, Puerto Rico, Mexico and Canada Adherence to strict regulatory standards and certifications Regulations and cost to build new facilities create significant barriers to entry for potential competitors Ability to leverage the scale and scope of the Vista Performance Management system across our manufacturing operations to be the low-cost producer in many of our product categories Expansive Sourcing Network Scope and scale is difficult to replicate Obtain the best price and delivery available on our raw materials Source finished product domestically and internationally for global distribution Continuously seek to strengthen our vendor base and produce year-over-year product cost reductions Efficient Global Distribution Global network covering North and South America, Europe, Asia and Australia Consolidated North American distribution centers to increase efficiencies Ongoing implementation of automated process in key locations
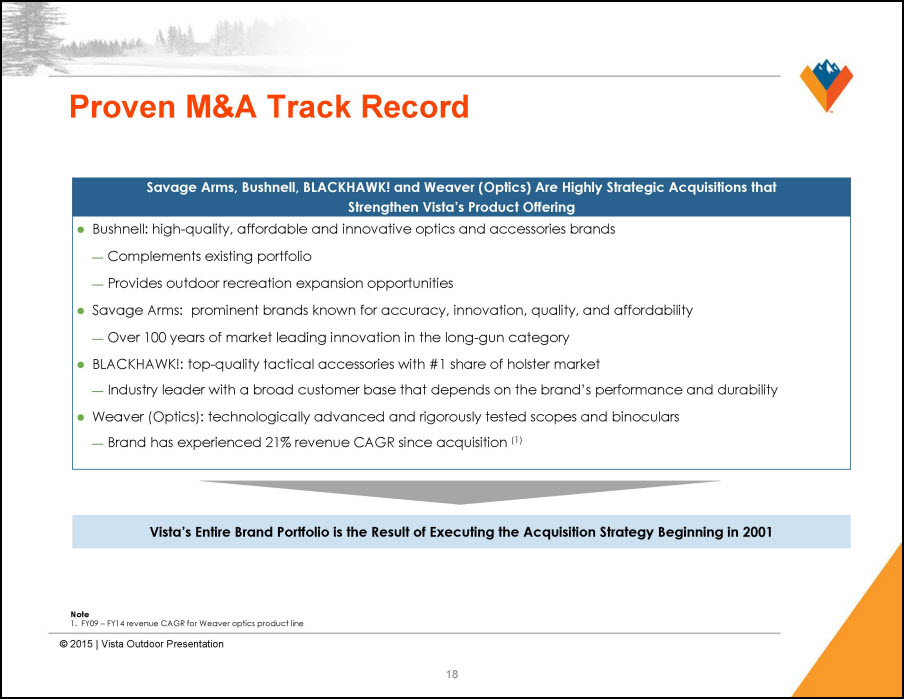
Proven M&A Track Record Savage Arms, Bushnell, BLACKHAWK! and Weaver (Optics) Are Highly Strategic Acquisitions that Strengthen Vista’s Product Offering Bushnell: high-quality, affordable and innovative optics and accessories brands Complements existing portfolio Provides outdoor recreation expansion opportunities Savage Arms: prominent brands known for accuracy, innovation, quality, and affordability Over 100 years of market leading innovation in the long-gun category BLACKHAWK!: top-quality tactical accessories with #1 share of holster market Industry leader with a broad customer base that depends on the brand’s performance and durability Weaver (Optics): technologically advanced and rigorously tested scopes and binoculars Brand has experienced 21% revenue CAGR since acquisition (1) Vista’s Entire Brand Portfolio is the Result of Executing the Acquisition Strategy Beginning in 2001 Note 1.FY09 – FY14 revenue CAGR for Weaver optics product line
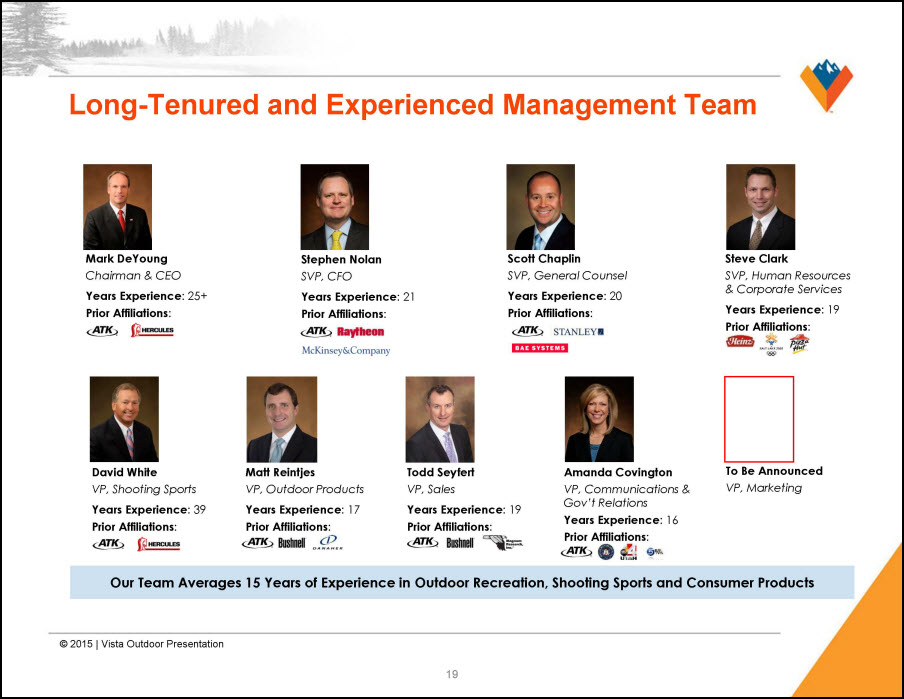
Long-Tenured and Experienced Management Team Mark DeYoung Chairman & CEO Years Experience: 25+ Prior Affiliations: Stephen Nolan SVP, CFO Years Experience: 21 Prior Affiliations: Scott Chaplin SVP, General Counsel Years Experience: 20 Prior Affiliations: Steve Clark SVP, Human Resources & Corporate Services Years Experience: 19 Prior Affiliations: David White VP, Shooting Sports Years Experience: 39 Prior Affiliations: Matt Reintjes VP, Outdoor Products Years Experience: 17 Prior Affiliations: Todd Seyfert VP, Sales Years Experience: 19 Prior Affiliations: Amanda Covington VP, Communications & Gov’t Relations Years Experience: 16 Prior Affiliations: To Be Announced VP, Marketing Our Team Averages 15 Years of Experience in Outdoor Recreation, Shooting Sports and Consumer Products

Vista outdoor Section 2 Key Growth Strategies
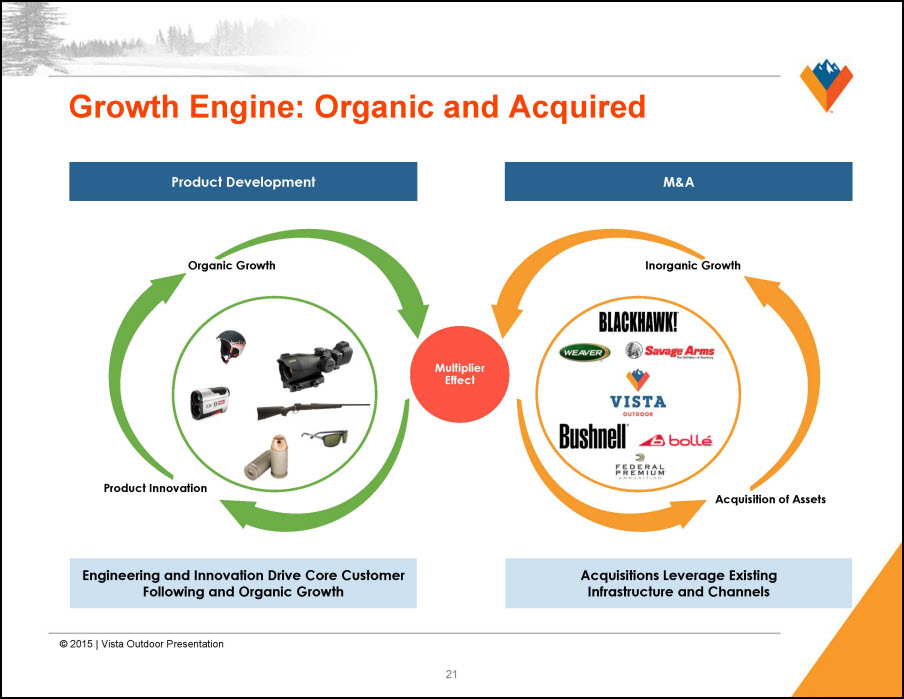
Growth Engine: Organic and Acquired Product Development Organic Growth Product Innovation Engineering and Innovation Drive Core Customer Following and Organic Growth Multiplier Effect M&A Inorganic Growth Acquisition of Assets Acquisitions Leverage Existing Infrastructure and Channels
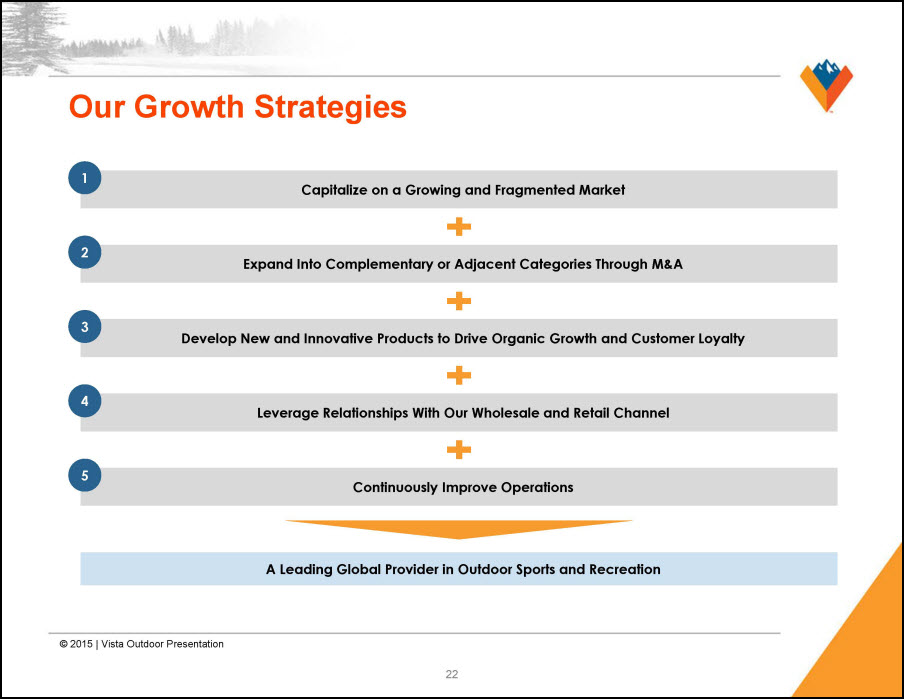
Our Growth Strategies 1 Capitalize on a Growing and Fragmented Market 2 Expand Into Complementary or Adjacent Categories Through M&A 3 Develop New and Innovative Products to Drive Organic Growth and Customer Loyalty 4 Leverage Relationships With Our Wholesale and Retail Channel 5 Continuously Improve Operations A Leading Global Provider in Outdoor Sports and Recreation
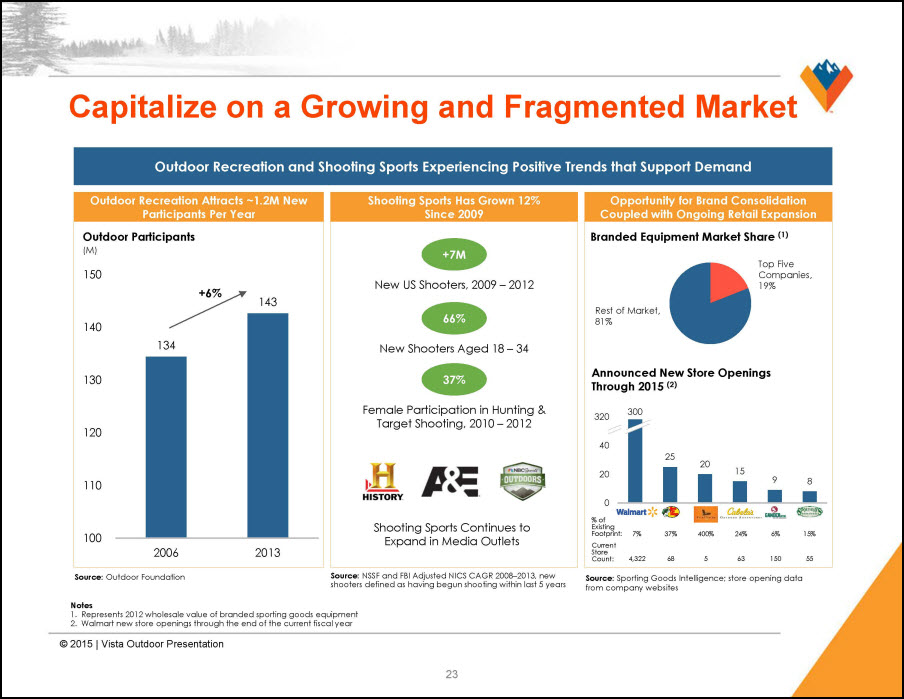
Capitalize on a Growing and Fragmented Market Outdoor Recreation and Shooting Sports Experiencing Positive Trends that Support Demand Outdoor Recreation Attracts ~1.2M New Participants Per Year Outdoor Participants (m) 150 140 130 120 110 100 134 2006 +6% 143 2013 Source: Outdoor Foundation Shooting Sports Has Grown 12% Since 2009 +7m New US Shooters, 2009 – 2012 66% New Shooters Aged 18 – 34 37% Female Participation in Hunting & Target Shooting, 2010 – 2012 Shooting Sports Continues to Expand in Media Outlets Source: NSSF and FBI Adjusted NICS CAGR 2008–2013, new shooters defined as having begun shooting within last 5 years Opportunity for Brand Consolidation Coupled with Ongoing Retail Expansion Branded Equipment Market Share (1) Rest of Market, 81% Top Five Companies, 19% Announced New Store Openings Through 2015 (2) 320 40 20 0 300 25 20 15 9 8 % of Existing Footprint: 7% 37% 400% 24% 6% 15% Current Store Count: 4,322 68 5 63 150 55 Source: Sporting Goods Intelligence; store opening data from company websites Notes 1. Represents 2012 wholesale value of branded sporting goods equipment 2. Walmart new store openings through the end of the current fiscal year

Use M&A to Expand into Complementary or Adjacent Categories Criteria 1 Adjacent categories that speak to rugged individualism 2 Outdoor-focused brands 3 Familiar customer 4 Opportunity to improve the brand, increase distribution, and apply operational excellence 5 Right price at the right time
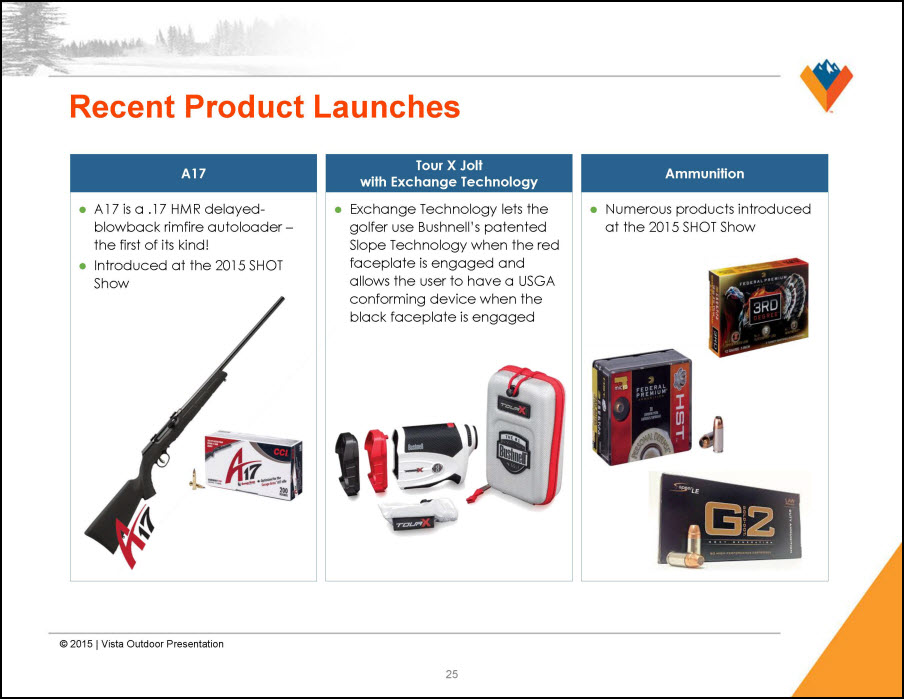
Recent Product Launches A17 A17 is a .17 HMR delayed-blowback rimfire autoloader – the first of its kind! Introduced at the 2015 SHOT Show Tour X Jolt with Exchange Technology Exchange Technology lets the golfer use Bushnell’s patented Slope Technology when the red faceplate is engaged and allows the user to have a USGA conforming device when the black faceplate is engaged Ammunition Numerous products introduced at the 2015 SHOT Show
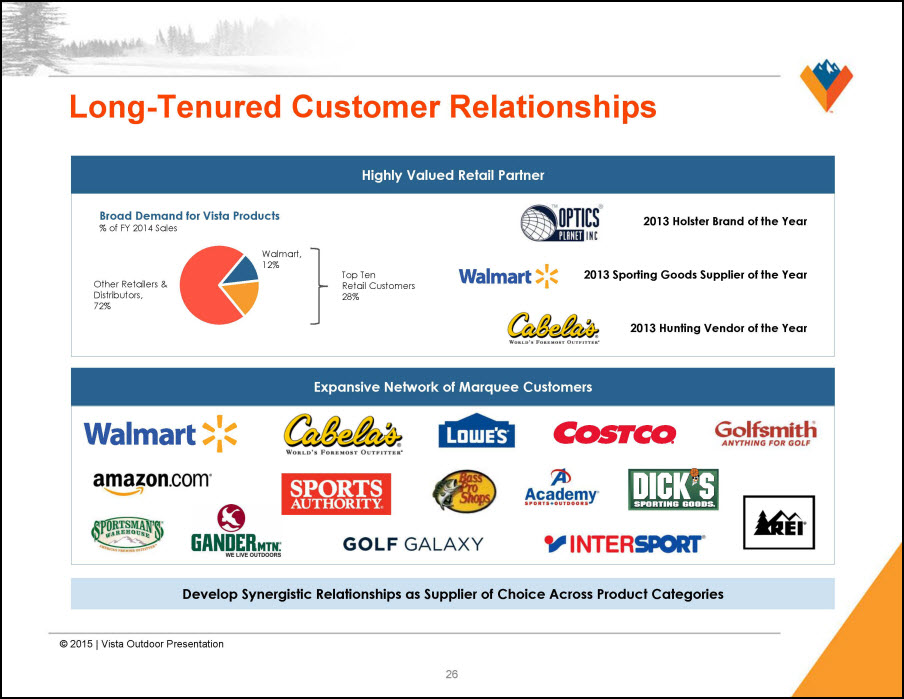
Long-Tenured Customer Relationships Highly Valued Retail Partner Broad Demand for Vista Products % of FY 2014 Sales Other Retailers & Distributors, 72% Walmart, 12% Top Ten Retail Customers 28% 2013 Holster Brand of the Year 2013 Sporting Goods Supplier of the Year 2013 Hunting Vendor of the Year Expansive Network of Marquee Customers Develop Synergistic Relationships as Supplier of Choice Across Product Categories
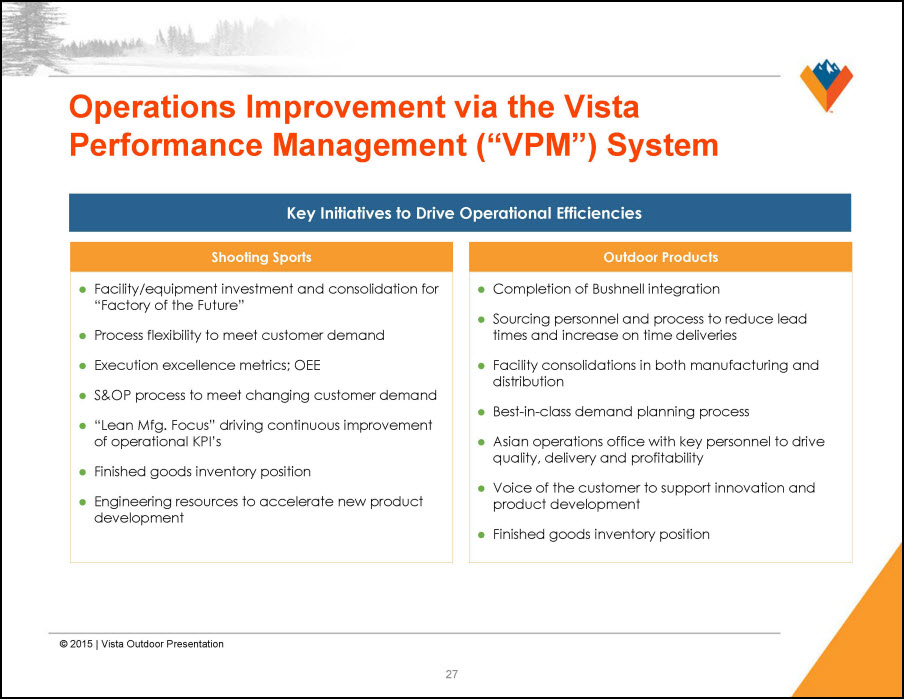
Operations Improvement via the Vista Performance Management (“VPM”) System Key Initiatives to Drive Operational Efficiencies Shooting Sports Facility/equipment investment and consolidation for “Factory of the Future” Process flexibility to meet customer demand Execution excellence metrics; OEE S&OP process to meet changing customer demand “Lean Mfg. Focus” driving continuous improvement of operational KPI’s Finished goods inventory position Engineering resources to accelerate new product development Outdoor Products Completion of Bushnell integration Sourcing personnel and process to reduce lead times and increase on time deliveries Facility consolidations in both manufacturing and distribution Best-in-class demand planning process Asian operations office with key personnel to drive quality, delivery and profitability Voice of the customer to support innovation and product development Finished goods inventory position

Vista outdoor Section 3 Financial Overview
Key Differentiators of Vista Financial Model 1 Strong Free Cash Flow Generation 2 Economies of Scale in Sourcing, Manufacturing and Distribution 3 Low Cost Manufacturing 4 Modest Capital Expenditure Requirements
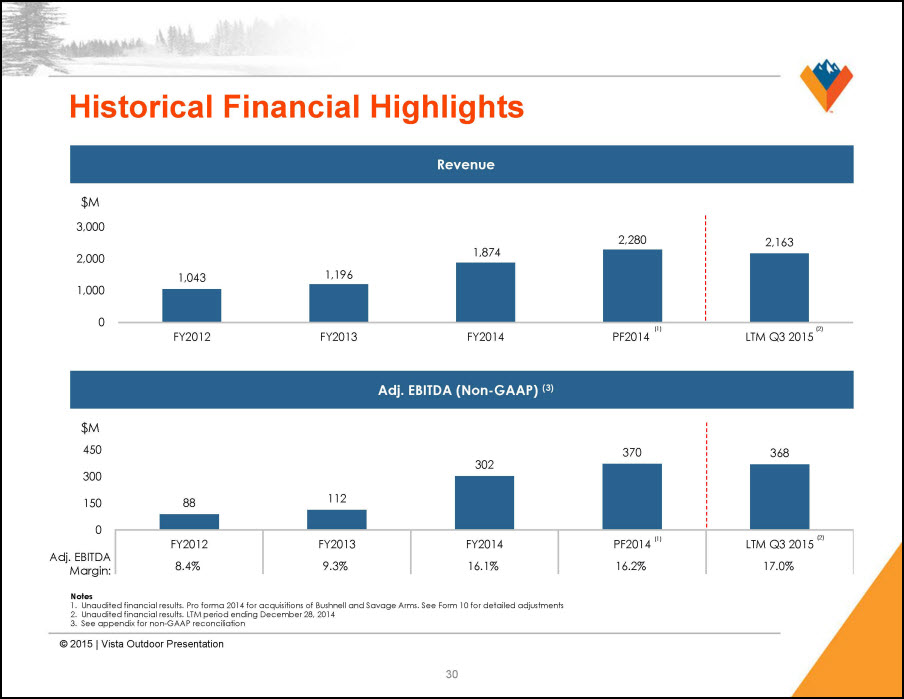
Historical Financial Highlights Revenue $M 3,000 2,000 1,000 0 1,043 FY2012 1,196 FY2013 1,874 FY2014 2,280 PF2014(1) 2,163 LTM Q3 2015(2) Adj. EBITDA (Non-GAAP) (3) $M 450 300 150 0 88 FY2012 8.4% 112 FY2013 9.3% 302 FY2014 16.1% 370 PF2014(1) 16.2% 368 LTM Q3 2015(2) 17.0% Adj. EBITDA Margin: Notes 1.Unaudited financial results. Pro forma 2014 for acquisitions of Bushnell and Savage Arms. See Form 10 for detailed adjustments 2.Unaudited financial results. LTM period ending December 28, 2014 3.See appendix for non-GAAP reconciliation
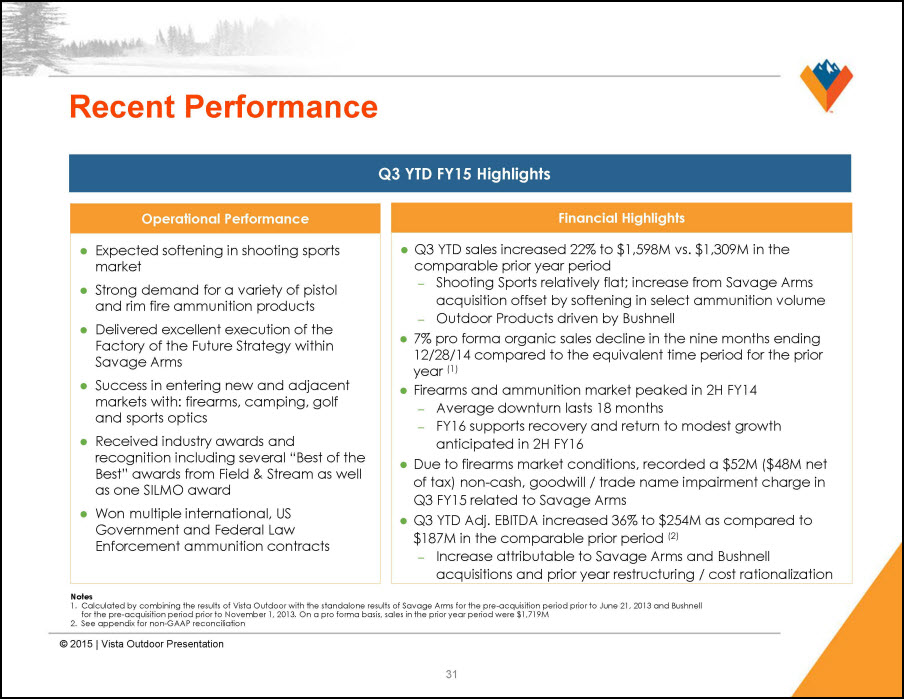
Recent Performance Q3 YTD FY15 Highlights Operational Performance Expected softening in shooting sports market Strong demand for a variety of pistol and rim fire ammunition products Delivered excellent execution of the Factory of the Future Strategy within Savage Arms Success in entering new and adjacent markets with: firearms, camping, golf and sports optics Received industry awards and recognition including several “Best of the Best” awards from Field & Stream as well as one SILMO award Won multiple international, US Government and Federal Law Enforcement ammunition contracts Financial Highlights Q3 YTD sales increased 22% to $1,598M vs. $1,309M in the comparable prior year period Shooting Sports relatively flat; increase from Savage Arms acquisition offset by softening in select ammunition volume Outdoor Products driven by Bushnell 7% pro forma organic sales decline in the nine months ending 12/28/14 compared to the equivalent time period for the prior year (1) Firearms and ammunition market peaked in 2H FY14 Average downturn lasts 18 months FY16 supports recovery and return to modest growth anticipated in 2H FY16 Due to firearms market conditions, recorded a $52M ($48M net of tax) non-cash, goodwill / trade name impairment charge in Q3 FY15 related to Savage Arms Q3 YTD Adj. EBITDA increased 36% to $254M as compared to $187M in the comparable prior period (2) Increase attributable to Savage Arms and Bushnell acquisitions and prior year restructuring / cost rationalization Notes 1.Calculated by combining the results of Vista Outdoor with the standalone results of Savage Arms for the pre-acquisition period prior to June 21, 2013 and Bushnell for the pre-acquisition period prior to November 1, 2013. On a pro forma basis, sales in the prior year period were $1,719M 2.See appendix for non-GAAP reconciliation
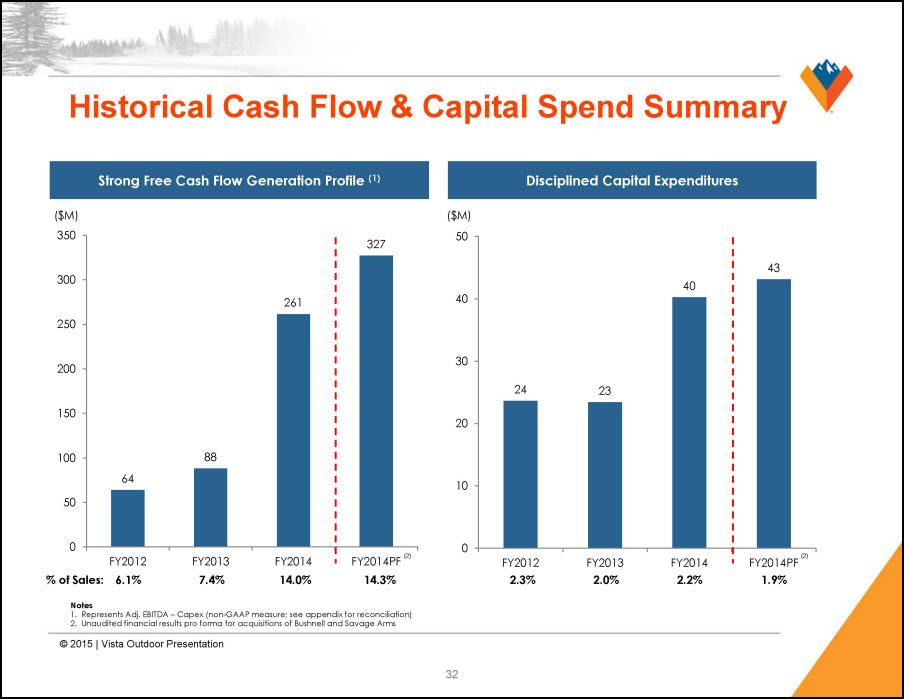
Historical Cash Flow & Capital Spend Summary Strong Free Cash Flow Generation Profile (1) ($M) 350 300 250 200 150 100 50 0 % of Sales: 64 FY2012 6.1% 88 FY2013 7.4% 261 FY2014 14.0% 327 FY2014PF(2) 14.3% Disciplined Capital Expenditures ($M) 50 40 30 20 10 0 24 FY2012 2.3% 23 FY2013 2.0% 40 FY2014 2.2% 43 FY2014PF(2) 1.9% Notes 1.Represents Adj. EBITDA – Capex (non-GAAP measure; see appendix for reconciliation) 2.Unaudited financial results pro forma for acquisitions of Bushnell and Savage Arms
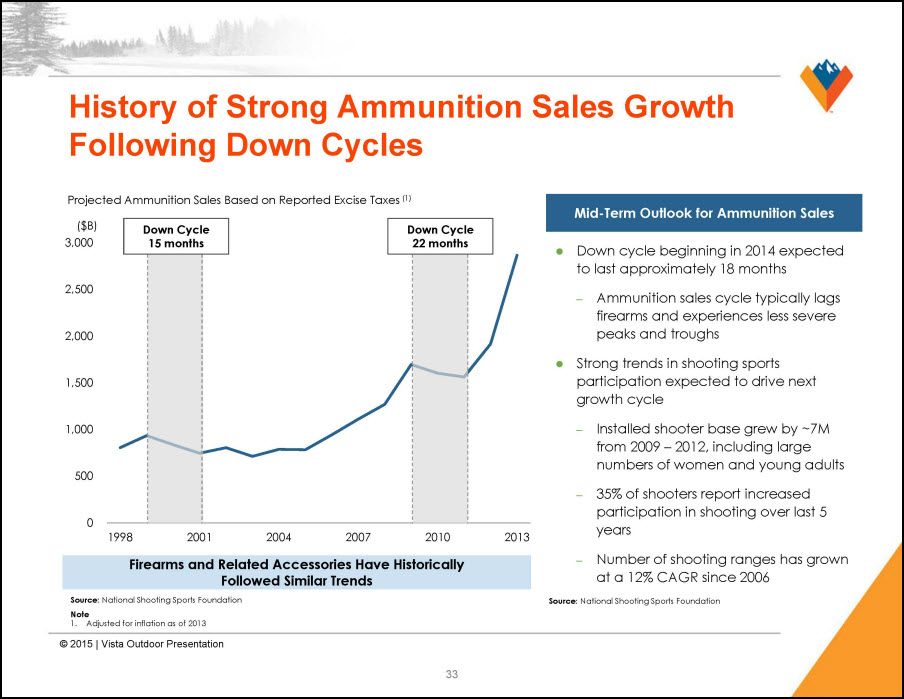
History of Strong Ammunition Sales Growth Following Down Cycles Projected Ammunition Sales Based on Reported Excise Taxes (1) ($B) 3,000 2,500 2,000 1,500 1,000 500 0 Down Cycle 15 months Down Cycle 22 months 1998 2001 2004 2007 2010 2013 Firearms and Related Accessories Have Historically Followed Similar Trends Source: National Shooting Sports Foundation Note 1. Adjusted for inflation as of 2013 Mid-Term Outlook for Ammunition Sales Down cycle beginning in 2014 expected to last approximately 18 months Ammunition sales cycle typically lags firearms and experiences less severe peaks and troughs Strong trends in shooting sports participation expected to drive next growth cycle Installed shooter base grew by ~7M from 2009 – 2012, including large numbers of women and young adults 35% of shooters report increased participation in shooting over last 5 years Number of shooting ranges has grown at a 12% CAGR since 2006 Source: National Shooting Sports Foundation
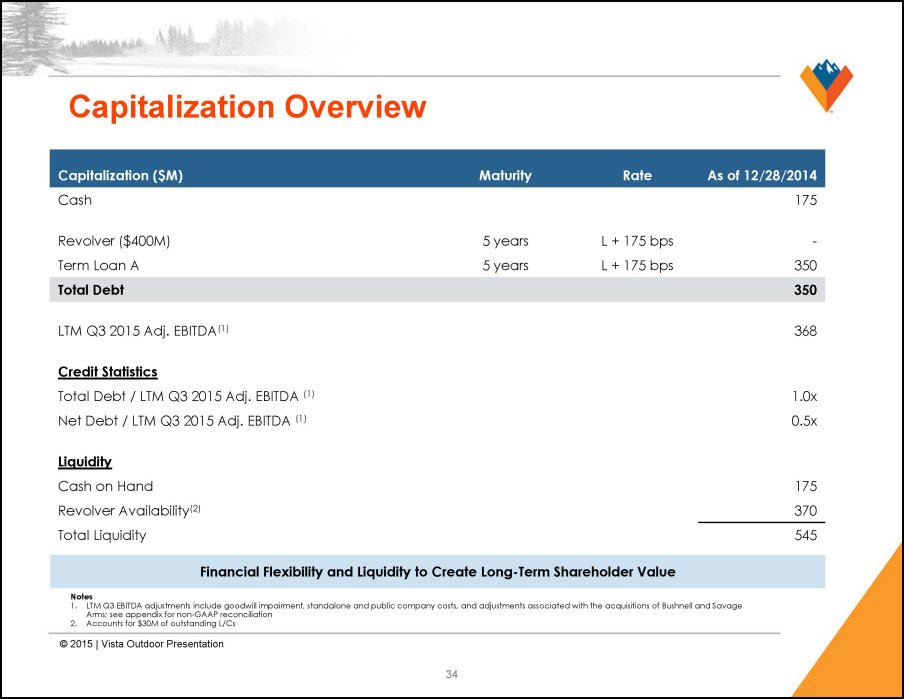
Capitalization Overview Capitalization ($M) Maturity Rate As of 12/28/2014 Cash 175 Revolver ($400M) 5 years L + 175 bps - Term Loan A 5 years L + 175 bps 350 Total Debt 350 LTM Q3 2015 Adj. EBITDA(1) 368 Credit Statistics Total Debt / LTM Q3 2015 Adj. EBITDA (1) 1.0x Net Debt / LTM Q3 2015 Adj. EBITDA (1) 0.5x Liquidity Cash on Hand 175 Revolver Availability(2) 370 Total Liquidity 545 Financial Flexibility and Liquidity to Create Long-Term Shareholder Value Notes 1.LTM Q3 EBITDA adjustments include goodwill impairment, standalone and public company costs, and adjustments associated with the acquisitions of Bushnell and Savage Arms; see appendix for non-GAAP reconciliation 2.Accounts for $30M of outstanding L/Cs
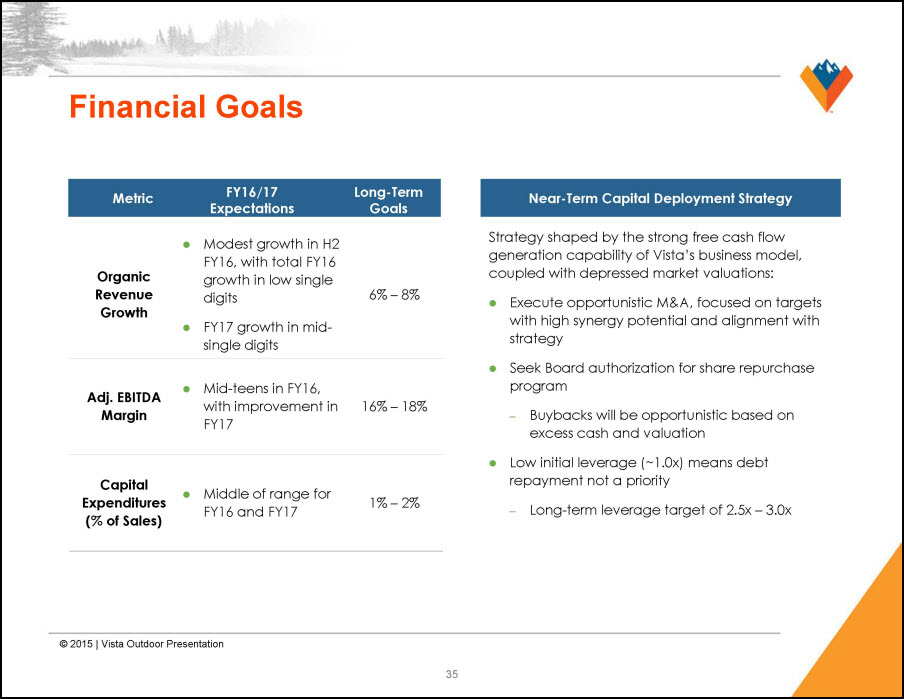
Financial Goals Metric FY16/17 Expectations Long-Term Goals Organic Revenue Growth Modest growth in H2 FY16, with total FY16 growth in low single digits FY17 growth in mid-single digits 6% – 8% Adj. EBITDA Margin Mid-teens in FY16, with improvement in FY17 16% – 18% Capital Expenditures (% of Sales) Middle of range for FY16 and FY17 1% – 2% Near-Term Capital Deployment Strategy Strategy shaped by the strong free cash flow generation capability of Vista’s business model, coupled with depressed market valuations: Execute opportunistic M&A, focused on targets with high synergy potential and alignment with strategy Seek Board authorization for share repurchase program Buybacks will be opportunistic based on excess cash and valuation Low initial leverage (~1.0x) means debt repayment not a priority Long-term leverage target of 2.5x – 3.0x
Section 4 Conclusion Vista Outdoor
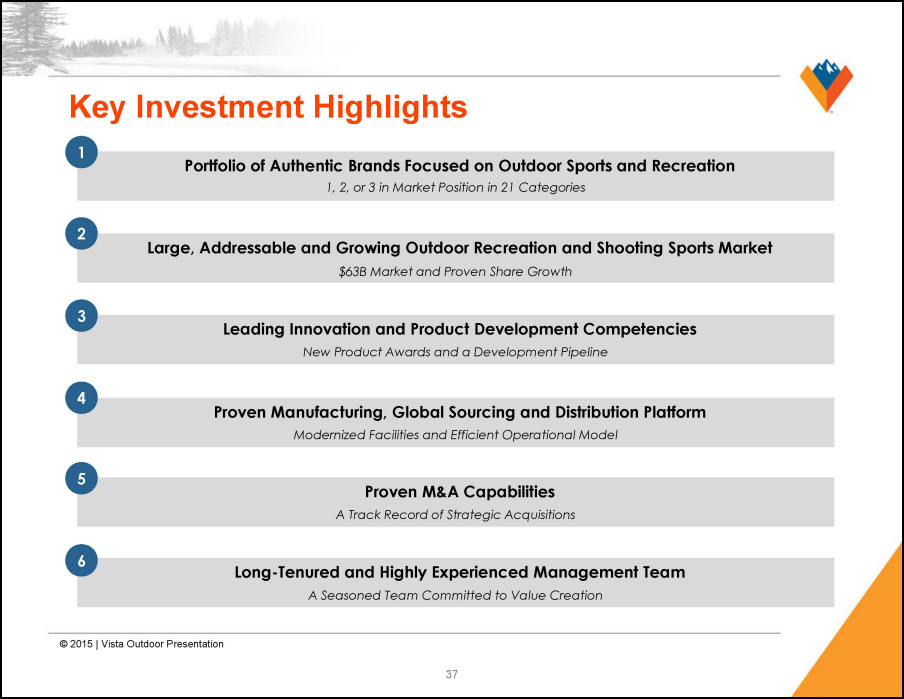
Key Investment Highlights 1 Portfolio of Authentic Brands Focused on Outdoor Sports and Recreation 1, 2, or 3 in Market Position in 21 Categories 2 Large, Addressable and Growing Outdoor Recreation and Shooting Sports Market $63B Market and Proven Share Growth 3 Leading Innovation and Product Development Competencies New Product Awards and a Development Pipeline 4 Proven Manufacturing, Global Sourcing and Distribution Platform Modernized Facilities and Efficient Operational Model 5 Proven M&A Capabilities A Track Record of Strategic Acquisitions 6 Long-Tenured and Highly Experienced Management Team A Seasoned Team Committed to Value Creation
Appendix Vista Outdoor
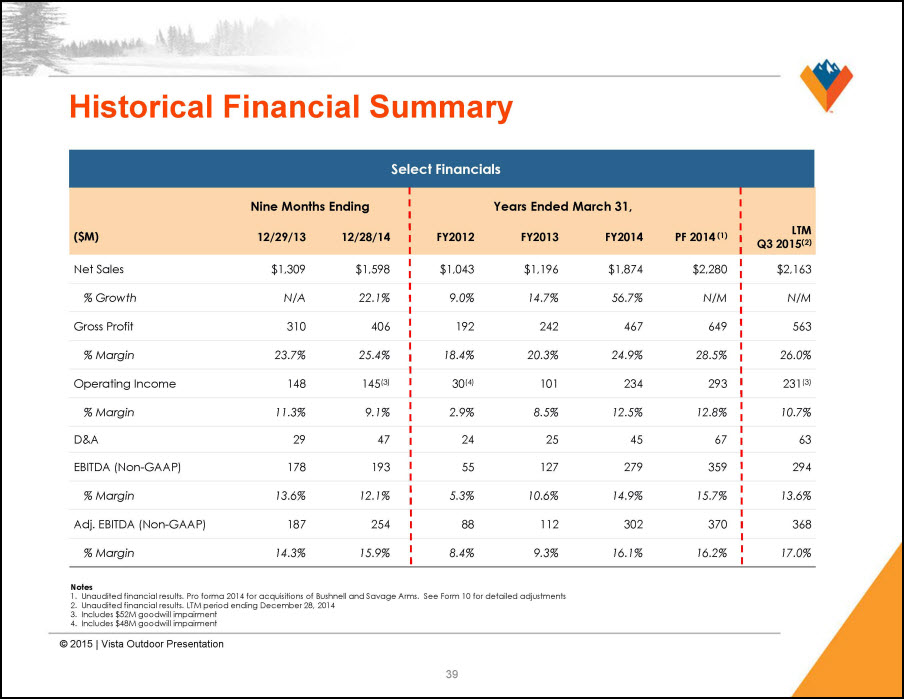
Historical Financial Summary Select Financials Nine Months Ending Years Ended March 31, ($M) 12/29/13 12/28/14 FY2012 FY2013 FY2014 PF 2014 (1) LTM Q3 2015(2) Net Sales $1,309 $1,598 $1,043 $1,196 $1,874 $2,280 $2,163 % Growth N/A 22.1% 9.0% 14.7% 56.7% N/M N/M Gross Profit 310 406 192 242 467 649 563 % Margin 23.7% 25.4% 18.4% 20.3% 24.9% 28.5% 26.0% Operating Income 148 145(3) 30(4) 101 234 293 231(3) % Margin 11.3% 9.1% 2.9% 8.5% 12.5% 12.8% 10.7% D&A 29 47 24 25 45 67 63 EBITDA (Non-GAAP) 178 193 55 127 279 359 294 % Margin 13.6% 12.1% 5.3% 10.6% 14.9% 15.7% 13.6% Adj. EBITDA (Non-GAAP) 187 254 88 112 302 370 368 % Margin 14.3% 15.9% 8.4% 9.3% 16.1% 16.2% 17.0% Notes 1. Unaudited financial results. Pro forma 2014 for acquisitions of Bushnell and Savage Arms. See Form 10 for detailed adjustments 2. Unaudited financial results. LTM period ending December 28, 2014 3. Includes $52M goodwill impairment 4. Includes $48M goodwill impairment
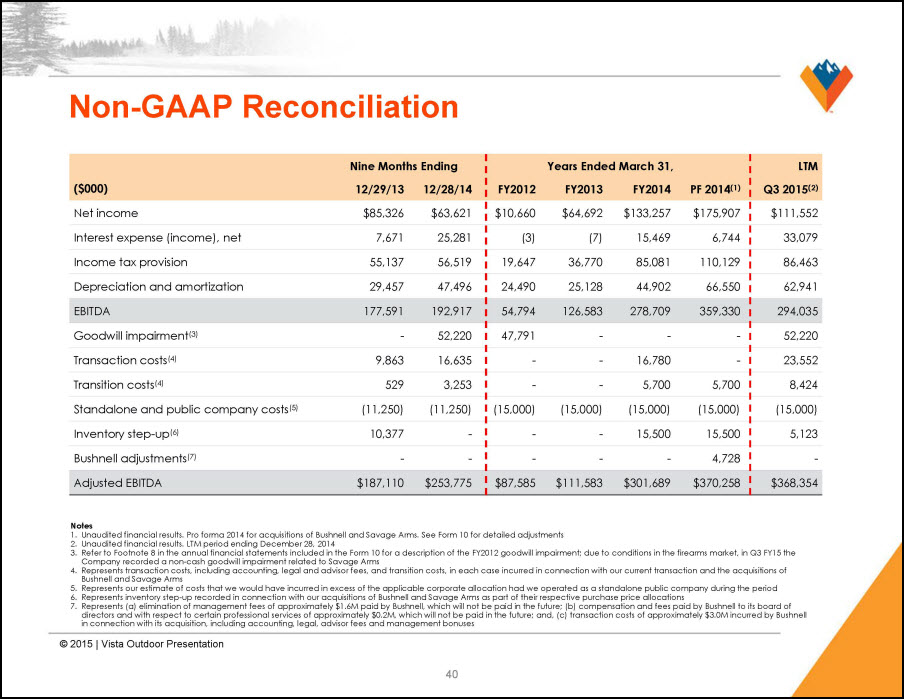
Non-GAAP Reconciliation Nine Months Ending Years Ended March 31, LTM ($000) 12/29/13 12/28/14 FY2012 FY2013 FY2014 PF 2014(1) Q3 2015(2) Net income $85,326 $63,621 $10,660 $64,692 $133,257 $175,907 $111,552 Interest expense (income), net 7,671 25,281 (3) (7) 15,469 6,744 33,079 Income tax provision 55,137 56,519 19,647 36,770 85,081 110,129 86,463 Depreciation and amortization 29,457 47,496 24,490 25,128 44,902 66,550 62,941 EBITDA 177,591 192,917 54,794 126,583 278,709 359,330 294,035 Goodwill impairment(3) - 52,220 47,791 - - - 52,220 Transaction costs(4) 9,863 16,635 - - 16,780 - 23,552 Transition costs(4) 529 3,253 - - 5,700 5,700 8,424 Standalone and public company costs(5) (11,250) (11,250) (15,000) (15,000) (15,000) (15,000) (15,000) Inventory step-up(6) 10,377 - - - 15,500 15,500 5,123 Bushnell adjustments(7) - - - - - 4,728 - Adjusted EBITDA $187,110 $253,775 $87,585 $111,583 $301,689 $370,258 $368,354 Notes 1. Unaudited financial results. Pro forma 2014 for acquisitions of Bushnell and Savage Arms. See Form 10 for detailed adjustments 2. Unaudited financial results. LTM period ending December 28, 2014 3. Refer to Footnote 8 in the annual financial statements included in the Form 10 for a description of the FY2012 goodwill impairment; due to conditions in the firearms market, in Q3 FY15 the Company recorded a non-cash goodwill impairment related to Savage Arms 4. Represents transaction costs, including accounting, legal and advisor fees, and transition costs, in each case incurred in connection with our current transaction and the acquisitions of Bushnell and Savage Arms 5. Represents our estimate of costs that we would have incurred in excess of the applicable corporate allocation had we operated as a standalone public company during the period 6. Represents inventory step-up recorded in connection with our acquisitions of Bushnell and Savage Arms as part of their respective purchase price allocations 7. Represents (a) elimination of management fees of approximately $1.6M paid by Bushnell, which will not be paid in the future; (b) compensation and fees paid by Bushnell to its board of directors and with respect to certain professional services of approximately $0.2M, which will not be paid in the future; and, (c) transaction costs of approximately $3.0M incurred by Bushnell in connection with its acquisition, including accounting, legal, advisor fees and management bonuses