Attached files
| file | filename |
|---|---|
| 8-K - 8-K - FARMERS NATIONAL BANC CORP /OH/ | d862503d8k.htm |
 January 29, 2015 Conference Call Presentation to Discuss
2014’s Financial Results and the National Bancshares Merger
Exhibit 99.1 |
 2
Disclosure Statement
Forward-Looking Statements
This investor presentation contains forward-looking statements
within the meaning of the Private Securities Litigation Reform
Act of 1995. These statements are not historical facts, but rather statements based on the Company's current
expectations regarding our business strategies and their intended
results and future performance. Forward-looking statements
are preceded by terms such as "expects," "believes," "anticipates," "intends" and similar expressions, as well as
any statements related to future expectations of performance or
conditional verbs, such as "will," "would," "should,"
"could," or "may."
Forward-looking statements are not guarantees of future
performance. Numerous risks and uncertainties could cause or
contribute to the Company's actual results, performance, and
achievements to be materially different from those expressed or
implied by the forward-looking statements. Factors that may cause or contribute to these differences include, without
limitation, the Company's failure to integrate National Bancshares and
First National Bank in accordance with expectations; deviations
from performance expectations related to National Bancshares and First National Bank; general
economic conditions, including changes in market interest rates and
changes in monetary and fiscal policies of the federal
government; legislative and regulatory changes; competitive conditions
in the banking markets served by the Company's subsidiaries; the
adequacy of the allowance for losses on loans and the level of future provisions for losses on loans; and
other factors disclosed periodically in the Company's filings with the
Securities and Exchange Commission. Because of the risks and uncertainties inherent in forward-looking
statements, readers are cautioned not to place undue reliance on
them, whether included in this report or made elsewhere from time to time by the Company or on the
Company's behalf. The Company assumes no obligation to update any
forward-looking statements. |
 3
Additional Information for Stockholders
In
connection
with
the
proposed
merger,
Farmers
will
file
with
the
Securities
and
Exchange
Commission
("SEC")
a
Registration Statement on Form S-4 that will include a joint proxy
statement and a Farmers prospectus, as well as other relevant
documents concerning the proposed transaction. SHAREHOLDERS OF
FARMERS AND NATIONAL BANCSHARES AND OTHER INVESTORS ARE URGED TO
CAREFULLY READ THE PROXY STATEMENT/PROSPECTUS TO BE INCLUDED IN THE
REGISTRATION STATEMENT
ON
FORM
S-4,
WHICH
FARMERS
WILL
FILE
WITH
THE
SEC
IN
CONNECTION
WITH
THE
PROPOSED MERGER, BECAUSE IT WILL CONTAIN IMPORTANT INFORMATION ABOUT
FARMERS, NATIONAL BANCSHARES, THE MERGER, THE PERSONS SOLICITING
PROXIES WITH RESPECT TO THE PROPOSED MERGER AND THEIR INTERESTS
IN THE PROPOSED MERGER AND RELATED MATTERS. The
respective
directors
and
executive
officers
of
Farmers
and
National
Bancshares
and
other
persons
may
be
deemed to
be participants in the solicitation of proxies from National Bancshares
and Farmers shareholders with respect to the proposed merger.
Information regarding the directors and executive officers of Farmers is available in its proxy
statement
filed
with
the
SEC
on
March
19,
2014.
Information
regarding
directors
and
executive
officers
of
National
Bancshares is available on its website at
http://www.discoverfirstnational.com/. Other information regarding the
participants in the solicitation and a description of their direct and
indirect interests, by security holdings or otherwise,
will
be
contained
in
the
proxy
statement/prospectus
and
other
relevant
materials
to
be
filed
with
the
SEC
when
they
become available.
Investors and security holders will be able to obtain free copies of
the registration statement (when available) and other
documents
filed
with
the
SEC
by
Farmers
through
the
website
maintained
by
the
SEC
at
http://www.sec.gov.
Copies
of
the documents filed with the
SEC
by Farmers will be available free of charge on Farmers' website at
https://www.farmersbankgroup.com. |
 4
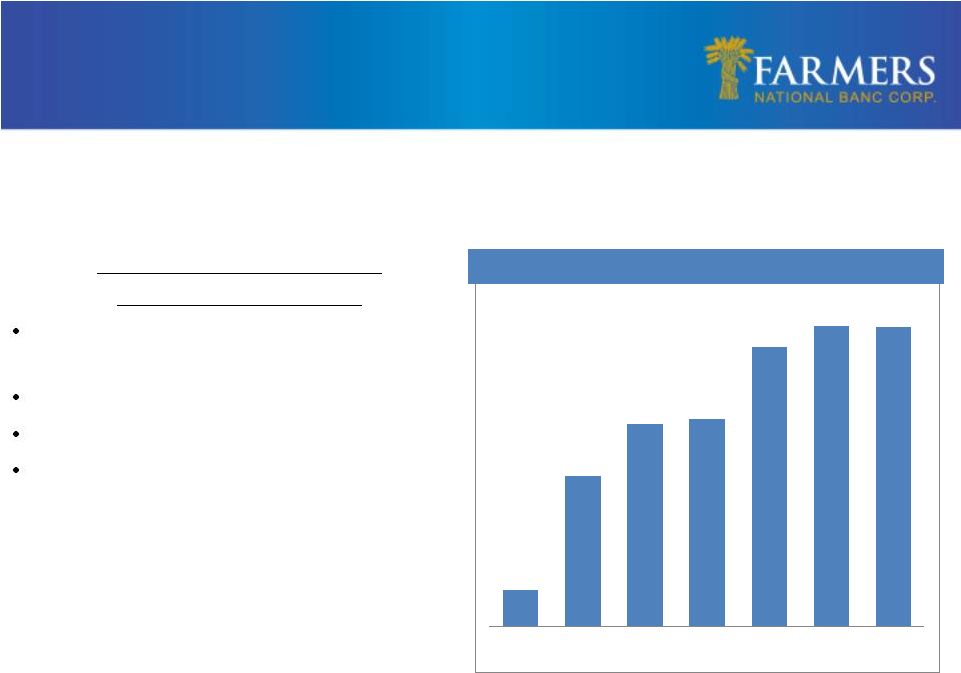
Introduction
$842
$970
$1,031
$1,035
$1,118
$1,142
$1,141
2008
2009
2010
2011
2012
2013
2014
Total Average Assets Up 36% Since 2008
History of Acquisition
and
Business Development
2009 Acquired the Butler Wick Trust
Company
2010 Created Farmers National Insurance
2012 Rolled Out Private Client Services
2013 Acquired National Associates
Farmers has become a leading, diversified financial institution with
a history of stable growth and profitability
•
•
•
• |
 5
Farmers –
2014 Business Highlights
•
Record year for Wealth Management
–
Farmers Trust Company revenues up 9%
–
Farmers National Investments commissions increased 13%
–
Farmers National Insurance revenues up 24%
•
Online and Mobile Banking Enhancements
•
Total dividends paid during 2014
–
$2.2 million, or 25% of net income
•
Repurchased 150,868 shares during the 2014 fourth quarter at a
cost of $1.2 million, combined with third quarter odd-lot
program reduced total outstanding shares by 2%
1
January 1, 2014 to December 31, 2014 gross dealer commissions
1 |
 6
Farmers –
2014 Financial Highlights
•
128 consecutive quarters of profitability
•
Net income per diluted share for year ended December 31, 2014 was
$0.48, a 17.1% improvement over
2013 •
Efficiency ratio for 2014 improved to 70.24%, compared to 74.82% for
2013 •
Loans increased 5.3% since December 31, 2013
•
Nonperforming assets to total assets remain at low levels, 0.76% at
December 31, 2014
•
Nonperforming assets declined to $8.6 million from $9.3 million
•
Tangible book value per share up 13.9% to $6.23 from $5.47
•
Tier 1 capital ratio to average assets of 10.02%
in 2014 compared to 9.36% in 2013 |
 7
Farmers –
2014 Financial Results
Loan Growth ($M)
Loan Quality (NPA/Total Assets)
Noninterest Income excluding Security
Gains ($M)
Noninterest Expense ($M) |
 Creates Prominent NE Ohio Franchise
8
(1)
Community Banks defined as those with assets less than $20.0
billion. Northeast Ohio includes area codes 216, 330 and 440
(2)
Based on FMNB’s stock price of $7.66 on January 28, 2015.
Source: SNL Financial
FMNB Branches
NBOH Branches
Pro Forma Highlights
Branches
33
Assets
$1.7 Billion
Loans
$1.1 Billion
Deposits
$1.3 Billion
Market Cap
$196
Million
2
Creates the third largest community bank
1
by asset size headquartered in Northeastern
Ohio
Complementary business lines & compelling
cultural fit
–
Combines NBOH’s strong loan growth
with Farmers’
wealth management
resources and strong capital base
–
Highly compatible cultures with similar
strategies, customer focus and strong
service and community orientation
Enhanced board of directors and
management team bringing strengths and
best practices from both sides
Catalyst for additional growth opportunities
Strategic Rationale
•
•
•
• |
 Transaction Overview
9
•
Each shareholder of NBOH will elect to receive $32.15 per share
in cash or 4.034 shares of FMNB, subject to 80% of the shares
being exchanged for stock and 20% for cash
Structure/Consideration
•
$74.0 million based on FMNB’s 20-day volume weighted
average price of $7.97 as of January 26, 2015
•
Deal value/tangible book value
of
155%
1
•
Deal value/ LTM Earnings of 12.5x
1
•
Core deposit premium of 6.8%
1,2
Purchase Price
•
FMNB will add two NBOH directors to its Board of Directors:
James R. Smail
& Howard J. Wenger
•
Mark Witmer to join FMNB as Senior Executive Vice President,
Chief Community Banking Officer
Board/Management
•
Customary regulatory approvals and shareholder approvals of
both FMNB and NBOH
•
Estimated close 1
st
half of 2015
Required Approvals/
Timing
(1)
Deal pricing metrics based on aggregate $74.0 million deal value and
NBOH 12/31/14 financials
(2)
Core deposit premium defined as aggregate deal value less NBOH’s
tangible equity divided by NBOH’s deposits less time deposits > $100k |
 •
Maintains community bank in Wayne County
•
Combined Company synergies
–
Wealth Management
–
Agricultural lending
–
Mortgage lending/operations
•
Increases legal lending limit
•
Develops deeper comprehensive platform for banking
•
Maintains similar cultures
•
Creates greater liquidity for shareholders
10
Partnership –
Selecting Farmers |
 •
High performing Northeastern Ohio
community bank with 2014 ROAA of 1.16%
•
Compounded annualized growth rate for
gross loans of 23% since Q1 2012
•
Net income compounded annualized growth
rate of 31% from 2011FY to 2014FY
11
National Bancshares Corporation
Overview
Gross Loans ($M)
ROAA
Net Income (000’s)
Source: SNL Financial and internal management reports
|
 12
2014 A Record Year
•
•
•
•
NBOH 2014 Financial Highlights
National Bancshares achieved record net income, return on average
assets, return on average equity, loan balances, deposit
balances and efficiency ratio in 2014
Total assets at December 31, 2014 were a record $529.6 million compared
to $476.2 million at December 31, 2013
Total loans were $402.6 million as of December 31, 2014 which
represents more than twice the amount when compared to
year-end 2010 Growth was primarily due to an increase in
one-to-four family residential loans, farmland and
agricultural production loans and consumer loans |
 •
Farmers welcomes NBOH Board members Jim Smail and Howard Wenger as new
FMNB Board Members to help provide leadership and guidance in
the Wayne County market
•
Mark Witmer, CEO of National Bancshares Corporation and First National
Bank, is a capable and respected leader and has agreed to join
Farmers as Senior Executive Vice President, Chief Community
Banking Officer •
Mark has assembled a successful and loyal management team with which
Farmers is pleased to partner
•
Since Mark joined as CEO in January 2012, NBOH has seen impressive
growth: •
We are pleased to offer continued employment to key management
personnel and virtually all of NBOH’s lenders, business
development and customer-facing personnel 13
Talented Management and Staff
NBOH Historical Performance
($M)
FYE 2011
FYE 2014
CAGR
Loans
$217
$403
23%
Deposits
$341
$418
7%
ROAA
0.66%
1.16%
-
ROAE
6.39%
11.92%
-
Net Income
$2.6
$5.9
31% |
 14
Due Diligence Summary
•
Estimated loan mark of $4.4 million (107%
of reserves) as of 12/31/14
–
4.0x coverage of non-performing
loans as of 12/31/14
•
Write-down of OREO of $74k (10%)
•
Write-down of fixed assets of $837k
•
Write-up of loans of $913k (rate)
•
Write-up of deposits of
$576k (rate)
•
Assumes 25% cost savings, 65% in 2015
and 100% thereafter
•
After-tax, one-time merger charges are
estimated at $3.5 million
Modeling Assumptions
•
Comprehensive due diligence process
•
Two tiered credit due diligence process
completed
by
senior
management
and
3
rd
party
loan review team
•
Analyzed credit files, underwriting
methodology and policy and portfolio
management processes
•
FMNB’s credit reviews focused on the largest
relationships, adversely classified assets and
watch list loans
•
Both organizations use the same core
processing vendor and share the same outside
audit firm
•
NBOH completed comparable reverse due
diligence on FMNB |
 Pro Forma Loan Portfolio
15
FMNB
NBOH
Pro Forma
Source: Preliminary company reports as of 12/31/14; excludes loans held
for sale. Note: Pro forma composition excludes purchase
accounting adjustments. (1)
(2)
MRQ Yield On Loans:
4.35%
MRQ Yield On Loans:
4.90%
MRQ Yield On Loans:
4.69%
Loans ($000)
Construction & Land
$ 20,217
3.0%
Residential Mortgage
147,197
22.2%
Home Equity
31,255
4.7%
Commercial Real Estate
207,756
31.3%
C & I
120,150
18.1%
Consumer & Other
137,277
20.7%
Total
$ 663,852
100.0%
Loans ($000)
Construction & Land
$ 47,835
4.5%
Residential Mortgage
232,078
21.8%
Home Equity
71,951
6.7%
Commercial Real Estate
348,341
32.7%
C & I
182,158
17.1%
Consumer & Other
184,134
17.3%
Total
$ 1,066,497
100.0%
Loans ($000)
Construction & Land
$ 27,833
6.9%
Residential Mortgage
126,830
31.5%
Home Equity
40,087
10.0%
Commercial Real Estate
114,551
28.4%
C & I
62,702
15.6%
Consumer & Other
30,642
7.6%
Total
$ 402,645
100.0%
Includes loans secured by farmland.
Includes agricultural production loans.
3.0%
22.2%
4.7%
31.3%
18.1%
20.7%
Construction & Land
Residential Mortgage
Home Equity
Commercial Real Estate
C & I
Consumer & Other
4.5%
21.8%
6.7%
32.7%
17.1%
17.3%
Construction & Land
Residential Mortgage
Home Equity
Commercial Real Estate
C & I
Consumer & Other
Construction & Land
Residential Mortgage
Home Equity
Commercial Real Estate1
C & I2
Consumer & Other
6.9%
31.5%
28.4%
7.6%
15.6%
10.0%
1
2 |
 Pro Forma Deposit Mix
16
FMNB
NBOH
Pro Forma
Source: Preliminary company reports as of 12/31/14.
Note: Pro forma composition excludes purchase accounting
adjustments. MRQ Cost Of Deposits:
0.31%
MRQ Cost Of Deposits:
0.41%
MRQ Cost Of Deposits:
0.38%
Deposits ($000)
Noninterest-bearing Deposits
$184,697
20.2%
IB Demand, Savings & MMDA
524,054
57.2%
Retail Time Deposits
125,156
13.7%
Jumbo Time Deposits
81,796
8.9%
Total
915,703
$
100.0%
Deposits ($000)
Noninterest-bearing Deposits
218,748
$
16.4%
IB Demand, Savings & MMDA
845,487
63.4%
Retail Time Deposits
155,649
11.7%
Jumbo Time Deposits
114,151
8.6%
Total
1,334,035
$
100.0%
Deposits ($000)
Noninterest-bearing Deposits
$ 34,051
8.1%
IB Demand, Savings & MMDA
309,578
74.0%
Retail Time Deposits
40,192
9.6%
Jumbo Time Deposits
34,511
8.2%
Total
$ 418,332
100.0%
20.2%
57.2%
13.7%
8.9%
Noninterest-bearing Deposits
IB Demand, Savings & MMDA
Retail Time Deposits
Jumbo Time Deposits
16.4%
63.4%
11.7%
8.6%
Noninterest-bearing Deposits
IB Demand, Savings & MMDA
Retail Time Deposits
Jumbo Time Deposits
Noninterest-bearing Deposits
IB Demand, Savings & MMDA
Retail Time Deposits
Jumbo Time Deposits
8.1%
74.0%
9.6%
8.2% |
 Favorable Financial Metrics
17
(1)
Tangible book value per share earnback period defined as number of
years for pro forma tangible book value per share to exceed projected standalone tangible book value per share (“crossover”)
•
Farmers expects the transaction to be accretive to
2016 earnings per share by over 20% assuming fully
phased in cost savings
•
Estimated internal rate of return in excess of 20%
•
Manageable level of tangible book value dilution
earned back in approximately 4 years using the
“crossover”
method of calculation
1
•
Estimated tangible common equity/tangible assets of
approximately 9% at close
•
NBOH shareholders will own approximately 28% of
the combined company enabling both sets of
shareholders to benefit from the synergies of the
merger |
 Summary Highlights
•
Creates a leading Northeastern Ohio community banking franchise with
added scale, enhanced profitability and growth potential
•
Strong regional presence and brand recognition with outstanding
customer service
•
Financially
compelling:
>20%
EPS
accretion
in
2016
and
>20%
IRR
with
manageable TBV earnback
•
Attractively valued pro forma company with significant upside
potential •
Strong capital base provides flexibility with respect to growth and
capital management
•
Creates
a
combined
company
which
combines
the
best
practices
and
personnel
of both institutions
18 |