Attached files
| file | filename |
|---|---|
| 8-K - POLARIS INDUSTRIES INC. 8-K - Polaris Inc. | a51026913.htm |
| EX-99.1 - EXHIBIT 99.1 - Polaris Inc. | a51026913_ex991.htm |
Exhibit 99.2
Fourth Quarter & Full Year 2014 Earnings Results January 27, 2015 POLARIS INDUSTRIES INC.
Safe Harbor Except for historical information contained herein, the matters set forth in this document, including but not limited to management’s expectations regarding 2015 sales, shipments, margins, net income and cash flow, the opportunities for expansion and diversification of the Company’s business and the Company’s guidance on earnings per share from continuing operations are forward-looking statements that involve certain risks and uncertainties that could cause actual results to differ materially from those forward-looking statements. Potential risks and uncertainties include such factors as product offerings, promotional activities and pricing strategies by competitors; manufacturing operation initiatives; acquisition integration costs; warranty expenses; foreign currency exchange rate fluctuations; environmental and product safety regulatory activity; effects of weather; commodity costs; uninsured product liability claims; uncertainty in the retail and wholesale credit markets; performance of affiliate partners; changes in tax policy and overall economic conditions, including inflation, consumer confidence and spending and relationships with dealers and suppliers. Investors are also directed to consider other risks and uncertainties discussed in our 2013 annual report and Form 10-K filed by the Company with the Securities and Exchange Commission. The Company does not undertake any duty to any person to provide updates to its forward-looking statements. The data source for retail sales figures included in this presentation is registration information provided by Polaris dealers in North America and compiled by the Company or Company estimates. The Company must rely on information that its dealers supply concerning retail sales, and other retail sales data sources and this information is subject to revision. Q4-FY14 1/27/15 2

Scott W. Wine Chairman & CEO Fourth Quarter & Full Year 2014 Earnings Results January 27, 2015 POLARIS INDUSTRIES INC.
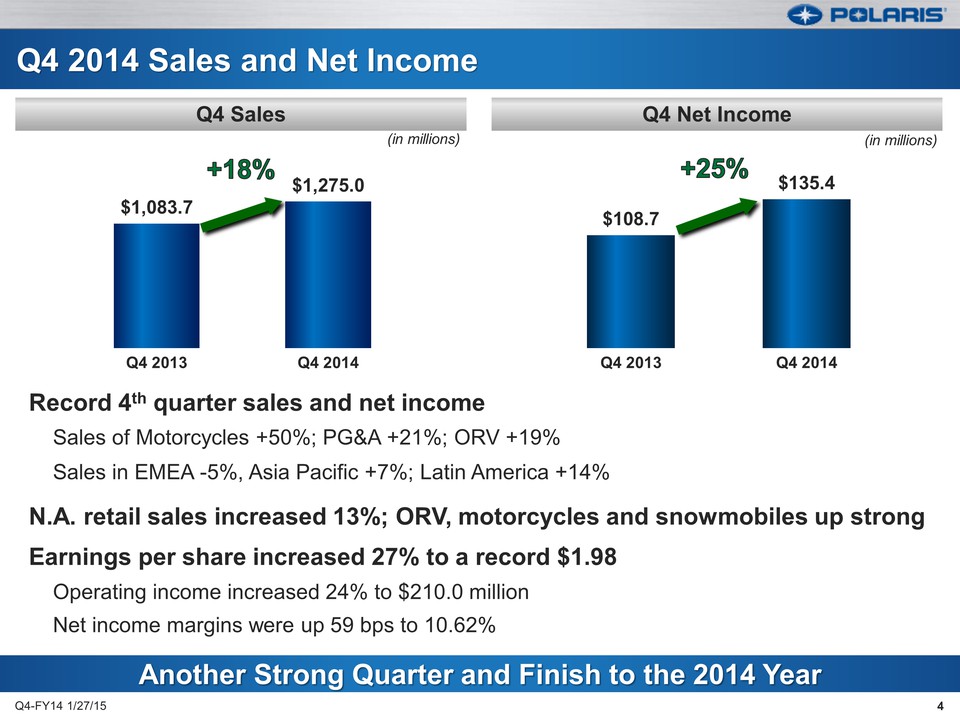
Q4 2014 Sales and Net Income Record 4th quarter sales and net income Sales of Motorcycles +50%; PG&A +21%; ORV +19% Sales in EMEA -5%, Asia Pacific +7%; Latin America +14% N.A. retail sales increased 13%; ORV, motorcycles and snowmobiles up strong Earnings per share increased 27% to a record $1.98 Operating income increased 24% to $210.0 million Net income margins were up 59 bps to 10.62% $1,083.7 $1,275.0 Q4 2013 Q4 2014 Another Strong Quarter and Finish to the 2014 Year Q4 Sales Q4 Net Income (in millions) (in millions) Q4-FY14 1/27/15 4 $108.7 $135.4 Q4 2013 Q4 2014 +18% +25%
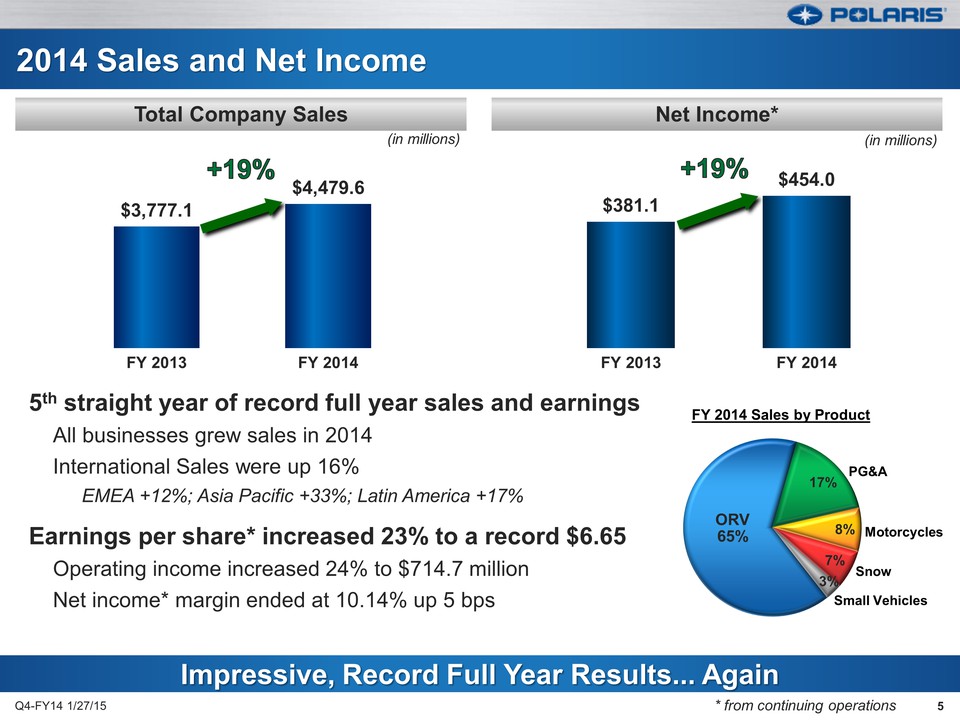
2014 Sales and Net Income 5th straight year of record full year sales and earnings All businesses grew sales in 2014 International Sales were up 16% EMEA +12%; Asia Pacific +33%; Latin America +17% Earnings per share* increased 23% to a record $6.65 Operating income increased 24% to $714.7 million Net income* margin ended at 10.14% up 5 bps $3,777.1 $4,479.6 FY 2013 FY 2014 Impressive, Record Full Year Results... Again Total Company Sales Net Income +19% ORV 65% 17% 8% 7% 3% Motorcycles Small Vehicles Snow PG&A FY 2014 Sales by Product $381.1 $454.0 FY 2013 FY 2014
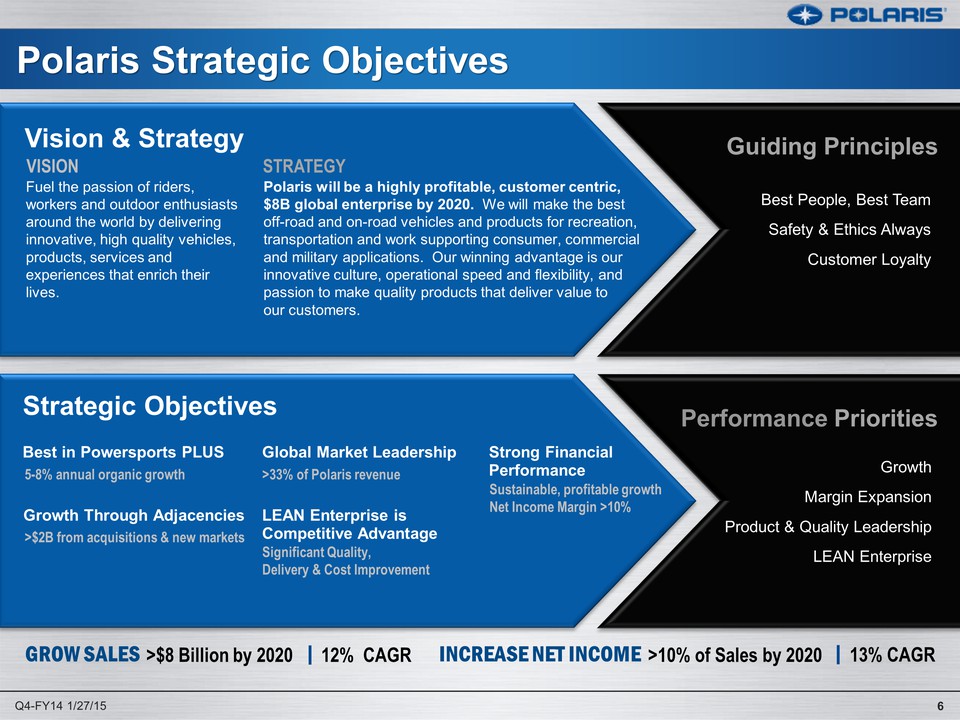
Polaris Strategic Objectives Vision & Strategy VISION STRATEGY Fuel the passion of riders, workers and outdoor enthusiasts around the world by delivering innovative, high quality vehicles, products, services and experiences that enrich their lives. Polaris will be a highly profitable, customer centric, $8B global enterprise by 2020. We will make the best off-road and on-road vehicles and products for recreation, transportation and work supporting consumer, commercial and military applications. Our winning advantage is our innovative culture, operational speed and flexibility, and passion to make quality products that deliver value to our customers. Strategic Objectives Best in Powersports PLUS Global Market Leadership Strong Financial Performance Growth Through Adjacencies LEAN Enterprise is Competitive Advantage 5-8% annual organic growth >33% of Polaris revenue >$2B from acquisitions & new markets Significant Quality, Delivery & Cost Improvement Sustainable, profitable growth Net Income Margin >10% Guiding Principles Performance Priorities Best People, Best Team Safety & Ethics Always Customer Loyalty Growth Margin Expansion Product & Quality Leadership LEAN Enterprise GROW SALES >$8 Billion by 2020 12% CAGR INCREASE NET INCOME >10% of Sales by 2020 13% CAGR Q4-FY14 1/27/15 6
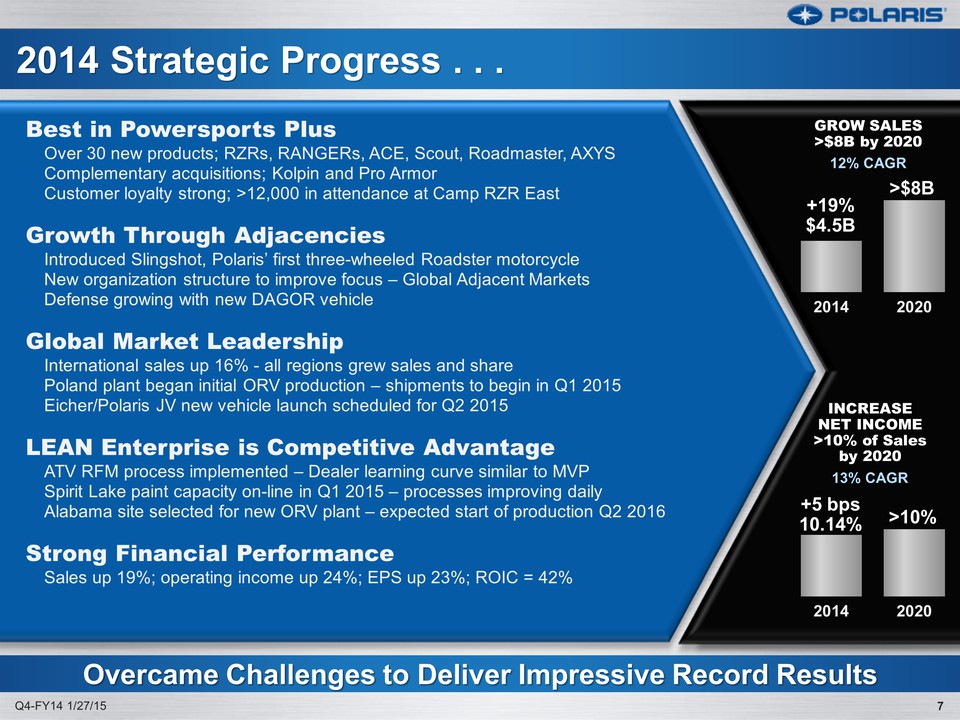
Best in Powersports Plus Over 30 new products; RZRs, RANGERs, ACE, Scout, Roadmaster, AXYS Complementary acquisitions; Kolpin and Pro Armor Customer loyalty strong; >12,000 in attendance at Camp RZR East Growth Through Adjacencies Introduced Slingshot, Polaris’ first three-wheeled Roadster motorcycle New organization structure to improve focus – Global Adjacent Markets Defense growing with new DAGOR vehicle Global Market Leadership International sales up 16% - all regions grew sales and share Poland plant began initial ORV production – shipments to begin in Q1 2015 Eicher/Polaris JV new vehicle launch scheduled for Q2 2015 LEAN Enterprise is Competitive Advantage ATV RFM process implemented – Dealer learning curve similar to MVP Spirit Lake paint capacity on-line in Q1 2015 – processes improving daily Alabama site selected for new ORV plant – expected start of production Q2 2016 Strong Financial Performance Sales up 19%; operating income up 24%; EPS up 23%; ROIC = 42% 2014 2020 GROW SALES >$8B by 2020 12% CAGR +19% $4.5B >$8B Overcame Challenges to Deliver Impressive Record Results 2014 2014 Strategic Progress . . . Q4-FY14 1/27/15 GROW SALES >$8B by 2020 12% CAGR +19% $4.5B >$8B 2014 2020 GROW SALES >$8B by 2020 12% CAGR +19% $4.5B >$8B Overcame Challenges to Deliver Impressive Record Results 2014 2020 INCREASE NET INCOME >10% of Sales by 2020 13% CAGR +5 bps 10.14% >10%
Bennett Morgan President & COO Fourth Quarter & Full Year 2014 Earnings Results January 27, 2015 POLARIS INDUSTRIES INC.
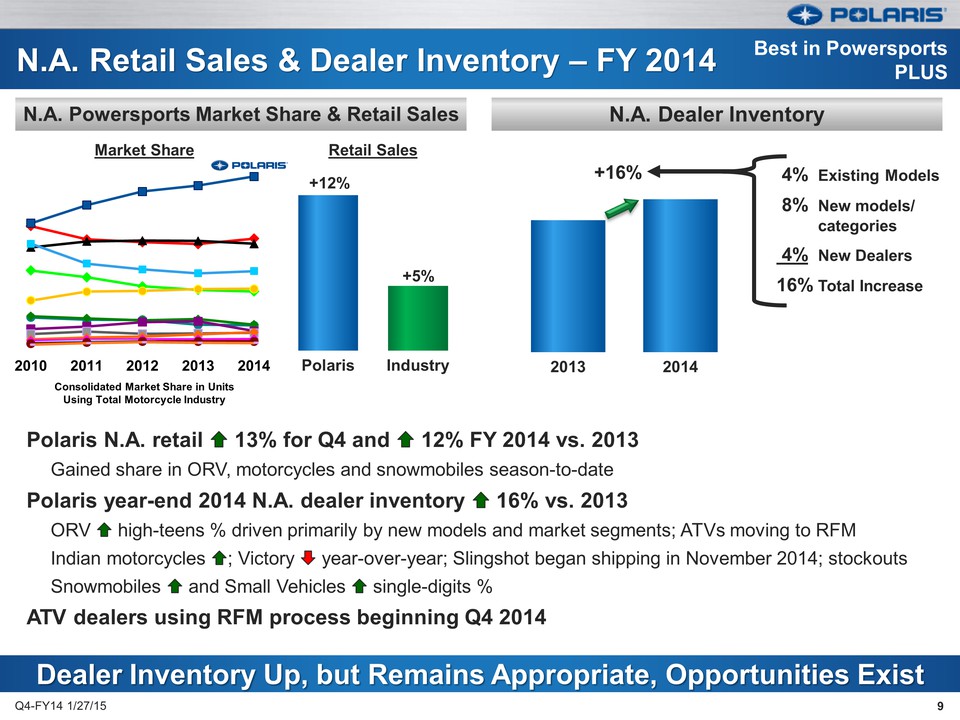
N.A. Retail Sales & Dealer Inventory – FY 2014 Dealer Inventory Up, but Remains Appropriate, Opportunities Exist N.A. Powersports Market Share & Retail Sales N.A. Dealer Inventory Polaris N.A. retail 13% for Q4 and 12% FY 2014 vs. 2013 Gained share in ORV, motorcycles and snowmobiles season-to-date Polaris year-end 2014 N.A. dealer inventory 16% vs. 2013 ORV high-teens % driven primarily by new models and market segments; ATVs moving to RFM Indian motorcycles ; Victory year-over-year; Slingshot began shipping in November 2014; stockouts Snowmobiles and Small Vehicles single-digits % ATV dealers using RFM process beginning Q4 2014 2010 2011 2012 2013 2014 Polaris Industry +5% +12% Q4-FY14 1/27/15 9 Market Share Retail Sales 4% Existing Models 8% New models/ categories 4% New Dealers 16% Total Increase +16%
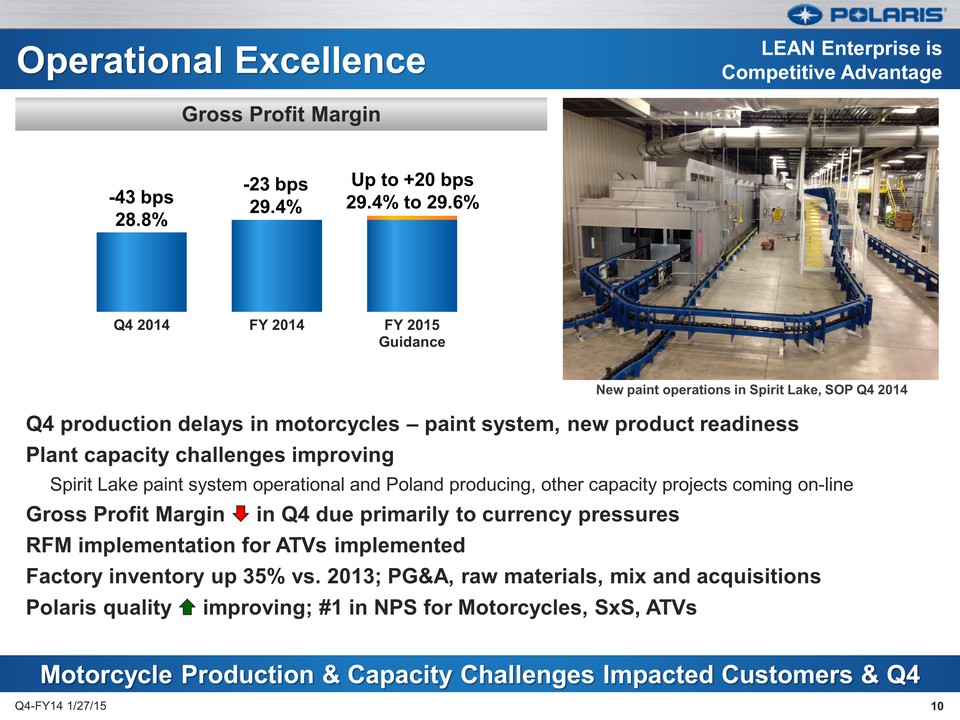
Operational Excellence Q4 production delays in motorcycles – paint system, new product readiness Plant capacity challenges improving Spirit Lake paint system operational and Poland producing, other capacity projects coming on-line Gross Profit Margin in Q4 due primarily to currency pressures RFM implementation for ATVs implemented Factory inventory up 35% vs. 2013; PG&A, raw materials, mix and acquisitions Polaris quality improving; #1 in NPS for Motorcycles, SxS, ATVs Q4-FY14 1/27/15 LEAN Enterprise is Competitive Advantage -43 bps 28.8% -23 bps 29.4% Up to +20 bps 29.4% to 29.6% New paint operations in Spirit Lake, SOP Q4 2014 -43 bps 28.8% -23 bps 29.4% Up to +20 bps 29.4% to 29.6% Q4 2014 FY 2014 FY 2015 Guidance New paint operations in Spirit Lake, SOP Q4 2014 Motorcycle Production & Capacity Challenges Impacted Customers & Q4 10
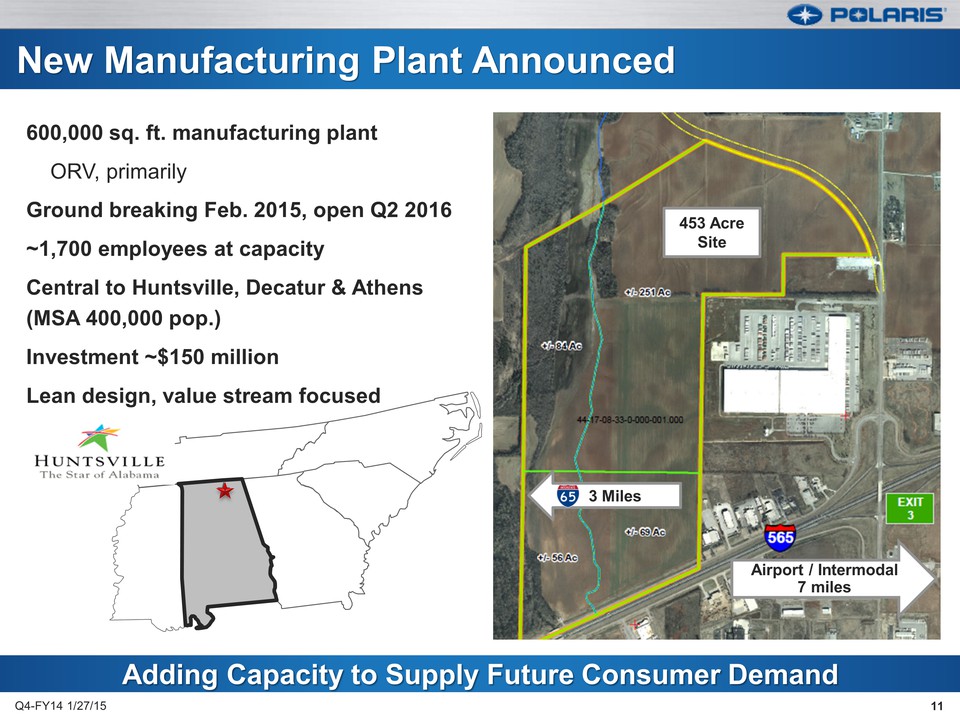
New Manufacturing Plant Announced 600,000 sq. ft. manufacturing plant ORV, primarily Ground breaking Feb. 2015, open Q2 2016 ~1,700 employees at capacity Central to Huntsville, Decatur & Athens (MSA 400,000 pop.) Investment ~$150 million Lean design, value stream focused Q4-FY14 1/27/15 11 Adding Capacity to Supply Future Consumer Demand 453 Acre Site 3 Miles Airport / Intermodal 7 miles 11
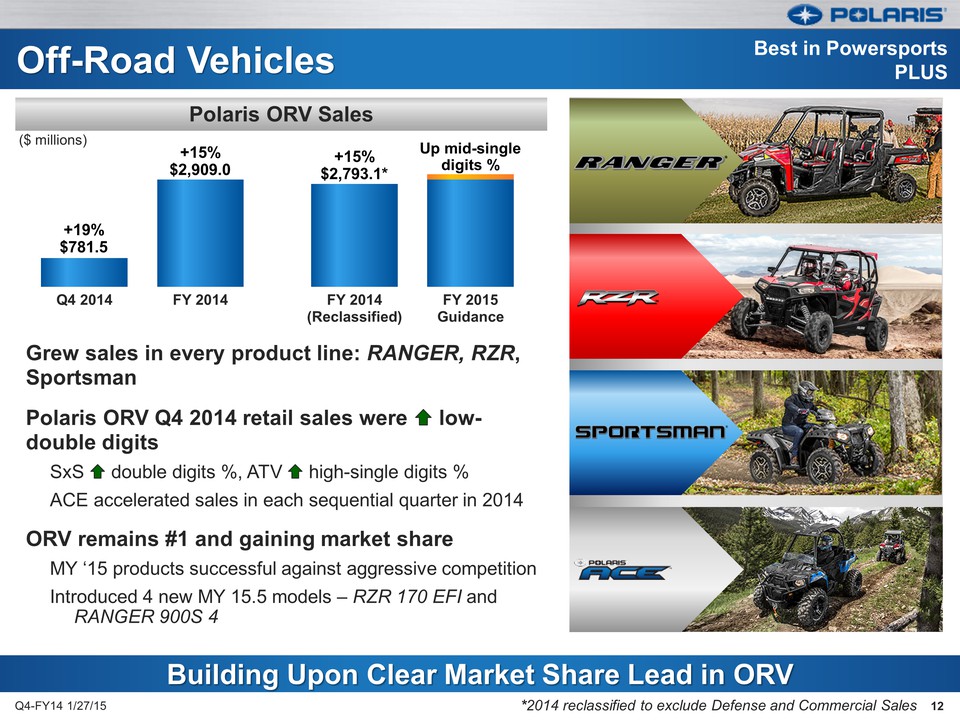
Off-Road Vehicles Grew sales in every product line: RANGER, RZR, Sportsman Polaris ORV Q4 2014 retail sales were lowdouble digits SxS double digits %, ATV high-single digits % ACE accelerated sales in each sequential quarter in 2014 ORV remains #1 and gaining market share MY ‘15 products successful against aggressive competition Introduced 4 new MY 15.5 models – RZR 170 EFI and RANGER 900S 4 Q4-FY14 1/27/15 12 Polaris ORV Sales Up mid-single digits % +15% $2,909.0 Best in Powersports PLUS +19% $781.5 ($ millions) +15% $2,793.1* FY 2014 (Reclassified) FY 2015 Guidance Q4 2014 FY 2014 Building Upon Clear Market Share Lead in ORV 12
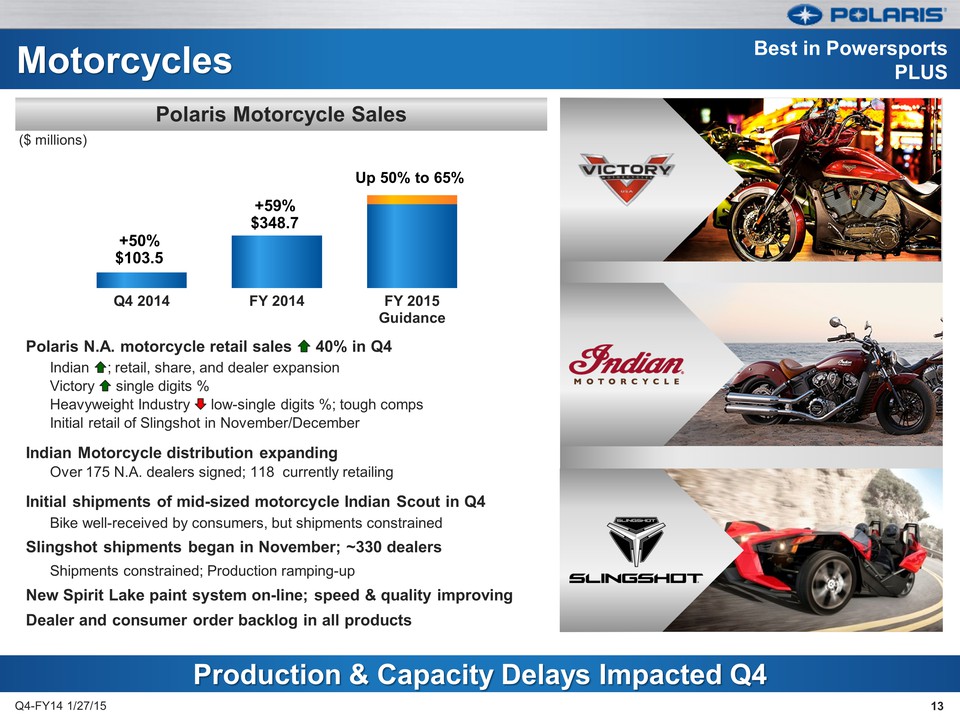
Motorcycles Polaris N.A. motorcycle retail sales 40% in Q4 Indian ; retail, share, and dealer expansion Victory single digits % Heavyweight Industry low-single digits %; tough comps Initial retail of Slingshot in November/December Indian Motorcycle distribution expanding Over 175 N.A. dealers signed; 118 currently retailing Initial shipments of mid-sized motorcycle Indian Scout in Q4 Bike well-received by consumers, but shipments constrained Slingshot shipments began in November; ~330 dealers Shipments constrained; Production ramping-up New Spirit Lake paint system on-line; speed & quality improving Dealer and consumer order backlog in all products Q4-FY14 1/27/15 13 Polaris Motorcycle Sales Q4 2014 FY 2014 FY 2015 Guidance Q4 2014 FY 2014 FY 2015 Guidance Up 50% to 65% +59% $348.7 +50% $103.5 ($ millions) Best in Powersports PLUS
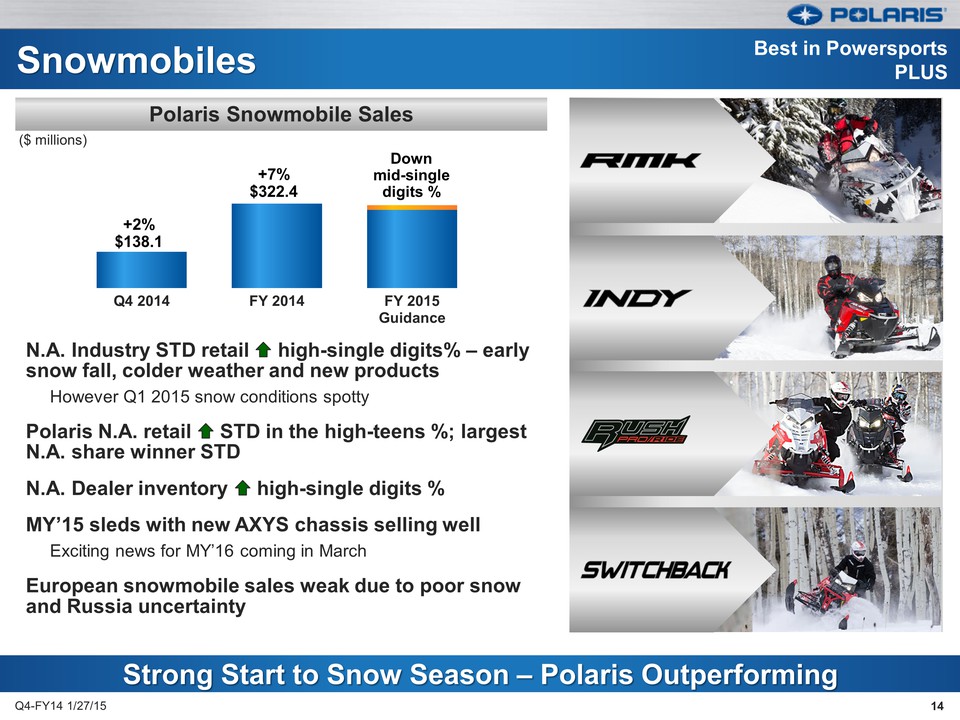
Snowmobiles N.A. Industry STD retail high-single digits% – early snow fall, colder weather and new products However Q1 2015 snow conditions spotty Polaris N.A. retail STD in the high-teens %; largest N.A. share winner STD N.A. Dealer inventory high-single digits % MY’15 sleds with new AXYS chassis selling well Exciting news for MY’16 coming in March European snowmobile sales weak due to poor snow and Russia uncertainty Q4-FY14 1/27/15 14 Polaris Snowmobile Sales Q4 2014 FY 2014 FY 2015 Guidance ($ millions) Down mid-single digits % +2% $138.1 +7% $322.4 Best in Powersports PLUS Strong Start to Snow Season – Polaris Outperforming
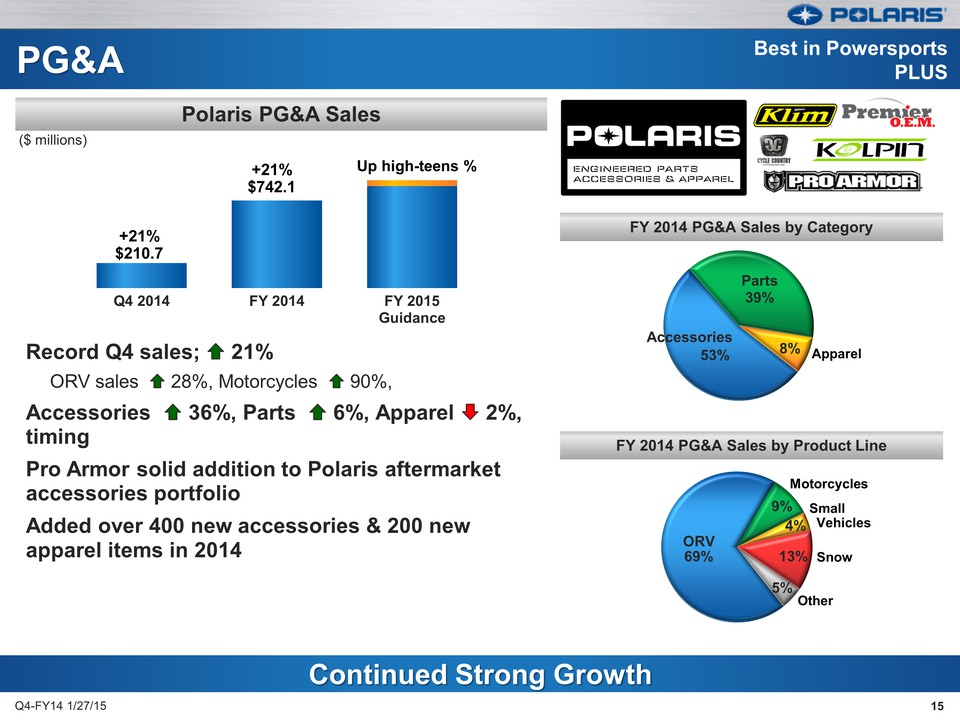
PG&A Record Q4 sales; 21% ORV sales 28%, Motorcycles 90%, Accessories 36%, Parts 6%, Apparel 2%, timing Pro Armor solid addition to Polaris aftermarket accessories portfolio Added over 400 new accessories & 200 new apparel items in 2014 Q4-FY14 1/27/15 15 Continued Strong Growth Polaris PG&A Sales Q4 2014 FY 2014 FY 2015 Guidance +21% Up high-teens % $742.1 +21% $210.7 ($ millions) FY 2014 PG&A Sales by Product Line Motorcycles Small Vehicles Other Apparel Snow Parts 39% 8% Accessories ORV 69% 9% 4% 13% 5% FY 2014 PG&A Sales by Category ORV 69% 9% 4% 13% 5% FY 2014 PG&A Sales by Category FY 2014 PG&A Sales by Product Line Motorcycles Small Vehicles Other
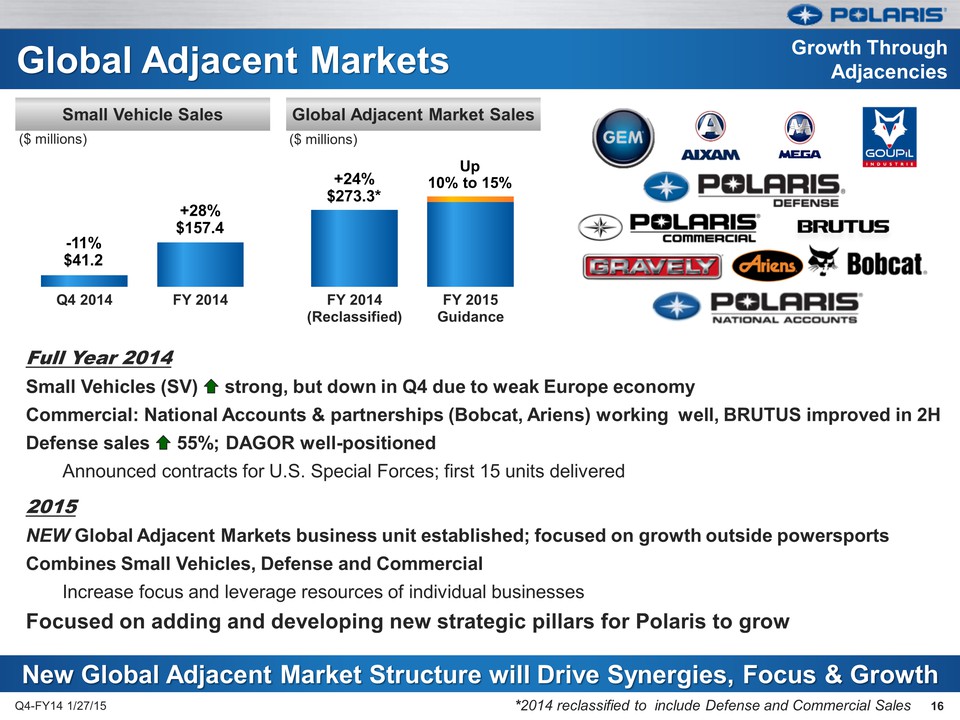
Global Adjacent Markets Full Year 2014 Small Vehicles (SV) strong, but down in Q4 due to weak Europe economy Commercial: National Accounts & partnerships (Bobcat, Ariens) working well, BRUTUS improved in 2H Defense sales 55%; DAGOR well-positioned Announced contracts for U.S. Special Forces; first 15 units delivered 2015 NEW Global Adjacent Markets business unit established; focused on growth outside powersports Combines Small Vehicles, Defense and Commercial Increase focus and leverage resources of individual businesses Focused on adding and developing new strategic pillars for Polaris to grow Q4-FY14 1/27/15 16 New Global Adjacent Market Structure will Drive Synergies, Focus & Growth Small Vehicle Sales Up +24% 10% to 15% $273.3* Growth Through Adjacencies -11% $41.2 ($ millions) +28% $157.4 Global Adjacent Market Sales ($ millions) *2014 reclassified to include Defense and Commercial Sales Q4 2014 FY 2014 FY 2014 (Reclassified) FY 2015 Guidance
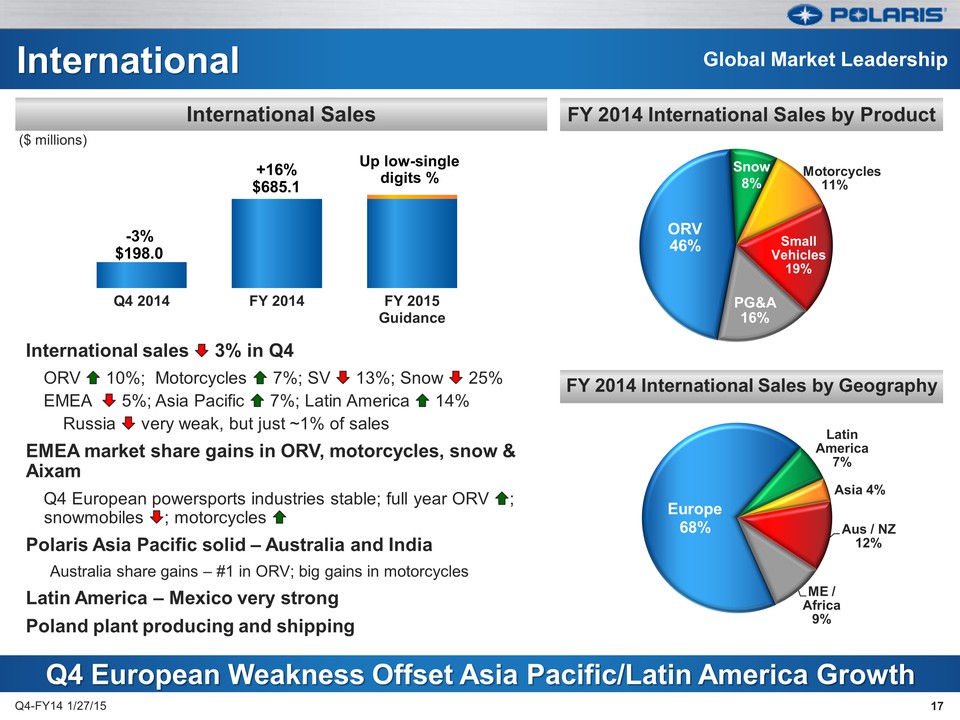
ORV 46% Small Vehicles 19% PG&A 16% International International sales 3% in Q4 ORV 10%; Motorcycles 7%; SV 13%; Snow 25% EMEA 5%; Asia Pacific 7%; Latin America 14% Russia very weak, but just ~1% of sales EMEA market share gains in ORV, motorcycles, snow & Aixam Q4 European powersports industries stable; full year ORV ; snowmobiles ; motorcycles Polaris Asia Pacific solid – Australia and India Australia share gains – #1 in ORV; big gains in motorcycles Latin America – Mexico very strong Poland plant producing and shipping Q4-FY14 1/27/15 17 Q4 European Weakness Offset Asia Pacific/Latin America Growth International Sales Q4 2014 FY 2014 FY 2015 Guidance FY 2014 International Sales by Product FY 2014 International Sales by Geography Up low-single +16% digits % $685.1 Global Market Leadership -3% $198.0 ($ millions) Motorcycles 11% Europe 68% Latin America 7% Asia 4% Aus / NZ 12% ME / Africa 9%
Mike Malone V.P. Finance & CFO Fourth Quarter & Full Year 2014 Earnings Results January 27, 2015 POLARIS INDUSTRIES INC.
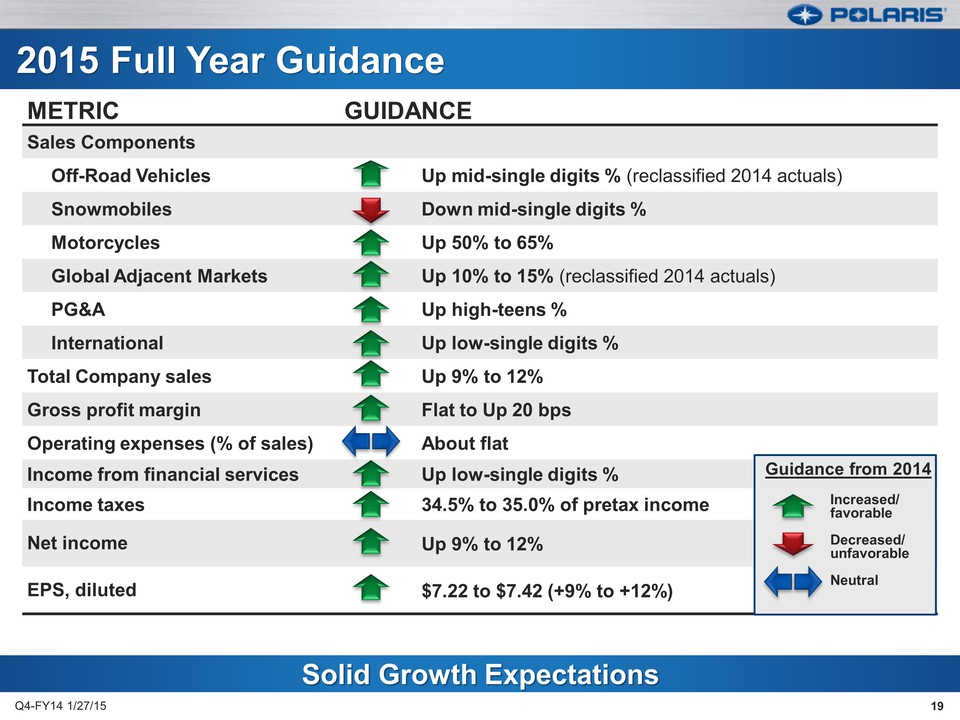
GUIDANCE Sales Components Off-Road Vehicles Up mid-single digits % (reclassified 2014 actuals) Snowmobiles Down mid-single digits % Motorcycles Up 50% to 65% Global Adjacent Markets Up 10% to 15% (reclassified 2014 actuals) PG&A Up high-teens % International Up low-single digits % Total Company sales Up 9% to 12% Gross profit margin Flat to Up 20 bps Operating expenses (% of sales) About flat Income from financial services Up low-single digits % Income taxes 34.5% to 35.0% of pretax income Net income Up 9% to 12% EPS, diluted $7.22 to $7.42 (+9% to +12%) Solid Growth Expectations 2015 Full Year Guidance Guidance from 2014 Increased/ favorable Decreased/ unfavorable Neutral Q4-FY14 1/27/15 19 METRIC
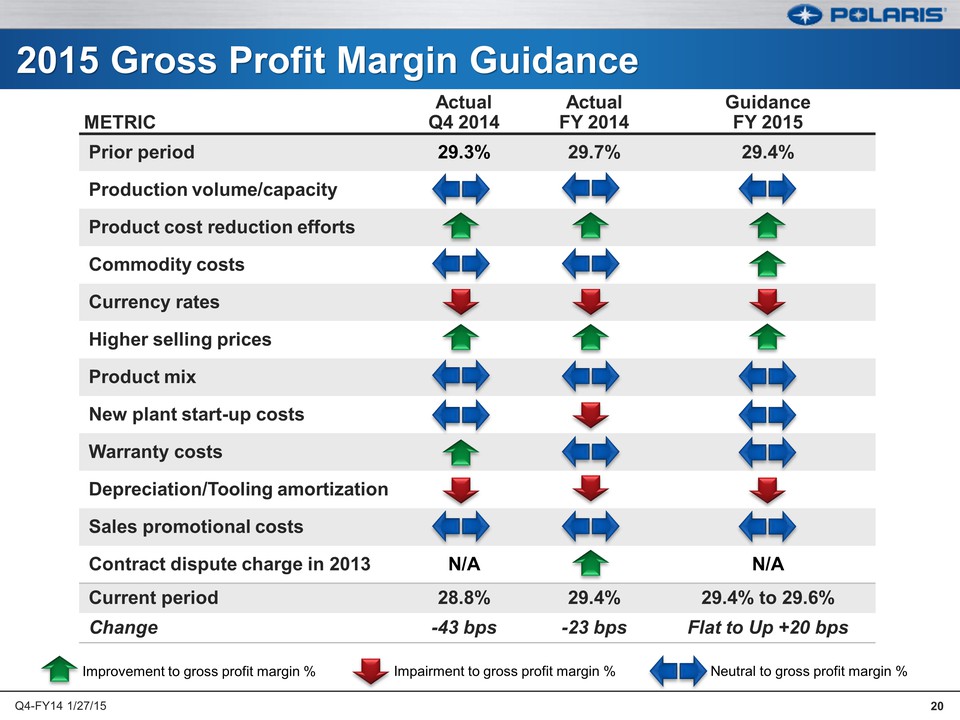
METRIC Actual Q4 2014 Actual FY 2014 Guidance FY 2015 Prior period 29.3% 29.7% 29.4% Production volume/capacity Product cost reduction efforts Commodity costs Currency rates Higher selling prices Product mix New plant start-up costs Warranty costs Depreciation/Tooling amortization Sales promotional costs Contract dispute charge in 2013 N/A N/A Current period 28.8% 29.4% 29.4% to 29.6% Change -43 bps -23 bps Flat to Up +20 bps 2015 Gross Profit Margin Guidance Improvement to gross profit margin % Impairment to gross profit margin % Neutral to gross profit margin % Q4-FY14 1/27/15 20
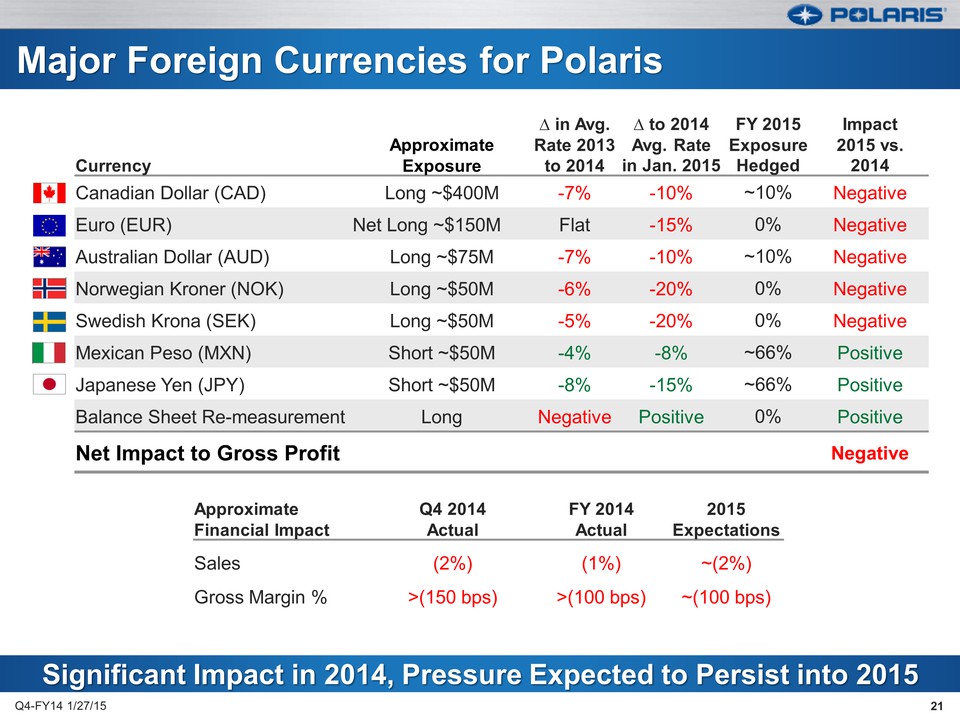
Major Foreign Currencies for Polaris Q4-FY14 1/27/15 Currency Approximate Exposure Δ in Avg. Rate 2013 to 2014 Δ to 2014 Avg. Rate in Jan. 2015 FY 2015 Exposure Hedged Impact 2015 vs. 2014 Canadian Dollar (CAD) Long ~$400M -7% -10% ~10% Negative Euro (EUR) Net Long ~$150M Flat -15% 0% Negative Australian Dollar (AUD) Long ~$75M -7% -10% ~10% Negative Norwegian Kroner (NOK) Long ~$50M -6% -20% 0% Negative Swedish Krona (SEK) Long ~$50M -5% -20% 0% Negative Mexican Peso (MXN) Short ~$50M -4% -8% ~66% Positive Japanese Yen (JPY) Short ~$50M -8% -15% ~66% Positive Balance Sheet Re-measurement Long Negative Positive 0% Positive Net Impact to Gross Profit Negative Approximate Financial Impact Q4 2014 Actual FY 2014 Actual 2015 Expectations Sales (2%) (1%) ~(2%) Gross Margin % >(150 bps) >(100 bps) ~(100 bps) Significant Impact in 2014, Pressure Expected to Persist into 2015 21
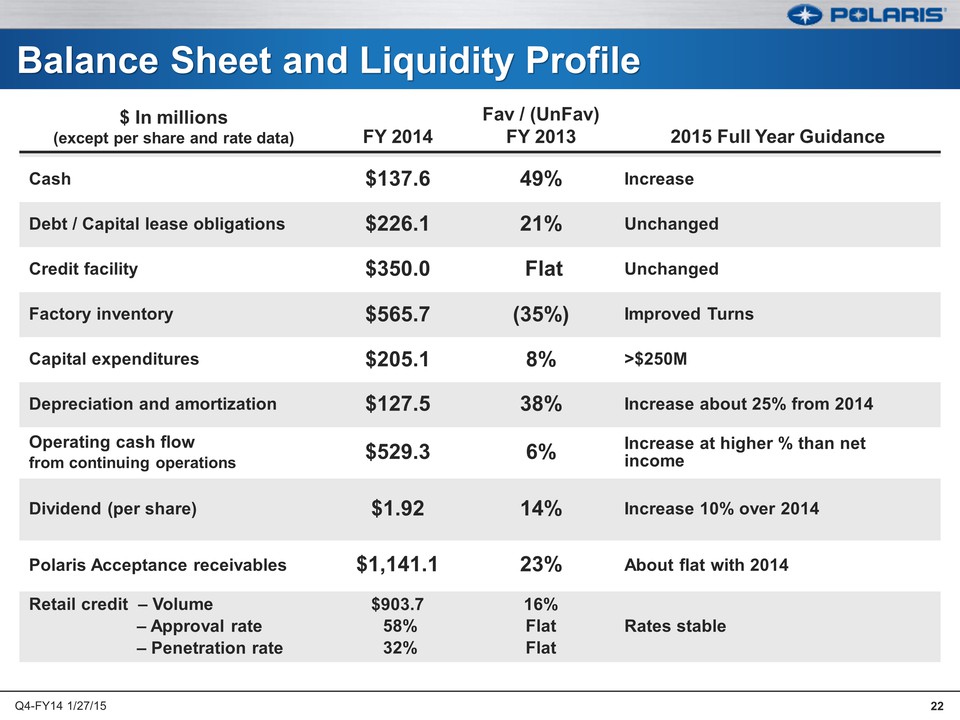
Balance Sheet and Liquidity Profile $ In millions (except per share and rate data) FY 2014 Fav / (UnFav) FY 2013 2015 Full Year Guidance Cash $137.6 49% Increase Debt / Capital lease obligations $226.1 21% Unchanged Credit facility $350.0 Flat Unchanged Factory inventory $565.7 (35%) Improved Turns Capital expenditures $205.1 8% >$250M Depreciation and amortization $127.5 38% Increase about 25% from 2014 Operating cash flow from continuing operations $529.3 6% Increase at higher % than net income Dividend (per share) $1.92 14% Increase 10% over 2014 Polaris Acceptance receivables $1,141.1 23% About flat with 2014 Retail credit – Volume – Approval rate – Penetration rate $903.7 58% 32% 16% Flat Flat Rates stable Q4-FY14 1/27/15 22
Scott W. Wine Chairman & CEO Fourth Quarter & Full Year 2014 Earnings Results January 27, 2015 POLARIS INDUSTRIES INC.
Improved Execution will Drive 6th Consecutive Year of Record Results 24 Summary – 2015 Business Outlook Q4-FY14 1/27/15 U.S. Economy improving; Europe weak Oil/gas and Ag/farm industries manageable; currency challenges ongoing Powersports Industry growing; competition remains aggressive Innovation & dealer focus continues growth in ORV’s Bigger year for motorcycles; much improved execution Indian expansion continues; Slingshot wows & grows; Victory races forward Global Adjacent Markets; New leader, aggressive growth plans “Work & Transportation” focus: Small Vehicles, Defense & Commercial PG&A growth continues; opportunities abound Retail improvements and M&A accelerate Operations/LEAN moves to next level of execution Quality, Delivery, Inventory & Cost will improve

Thank you Questions?