Attached files
| file | filename |
|---|---|
| 8-K - INVESTOR PRESENTATION 8-K - American Midstream Partners, LP | item701forinvestorpresenta.htm |
American Midstream Partners, LP Investor Presentation January 2014

Forward Looking Statements 2 This presentation includes forward-looking statements. These statements relate to, among other things, projections of operational volumetrics and improvements, growth projects, cash flows and capital expenditures. We have used the words "anticipate,” "believe," "could," "estimate," "expect," "intend," "may," "plan," "predict," "project," "should," "will," "potential," and similar terms and phrases to identify forward- looking statements in this presentation. Although we believe the assumptions upon which these forward- looking statements are based are reasonable, any of these assumptions could prove to be inaccurate and the forward-looking statements based on these assumptions could be incorrect. Our operations involve risks and uncertainties, many of which are outside our control, and any one of which, or a combination of which, could materially affect our results of operations and whether the forward-looking statements ultimately prove to be correct. Actual results and trends in the future may differ materially from those suggested or implied by the forward-looking statements depending on a variety of factors which are described in greater detail in our filings with the SEC. Please see our Risk Factor disclosures included in our Annual Report on Form 10-K for the year ended December 31, 2012 filed on April 16, 2013 and our Quarterly Report on Form 10-Q for the quarter ended September 30, 2013 filed on November 13, 2013. All future written and oral forward-looking statements attributable to us or persons acting on our behalf are expressly qualified in their entirety by the previous statements. We undertake no obligation to update any information contained herein or to publicly release the results of any revisions to any forward- looking statements that may be made to reflect events or circumstances that occur, or that we become aware of, after the date of this press release.
COMPANY OVERVIEW 3

American Midstream Partners, LP 4 NYSE Ticker AMID Quarterly Distribution $0.4525 per unit ($1.81 per unit annualized) Yield (1) 6.9% Equity Market Cap (1,2) $283.0 million Enterprise Value (1,2,3) $534.6 million Outstanding Limited Partner Units (2) 10.8 million 1. As of market close on January 24, 2014. See AMID’s Quarterly Report on Form 10-Q for the quarter ended September 30, 2013 filed with the SEC on November 13, 2013 2. Assumes anticipated issuance of 3.4 million LP units on Jan. 29, 2014 in connection with the acquisition of the Penn Virginia assets 3. Includes Series A Convertible Preferred securities issued on April 15, 2013 and $30 million of Series B PIK Units to be issued in connection with the acquisition of assets from Penn Virginia

Key Investment Highlights Experienced and Incentivized Leadership Financial Strength • Management team with an average of more than 25 years of experience • GP controlled by ArcLight Capital (through High Point Infrastructure Partners), an established private equity firm with a successful history of investing in growth- oriented midstream companies • GP has significant investment in AMID equity interests • Sponsor expected to continue to provide growth capital, financing flexibility, and balance sheet support • $200 million revolving credit facility to fund growth projects • August 2013 equity restructuring eliminated subordinated units, resulted in improved distribution coverage and positioned us to grow 5 Credible Growth Strategy • Early stage growth company with 2013 annual total return of 111.4%1 • Acquisitions and development supported by experience and financial strength of General Partner (GP) sponsor • Potential for additional dropdowns • Bolt-on acquisition opportunities near existing AMID assets Diversified Asset Base • Exposure to both conventional Gulf basins and unconventional shale plays • Strategic focus on the Eagle Ford Shale • Strategically located to capitalize on producer focus on oil and NGLs • Supported by significant fee-based gross margin of ~70% including Blackwater (increasing to more than 70% pro forma for the PVA System acquisition) 2 • Blackwater acquisition provided business mix diversification 1. Calculated from 12/31/12 through 12/31/2013 2. Reflects TTM AMID gross margin, annualized High Point gross margin and forecasted 2014 gross margin for Blackwater and PVA

Diversified and Strategically Located Assets • Assets primarily located in Alabama, Louisiana, Mississippi, Tennessee, Texas and Georgia1 ― Eleven gathering systems, three processing facilities2, one fractionation facility, three interstate pipelines, five intrastate pipelines, and four terminals ― ~2,100 miles of pipelines that gather and transport more than 1 Bcf/d of natural gas ― ~1.3 million barrels of liquid storage capacity 6 Source of pipeline data: Hart Energy. Note: High Point system includes non-jurisdictional gathering pipelines. Gathering and Processing • Diversified asset portfolio • Significant portion of volumes driven by oil and liquids-rich wells • Opportunities to grow through organic system expansion and bolt-on acquisitions • Fee-based and POP contracts • Commodity exposure partially hedged Transmission • Geographically diverse asset base with broad range of customers • Opportunity to capture market share and add delivery points • 100% fee-based and fixed-margin business • Approximately 40% of gross margin derived from firm-transportation agreements Eagle Ford Development Terminals • 100% fee-based revenue • No direct commodity risk • Significant organic growth and expansion opportunities 1. AMID also owns one terminal in Maryland; does not include assets associated with the PVA acquisition, which is expected to close in Jan. 2014 2. AMID owns a 50% non-operating interest in the Burns Point processing plant
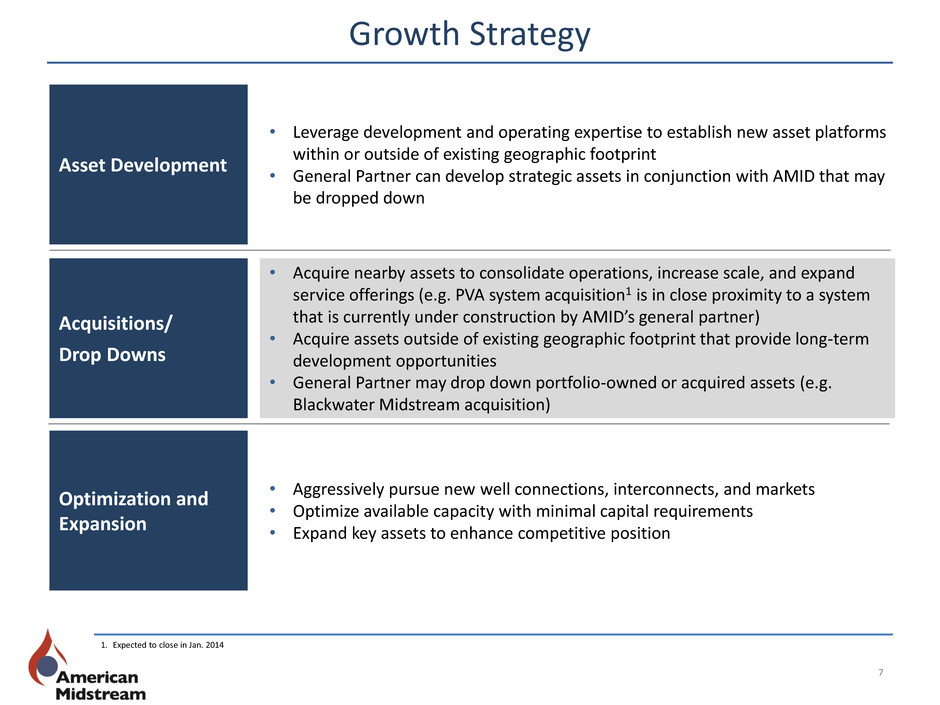
Growth Strategy Acquisitions/ Drop Downs • Acquire nearby assets to consolidate operations, increase scale, and expand service offerings (e.g. PVA system acquisition1 is in close proximity to a system that is currently under construction by AMID’s general partner) • Acquire assets outside of existing geographic footprint that provide long-term development opportunities • General Partner may drop down portfolio-owned or acquired assets (e.g. Blackwater Midstream acquisition) Optimization and Expansion • Aggressively pursue new well connections, interconnects, and markets • Optimize available capacity with minimal capital requirements • Expand key assets to enhance competitive position Asset Development • Leverage development and operating expertise to establish new asset platforms within or outside of existing geographic footprint • General Partner can develop strategic assets in conjunction with AMID that may be dropped down 7 1. Expected to close in Jan. 2014

$15.00 $17.00 $19.00 $21.00 $23.00 $25.00 $27.00 $29.00 Jan-13 Feb-13 Mar-13 Apr-13 May-13 Jun-13 Jul-13 Aug-13 Sep-13 Oct-13 Nov-13 Dec-13 2013 Transformative Events April 2013: ArcLight Transaction / High Point Acquisition 8 • Strategic investment in AMID’s GP by ArcLight, a $10 billion energy PE fund • Gained access to drop downs and development funding • Immediately accretive, acquisition provided increased distribution support and operating scale May 2013: HPIP Eagle Ford Development Project Announced2 • $90 - $100 million greenfield development project in Gonzales County, TX owned and funded by our GP • Long-term, fee-based agreement for full well stream gathering and treating • Operational in mid-2014 August 2013: Equity Restructuring • Subordinated units and previous IDRs combined into, and restructured as a new class of IDRs • Decreased distribution obligation by approx. $8MM annually • Incentivizes IDR holders to grow AMID December 2013: Blackwater Drop Down • First drop-down acquisition from ArcLight • Fee-based cash flow with 75% take-or-pay revenues • Opportunity to increase capacity by ~130% $15.07 $27.08 AMID 2013 Daily Closing Price 4.6% Increase in Quarterly Distribution 1. Calculated from 12/31/2012 through 12/31/2013 2. Upon completion of the initial development phase, High Point has stated it intends to offer the assets to American Midstream in a drop-down transaction, although it has no contractual obligation to do so 111.4% Total Return1
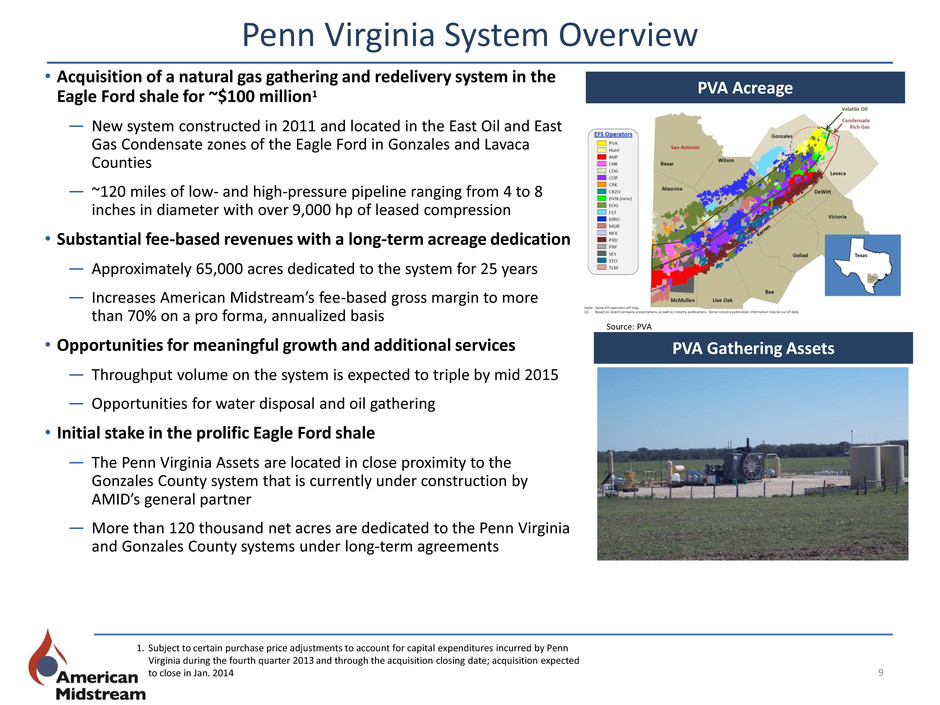
Penn Virginia System Overview • Acquisition of a natural gas gathering and redelivery system in the Eagle Ford shale for ~$100 million1 ― New system constructed in 2011 and located in the East Oil and East Gas Condensate zones of the Eagle Ford in Gonzales and Lavaca Counties ― ~120 miles of low- and high-pressure pipeline ranging from 4 to 8 inches in diameter with over 9,000 hp of leased compression • Substantial fee-based revenues with a long-term acreage dedication ― Approximately 65,000 acres dedicated to the system for 25 years ― Increases American Midstream’s fee-based gross margin to more than 70% on a pro forma, annualized basis • Opportunities for meaningful growth and additional services ― Throughput volume on the system is expected to triple by mid 2015 ― Opportunities for water disposal and oil gathering • Initial stake in the prolific Eagle Ford shale ― The Penn Virginia Assets are located in close proximity to the Gonzales County system that is currently under construction by AMID’s general partner ― More than 120 thousand net acres are dedicated to the Penn Virginia and Gonzales County systems under long-term agreements PVA Acreage PVA Gathering Assets Source: PVA 9 1. Subject to certain purchase price adjustments to account for capital expenditures incurred by Penn Virginia during the fourth quarter 2013 and through the acquisition closing date; acquisition expected to close in Jan. 2014
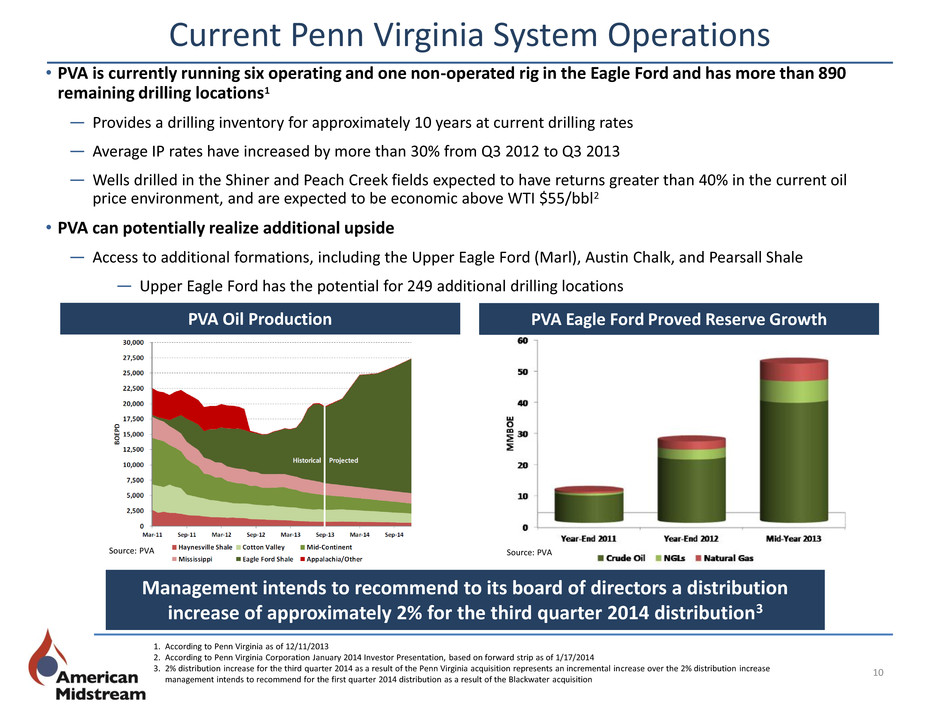
Current Penn Virginia System Operations • PVA is currently running six operating and one non-operated rig in the Eagle Ford and has more than 890 remaining drilling locations1 ― Provides a drilling inventory for approximately 10 years at current drilling rates ― Average IP rates have increased by more than 30% from Q3 2012 to Q3 2013 ― Wells drilled in the Shiner and Peach Creek fields expected to have returns greater than 40% in the current oil price environment, and are expected to be economic above WTI $55/bbl2 • PVA can potentially realize additional upside ― Access to additional formations, including the Upper Eagle Ford (Marl), Austin Chalk, and Pearsall Shale ― Upper Eagle Ford has the potential for 249 additional drilling locations 1. According to Penn Virginia as of 12/11/2013 2. According to Penn Virginia Corporation January 2014 Investor Presentation, based on forward strip as of 1/17/2014 3. 2% distribution increase for the third quarter 2014 as a result of the Penn Virginia acquisition represents an incremental increase over the 2% distribution increase management intends to recommend for the first quarter 2014 distribution as a result of the Blackwater acquisition PVA Oil Production PVA Eagle Ford Proved Reserve Growth Source: PVA Source: PVA 10 Management intends to recommend to its board of directors a distribution increase of approximately 2% for the third quarter 2014 distribution3

Blackwater Midstream Drop Down • Immediately accretive ~$60 million acquisition from ArcLight ― Adds significant fee-based cash flow with no direct commodity exposure, distribution support, optimal scale, and additional development opportunities ― Leverages ArcLight’s significant history of success in the terminal business • Diversifies AMID’s revenue base, geographic footprint and capabilities ― Four facilities: Westwego, LA - 945k bbls; Brunswick, GA - 221k bbls; Salisbury, MD - 172k bbls; Harvey, LA - 245k bbls (under development) ― ~75% of revenues derived from fee based, “take-or-pay” storage agreements ― Primary products stored include: caustic soda, GTL/NGLs, fertilizer (UAN), synthetic drilling fluids, vegetable oils, biodiesel • Enhances near- and long-term growth prospects ― Organic opportunities at Westwego (300k bbls) and Brunswick (100k bbls) ― Significant expansion capability at Harvey site (up to 2 million bbls), expected to begin initial operations in mid-to-late 2014 • Provides meaningful additions to management ― First-class management team successfully built part of Kinder Morgan’s terminal operations Blackwater Assets Management intends to recommend to its board of directors a distribution increase of approximately 2% for the first quarter 2014 distribution Westwego Terminal 11

Anticipated Eagle Ford Drop Down • On May 8, 2013, American Midstream and High Point Infrastructure Partners (High Point), which controls the general partner of American Midstream, announced a long-term, fee-based agreement to provide midstream services for a large independent producer in the Eagle Ford play in Gonzales County, TX ― Upon completion of the initial development phase, High Point has stated it intends to offer the assets to American Midstream in a drop-down transaction, although it has no contractual obligation to do so • Midstream services will consist of full well-stream gathering, treating, and processing infrastructure to handle oil, gas, and water production ― High Point recently reached agreement with the producer customer to also provide water disposal services • Progress update: site procured for central facility and much of required right-of-way as well as selection and mobilization of EPC contractor • Estimated construction CapEx between $90 million - $100 million • Operations expected to begin in mid-2014 • Would provide fee-based EBITDA, geographic diversity, life-of-lease dedication from long-term drilling activity, and exposure to a dominant shale play 12 System Facilities - Gathering lines to collect oil, natural gas, and water from the wellhead - Centralized facility to treat and process oil and natural gas - Separate storage facilities for oil, water and NGLs Design Capacity - 95,000 bbl/d of fluids (oil and water) - 15 MMcf/d of natural gas System Details Howland Engineering; San Antonia Express-News
FINANCIAL REVIEW / UPDATE 13

Financial Review 14 Data as of 9/30/2013; see Appendix for reconciliation of Non-GAAP financial measures *Reported in November 2013, does not include pro forma results from Blackwater 1 Partnership growth capital expenditure forecast excludes maintenance capital 2 For development by AMID’s general partner of the previously announced midstream infrastructure in the Eagle Ford Shale that High Point has stated it intends to offer to AMID in a drop-down transaction, although it has no contractual obligation to do so 3 AMID has hedged approximately 11% of its NGL and condensate volume exposure for 2014 3Q Financial Results* ($ in thousands) 3Q13 3Q12 Gross Margin $18,552 $12,978 Adjusted EBITDA $7,100 $4,073 Leverage Ratio Distributable Cash Flow $3,095 $1,798 Distribution Coverage Ratio 1.31x 0.46x 2014 Guidance Adjusted EBITDA $41 - $44 million Distributable Cash Flow $21 - $24 million Growth Cap Ex1 $55 - 60 million HPIP Growth Cap Ex2 $90- $100 million Gross Margin by Contract Type Gross Margin by Segment Pro Forma Annualized High Point, Blackwater and PVA G&P 60% Trans.40% Commodity Sensitive3 44% FT 16% Fee Based 36% Fixed Margin 4% Commodity Sensitive 28%3 FT 10% Fee Based 60% Fixed Margin 2% G & P 35% Transmission 38% PVA 13% Blackwater 14%
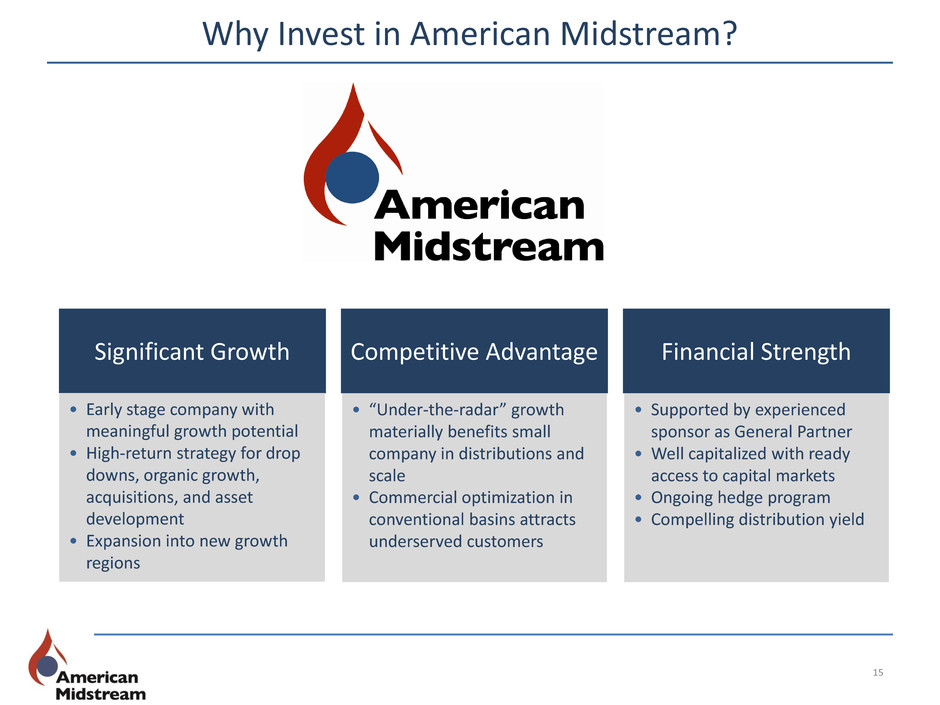
Why Invest in American Midstream? 15 Significant Growth Competitive Advantage Financial Strength • “Under-the-radar” growth materially benefits small company in distributions and scale • Commercial optimization in conventional basins attracts underserved customers • Supported by experienced sponsor as General Partner • Well capitalized with ready access to capital markets • Ongoing hedge program • Compelling distribution yield • Early stage company with meaningful growth potential • High-return strategy for drop downs, organic growth, acquisitions, and asset development • Expansion into new growth regions
Appendix – Non-GAAP Financial Measures Non-GAAP Financial Measures This presentation includes forecasted and historical non-GAAP financial measures, including “Gross Margin,” “Adjusted EBITDA” and “Distributable Cash Flow.” The GAAP measure most directly comparable to Gross Margin, Adjusted EBITDA and Distributable Cash Flow is net income (loss). Adjusted EBITDA is calculated as net income (loss) attributable to the partnership plus interest expense, depreciation expense, certain non- cash charges such as non-cash equity compensation, unrealized losses on commodity derivative contracts and selected charges that are unusual or non-recurring including debt issuance costs, transaction costs, and losses on the impairment of property, plant and equipment, less interest income, unrealized gains on commodity derivative contracts, construction, operating and maintenance agreement (COMA) income, amortization of commodity put purchase costs and selected gains that are unusual or nonrecurring such as the benefit of our other post-employment benefit plan (OPEB), gains on the sale of assets, and gains on the involuntary conversion of property, plant and equipment. Distributable cash flow is calculated as Adjusted EBITDA plus interest income, less cash paid for interest expense, normalized maintenance capital expenditures, and dividends related to the Series A convertible preferred units. Gross margin and segment gross margin are metrics that we use to evaluate our performance. We define segment gross margin in our Gathering and Processing segment as revenue generated from gathering and processing operations, realized gain (loss) on commodity derivatives less COMA less the cost of natural gas, NGLs and condensate purchased. Revenue includes revenue generated from fixed fees associated with the gathering and treating of natural gas and from the sale of natural gas, NGLs and condensate resulting from gathering and processing activities under fixed-margin and percent-of-proceeds arrangements. The cost of natural gas, NGLs and condensate includes volumes of natural gas, NGLs and condensate remitted back to producers pursuant to percent-of-proceeds arrangements and the cost of natural gas purchased for our own account, including pursuant to fixed-margin arrangements. We define segment gross margin in our Transmission segment as revenue generated from firm and interruptible transportation agreements and fixed-margin arrangements, plus other related fees, less COMA, less the cost of natural gas purchased in connection with fixed-margin arrangements. We define gross margin as the sum of our segment gross margin for our Gathering and Processing and Transmission segments. The GAAP measure most comparable to gross margin is net income. 16

Appendix – Reconciliation of Non-GAAP Financial Measures 17 Three months ended September 30, 2013 2012 Net (loss) income attributable to the Partnership $ (2,556 ) $ (4,275 ) Add: Depreciation and accretion expense 6,458 5,504 Interest expense 1,615 1,501 Debt issuance costs 194 — Unrealized (gain) loss on derivatives, net 913 1,762 Non-cash equity compensation expense 392 474 Transaction expenses 426 — Loss on impairment of property, plant and equipment — — Loss on impairment of noncurrent assets held for sale — — Deduct: COMA income 292 820 Straight-line amortization of put costs (1) 32 46 OPEB plan net periodic benefit 18 23 Gain on involuntary conversion of property, plant and equipment — — Gain on sale of assets, net — 4 Adjusted EBITDA $ 7,100 $ 4,073 Deduct: Cash interest expense (2) $ 1,588 $ 1,292 Normalized maintenance capital (3) 1,116 1,041 Normalized integrity management (4) — (58 ) Series A Convertible Preferred payment 1,301 — Distributable Cash Flow $ 3,095 $ 1,798 1: Amounts noted represent the straight-line amortization of the cost of commodity put contracts over the life of the contract. 2: Excludes amortization of debt issuance costs and mark-to-market adjustments related to interest rate derivatives. 3: Amounts noted represent estimated annual maintenance capital expenditures of $4.5 million which is what we expect to be required to maintain our assets over the long term. 4: Amounts noted represent average estimated integrity management costs over the seven-year mandatory testing cycle, net of integrity management costs that are expensed in direct operating expenses. Following a recent re-evaluation of the integrity management program, management determined that integrity management expenses will continue to be expensed as incurred in direct operating expenses consistent with past practice. However, beginning with the third quarter of 2013, integrity management expenses will no longer be normalized in the calculation of distributable cash flow.
