Attached files
 Net
Asset Valuation Presentation January 2015
Exhibit 99.3 |
 General Notices
This is not an offer to sell nor a solicitation of an offer to buy shares of the REIT. The information
herein does not supplement or revise any information in the REIT's public filings made with the
U.S. Securities and Exchange Commission. To the extent information herein conflicts with the
REIT’s public filings, as supplemented, the information in the filings govern. This piece is for general information purposes only and does not constitute legal, tax, investment, or
other professional advice on any subject matter. Information provided is not all-inclusive
and should not be relied upon as being all-inclusive. This presentation includes forward-looking statements. Forward-looking statements are based on
current expectations and may be identified by words such as “believes,”
“expects,”, “anticipates”, “may,” “could” and terms of
similar substance, and speak only as of the date made. Actual results could differ materially
from those expressed or implied in the REIT’s forward-looking statements. Important factors,
among others, that could cause the REIT's actual results to differ materially from those in its
forward-looking statements include those identified in the Risk Factors described below.
Investors should not place undue reliance on forward-looking statements. The REIT is under
no obligation to, and expressly disclaims any obligation to update or alter its
forward-looking statements, whether as a result of new information, subsequent events or
otherwise, except as required by law.
An investment in the REIT is subject to significant risks, some of which are summarized below in the
“Risk Factors” section of this piece. See also, “Risk Factors” in the
REIT’s public filings for a more detailed description of the risks associated with an
investment in the REIT.
|
 Risk
Factors Investing in a non-traded REIT is a higher-risk, longer term investment and is not suitable for
all investors. Due to the risks involved in the ownership of real estate, there is no guarantee
of any return on investment. The shares may lose value or investors could lose their entire
investment. The shares are not FDIC- insured, nor bank guaranteed. Non-traded REITs are illiquid. There is no public trading market for the shares. The REIT has no
obligation to list on any public securities market and does not expect to list the shares.
Stockholders will bear the economic risks of an investment in the shares for a substantial and
indefinite period. If investors are able to sell their shares, it would likely be at a
substantial loss of the amount invested.
The REIT relies on its advisor and the advisor’s affiliates to select the REIT’s properties
and to conduct the REIT’s operations. The REIT is obligated to pay substantial fees to its
advisor, managing dealer, property manager and their respective affiliates based upon
agreements which have not been negotiated at arm’s length, some of which are payable based
upon factors other than the quality of services. These fees could influence their advice and
judgment in performing services. Currently, the REIT is incurring fees and expenses, some of
which will need to be reimbursed to its advisor and affiliates. Certain officers and
directors of the advisor also serve as the REIT’s officers and directors, as well as officers and
directors of competing programs, and/or joint venture partners, resulting in conflicts of
interest. Those persons could take actions more favorable to other entities. The REIT has not identified all of the investments that it will make in the future, and investors will
not have the opportunity to evaluate future investments before they are made. Investors must
rely on the REIT’s advisor and board of directors to evaluate, structure and implement
future investments. |
 Risk
Factors During the REIT's public offerings, the REIT made distributions to its stockholders in the form of
shares of its stock. Stock distributions served to provide early stockholders with additional
shares as compared to later stockholders for the same initial cash investment. As a result,
early stockholders are allocated greater percentages of any accretion in the value of the
REIT's early property developments and in any sales proceeds or liquidating distributions upon
the sale of such properties or occurrence of an exit event. The REIT believes its former stock
distribution policy aligned the age of the REIT's stockholder base with the long term
appreciation in the value of the REIT's assets. The REIT's board of directors will continue to
periodically review the REIT's distribution policy. If the REIT makes cash distributions from sources
other than from its cash flows or funds from operations, such as from borrowings, such
distributions could lower stockholders’ overall return on investment. The REIT has not
established a limit on the extent to which it may use borrowings or issue shares of common
stock to pay distributions. There is no assurance that the REIT will make any further
distributions. The amount or basis of distributions, if any, will be determined solely by
and at the discretion of the REIT’s board of directors. The distribution of new common stock is not
currently included as a component of the stockholder’s gross income under the IRS Code and is
therefore tax deferred and not taxable when received. Stockholders should consult with their
financial advisor, accountant and/or attorney for tax advice specific to their particular needs
and objectives.
If the REIT fails to maintain its qualification as a REIT for any taxable year, it will be subject to
federal income tax on taxable income at regular corporate rates. In such an event, net earnings
available for investment or distributions would be reduced.
|
 Risk
Factors The REIT has incurred debt to make its investments. The use of leverage to acquire assets may hinder
the REIT’s ability to pay distributions and/or decrease the value of stockholders’
investment in the event income from, or the value of the property securing the debt
declines. The REIT made only a limited number of investments resulting in a less diversified portfolio in terms
of the number of investments owned and their geographic locations. All of the REIT’s
current investments are in multifamily development properties in the Southeast and Sun Belt
regions of the United States. An investment in the REIT’s shares is subject to greater
risk to the extent that the REIT has limited geographic and sector diversification in its
portfolio of investments.
If sales of our properties or other assets not owned by a TRS are deemed prohibited transactions, we
may be subject to a 100% penalty federal tax on the gains resulting from those sales. A
“prohibited transaction” is a sale by a REIT of real property or other assets held
primarily for sale in the ordinary course of the REIT’s trade or business (i.e., real
property or other assets that are not held for investment but are held as inventory for sale by
the REIT). Under existing law, whether property is held as inventory or primarily for sale to customers
in the ordinary course of a trade or business is a question of fact that depends on all the facts and
circumstances surrounding the particular transaction. |
 Valuation Disclosures
Our estimated net asset value per share is based upon subjective judgments, assumptions and opinions
which may or may not turn out to be correct. You should not rely upon our estimated net asset
value as representative of the amount that might be paid to you for your shares in a market
transaction, or in a liquidity event.
In determining our estimated net asset value per share, we relied upon a valuation of our portfolio
of properties as of Dec. 31, 2014. Valuations and appraisals of our properties are
estimates of fair value and may not necessarily correspond to realizable value upon the sale
of such properties. Therefore, the estimated present value to the Company of our equity in our
portfolio may not reflect the amount that would be realized upon a sale of each of our
properties.
We intend to conduct annual year end valuations in accordance with our valuation policy, if we do not
perform a subsequent calculation of the net asset value per share of our shares, you may not
be able to determine the net asset value of your shares on an ongoing basis.
This valuation represents the estimated net asset value per share as a snapshot in time, will
fluctuate over time, and should not be relied upon as representative of the amount a
stockholder could expect to receive now or in a future liquidation event. CBRE Cap, the
independent valuation firm, made numerous assumptions with respect to industry, business,
economic and regulatory conditions, all of which are subject to changes beyond the control of
CBRE Cap or the Company. CBRE Cap is not responsible for our estimated net asset value per
share as of Dec. 31, 2014. Throughout the valuation process, the valuation committee, our
advisor and senior members of management reviewed, confirmed and approved the processes
and methodologies and their consistency with real estate industry standards and best
practices.
|
 7
CNL Growth Properties is a non-traded real estate investment trust
(REIT)
The REIT seeks commercial real estate investment opportunities in
growth-oriented markets, with a focus on Multifamily Development.
CNL Growth Properties |
 8
Highlights
Commenced initial offering in October 2009
Launched follow-on offering in August 2013
Closed second offering in April 2014
Raised approximately $559 million in equity since initial offering
Invested in 16 assets as of the valuation date
16 multifamily development projects
8 operating, 7 in development, 1 operating & held for sale
Asset Held-for-Sale
Woodfield Long Point, Charleston County, SC
Distribution Policy, Distribution Reinvestment Plan, Redemption Plan
Stock distributions terminated October 1, 2014
Distribution Reinvestment Plan (DRP) terminated October 1, 2014
Redemption Plan suspended October 1, 2014
Completed independent valuation of portfolio as of December 31, 2014
|
 9
Sale of Woodfield Long Point
Entered Purchase & Sale Agreement November 25, 2014
258-Unit Class A Garden Style Community in Mount Pleasant
(Charleston County), South Carolina
Sale Price: $55.5 million
Closed: January 15, 2015 |
 10
Estimated Net Asset Value (“NAV”)
Consistent with methodologies prescribed by IPA
Valuation Guidelines
1
Individual MAI property appraisals (no enterprise/portfolio
premiums)
Use of independent investment banking firm
Engaged CBRE Capital Advisors, Inc. (“CBRE Cap”) an independent
investment banking firm as valuation expert
Disclosure of key assumptions & methodology
Utilized discounted cash flow method
Range provided by adjusting key assumptions
Discount rates, terminal capitalization (“terminal cap”) rates
1
There is no assurance that IPA Guidelines are acceptable to FINRA or under ERISA
for compliance with reporting requirements. |
 11
Methodology
Valuation based on cash flow projections and a four year
discounted cash flow analysis (expected hold period) for each
property from actual cash flows based on realized rent, and
the Company’s development budgets and cash flow
projections
The Company’s real estate properties were categorized into three
classifications
Operating Assets (8 properties)
Development Projects (7 properties)
Operating Asset Held For Sale (1 property)
Terminal capitalization rate was used to calculate terminal
value (stabilized NOI/terminal capitalization rate) of the assets
at stabilization
Terminal capitalization rate sourced from MAI appraisals and vary by
location, asset quality and supply/demand metrics |
 12
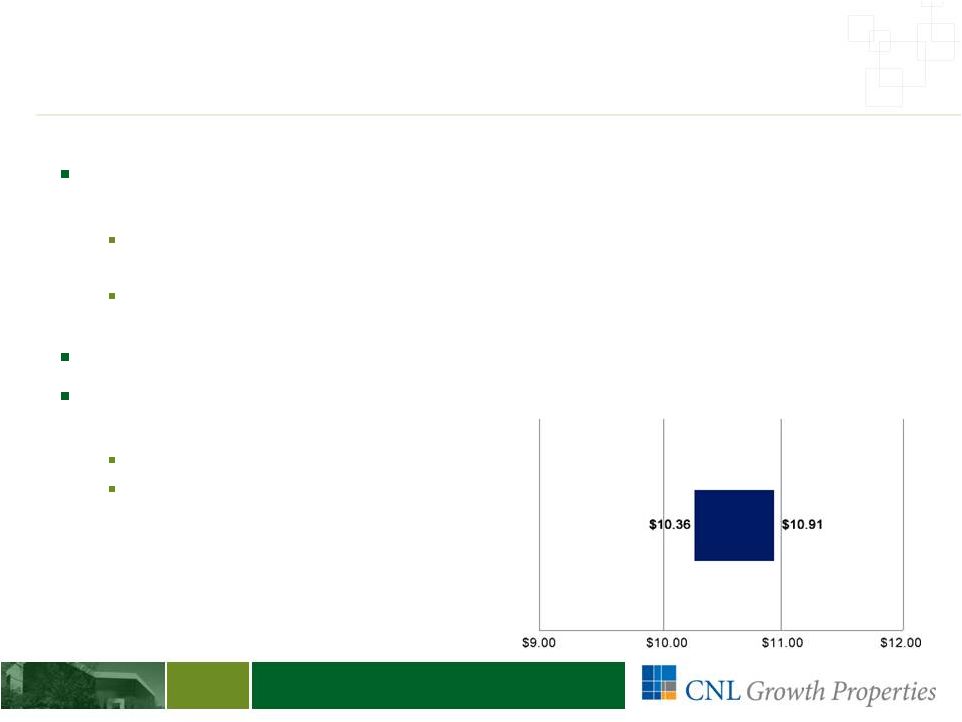
CBRE Cap created a valuation range by varying the discount rate
utilized and the terminal cap rate of each real estate asset
The
range
was
set
at
50bps
on
the
discount
rate
and
30bps
on
the
terminal
capitalization rate of each asset
Represents an approximate 5% sensitivity on the discount rate and terminal
capitalization rate ranges consistent with IPA guidelines
CBRE Cap utilized a December 31, 2014, share count of 22,526,171
CBRE Cap Valuation (discount and terminal capitalization rates
based on CBRE appraisals)
Weighted avg. discount rate: 10.5%
Weighted avg. terminal rate:
6.03%
Valuation Summary |
 13
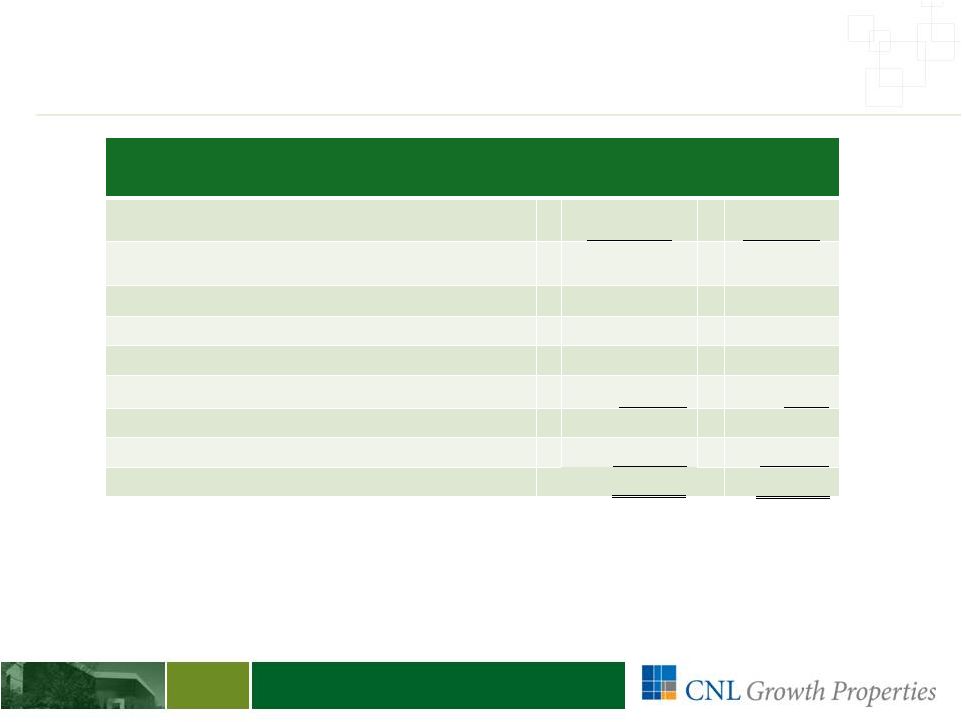
Estimated NAV Per Share Build-Up
Table of Value Estimates for Components of Net Asset Value
(as of Dec. 31, 2014)
Value
($
in
000’s)
Per
Share
$199,439
$8.85
Cash
and
cash
equivalents
2
46,854
2.08
Other
assets
2
638
0.03
Accounts
payable
and
other
accrued
expenses
2
(4,607)
(0.20)
Other
liabilities
2
(1,492)
(0.07)
Estimated
NAV
before
incentive
fee
$240,832
$10.69
Less:
Incentive
Fee
to
Advisor
(1,393)
(0.06)
Estimated
NAV
3
1
The company’s share of equity including promote structure in each
venture. 2
Based on the Company’s preliminary balance sheet as of Dec. 31, 2014.
3
The
estimated
NAV
per
share
is
a
snapshot
in
time
and
should
not
be
relied
upon
as
indicative
of
the
value
the
company
or
stockholders
may receive now or in a future liquidation event.
$239,439
$10.63
Present value of equity in operating assets,
development
projects
and
asset
held
for
sale
1 |
 14
Looking Ahead
1
Evaluate monetization opportunities as
properties become stabilized
Execute on existing pipeline of multifamily
development opportunities
1
There is no assurance these objectives will be met. Forward-looking statements
are based on current expectations and may be identified by words such as
“believes,” “expects,”
“may,”
“could”
and terms of similar substance, and speak only as of the date made. Actual results
could differ materially due to risks and uncertainties that are beyond the
REIT’s ability to control or accurately predict. Investors should not
place undue reliance on forward-looking statements.
|
 15
For More Information
Investors
To obtain additional information about CNL Growth Properties,
please consult your Financial Advisor or visit
CNLGrowthProperties.com.
Financial Professionals
For more information about CNL Growth Properties, please
contact our managing dealer, CNL Securities, Member
FINRA/SIPC at 866-650-0650 or CNLSecurities.com.
This is not an offer. Dissemination to investors is prohibited. Investments in non-traded
real estate investment trusts (REITs) are subject to significant risks. These risks include
limited operating histories, reliance on the advisors, conflicts of interests, use of leverage, payment of
substantial fees to the advisors and their affiliates, illiquidity and liquidations at less than the
original amounts invested. © 2015 CNL Global Growth Advisor, LLC. All Rights Reserved. CNL® and the Squares Within
Squares design trademarks are used under license from CNL Intellectual Properties, Inc.
|
 16
Questions & Answers |