Attached files
| file | filename |
|---|---|
| EXCEL - IDEA: XBRL DOCUMENT - AEP INDUSTRIES INC | Financial_Report.xls |
| EX-32.2 - EX-32.2 - AEP INDUSTRIES INC | d793230dex322.htm |
| EX-31.2 - EX-31.2 - AEP INDUSTRIES INC | d793230dex312.htm |
| EX-32.1 - EX-32.1 - AEP INDUSTRIES INC | d793230dex321.htm |
| EX-31.1 - EX-31.1 - AEP INDUSTRIES INC | d793230dex311.htm |
| EX-21 - EX-21 - AEP INDUSTRIES INC | d793230dex21.htm |
| EX-10.10 - EX-10.10 - AEP INDUSTRIES INC | d793230dex1010.htm |
| EX-23 - EX-23 - AEP INDUSTRIES INC | d793230dex23.htm |
Table of Contents
UNITED STATES
SECURITIES AND EXCHANGE COMMISSION
WASHINGTON, D.C. 20549
FORM 10-K
| x | ANNUAL REPORT PURSUANT TO SECTION 13 OR 15(d) OF THE SECURITIES EXCHANGE ACT OF 1934 |
For the fiscal year ended October 31, 2014
OR
| ¨ | TRANSITION REPORT PURSUANT TO SECTION 13 OR 15(d) OF THE SECURITIES EXCHANGE ACT OF 1934 |
For the transition period from to
Commission file number 001-35117
AEP INDUSTRIES INC.
(Exact name of registrant as specified in its charter)
| Delaware (State or other jurisdiction of incorporation or organization) |
22-1916107 (I.R.S. Employer Identification No.) | |
| 95 Chestnut Ridge Road, Montvale, New Jersey (Address of principal executive offices) |
07645 (Zip code) | |
Registrant’s telephone number, including area code: (201) 641-6600
Securities registered pursuant to Section 12(b) of the Act:
| Title of each class |
Name of each exchange on which registered | |
| Common Stock, $0.01 par value | Nasdaq Global Select Market |
Securities registered pursuant to Section 12(g) of the Act:
None
Indicate by check mark if the registrant is a well-known seasoned issuer, as defined in Rule 405 of the Securities Act. ¨ Yes x No
Indicate by check mark if the registrant is not required to file reports pursuant to Section 13 or Section 15(d) of the Act. ¨ Yes x No
Indicate by check mark whether the registrant (1) has filed all reports required to be filed by Section 13 or 15(d) of the Securities Exchange Act of 1934 during the preceding 12 months, and (2) has been subject to such filing requirements for the past 90 days. x Yes ¨ No
Indicate by check mark whether the registrant has submitted electronically and posted on its corporate Web site, if any, every Interactive Data File required to be submitted and posted pursuant to Rule 405 of Regulation S-T during the preceding 12 months (or for such shorter period that the registrant was required to submit and post such files). x Yes ¨ No
Indicate by check mark if disclosure of delinquent filers pursuant to Item 405 of Regulation S-K is not contained herein, and will not be contained, to the best of registrant’s knowledge, in definitive proxy or information statements incorporated by reference in Part III of this Form 10-K or any amendment to this Form 10-K. ¨
Indicate by check mark whether the registrant is a large accelerated filer, an accelerated filer, a non-accelerated filer, or a smaller reporting company. See the definitions of “large accelerated filer”, “accelerated filer” and “smaller reporting company” in Rule 12b-2 of the Exchange Act.
| Large accelerated filer ¨ | Accelerated filer x | Non-accelerated filer¨ (Do not check if a smaller reporting company) |
Smaller reporting company ¨ |
Indicate by check mark whether the registrant is a shell company (as defined in Rule 12b-2 of the Exchange Act). ¨ Yes x No
The aggregate market value of the common stock held by non-affiliates of the registrant as of April 30, 2014 was $141,142,611, based upon the closing price of $35.62 as reported by the Nasdaq Global Select Market on such date. Shares of common stock held by officers and directors have been excluded from this calculation because such persons may be deemed to be affiliates; such exclusion shall not be deemed to constitute an admission that any such person is an affiliate of the registrant.
The number of shares of the registrant’s common stock outstanding as of January 8, 2015 was 5,080,596.
DOCUMENTS INCORPORATED BY REFERENCE
Portions of the proxy statement for the 2015 annual meeting of stockholders are incorporated by reference into Part III of this report to the extent described herein.
Table of Contents
AEP INDUSTRIES INC.
| Page Number |
||||||
| 2 | ||||||
| PART I | ||||||
| ITEM 1. |
3 | |||||
| ITEM 1A. |
11 | |||||
| ITEM 1B. |
23 | |||||
| ITEM 2. |
23 | |||||
| ITEM 3. |
24 | |||||
| ITEM 4. |
24 | |||||
| PART II | ||||||
| ITEM 5. |
Market for Registrant’s Common Equity, Related Stockholder Matters and Issuer Purchases of Equity Securities | 25 | ||||
| ITEM 6. |
27 | |||||
| ITEM 7. |
Management’s Discussion and Analysis of Financial Condition and Results of Operations | 29 | ||||
| ITEM 7A. |
42 | |||||
| ITEM 8. |
44 | |||||
| ITEM 9. |
Changes in and Disagreements with Accountants on Accounting and Financial Disclosure | 45 | ||||
| ITEM 9A. |
45 | |||||
| ITEM 9B. |
46 | |||||
| PART III | ||||||
| ITEM 10. |
47 | |||||
| ITEM 11. |
47 | |||||
| ITEM 12. |
Security Ownership of Certain Beneficial Owners and Management and Related Stockholder Matters | 47 | ||||
| ITEM 13. |
Certain Relationships and Related Transactions, and Director Independence |
47 | ||||
| ITEM 14. |
47 | |||||
| PART IV | ||||||
| ITEM 15. |
48 | |||||
| 95 | ||||||
1
Table of Contents
Cautionary Note Regarding Forward-Looking Statements
Management’s Discussion and Analysis of Financial Condition and Results of Operations and other sections of this report contain “forward-looking statements” within the meaning of Section 27A of the Securities Act of 1933, as amended, and Section 21E of the Securities Exchange Act of 1934, as amended. These forward-looking statements represent our goals, beliefs, plans and expectations about our prospects for the future and other future events, such as our ability to generate sufficient working capital, the amount of availability under our credit facility, the anticipated pricing in resin markets, our ability to continue to maintain or increase sales and profits of our operations (including our attempt to drive future costs out of our business), and the sufficiency of our cash balances and cash generated from operating, investing, and financing activities for our future liquidity and capital resource needs. Forward-looking statements include all statements that are not historical fact and can be identified by terms such as “may,” “intend,” “might,” “will,” “should,” “could,” “would,” “anticipate,” “expect,” “believe,” “estimate,” “plan,” “project,” “predict,” “potential,” or the negative of these terms. Although these forward-looking statements reflect our good-faith belief and reasonable judgment based on current information, these statements are qualified by important factors, many of which are beyond our control, that could cause our actual results to differ materially from those in the forward-looking statements, including, but not limited to: the timing and completion, in part or full, of the significant capacity increase by North American resin producers in future years and its impact on future resin pricing; the ability to pass raw material price increases to customers in full or in a timely fashion; the ability to implement non-resin price increases with customers; the availability of raw materials; competition in existing and future markets; disruptions in the global economic and financial market environment; limited contractual relationships with customers; and other factors described from time to time in our reports filed or furnished with the U.S. Securities and Exchange Commission (the “SEC”), and in particular those factors set forth in Item 1A “Risk Factors” in this Annual Report on Form 10-K. Given these uncertainties, you should not place undue reliance on any such forward-looking statements. The forward-looking statements included in this report are made as of the date hereof or the date specified herein, based on information available to us as of such date. Except as required by law, we assume no obligation to update these forward-looking statements, even if new information becomes available in the future.
2
Table of Contents
| ITEM 1. | BUSINESS |
Overview
AEP Industries Inc., founded in 1970 and incorporated in Delaware in 1985, is a leading manufacturer of flexible plastic packaging films in North America. We manufacture and market an extensive and diverse line of polyethylene and polyvinyl chloride flexible plastic packaging products, with consumer, industrial and agricultural applications. Our flexible plastic packaging films are used in the packaging, transportation, beverage, food, automotive, pharmaceutical, chemical, electronics, construction, agriculture and textile industries.
We manufacture plastic films, principally from resins blended with other raw materials, which we either sell or further process by printing, laminating, slitting or converting. Our processing technologies enable us to create a variety of value-added products according to the specifications of our customers. Our manufacturing operations are located in the United States and Canada.
We manufacture both industrial grade products, which are manufactured to general industry specifications, and specialty products, which are manufactured under more exacting standards to assure certain required chemical and physical properties. Specialty products generally sell at higher margins than industrial grade products.
Information about our operations by geographical area, with United States and Canada stated separately, as of and for the years ended October 31, 2014, 2013 and 2012, respectively, is as follows:
| United States |
Canada | Total | ||||||||||
| (in thousands) | ||||||||||||
| 2014 |
||||||||||||
| Sales—external customers |
$ | 1,117,404 | $ | 75,586 | $ | 1,192,990 | ||||||
| Operating income |
5,448 | 4,413 | 9,861 | |||||||||
| Geographical area assets |
425,533 | 21,413 | 446,946 | |||||||||
| United States |
Canada | Total | ||||||||||
| (in thousands) | ||||||||||||
| 2013 |
||||||||||||
| Sales—external customers |
$ | 1,071,410 | $ | 72,442 | $ | 1,143,852 | ||||||
| Operating income |
26,096 | 7,220 | 33,316 | |||||||||
| Geographical area assets |
440,089 | 31,474 | 471,563 | |||||||||
| United States |
Canada | Total | ||||||||||
| (in thousands) | ||||||||||||
| 2012 |
||||||||||||
| Sales—external customers |
$ | 1,075,672 | $ | 76,863 | $ | 1,152,535 | ||||||
| Operating income |
49,585 | 6,063 | 55,648 | |||||||||
| Geographical area assets |
411,102 | 20,341 | 431,443 | |||||||||
Fiscal 2014 Developments
Our sales volume has decreased 1% and 1.5% in fiscal 2014 and 2013, respectively, primarily as a result of the challenging economic conditions in recent years and the unprecedented six price increases totaling $0.23 per pound in polyethylene resin since November 1, 2012. However, we believe in the long-term prospects for our business and trust that the investments in capital expenditures during the past three years and our cost cutting initiatives have well-positioned us to accommodate expected growing demand and navigate through a volatile market.
3
Table of Contents
For a further discussion of key operational and financial developments occurring in fiscal 2014, see Item 7, “Management’s Discussion and Analysis of Financial Condition and Results of Operations – Executive Summary”.
Products
As stated above, we manufacture and market an extensive and diverse line of polyethylene and polyvinyl chloride flexible plastic packaging products, with consumer, industrial and agricultural applications. Flexible packaging and film products are thin, ductile bags, sacks, labels and films used for food and non-food consumer, agricultural and industrial items.
The following table summarizes our product lines:
| Product |
Material |
Examples of Uses | ||
| custom films |
polyethylene co-extruded and monolayer custom designed films | • drum, box, carton, and pail liners • furniture and mattress bags • films to cover high value products • magazine overwrap | ||
| stretch (pallet) wrap |
polyethylene | • pallet wrap | ||
| food contact |
polyethylene polyvinyl chloride |
• reclosable food storage plastic bags with press-to-seal zipper closures • twist-tie closure and fold-top plastic bags • food and freezer wrap • retail and institutional films and products | ||
| PROformance Films® |
co-extruded and monolayer polyethylene films | • direct food contact packaging • lamination layers • protective masking • medical and pharmaceutical | ||
| canliners |
polyethylene | • kitchen and standard garbage bags • lawn and leaf trash bags • institutional trash bags | ||
| printed and converted films |
polyethylene | • printed shrink films • printed, laminated, converted films for flexible packaging to consumer markets | ||
| other products and specialty films |
unplasticized polyvinyl chloride and polyethylene |
• battery labels • credit card laminate • table covers, aprons, bibs and gloves • agricultural films | ||
4
Table of Contents
Net sales by product line for each of the years ended October 31, 2014, 2013 and 2012 are as follows:
| 2014 | 2013 | 2012 | ||||||||||
| (in thousands) | ||||||||||||
| Custom films |
$ | 379,682 | $ | 341,608 | $ | 347,258 | ||||||
| Stretch (pallet) wrap |
361,067 | 352,125 | 337,078 | |||||||||
| Food contact |
183,366 | 185,950 | 197,205 | |||||||||
| PROformance Films® |
69,220 | 71,652 | 76,227 | |||||||||
| Canliners |
126,737 | 125,615 | 123,718 | |||||||||
| Printed and converted films |
25,648 | 25,361 | 23,105 | |||||||||
| Other products and specialty films |
47,270 | 41,541 | 47,944 | |||||||||
|
|
|
|
|
|
|
|||||||
| Total |
$ | 1,192,990 | $ | 1,143,852 | $ | 1,152,535 | ||||||
|
|
|
|
|
|
|
|||||||
No single customer accounted for more than 10% of net sales in any of the last three fiscal years. No single customer accounted for more than 10% of our accounts receivable balance at October 31, 2014 or 2013. See Note 13 in our consolidated financial statements for information regarding the Company’s operations by geographical area (United States and Canada).
Custom Films
We believe that the strength of our custom film operations lies in our variety of product applications, high quality control standards, well-trained and knowledgeable sales force and commitment to customer service. Most of the custom films manufactured by us, which may be as many as 35,000 separate and distinct products in any given year, are custom designed to meet the specific needs of our customers.
We manufacture a broad range of custom films, generally for industrial applications, including sheeting, tubing and bags. Bags are drum, box, carton and pail liners that are usually cut, rolled or perforated. These bags can also be used to package specialty items such as furniture and mattresses. We also manufacture films to protect high value items stored outdoors or in transit, such as boats and cars, and a wide array of shrink films, barrier films and overwrap films.
Stretch (Pallet) Wrap
We manufacture an extensive line of stretch film products for both hand wrap and rotary applications, using both monolayer and co-extruded constructions used to wrap pallets of industrial and commercial goods for shipping or storage. We also market a wide variety of pre stretch and high performance products designed for specialty uses.
Food Contact
We manufacture specifically formulated in-store and pre-store films with our Resinite® line of polyvinyl chloride (“PVC”) food wrap for the supermarket and industrial markets. We offer a broad range of products with approximately 50 different formulations. Our Griffin, Georgia facility also produces dispenser (Zip Safe® cutter) boxes containing polyvinyl chloride food wrap for sale to consumers and institutions, including restaurants, schools, hospitals and penitentiaries. These institutional polyvinyl chloride food wrap products are marketed under several private labels and under our own SealWrap® name. The oxygen transmission properties of our PVC films make them ideal for packaging fresh red meats, poultry, fish, fruits, vegetables and bakery products.
Our facility located in Montgomery, Alabama produces high quality plastic cast film bags with a non-color reclosable zipper seal (“Seal’N’Loc”) and other food contact products including blown
5
Table of Contents
plastic film fold-top bags and twist-tie bags. The Seal’N’Loc product line consists of sandwich bags, snack bags, quart size and gallon size bags.
PROformance Films®
We offer a comprehensive range of coextruded polyethylene film products used as a critical component in flexible packaging laminations, direct food contact, protective masking, medical, pharmaceutical and industrial applications. We manufacture these products using both the blown and cast processes and offer mono to seven layer films. They are custom designed for strength, clarity, oxygen and moisture barriers, as well as other specifications required for demanding packaging applications.
Canliners
The canliners product line includes retail kitchen and standard trash bags, retail lawn and leaf trash bags and institutional trash bags all of which are available with twist-tie closures, flap ties, handles and draw tape closures. In addition to the different closures, the canliners come in different sizes, gauges (thickness), colors, scents and strengths.
Printed and Converted Films
We manufacture up to ten color printing, solventless lamination, sheeting, and wicketed bags. Our printed and converted films provide printed rollstock to the food and beverage industries and other manufacturing and distributing companies. We also convert printed rollstock to bags for use by bakeries, fresh or frozen food processors, manufacturers or other dry goods processors.
Other Products and Specialty Films
We also manufacture other products in order to meet the full spectrum of our customers’ total packaging requirements. We manufacture unplasticized polyvinyl chloride (“UPVC”) film for use in battery labels, credit card laminates, and a variety of film products with agricultural applications such as silage (Sunfilm® sheet materials), smooth mulch films, and fumigation films. We also produce disposable consumer and institutional plastic products for the food service, party supply and school/collegiate markets, marketed under the Sta-Dri® brand name. Products produced include table covers and skirts, aisle runners, aprons, bibs, gloves, boots, freezer/storage bags, saddle pack bags, locker wrap and custom imprint designs.
Manufacturing
We currently conduct our manufacturing operations at 14 strategically located and integrated facilities in the United States and Canada. Twelve manufacturing facilities are ISO-certified (International Organization for Standardization), with the exception of our Mankato institutional products facility and the West Hill, Ontario, Canada facility. We manufacture both industrial grade products, which are manufactured to industry specifications or for distribution from inventory, and specialty products, which are manufactured under more exacting standards to assure that their chemical and physical properties meet the particular requirements of the customer or the specialized application appropriate to its intended market. Specialty products generally sell at higher margins than industrial grade products. The size and location of our manufacturing facilities, as well as their ability to manufacture multiple types of flexible packaging products and to flexibly adjust product mix as market conditions warrant enable us to minimize overhead and transportation costs to better serve our customers and remain competitive. See Item 2, “Properties” for a discussion of product lines manufactured at each facility as of October 31, 2014.
6
Table of Contents
In the film manufacturing process, resins with various properties are blended with chemicals and other additives to achieve a wide range of specified product characteristics, such as color, clarity, tensile strength, toughness, thickness, shrinkability, surface friction, transparency, sealability and permeability. The gauges of our products range from less than one mil (.001 inches) to more than 10 mils (.01 inches). Our extrusion equipment can produce printed products and film up to 40 feet wide. The blending of various kinds of resin combined with chemical and color additives is computer controlled to avoid waste and to maximize product consistency. The blended mixture is melted by a combination of applied heat and friction under pressure and is then mechanically mixed. The mixture is then forced through a die, at which point it is expanded into a flat sheet or a vertical tubular column of film and cooled. Several mixtures can be forced through separate layers of a co-extrusion die to produce a multi-layered film (co-extrusion), each layer having specific and distinct characteristics. The cooled film can then be shipped to a customer or can be further processed and then shipped. Generally, our manufacturing plants operate 24 hours a day, seven days a week.
We regularly upgrade or replace older equipment in order to keep abreast of technological advances and to maximize production efficiencies by reducing labor costs, waste and production time. During fiscal 2014, we invested $26.5 million primarily in new machinery and equipment in order to boost output and productivity in those product lines we believed provide us significant growth opportunities, satisfy increasing demand in certain product lines and improve service to our customers.
Raw Materials
We manufacture film products primarily from polyethylene and polyvinyl chloride resins, all of which are available from a number of domestic and foreign suppliers. We select our suppliers based on the price, quality and characteristics of the resins they produce. We currently purchase resins from major North American resin suppliers and believe any combination of purchases from such suppliers, as well as other suppliers we do not currently do business with, could satisfy our ongoing resin requirements. Our top three suppliers of resin during fiscal 2014 supplied us with 28%, 22% and 17%, respectively, of our aggregate resin purchases, which is consistent with our historical resin purchases from our top three suppliers in aggregate. Given the significant effect of resin costs on our operations and financial results, we have elected to focus our purchases with three suppliers in order to take advantage of the volume rebates which are customary among resin suppliers and critical to our success. Although the plastics industry has from time to time experienced shortages of resin supply and we have limited contractual protections in the event of such shortage, we believe we are well positioned to deal with such risks given our significant relationships and history with existing suppliers, as well as suppliers with whom we currently do not do business.
The resins used by us are produced from petroleum and natural gas. Instability in the world markets for petroleum and natural gas could adversely affect the prices of our raw materials, and this could have an adverse effect on our profitability if the increased costs cannot be passed on to customers in full or on a timely basis. See Item 1A, “Risk Factors.”
Quality Control
We believe that maintaining the highest standards of quality in all aspects of our manufacturing operations plays an important part in our ability to maintain our competitive position. We have adopted strict quality control systems and procedures designed to test the mechanical properties of our products, such as strength, puncture resistance, elasticity, abrasion characteristics and sealability, which we regularly review and modify as appropriate. As part of our commitment in providing the highest level of quality to our customers, we maintain an ISO 9001:2008 quality system in 12 of our 14 of manufacturing operations. ISO 9001:2008 is a quality management standard that helps organizations achieve standards of quality that are recognized and respected throughout the world.
7
Table of Contents
Marketing and Sales
We believe that our ability to provide superior service to our customers is critical to our success. Even in those markets where our products are considered commodities and price is the single most important factor, we believe that our sales and marketing capabilities, our ability to offer a broad line of products to our customers, and our timely delivery is a competitive advantage. To that end, we have established good relations with our suppliers and have long-standing relationships with most of our customers. We serve over 3,000 customers worldwide, none of which individually accounted for more than 10% of our net sales in fiscal 2014.
We believe that our research and development efforts, much of our high-efficiency, automated and microprocessor-controlled equipment, and the technical training given to our sales personnel enhance our ability to expand our sales in all of our product lines. An important component of our marketing philosophy is the ability of our sales personnel to provide technical assistance to customers. Our sales force regularly consults with customers with respect to performance of our products and the customer’s particular needs and then communicates with appropriate research and development staff regarding these matters. In conjunction with the research and development staff, sales personnel are often able to recommend a product or suggest a resin blend to produce the product with the characteristics and properties which best suit the customer’s requirements.
We generally sell either directly to customers who are end-users of our products or to distributors, including nation-wide brokers, for resale to end-users. In fiscal 2014, 2013 and 2012, approximately 61%, 61%, and 66%, respectively, of our worldwide sales were directly to distributors with the balance representing sales to end-users.
Distribution
We believe that the timely delivery of our products to customers is a critical factor in our ability to maintain and grow our market position. In North America, the majority of our deliveries are by contracted third parties, with approximately 10% of US shipments handled by the AEP private fleet. The private fleet is used strategically to support most of the AEP logistics facilities. The Company is increasing its use of the private fleet and will continue to do so as it provides the Company a cost effective option in areas where there are carrier capacity issues. We monitor and control all shipments through “On Demand” Transportation Management System (TMS) software. The TMS system provides detailed reports, tracking of every shipment to customer delivery and carrier management. This enables us to better control the distribution process and ensure priority handling and direct transportation of products to our customers, thus improving the speed, reliability and efficiency of delivery.
Because of the geographic dispersion of our plants, we are able to deliver most of our products within a 500 mile radius of our plants. This enables us to reduce our use of warehouse space to store products and utilize the most efficient and economical shipping methods. We also ship products great distances when necessary and export from the United States and Canada.
Research and Development
We have a research and development department with a staff of 17 persons. In addition, other members of management and supervisory personnel, from time to time, devote various amounts of time to research and development activities. The principal efforts of our research and development department are directed to assisting sales personnel in designing specialty products to meet an individual customer’s needs, developing new products and reformulating existing products to improve quality and/or reduce production costs. During fiscal 2014, we increased the focus of our research and development department on our core product lines; custom films and stretch (pallet) wrap. Our research and development department has developed a number of products with unique properties, which we
8
Table of Contents
consider proprietary, certain of which are protected by patents. In fiscal 2014, 2013 and 2012, we spent $2.0 million, $2.3 million and $2.1 million, respectively, for research and development activities for continuing operations. Research and development expense is included in cost of sales in our consolidated statements of operations.
Intellectual Property
We own a number of patents, trademarks and licenses that relate to some of our products and manufacturing processes, and apply for new patents on significant product and process developments when appropriate. Although we believe that our patents and trademarks collectively provide us with a competitive advantage, we are not dependent on any single patent or trademark. Rather, we believe our success depends on our marketing, manufacturing, and purchasing skills, as well as our ongoing research and development and unpatented proprietary know-how. We believe that the expiration or unenforceability of any of our patents, trademark registrations or licenses would not be material to our financial position or results of operations.
Competition
The business of supplying flexible plastic packaging products is extremely competitive, and we face competition from a substantial number of companies which sell similar and substitute packaging products. Some of our competitors are subsidiaries or divisions of large, international, diversified companies with extensive production facilities, well-developed sales and marketing staffs and substantial financial resources.
We compete principally with (i) local manufacturers, who compete with us in specific geographic areas, generally within a 500 mile radius of their plants, (ii) companies which specialize in the extrusion of a limited group of products, which they market nationally, and (iii) a limited number of manufacturers of flexible packaging products who offer a broad range of products and maintain production and marketing facilities domestically and internationally.
Because many of our products are available from a number of local, national and international manufacturers, competition is highly price-sensitive and margins are relatively low. We believe that all of our products require efficient, low cost and high-speed production to remain cost competitive. We believe we also compete on the basis of quality, service and product differentiation.
We believe that there are few barriers to entry into many of our markets, enabling new and existing competitors to rapidly affect market conditions. As a result, we may experience increased competition resulting from the introduction of products by new manufacturers. In addition, in several of our markets, products are generally regarded as commodities. As a result, competition in such markets is based almost entirely on price and service.
Environmental Matters
We believe that there are no current environmental matters which would have a material adverse effect on our financial position, results of operations or liquidity. See discussion of environmental risk factors in Item 1A, “Risk Factors.”
Employees
At October 31, 2014, we had approximately 2,500 full and part time employees worldwide, including officers and administrative personnel. As of such date, we had three collective bargaining agreements covering 480 employees, which expire in January 2015 (representing 6% of our workforce, negotiations are currently underway), March 2017 and December 2018, respectively. While we believe that our relations with our employees are satisfactory, a dispute between our employees and us could
9
Table of Contents
have a material adverse effect on our business, which could affect our financial position, results of operations and liquidity.
Executive Officers of the Registrant
At January 14, 2015, our executive officers are as follows:
| Name |
Age | Position | ||||
| J. Brendan Barba |
73 | Chairman of the Board of Directors, President and Chief Executive Officer | ||||
| Paul M. Feeney |
72 | Executive Vice President, Finance and Chief Financial Officer and Director | ||||
| John J. Powers |
50 | Executive Vice President, Sales and Marketing and Director | ||||
| Paul C. Vegliante |
49 | Executive Vice President, Operations | ||||
| Lawrence R. Noll |
66 | Vice President, Tax and Administration | ||||
| James B. Rafferty |
62 | Vice President and Treasurer | ||||
| Linda N. Guerrera |
47 | Vice President and Controller | ||||
J. Brendan Barba is one of our founders and has been our President and Chief Executive Officer and a director since our inception in January 1970. In 1985, Mr. Barba also became the Chairman of the Board of Directors.
Paul M. Feeney has been our Executive Vice President, Finance and Chief Financial Officer and a director since December 1988. From 1980 to 1988, Mr. Feeney was Vice President and Treasurer of Witco Corporation.
John J. Powers has been our Executive Vice President, Sales and Marketing since March 1996 and a director since November 1, 2013. Previously, he served the Company as Vice President, Custom Film Division from 1993 to 1996 and various sales positions from 1989 to 1993.
Paul C. Vegliante has been our Executive Vice President, Operations since December 1999. Prior thereto, he was our Vice President, Operations since June 1997 and held various other positions with us since 1994.
Lawrence R. Noll has been our Vice President, Tax and Administration since April 2007. Previously, he served as Vice President, Controller and Secretary (2005-2007), Vice President and Controller (1996-2005), Secretary (1993-1998), Vice President, Finance (1993-1996), and Controller (1980-1993). He also served as a director of the Company from 1993 to 2004 and from February 2005 to November 1, 2013.
James B. Rafferty has been our Vice President and Treasurer since November 1996 and Secretary from April 2007 to June 2011. Prior thereto, he was our Assistant Treasurer from July 1996 to November 1996. From 1989 to 1995, Mr. Rafferty was Director of Treasury Operations at Borden, Inc.
Linda N. Guerrera has been our Vice President and Controller since April 2007. Previously, she was our Director of Financial Reporting from September 2006 to April 2007 and our Assistant Controller—International Operations from October 1996 to September 2006. Prior to joining the Company, Ms. Guerrera was a manager at Arthur Andersen LLP in New York City.
Certain family relationships exist between our directors and executive officers: Messrs. Powers and Vegliante are the sons-in-law of Mr. Barba; and Ms. Guerrera is the daughter-in-law of Mr. Feeney.
Available Information
Our Internet address is www.aepinc.com. In the “Investor Relations” section of our website, we post the following filings as soon as reasonably practicable after they are electronically filed with or
10
Table of Contents
furnished to the SEC: our annual report on Form 10-K, our quarterly reports on Form 10-Q, our current reports on Form 8-K, and any amendments to those reports or statements filed or furnished pursuant to Section 13(a) or 15(d) of the Securities Exchange Act of 1934, as amended, and our proxy statement on Schedule 14A related to our annual stockholders’ meeting. All such filings are available in the Investor Relations section of our web- site free of charge. Copies of any of the above-referenced information will also be made available, free of charge, by calling (201) 641-6600 or upon written request to: Corporate Secretary, AEP Industries, Inc., 95 Chestnut Ridge Road, Montvale, NJ 07645. The content on our website is not incorporated by reference into this Form 10-K unless expressly noted.
| ITEM 1A. | RISK FACTORS |
You should carefully consider each of the risks and uncertainties described below and elsewhere in this Annual Report on Form 10-K, as well as any amendments or updates reflected in subsequent filings with the SEC. We believe these risks and uncertainties, individually or in the aggregate, could cause our actual results to differ materially from expected and historical results and could materially and adversely affect our business operations, results of operations, financial condition and liquidity.
Industry Risks
Our business is dependent on the price and availability of resin, our principal raw material, and our ability to pass on resin price increases to our customers.
The principal raw materials that we use in our products are polyethylene and polyvinyl chloride resins. Our ability to operate profitably is dependent, in a large part, on the markets for these resins. These resins are derived from petroleum and natural gas, and therefore prices of such resins fluctuate substantially as a result of changes in petroleum and natural gas prices, demand and the capacity of resin suppliers. Instability in the world markets for petroleum and natural gas could adversely affect the prices of our raw materials and their general availability. We have at times experienced significant fluctuations in resin prices and availability, and in the last two fiscal years we have experienced unprecedented resin price increases resulting in an aggregate increase of $0.23 per pound from November 1, 2012 to October 31, 2014. Such resin price increases have materially and adversely impacted our revenue and profitability, given the challenge of passing through such significant pricing changes under existing customer agreements with short-term and long-term pricing protection. Further, many customers have determined to seek new competitive bids as a result of such pricing increases being passed through, which has resulted in significant margin pressure and the loss of some significant customers. In the long term, such price increases may adversely impact our leverage in negotiating new agreements, and our customers may consider product substitution alternatives. See Item 7, “Management’s Discussion and Analysis of Financial Condition and Results of Operations” for a discussion of the impact of resin costs on results of operations in fiscal 2014.
Polyethylene resin is expected to incur a major growth phase in the United States, with billions of pounds of new capacity expected over the next several years because of low-priced natural gas feedstock in North America. Availability of skilled labor and a variety of other reasons could delay this new capacity coming on stream.
Our ability to maintain profitability is heavily dependent upon our ability to pass through to our customers the full amount of any increase in raw material costs on a timely basis. Since resin costs fluctuate significantly, selling prices are determined generally as a “spread” over resin costs, usually expressed as cents per pound. The historical increases and decreases in resin costs have generally been reflected over a period of time in the sales prices of the products on a penny-for-penny basis. Assuming a constant volume of sales, an increase in resin costs would, therefore, result in increased sales revenues but lower gross profit as a percentage of sales or gross profit margin, while a decrease in resin costs would result in lower sales revenues with a higher gross profit margin. Further, the gap between the
11
Table of Contents
time at which an order is taken, resin is purchased, production occurs and shipment is made, has an impact on our financial results and our working capital needs. In a period of rising resin prices, this impact is generally negative to operating results and in periods of declining resin prices, the impact is generally positive to operating results. If there is overcapacity of, or significant competition of comparable quality in any specific product that we manufacture and sell, we frequently are not able to pass through the full amount of any cost increase and we may be required to participate in a re-bid process for future business.
Intense competition in the flexible packaging markets may adversely affect our operating results.
The business of supplying flexible plastic packaging products is extremely competitive and the current economic environment has only intensified an already competitive marketplace. The competition in our market is highly price sensitive; we also compete on the basis of quality, service, timely delivery and product differentiation, development and availability. We face intense competition from numerous private and public companies, including from local manufacturers which specialize in the extrusion of a limited group of products, which they market nationally, and a limited number of manufacturers of flexible packaging products which offer a broad range of products and maintain production and marketing facilities domestically and internationally. Certain of our competitors may have more efficient production facilities (including more advanced technologies), well-developed sales and marketing staffs and greater financial resources than we do. We believe that there are few barriers to entry into many of our product markets. As a result, we have experienced, and may continue to experience, competition from new manufacturers. When new manufacturers enter the market for a flexible plastic packaging product or existing manufacturers increase capacity, they frequently reduce prices to achieve increased market share. In addition, we compete with other packaging product manufacturers, many of which can offer consumers non-plastic packaging solutions. Many of these competitors have greater financial resources than we do, and such competition can result in additional pricing pressures, reduced sales and lower margins.
An increase in competition could result in material reductions in margins or loss of our market share, which could materially adversely affect our operations and financial condition. In recent years, focusing on maintaining margins has negatively impacted sales volume; while focusing on maintaining market share has negatively affected margins. In addition, since we do not have long-term arrangements with many of our customers, these competitive factors could cause our customers to shift suppliers and/or products quickly. Further, rising costs in freight, utility, packaging and health costs have negatively impacted our results in recent years and we were unable to implement a non-resin price increase in the third quarter of fiscal 2014 to counter such costs due to resistance from our customers, which we attribute to intense competition in the industry. Certain consolidation of our customers has also resulted in customers having greater purchasing power. There can be no assurance that we will be able to compete successfully in the markets for our products or that competition will not intensify.
We are subject to various environmental and health and safety laws and regulations which govern our operations and which may result in potential liability. In addition, consumer preferences and ongoing health and safety studies on plastics and resins may adversely affect our business.
Our operations are subject to various federal, state, local and foreign environmental laws and regulations which govern:
| • | discharges into the air and water; |
| • | the storage, handling and disposal of solid and hazardous substances and waste; |
| • | the remediation of soil and ground water contaminated by petroleum products or hazardous substances or waste; and |
| • | the health and safety of our employees. |
12
Table of Contents
Compliance with these laws and regulations may require material expenditures by us. Actions by federal, state, local and foreign governments concerning environmental and health and safety matters could result in laws or regulations that could increase the cost of manufacturing our products. In addition, the nature of our current and former operations and the history of industrial uses at some of our manufacturing facilities expose us to the risk of liabilities or claims with respect to environmental and worker health and safety matters. We may also be exposed to claims for violations of environmental laws and regulations by previous owners or operators of our property. Such liability may be imposed without regard to fault, and under certain circumstances, can be joint and several, resulting in one party being held responsible for the entire obligation. In addition, the presence of, or failure to remediate, hazardous substances or waste may adversely affect our ability to sell or rent any property or to use it as collateral for a loan. We also may be liable for costs relating to the investigation, remediation or removal of hazardous waste and substances from a disposal or treatment facility to which we or our predecessors sent waste or materials. We have limited insurance coverage for potential environmental liabilities associated with historic and current operations and we do not anticipate increasing such coverage in the future. We may also assume, or be deemed to assume, significant environmental liabilities in acquisitions.
While we have not been required historically to make significant capital expenditures in order to comply with applicable environmental laws and regulations, we cannot predict with any certainty our future capital expenditure requirements because of continually changing compliance standards and environmental technology. Furthermore, violations or contaminated sites that we do not know about, including contamination caused by prior owners and operators of such sites, or at sites formerly owned or operated by us or our predecessors in connection with discontinued operations, could result in additional compliance or remediation costs or other liabilities, which could be material.
Additionally, a decline in consumer preference for plastic products due to environmental considerations could have a material adverse effect on our business, financial condition and results of operations. In addition, a number of governmental authorities, both in the United States and abroad, have considered, or are expected to consider, legislation aimed at reducing the amount of plastic wastes disposed. Programs have included, for example, mandating certain rates of recycling and/or the use of recycled materials, imposing deposits or taxes on flexible plastic packaging material and requiring retailers or manufacturers to take back packaging used for their products. Legislation, as well as voluntary initiatives similarly aimed at reducing the level of plastic wastes, could reduce the demand for certain flexible plastic packaging, result in greater costs for flexible plastic packaging manufacturers or otherwise impact our business. Some consumer products companies, including some of our customers, have responded to these governmental initiatives and to perceived environmental concerns of consumers by using containers made in whole or in part of recycled plastic, which we do not manufacture. Future legislation and initiatives could adversely affect us in a manner that would be material.
Also, continuing studies of potential health and safety effects of various resins and plastics, including polyvinyl chlorides and other materials that we use in our products, are being conducted by industry groups, government agencies and others. The results of these studies, along with the development of any other new information, may adversely affect our ability to market and sell certain of our products or may give rise to claims for damages from persons who believe they have been injured by such products, any of which could adversely affect our operations and financial condition.
The Food and Drug Administration (“FDA”) regulates the material content of direct-contact food and drug packages we manufacture pursuant to the Federal Food, Drug and Cosmetic Act. Furthermore, some of our products are regulated by the Consumer Product Safety Commission (“CPSC”) pursuant to various federal laws, including the Consumer Product Safety Act and the Poison Prevention Packaging Act. Both the FDA and the CPSC can require the manufacturer of defective products to repurchase or
13
Table of Contents
recall these products and may also impose fines or penalties on the manufacturer. Similar laws exist in some states, cities and other countries in which we sell products. In addition, laws exist in certain states restricting the sale of packaging with certain levels of heavy metals and imposing fines and penalties for noncompliance. Although we use FDA-approved resins and pigments in our products that directly contact food and drug products and we believe our products are in material compliance with all applicable requirements, we remain subject to the risk that our products could be found not to be in compliance with these and other requirements. A recall of any of our products or any fines and penalties imposed in connection with non-compliance could have a materially adverse effect on us.
Company Risks
Disruptions in the global economic and financial market environment may have a negative effect on our business and operations.
Disruptions in the global economy and volatility in the financial markets could cause, among other things, lower levels of liquidity, increased borrowing rates, increased rates of default and bankruptcy, lower consumer and business spending, and lower consumer net worth, all of which may have a negative effect on our business, results of operations, financial condition and liquidity. Customers, distributors and suppliers may be negatively affected by the ongoing impacts of the economic and financial market difficulties. Current or potential customers and suppliers may no longer be in business, may be unable to fund purchases or may determine to reduce purchases, all of which could lead to reduced demand for our products, reduced gross margins and increased customer payment delays or defaults. Further, suppliers may not be able to supply us with needed raw materials on a timely basis, may increase prices or may go out of business, which could result in our inability to meet consumer demand or affect our gross margins. We are also limited in our ability to reduce costs to offset the results of a prolonged or severe economic downturn given certain fixed costs associated with our operations, difficulties if we overstrained our resources, and our long-term business approach that necessitates we remain in position to respond when market conditions improve. Future weakness in the global economy could adversely affect our operations, financial condition and cash flows in future periods.
See “—Financial Risks” below for a discussion of additional risks to our liquidity resulting from the current economic and financial market environment.
The loss of a key supplier could lead to increased costs, lower profit margins and short-term production issues
The majority of the resins purchased by us are purchased under supply contracts which are typically renewed annually. In fiscal 2014, we purchased approximately 28%, 22% and 17% of our resin requirements from our three largest suppliers. Each of these suppliers produces resins in multiple locations, and should any one, or a combination of these locations fail to meet our needs, we believe sufficient capacity exists among our remaining contract holders, the open market and the secondary markets to supply any shortfall that may result. Nevertheless, it is not always possible to replace a specialty resin without a disruption in our operations and replacement of significant supply is often at higher prices, and such impact may materially and adversely harm our competitive position.
We negotiate and award our supply contracts annually. The resin contracts generally serve to establish the basic terms and conditions between the parties, including rebates based on the volume of resin purchases, but do not bind us in a materially significant way. Should any of our existing relationships fail to bid or survive the bid process, the position previously enjoyed by that contract holder typically migrates to another supplier. While this process has served us well in the past, there is no guarantee that the future replacement of any supplier will always result in a more effective and efficient relationship in the future.
14
Table of Contents
We have limited contractual relationships with our customers and, as a result, our customers may unilaterally reduce the purchase of our products. The loss of several customers could, in the aggregate, materially adversely affect our operations and financial condition.
A substantial portion of our business is in the merchant market, in which we do not have long-term contractual relationships with our customers. As a result, our customers may unilaterally reduce the purchase of our products or, in certain cases, terminate existing orders for which we may have incurred significant production costs. The loss of several customers could, in the aggregate, materially adversely affect our operations and financial condition.
Many of our larger packaging customers are multinational companies that purchase large quantities of packaging materials, some of whom have recently consolidated. Many of these companies are purchasers with centralized procurement departments. They generally enter into supply arrangements through a tender process of soliciting bids from several potential suppliers and selecting the winning bid based on several attributes, including price and service. The significant negotiating leverage possessed by many of our customers and potential customers limits our ability to negotiate supply arrangements with favorable terms and creates pricing pressure, reducing margins industry wide. As noted, recent rising resin prices have resulted in many multinational companies re-soliciting bids from several potential suppliers of packaging materials. In addition, our customers may vary their order levels significantly from period to period, and customers may not continue to place orders with us in the future at the same levels as in prior periods. In the event we lose any of our larger customers, we may not be able to quickly replace that revenue source, which could harm our financial results.
Loss of third-party transportation providers upon whom we depend or increases in fuel prices could increase our costs or cause a disruption in our operations.
We depend generally upon third-party transportation providers for delivery of our products to our customers. Strikes, slowdowns, transportation disruptions or other conditions in the transportation industry, including, but not limited to, shortages of truck drivers, disruptions in rail service, decreases in the availability of vessels or increases in fuel prices, could increase our costs and disrupt our operations and our ability to service our customers on a timely basis.
We may, from time to time, experience problems in our labor relations.
Unions represent 480 employees, or 19% of our workforce, at October 31, 2014, under three collective bargaining agreements which expire in January 2015 (representing 6% of our workforce negotiations are currently underway), March 2017 and December 2018, respectively. Although we believe that our present labor relations with our employees are satisfactory, our failure to renew these agreements on reasonable terms could result in labor disruptions and increased labor costs, which could adversely affect our financial performance.
We cannot assure you that our relations with the unionized portion of our workforce will remain positive or that such employees will not initiate a strike, work stoppage or slowdown in the future. In the event of such an action, our business, prospects, results of operations and financial condition could be adversely affected and we cannot assure you that we would be able to adequately meet the needs of our customers using our remaining workforce. In addition, we cannot assure you that we will not have similar actions with our non-unionized workforce or that our non-unionized workforce will not become unionized in the future.
Acquisitions inherently involve significant risks and uncertainties.
We continually review acquisition opportunities that will enhance our market position, expand our product lines and provide sufficient synergies. Any of the following risks associated with our past
15
Table of Contents
acquisitions or future acquisitions, individually or in aggregate may have a material adverse effect on our business, financial condition, operating results or stock price:
| • | difficulties in realizing anticipated financial or strategic benefits of such acquisition; |
| • | diversion of capital from other uses and potential dilution of stockholder ownership; |
| • | the risks related to increased indebtedness; |
| • | significant capital expenditures may be required to integrate the acquired business into our operations; |
| • | disruption of our ongoing business or the ongoing acquired business, including impairment of existing relationships with our employees, distributors, suppliers or customers or those of the acquired companies; |
| • | diversion of management’s attention and other resources from current operations, including potential strain on financial and managerial controls and reporting systems and procedures; |
| • | difficulty in integrating acquired operations, including restructuring and realigning activities, personnel, technologies and products, including the loss of key employees, distributors, suppliers or customers of acquired businesses; |
| • | inability to realize cost savings, sales increases or other benefits that we anticipate from such acquisitions, either as to amount or in the expected time frame; |
| • | the risks of managing new product lines or new business segments within the flexible plastic packaging films industry; |
| • | assumption of known and unknown liabilities, some of which may be difficult or impossible to quantify; and |
| • | non-cash impairment charges or other accounting charges relating to the acquired assets. |
We are dependent on the management experience of our key personnel and our ability to attract and retain additional personnel.
Our future success depends to a large extent on the experience, business relationships and continued service of our key managerial employees, including J. Brendan Barba, our Chairman, President and Chief Executive Officer, and Paul M. Feeney, our Executive Vice President, Finance and Chief Financial Officer, both of whom are also directors. Although the Company significantly benefits from the 70 years of combined service of Messrs. Barba and Feeney, any failure to ensure effective transfer of institutional knowledge and to implement a well-run succession plan could hinder our strategic planning and growth upon their termination of employment. We do not maintain key-person insurance for any of our officers. We may not be able to retain our executive officers and key personnel or attract additional qualified key employees in the future. Competition for qualified employees is intense, and the loss of such persons, or an inability to attract, retain and motivate additional highly skilled employees, could have a material adverse effect on our results of operations and financial condition and prospects. There can be no assurance that we will be able to retain our existing personnel or attract and retain additional qualified employees.
Our executive officers beneficially own a substantial amount of our common stock and have significant influence over our business.
At October 31, 2014, our executive officers beneficially owned 1,096,849 shares of our common stock, representing 22% of our outstanding shares as of such date. Their ownership and voting control, together with their duties as executive officers and directors, gives them significant influence on the
16
Table of Contents
outcome of corporate transactions or other matters submitted to the Board of Directors or stockholders for approval, including acquisitions, mergers, consolidations, the sale of all or substantially all of our assets and director elections.
Our business is subject to risks associated with manufacturing our own products.
We internally manufacture our own products at our production facilities. While we maintain insurance covering our manufacturing and production facilities, including business interruption insurance, a catastrophic loss of the use of all or a portion of our facilities due to accident, fire, explosion, labor or other employee issues, weather conditions, other natural disaster or otherwise, whether short or long-term, could have a material adverse effect on us.
Unexpected failures of our equipment and machinery may result in production delays, loss of customers and revenues, significant repair costs, injuries to our employees, and customer claims. Any interruption in production capability may require us to make large capital expenditures to remedy the situation, which could have a negative impact on our profitability and cash flows. Our business interruption insurance may not be sufficient to offset the lost revenues or increased costs that we may experience during a disruption of our operations.
Security breaches and other disruptions to our information technology networks and systems could result in legal claims or proceedings, liability or regulatory penalties under laws protecting the privacy of personal information, disrupt operations, and reduce the benefits of our investment in cloud computing and other advanced technologies.
We depend on information technology to record and process Company and customer transactions, inventory control, purchasing and supply chain management, payroll and human resources, and financial reporting, including significant proprietary and sensitive data of the Company and our business partners and personally identifiable information of our employees. The Company’s information technology systems may be susceptible to damage, disruptions or shutdowns due to failures during the process of upgrading or replacing software, databases or components thereof, power outages, acts of sabotage, hardware failures, computer viruses, telecommunication failures, user errors or catastrophic events. Failure to effectively prevent, detect and recover from system failures, viruses, security breaches or other cyber incidents could significantly disrupt our operations, result in lost or misappropriated information, and adversely affect our internal control over financial reporting and our ability to timely and accurately report financial results.
Increasingly, we are relying on third parties to provide software, support and management with respect to a variety of business processes and activities as part of our information technology network, and we are utilizing cloud computing through certain of our third-party vendors. The security and privacy measures we and our vendors implement are critical to our business, our key relationships, and compliance with applicable law. Despite security measures and business continuity plans, our information technology networks may be vulnerable to damage, disruptions or shutdowns due to attacks by hackers, natural disasters or catastrophic events, or breaches due to errors or malfeasance by employees, contractors and others who have access to our networks and systems. The occurrence of any of these events could compromise our networks and the information stored therein could be accessed, publicly disclosed, lost or stolen. Any such access, disclosure or other loss of information could result in legal claims or proceedings, liability or regulatory penalties under laws protecting the privacy of personal information, disrupt operations, and reduce the benefits of our investment in cloud computing and other advanced technologies. Our insurance coverage may not be adequate to cover all of the costs and liabilities related to significant security and privacy violations.
17
Table of Contents
We may not be successful in protecting our intellectual property rights, including our unpatented proprietary know-how and trade secrets, or in avoiding claims that we infringed on the intellectual property rights of others.
In addition to relying on patent and trademark rights, we rely on unpatented proprietary know-how and trade secrets, and employ various methods, including confidentiality agreements with employees and consultants, customers and suppliers to protect our know-how and trade secrets. However, these methods and our patents and trademarks may not afford complete protection and there can be no assurance that others will not independently develop the know-how and trade secrets or develop better production methods than us. Further, we may not be able to deter current and former employees, contractors and other parties from breaching confidentiality agreements and misappropriating proprietary information and it is possible that third parties may copy or otherwise obtain and use our information and proprietary technology without authorization or otherwise infringe on our intellectual property rights. Additionally, we have licensed, and may license in the future, patents, trademarks, trade secrets, and similar proprietary rights to third parties. While we attempt to ensure that our intellectual property and similar proprietary rights are protected when entering into business relationships, third parties may take actions that could materially and adversely affect our rights or the value of our intellectual property, similar proprietary rights or reputation. In the future, we may also rely on litigation to enforce our intellectual property rights and contractual rights, and, if not successful, we may not be able to protect the value of our intellectual property. Any litigation could be protracted and costly and could have a material adverse effect on our business and results of operations regardless of its outcome.
Our success depends in part on our ability to obtain, or license from third parties, patents, trademarks, trade secrets and similar proprietary rights without infringing on the proprietary rights of third parties. Although we believe our intellectual property rights are sufficient to allow us to conduct our business without incurring liability to third parties, our products may infringe on the intellectual property rights of such persons. Furthermore, no assurance can be given that we will not be subject to claims asserting the infringement of the intellectual property rights of third parties seeking damages, the payment of royalties or licensing fees and/or injunctions against the sale of our products. Any such litigation could be protracted and costly and could have a material adverse effect on our business, financial condition and results of operations.
We face risks related to sales through distributors and other third parties.
In fiscal 2014, 2013 and 2012, approximately 61%, 61%, and 66%, respectively, of our worldwide sales were directly to distributors. Using third parties for distribution exposes us to many risks, including competitive pressure, concentration, credit risk and compliance risks. Distributors may sell products that compete with our products, and we may need to provide financial incentives to focus distributors on the sale of our products. We may rely on one or more key distributors for product sales, and the loss of these distributors could reduce our revenues. Distributors may face financial difficulties, including bankruptcy, which could harm our collection of accounts receivable and financial results. Violations of the Foreign Corrupt Practices Act of 1977 or similar laws by distributors or other third-party intermediaries could have a material impact on our business. Failing to manage risks related to our use of distributors may reduce sales, increase expenses, and weaken our competitive position.
18
Table of Contents
Financial Risks
Our substantial debt could adversely affect our financial health and prevent us from fulfilling our obligations under our indebtedness.
As of October 31, 2014, we had $256.3 million of total debt outstanding (including capital lease obligations of $11.8 million).
Our substantial debt could have important consequences to you. For example, it could:
| • | make it more difficult for us to satisfy our obligations with respect to our debt; |
| • | increase our vulnerability to general adverse economic and industry conditions; |
| • | require us to dedicate a substantial portion of our cash flow from operations to payments on our debt, thereby limiting our ability to fund working capital, capital expenditures and other general corporate purposes; |
| • | limit our flexibility in planning for, or reacting to, changes in our business and the industry in which we operate; |
| • | place us at a competitive disadvantage compared to our competitors that may have less debt; and |
| • | limit, among other things, our ability to borrow additional funds. |
We and our subsidiaries may be able to incur substantial additional debt in the future. As of October 31, 2014, we would have been permitted to borrow up to an additional $107.4 million under the credit facility (after taking into account $2.1 million of outstanding letters of credit) and $4.4 million under our credit line available to our Canadian subsidiary, in each case based on the respective available borrowing base. As of October 31, 2014, we had $40.5 million in borrowings under our credit facilities. In addition, the terms of the indenture that governs the senior notes do not prohibit us or our subsidiaries from issuing and incurring additional debt upon satisfaction of certain conditions. If new debt is added to our current debt levels, the related risks described above that we and our subsidiaries face could intensify.
To service our debt or redeem such debt upon a change of control, we will require a significant amount of cash. Our ability to generate cash depends on many factors beyond our control.
Our ability to service our debt and to fund our operations and planned capital expenditures will depend on our financial and operating performance. This, in part, is subject to prevailing economic conditions and to financial, business and other factors beyond our control. If our cash flow from operations is insufficient to fund our debt service obligations, we may be forced to reduce or delay capital expenditures, sell assets, obtain additional equity capital or indebtedness, or refinance or restructure our debt. These alternative measures may not be successful and may not permit us to meet our scheduled debt service obligations. In the absence of such operating results and resources, we could face substantial cash flow problems and might be required to sell material assets or operations to meet our debt service and other obligations. We cannot assure you as to the timing of such sales or the proceeds that we could realize from such sales or if additional debt or equity financing would be available on acceptable terms, if at all.
A provision of the senior notes requires us, upon a change of control, to offer to purchase the outstanding senior notes. If a change of control were to occur and we could not obtain a waiver or if we do not have the funds to make the purchase, we would be in default under the senior notes, which could, in turn, cause any of our debt to which a cross-acceleration or cross-default provision applies to become immediately due and payable. If our debt were to be accelerated, we cannot assure you that we would be able to repay it.
19
Table of Contents
We are subject to a number of restrictive debt covenants which may restrict our business and financing activities.
Our credit facility and the indenture that governs the senior notes contain restrictive debt covenants that, among other things, restrict our ability to:
| • | borrow money; |
| • | pay dividends and make distributions; |
| • | issue stock of subsidiaries; |
| • | make certain investments; |
| • | repurchase stock; |
| • | use assets as security in other transactions; |
| • | create liens; |
| • | enter into affiliate transactions; |
| • | merge or consolidate; and |
| • | transfer and sell assets. |
Our agreement relating to the credit line available to our Canadian subsidiary also contains certain of these restrictive debt covenants. These covenants could adversely limit the Company’s ability to plan for or react to market conditions, meet its capital needs and execute its business strategy.
In addition, our credit facility also requires us to meet certain financial tests, and our agreement relating to the credit line available to our Canadian subsidiary requires it to meet certain financial tests. These restrictive covenants may limit our ability to expand or to pursue our business strategies. Furthermore, any indebtedness that we incur in the future may contain similar or more restrictive covenants.
Our ability to comply with the restrictions contained in our credit facility, the senior notes indenture and the credit line available to our Canadian subsidiary may be affected by changes in our business condition or results of operations, adverse regulatory developments or other events beyond our control. A failure to comply with these restrictions could result in a default under our credit facility, the senior notes indenture and the credit line available to our Canadian subsidiary, or any other subsequent financing agreement, which could, in turn, cause any of our debt to which a cross-acceleration or cross-default provision applies to become immediately due and payable. If our debt were to be accelerated, we cannot assure you that we would be able to repay it. In addition, a default could give our lenders the right to terminate any commitments that they had made to provide us with additional funds. Further, the credit facility is secured by liens on most of our domestic assets (other than real property and equipment) and on 66% of our ownership interest in certain foreign subsidiaries and, in the event of a default thereunder, the lenders generally would be entitled to seize the collateral.
Risks Related to an Investment in Our Common Stock
Our common stock price has been and may continue to be volatile.
The market price of our common stock has fluctuated regularly in the past. The market price of our common stock will continue to be subject to significant fluctuations in response to a variety of factors, including:
| • | fluctuations in operating results, including as a result of changes in resin prices, LIFO reserve, and the other variables; |
20
Table of Contents
| • | our liquidity needs and constraints; |
| • | the business environment, including the operating results and stock prices of companies in the industries we serve; |
| • | changes in general conditions in the U.S. and global economies or financial markets, including those resulting from war, incidents of terrorism and natural disasters or responses to such events; |
| • | announcements concerning our business or that of our competitors or customers; |
| • | acquisitions and divestitures; |
| • | the introduction of new products or changes in product pricing policies by us or our competitors; |
| • | change in earnings estimates or recommendations by research analysts who track our common stock or the stocks of other companies in our industry or failure of analysts to cover our common stock; |
| • | changes in accounting standards, policies, guidance, interpretations or principles; |
| • | sales of common stock by our employees, directors and executive officers; |
| • | prevailing interest rates; and |
| • | perceived dilution from stock issuances. |
Some companies that have had volatile market prices for their securities have been subject to securities class action suits filed against them. If a suit were to be filed against us, regardless of the outcome, it could result in substantial costs and a diversion of our management’s attention and resources. This could have a material adverse effect on our business, results of operation and financial condition.
Although our common stock has had increased trading volume for periods of time in the last few years, our common stock generally has had a low trading volume historically, which could cause further volatility in our stock.
Shares of common stock eligible for future sale, and additional equity offerings by us, may adversely affect our common stock price.
The market price of our common stock could decline as a result of sales of substantial amounts of additional shares of our common stock in the public market or in connection with future acquisitions, or the perception that such sales could occur. This could also impair our ability to raise additional capital through the sale of equity securities at a time and price favorable to us. As of October 31, 2014, under our certificate of incorporation, as amended, we are authorized to issue 30 million shares of common stock, of which 5.1 million shares of common stock were outstanding, 0.1 million shares of common stock were issuable upon the exercise of currently outstanding stock options and 0.1 million shares of common stock were issuable upon the settlement of performance units if the performance unit holders elect settlement in stock.
We may also decide to raise additional funds through public or private equity financing to fund our operations or for other business purposes. New issuances of equity securities would reduce your percentage ownership in us and the new equity securities could have rights and preferences with priority over those of our common stock.
21
Table of Contents
Delaware law and our charter documents may impede or discourage a takeover, which could cause the market price of our shares to decline.
We are a Delaware corporation and the anti-takeover provisions of Delaware law impose various impediments to the ability of a third party to acquire control of us, even if a change of control would be beneficial to our existing stockholders. For example, Section 203 of the Delaware General Corporation Law may discourage, delay or prevent a change in control by prohibiting us from engaging in a business combination with an interested stockholder for a period of three years after the person becomes an interested stockholder.
In addition, our restated certificate of incorporation and seventh amended and restated by-laws contain provisions that may discourage, delay or prevent a third party from acquiring us, even if doing so would be beneficial to our stockholders. These provisions include:
| • | requiring supermajority approval of stockholders for certain business combinations or an amendment to, or repeal of, the by-laws; |
| • | prohibiting stockholders from acting by written consent without Board approval; |
| • | prohibiting stockholders from calling special meetings of stockholders; |
| • | establishing a classified Board of Directors, which allows approximately one-third of our directors to be elected each year; |
| • | limitations on the removal of directors; |
| • | advance notice requirements for nominating candidates for election to our Board of Directors or for proposing matters that can be acted upon by stockholders at stockholder meetings; |
| • | permitting the Board of Directors to amend or repeal the by-laws; and |
| • | permitting the Board of Directors to designate one or more series of preferred stock. |
Further, on March 28, 2014, our Board adopted an amended and restated stockholder rights plan, which amended and restated in its entirety the prior three-year stockholder rights plan that was to expire on March 31, 2014. The amended and restated stockholder rights plan is designed to assure that all of our stockholders receive fair and equal treatment in the event of any proposed takeover of the Company and to guard against partial tender offers, open market accumulations and other abusive or coercive tactics without paying stockholders a control premium. The amended and restated stockholder rights plan may have anti-takeover effects by discouraging potential proxy contests and other takeover methods, particularly those that have not been negotiated with the Board, and the amended and restated stockholder rights plan may also inhibit the acquisition of a controlling position in our common stock. Therefore, transactions may not occur that stockholders would otherwise support and/or from which they would receive a substantial premium for their shares over the current market price. The amended and restated stockholder rights plan may also make it more difficult to remove members of the current Board or management.
Our issuance of preferred stock could adversely affect holders of our common stock.
We are currently authorized to issue 1,000,000 shares of preferred stock in accordance with our restated certificate of incorporation, 30,000 of which is designated as Series A Preferred Stock in connection with the amended and restated stockholder rights plan and none of which is issued and outstanding. Our Board of Directors has the power, without stockholder approval, to set the terms of any such series of preferred stock that may be issued, including voting rights, dividend rights, and preferences over our common stock with respect to dividends or if we liquidate, dissolve or wind up our business and other terms. If we issue preferred stock in the future that has preference over our common
22
Table of Contents
stock with respect to the payment of dividends or upon our liquidation, dissolution or winding up, or if we issue preferred stock with voting rights that dilute the voting power of our common stock, the rights of holders of our common stock or the market price of our common stock could be adversely affected.
| ITEM 1B. | UNRESOLVED STAFF COMMENTS |
Not applicable.
| ITEM 2. | PROPERTIES |
Our corporate headquarters is located in Montvale, New Jersey in a 48,000 square foot building.
The following table describes the manufacturing and warehousing facilities that we owned or leased and utilized for operations as of October 31, 2014. All of these facilities are located in the United States and Canada. The Wright Township, Pennsylvania facility is pledged under the Pennsylvania industrial loan. The following chart sets forth the square footage of such manufacturing facilities, including warehousing space.
| Location |
Approximate Square Footage |
Types of Film | ||||
| Alsip, Illinois |
182,000 | Custom | ||||
| Bowling Green, Kentucky . |
171,000 | Printed and converted, custom, PROformance | ||||
| Chino, California |
275,000 | Custom and stretch | ||||
| Griffin, Georgia |
322,000 | Food contact, other products and specialty films | ||||
| Mankato, Minnesota |
104,000 | Custom, PROformance | ||||
| Mankato, Minnesota |
65,000 | Other products and specialty films | ||||
| Matthews, North Carolina |
394,000 | Custom and stretch | ||||
| Montgomery, Alabama |
125,000 | Food contact | ||||
| Montgomery, Alabama |
130,000 | Canliners, Food contact | ||||
| Nicholasville, Kentucky |
125,000 | Stretch | ||||
| Tulsa, Oklahoma |
126,000 | Stretch | ||||
| Waxahachie, Texas |
403,000 | Custom, Canliners | ||||
| West Hill, Ontario, Canada |
138,000 | Food contact | ||||
| Wright Township, Pennsylvania |
433,000 | Custom, PROformance and stretch | ||||
|
|
|
|||||
| Total |
2,993,000 | |||||
|
|
|
|||||
As of October 31, 2014, we also had a manufacturing facility located in Cartersville, Georgia that was part of the Atlantis acquisition in 2008. Production in Cartersville ceased on October 31, 2009, although we remain party to the facility lease ending July 31, 2015. Beginning in January 2011, we entered into a sublease for the Cartersville property aggregating $0.3 million in sublease income for the period January 2013 to July 2015.
We believe that all of our properties are well maintained and in good condition, and that the current operating facilities are adequate for present and immediate future business needs.
As of October 31, 2014, our manufacturing facilities (excluding Cartersville) had a combined average annual production capacity exceeding one billion pounds.
23
Table of Contents
| ITEM 3. | LEGAL PROCEEDINGS |
We are, from time to time, party to litigation arising in the normal course of our business. We believe that there are currently no legal proceedings, the outcome of which would have a material adverse effect on our financial position, cash flows or our results of operations.
| ITEM 4. | MINE SAFETY DISCLOSURES |
Not applicable.
24
Table of Contents
| ITEM 5. | MARKET FOR REGISTRANT’S COMMON EQUITY, RELATED STOCKHOLDER MATTERS AND ISSUER PURCHASES OF EQUITY SECURITIES |
Market Information
Our common stock is quoted on the Nasdaq Global Select Market under the symbol “AEPI.” The high and low closing prices for our common stock, as reported by the Nasdaq Global Select Market for the two fiscal years ended October 31, 2013 and 2014, respectively, are as follows:
| Price Range | ||||||||
| Fiscal Year and Period |
High | Low | ||||||
| 2013 |
||||||||
| First quarter (November-January) |
$ | 64.80 | $ | 52.97 | ||||
| Second quarter (February-April) |
77.10 | 63.05 | ||||||
| Third quarter (May-July) |
85.27 | 65.85 | ||||||
| Fourth quarter (August-October) |
89.54 | 59.42 | ||||||
| 2014 |
||||||||
| First quarter (November-January) |
$ | 59.68 | $ | 44.04 | ||||
| Second quarter (February-April) |
44.98 | 35.20 | ||||||
| Third quarter (May-July) |
40.86 | 30.65 | ||||||
| Fourth quarter (August-October) |
46.16 | 36.90 | ||||||
On January 8, 2015, the closing price for a share of our common stock, as reported by the Nasdaq Global Select Market, was $54.21.
Holders
On January 8, 2015, our common stock was held by over 1,000 stockholders of record. A substantially greater number of holders are beneficial owners whose shares are held of record by banks, brokers and other nominees.
Dividends
No dividends have been paid to stockholders since December 1995. The payment of future dividends is within the discretion of the Board of Directors and will depend upon business conditions, our earnings and financial condition and other relevant factors. The payments of future dividends, however, are restricted and subject to a number of covenants under our credit facility and under the indenture governing our 8.25% senior notes. The Company does not anticipate paying dividends in the foreseeable future.
Purchases of Equity Securities by the Issuer
There were no shares of our common stock repurchased during the quarter ended October 31, 2014.
25
Table of Contents
Performance Graph
The following graph compares, for the five-year period ended on October 31, 2014, the cumulative total stockholder return of our common stock against the cumulative total stockholder return of:
| • | the S&P 500 Index; and |
| • | a peer group consisting of ten publicly traded plastic manufacturing companies that we have selected. The companies in the peer group are as follows: Aptargroup, Inc., Astronics Corporation, Ball Corporation, Bemis Company, Inc., Crown Holdings, Inc., Dean Foods Company, Intertape Polymer Group Inc., Silgan Holdings Inc., Sonoco Products Company, and West Pharmaceutical Services, Inc. |
The graph assumes $100 was invested on October 31, 2009 in our common stock, the S&P 500 Index and the peer group consisting of ten companies, and the reinvestment of all dividends.
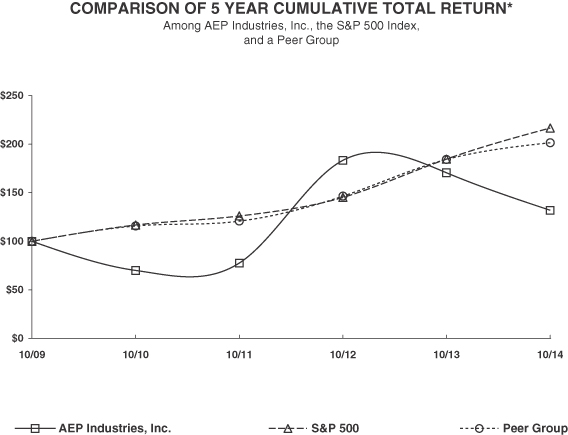
26
Table of Contents
| ITEM 6. | SELECTED FINANCIAL DATA |
The following table presents our selected financial data. The table should be read in conjunction with Item 7, “Management’s Discussion and Analysis of Financial Condition and Results of Operations”, and Item 8, “Financial Statements and Supplementary Data”, of this Annual Report on Form 10-K.
| For the Years Ended October 31, | ||||||||||||||||||||
| 2014 | 2013 | 2012 | 2011 | 2010 | ||||||||||||||||
| (in thousands, except per share data) | ||||||||||||||||||||
| Consolidated Statement of Operations Data: |
||||||||||||||||||||
| Net sales |
$ | 1,192,990 | $ | 1,143,852 | $ | 1,152,535 | $ | 974,792 | $ | 800,570 | ||||||||||
| Gross profit |
121,905 | 154,472 | 182,743 | 128,722 | 110,074 | |||||||||||||||
| Operating income(3) |
9,861 | 33,316 | 55,648 | 25,231 | 15,720 | |||||||||||||||
| Interest expense |
(19,571 | ) | (18,713 | ) | (19,077 | ) | (19,178 | ) | (15,206 | ) | ||||||||||
| Other income, net(1) |
270 | 1,360 | 829 | 8,418 | 455 | |||||||||||||||
| (Loss) income from continuing operations before benefit (provision) for income taxes |
(9,440 | ) | 15,963 | 37,400 | 14,471 | 969 | ||||||||||||||
| Benefit (provision) for income taxes |
3,934 | (5,215 | ) | (14,248 | ) | (2,083 | ) | (1,492 | ) | |||||||||||
| (Loss) income from continuing operations |
(5,506 | ) | 10,748 | 23,152 | 12,388 | (523 | ) | |||||||||||||
| Loss from discontinued operations |
— | — | — | — | (43 | ) | ||||||||||||||
| Net (loss) income |
$ | (5,506 | ) | $ | 10,748 | $ | 23,152 | $ | 12,388 | $ | (566 | ) | ||||||||
| Basic (Loss) Earnings per Common Share: | ||||||||||||||||||||
| (Loss) income from continuing operations |
$ | (1.03 | ) | $ | 1.93 | $ | 4.20 | $ | 2.10 | $ | (0.08 | ) | ||||||||
|
|
|
|
|
|
|
|
|
|
|
|||||||||||
| Loss from discontinued operations |
$ | — | $ | — | $ | — | $ | — | $ | (0.01 | ) | |||||||||
|
|
|
|
|
|
|
|
|
|
|
|||||||||||
| Net (loss) income per common share |
$ | (1.03 | ) | $ | 1.93 | $ | 4.20 | $ | 2.10 | $ | (0.08 | ) | ||||||||
|
|
|
|
|
|
|
|
|
|
|
|||||||||||
| Diluted (Loss) Earnings per Common Share: | ||||||||||||||||||||
| (Loss) income from continuing operations |
$ | (1.03 | ) | $ | 1.92 | $ | 4.16 | $ | 2.09 | $ | (0.08 | ) | ||||||||
|
|
|
|
|
|
|
|
|
|
|
|||||||||||
| Loss from discontinued operations |
$ | — | $ | — | $ | — | $ | — | $ | (0.01 | ) | |||||||||
|
|
|
|
|
|
|
|
|
|
|
|||||||||||
| Net (loss) income per common share |
$ | (1.03 | ) | $ | 1.92 | $ | 4.16 | $ | 2.09 | $ | (0.08 | ) | ||||||||
|
|
|
|
|
|
|
|
|
|
|
|||||||||||
| Cash dividends declared and paid |
— | — | — | — | — | |||||||||||||||
| 2014 | 2013 | 2012 | 2011 | 2010 | ||||||||||||||||
| Consolidated Balance Sheet Data (at period end): |
||||||||||||||||||||
| Total assets(2) |
$ | 446,946 | $ | 471,563 | $ | 431,443 | $ | 415,669 | $ | 350,796 | ||||||||||
| Total debt (including current portion and capital leases) |
256,331 | 242,266 | 217,332 | 238,515 | 191,083 | |||||||||||||||
| Shareholders’ equity |
59,697 | 85,413 | 73,729 | 49,986 | 56,630 | |||||||||||||||
| (1) | Fiscal year 2013, 2012 and 2011 includes a gain on bargain purchase of a business of $1.0 million, $17,000 and $8.3 million, respectively. |
| (2) | In October 2011, we completed the acquisition of substantially all of the assets and specified liabilities of Webster Industries (“Webster”), a national manufacturer and distributor of retail and institutional private label food and trash bags, for a purchase price of $25.9 million. The preliminary amount at October 31, 2011 recognized for the fair value of assets acquired was $51.7 million, with net working capital of $32.0 million. The amounts were increased in 2012 by $0.2 million based on the settlement of the net current asset adjustment and the finalization of the fair value allocated to property, plant and equipment. The acquisition was financed through a combination of cash on hand and availability under our credit facility. |
27
Table of Contents
| (3) | Fiscal year 2014 included $2.1 million in business interruption insurance recoveries resulting from damages sustained in the relocation of equipment purchased from Transco in Quebec, Canada to our Bowling Green, Kentucky facility. |
28
Table of Contents
| ITEM 7. | MANAGEMENT’S DISCUSSION AND ANALYSIS OF FINANCIAL CONDITION AND RESULTS OF OPERATIONS |
Management’s Discussion and Analysis of Financial Condition and Results of Operations (MD&A) is designed to provide a reader of our financial statements with a narrative explanation from the perspective of our management on our business, financial condition, results of operations, and cash flows. Our MD&A is presented in six sections:
| • | Overview |
| • | Results of Operations |
| • | Liquidity and Capital Resources |
| • | Contractual Obligations and Off-Balance-Sheet Arrangements |
| • | Critical Accounting Policies and Estimates |
| • | New Accounting Pronouncements |
Investors should review this MD&A in conjunction with the consolidated financial statements and related notes included in Item 8, “Financial Statements and Supplementary Data”, of this Annual Report on Form 10-K.
Overview
AEP Industries Inc. is a leading manufacturer of flexible plastic packaging films. We manufacture and market an extensive and diverse line of polyethylene and polyvinyl chloride flexible packaging products, with consumer, industrial and agricultural applications. Our flexible plastic packaging films are used in the packaging, transportation, beverage, food, automotive, pharmaceutical, chemical, electronics, construction, agriculture, carpeting, furniture and textile industries.
We manufacture plastic films, principally from resins blended with other raw materials, which we either sell or further process by printing, laminating, slitting or converting. Our processing technologies enable us to create a variety of value-added products according to the specifications of our customers. Our manufacturing operations are located in the United States and Canada.
The primary raw materials used in the manufacture of our products are polyethylene and polyvinyl chloride resins. The prices of these materials are primarily a function of the price of petroleum and natural gas, and therefore typically are volatile. Since resin costs fluctuate, selling prices are generally determined as a “spread” over resin costs, usually expressed as cents per pound. Consequently, we review and manage our operating revenues and expenses on a per pound basis. The historical increases and decreases in resin costs have generally been reflected over a period of time in the sales prices of the products on a penny-for-penny basis. Assuming a constant volume of sales, an increase in resin costs would, therefore, result in increased sales revenues but lower gross profit as a percentage of sales or gross profit margin, while a decrease in resin costs would result in lower sales revenues with higher gross profit margins. Further, the gap between the time at which an order is taken, resin is purchased, production occurs and shipment is made, has an impact on our financial results and our working capital needs. In a period of rising resin prices, this impact is generally negative to operating results and in periods of declining resin prices, the impact is generally positive to operating results.
Executive Summary
Our sales volume has decreased 1% and 1.5% in fiscal 2014 and 2013, respectively, primarily as a result of the challenging economic conditions in recent years and the unprecedented six price increases totaling $0.23 per pound in polyethylene resin since November 1, 2012. However, we believe in the
29
Table of Contents
long-term prospects for our business and anticipate stabilization or lower pricing in the resin markets in the next few years. As newfound supplies of low-priced natural gas feedstock have become available in North America, several North American resin suppliers are undertaking substantial capital projects which are designed to significantly increase domestic polyethylene resin supplies over the next several years. We believe these projects along with oil price declines will result over the next few years in significant reductions in domestic resin prices and increases in domestic film manufacturing activities. Fiscal 2015 has already begun with two announced polyethylene price decreases totaling $0.07 per pound. We believe our investment in capital expenditures over the past three years has well positioned the Company to fully participate in this opportunity.
In addition to our normal operating activities during fiscal 2014, we invested approximately $26.5 million in capital expenditures. Our capital expenditure projects over the past three years are now substantially complete. During fiscal 2014, we added approximately 40 million pounds of capacity to our product lines across custom films, stretch films, and can liners. The printing presses acquired from Transco are now fully installed and running smoothly. Through the Transco acquisition, we more than doubled the size of our print department and are now pursuing increased business opportunities.
Throughout the year, we continued to concentrate on driving costs out of our businesses. To that end, this year we streamlined the business through staff reductions, reduced inventories and discontinued certain slow-moving products. While adding capacity in those areas we anticipate growth opportunities, we simultaneously consolidated and exited specific unprofitable products within certain product lines. The retail line consolidation is now 90% complete, and we have exited three types of products in two of our divisions, retail and printed film. We believe that the investments in capital expenditures during the past three years and our cost cutting initiatives have well-positioned us to accommodate expected growing demand and navigate through a volatile market.
During fiscal 2014, we experienced two price increases of the primary raw materials used in the manufacture of our products, which were caused by tighter supplier inventory levels in North America along with unplanned outages at several of the North American PE suppliers. However, as stated above, we believe that PE resin costs may decrease in coming quarters, which would enable us to purchase these materials at lower costs and improve margins and we believe it would result in increased sales volume.
Throughout 2014 we took action to manage many of the initiatives within our control. We remain confident in the foundation of the business and expect that we are well-positioned to benefit as market conditions improve.
Market Conditions
As discussed above, the primary raw materials used in the manufacture of our products are polyethylene (“PE”) and polyvinyl chloride (“PVC”) resins, which total approximately 92% and 7%, respectively, of our total plastic resin purchases by volume. In recent years, the market for resins has been extremely volatile and in the last two fiscal years we have experienced unprecedented resin price increases resulting in an aggregate increase of $0.23 per pound from November 1, 2012 to October 31, 2014. During fiscal 2014, there were two PE price increases totaling $0.07 per pound. During the fiscal year ended October 31, 2014 average PE resin costs were 13% or $0.09 per pound higher than the average PE resin costs during the fiscal year ended October 31, 2013. Additionally, we have been experiencing volatility in PVC resin costs. Following an increase of $0.03 per pound in each month of the three months ended April 30, 2014 ($0.09 in total), PVC resin cost increased $0.02 per pound during the quarter ended October 31, 2014. Such resin price increases have materially and adversely impacted our revenue and profitability, given the challenge of passing through such significant pricing changes under existing customer agreements with short-term and long-term pricing protection.
30
Table of Contents
The steady increases in PE resin costs in recent periods are due to tighter supplier inventory levels in North America. Unplanned outages at several of the North American PE suppliers caused further tightness in supply resulting in price increases in PE resin in September 2014. Even though natural gas is used as feedstock in most North American PE production, the price of oil is used to set resin prices worldwide. With oil prices coming down and increased PE resin capacity forecasted, we believe that PE resin costs will decrease in fiscal 2015, although the timing and magnitude of the impact is uncertain.
The marketplace in which we sell our products remains very competitive, and has become increasingly competitive in recent years as a result of adverse economic circumstances straining the resources of our customers, distributors and suppliers. In order to maintain margins, it is essential that resin cost increases be matched by selling price adjustments. During periods of rising resin costs, the time lag in adjusting sell prices for those customers whose prices adjust periodically, are index price based, or change as the result of a competitive bid process, will have a negative impact on earnings. Many customers have determined to seek new competitive bids as a result of such pricing increases being passed through, which has resulted in significant margin pressure and the loss of some significant customers. There can be no assurance that we will be able to pass on resin price increases on a penny-for-penny basis in full or on a timely basis, shorten the time lag in adjusting sell prices, win in a competitive bid process or secure sufficient resin supply.
In recent years, we have implemented cost-reduction initiatives and invested in machinery and equipment to increase efficiency to meet the challenges of a volatile economic environment, as well as take advantage of opportunities in the marketplace. We are limited, however, in our ability to reduce costs that are fixed in nature. Rising costs in freight, utility, packaging and health costs have negatively impacted our results. To partially offset these cost factors, we attempted to implement a non-resin price increase effective December 1, 2014. Due to declining resin prices announced in November and December of 2014 totaling $0.07 per pound, we were unable to implement this non-resin price increase due to resistance from our customers.
Defined Terms
The following table illustrates the primary costs classified in each major operating expense category:
| Cost of Sales: |
Materials, including packaging |
Fixed manufacturing costs
Labor, direct and indirect
Depreciation
Inbound freight charges, including intercompany transfer freight charges
Utility costs used in the manufacturing process
Research and development costs
Quality control costs
Purchasing and receiving costs
Any inventory adjustments, including LIFO adjustments
Warehousing costs
| Delivery Expenses: |
All costs related to shipping and handling of products to customers, including transportation costs by third party providers |
| Selling, General and Administrative Expenses: |
Personnel costs, including salaries, bonuses, commissions and employee benefits |
Facilities and equipment costs, Utilities
Insurance
Professional fees, including audit and Sarbanes-Oxley compliance
31
Table of Contents
Our gross profit may not be comparable to that of other companies, since some companies include all the costs related to their distribution network in costs of sales and others, like us, include costs related to the shipping and handling of products to customers in delivery expenses, which is not a component of our cost of sales.
Results of Operations
Fiscal 2014 Compared to Fiscal 2013
The following table presents selected financial data for fiscal 2014 and 2013 (dollars per pound sold is calculated by dividing the applicable consolidated statement of operations category by pounds sold in the period):
| For the Years Ended October 31, | %
increase/ (decrease) of $ |
$ increase/ (decrease) |
||||||||||||||||||||||
| 2014 | 2013 | |||||||||||||||||||||||
| $ | $ Per pound sold |
$ | $ Per pound sold |
|||||||||||||||||||||
| (in thousands, except for per pound data) | ||||||||||||||||||||||||
| Net sales |
$ | 1,192,990 | $ | 1.26 | $ | 1,143,852 | $ | 1.19 | 4.3 | % | $ | 49,138 | ||||||||||||
| Gross profit |
121,905 | 0.13 | 154,472 | 0.16 | (21.1 | )% | (32,567 | ) | ||||||||||||||||
| Operating expenses: |
||||||||||||||||||||||||
| Delivery |
51,589 | 0.05 | 53,546 | 0.06 | (3.7 | )% | (1,957 | ) | ||||||||||||||||
| Selling |
36,550 | 0.04 | 38,825 | 0.04 | (5.9 | )% | (2,275 | ) | ||||||||||||||||
| General and administrative |
25,772 | 0.03 | 28,770 | 0.03 | (10.4 | )% | (2,998 | ) | ||||||||||||||||
|
|
|
|
|
|
|
|
|
|
|
|||||||||||||||
| Total operating expenses |
$ | 113,911 | $ | 0.12 | $ | 121,141 | $ | 0.13 | (6.0 | )% | $ | (7,230 | ) | |||||||||||
|
|
|
|
|
|
|
|
|
|
|
|||||||||||||||
| Pounds sold |
947,782 lbs. | 959,234 lbs. | ||||||||||||||||||||||
Net Sales
The increase in net sales for fiscal 2014 was the result of a 6% increase in average selling prices, primarily attributable to the partial pass-through of higher resin costs to customers during fiscal 2014, positively affecting net sales by $68.8 million, partially offset by a 1% decrease in sales volume negatively affecting net sales by $14.5 million. The volume decrease was primarily attributed to soft customer demand in certain of our product lines and the exiting of certain low-margin businesses. Fiscal 2014 also included a $5.2 million negative impact of foreign exchange relating to our Canadian operations.
Gross Profit
There was a $3.6 million increase in the LIFO reserve during fiscal 2014 versus a $9.9 million increase in the LIFO reserve during fiscal 2013, representing a decrease of $6.3 million year-over-year. Excluding the impact of the LIFO reserve change during fiscal 2014 and an increase in depreciation expense of $3.1 million, gross profit decreased $35.8 million resulting primarily from our inability to pass through the entirety of increased resin costs on a timely basis to our customers, higher manufacturing costs, primarily utilities and insurance, and lower volumes sold.
Operating Expenses
Operating expenses decreased $7.2 million during fiscal 2014 versus fiscal 2013 primarily due to a $2.5 million decrease in share-based compensation costs associated with our stock options and performance units, a $1.6 million decrease in provisions related to employee cash performance incentives, a decrease of $1.2 million related to salaries and severance associated with the Webster Industries acquisition and a decrease in delivery expenses of $1.7 million due primarily to lower
32
Table of Contents
volumes sold, lower fuel costs and greater use of internal fleet, partially offset by an increase in bad debt expense of $2.1 million, primarily related to the full provision of a note receivable owed from a distributor estimated to be uncollectible.
Business Interruption Insurance Recovery
During the fiscal year 2013 relocation of equipment purchased from Transco in Quebec, Canada to our Bowling Green, Kentucky facility, a print press was damaged in transit. The damages sustained resulted in a delay in the start-up of the machinery and our inability to supply certain customers. We filed a business interruption claim related to the lost margins from this incident. During the third quarter of 2014, we collected $2,050,000 in business interruption recoveries, which is recorded as a component of other operating income in the consolidated statement of operations for the year ended October 31, 2014.
Interest Expense
Interest expense for fiscal 2014 increased $0.9 million as compared to the prior year period resulting primarily from higher average borrowings on our credit facility increasing interest expense by $0.7 million and a $0.2 million decrease in unrealized gains on our interest rate swap as compared to the prior year period.
Income Tax Provision
The benefit for income taxes for fiscal 2014 was $3.9 million on a loss before the benefit for income taxes of $9.4 million. The difference between the effective tax rate of 41.7% and the U.S. statutory tax rate of 35.0% primarily relates to a benefit for state taxes in the United States, net of federal benefit (+4.7%), and the differential in the U.S. and Canadian statutory rates (+2.9%), partially offset by foreign withholding taxes paid and accrued (-2.8%).
The provision for income taxes for fiscal 2013 was $5.2 million on income before the provision for income taxes of $16.0 million. The difference between the effective tax rate of 32.7% and the U.S. statutory tax rate of 35.0% primarily relates to the differential in the U.S. and Canadian statutory rates (-3.4%) and the non-taxable gain on bargain purchase (-2.2%), partially offset by a provision for state taxes in the United States, net of federal benefit (+2.3%) and foreign withholding taxes paid and accrued (+2.3%).
Reconciliation of Non-GAAP Measures to GAAP
We define Adjusted EBITDA as net income (loss) before discontinued operations, interest expense, income taxes, depreciation and amortization, changes in LIFO reserve, other non-operating income (expense) and share-based compensation expense (income). We believe Adjusted EBITDA is an important measure of operating performance because it allows management, investors and others to evaluate and compare our core operating results, including our return on capital and operating efficiencies, from period to period by removing the impact of our capital structure (interest expense from our outstanding debt), asset base (depreciation and amortization), tax consequences, changes in LIFO reserve (a non-cash charge/benefit to our consolidated statements of operations), other non-operating items and share-based compensation. Furthermore, we use Adjusted EBITDA for business planning purposes and to evaluate and price potential acquisitions. In addition to its use by management, we also believe Adjusted EBITDA is a measure widely used by securities analysts, investors and others to evaluate the financial performance of our company and other companies in the plastic films industry. Other companies may calculate Adjusted EBITDA differently, and therefore our Adjusted EBITDA may not be comparable to similarly titled measures of other companies.
Adjusted EBITDA is not a measure of financial performance under U.S. generally accepted accounting principles (GAAP), and should not be considered in isolation or as an alternative to net
33
Table of Contents
income (loss), cash flows from operating activities and other measures determined in accordance with GAAP. Items excluded from Adjusted EBITDA are significant and necessary components to the operations of our business, and, therefore, Adjusted EBITDA should only be used as a supplemental measure of our operating performance.
The following is a reconciliation of our net (loss) income, the most directly comparable GAAP financial measure, to Adjusted EBITDA:
| Fiscal 2014 | Fiscal 2013 | Fiscal 2012 | ||||||||||
| (in thousands) | (in thousands) | (in thousands) | ||||||||||
| Net (loss) income |
$ | (5,506 | ) | $ | 10,748 | $ | 23,152 | |||||
| (Benefit) provision for income taxes |
(3,934 | ) | 5,215 | 14,248 | ||||||||
| Interest expense |
19,571 | 18,713 | 19,077 | |||||||||
| Depreciation and amortization expense |
31,507 | 28,592 | 22,828 | |||||||||
| Increase (decrease) in LIFO reserve |
3,647 | 9,910 | (1,181 | ) | ||||||||
| Gain on bargain purchase of a business |
— | (1,001 | ) | (17 | ) | |||||||
| Other non-operating income |
(270 | ) | (359 | ) | (812 | ) | ||||||
| Share-based compensation |
1,073 | 4,060 | 6,893 | |||||||||
|
|
|
|
|
|
|
|||||||
| Adjusted EBITDA |
$ | 46,088 | $ | 75,878 | $ | 84,188 | ||||||
|
|
|
|
|
|
|
|||||||
Fiscal 2013 Compared to Fiscal 2012
The following table presents selected financial data for fiscal 2013 and 2012 (dollars per pound sold is calculated by dividing the applicable consolidated statement of operations category by pounds sold in the period):
| For the Years Ended October 31, | %
increase/ (decrease) of $ |
$ increase/ (decrease) |
||||||||||||||||||||||
| 2013 | 2012 | |||||||||||||||||||||||
| $ | $ Per pound sold |
$ | $ Per pound sold |
|||||||||||||||||||||
| (in thousands, except for per pound data) | ||||||||||||||||||||||||
| Net sales |
$ | 1,143,852 | $ | 1.19 | $ | 1,152,535 | $ | 1.18 | (0.8 | )% | $ | (8,683 | ) | |||||||||||
| Gross profit |
154,472 | 0.16 | 182,743 | 0.19 | (15.5 | )% | (28,271 | ) | ||||||||||||||||
| Operating expenses: |
||||||||||||||||||||||||
| Delivery |
53,546 | 0.06 | 52,989 | 0.06 | 1.1 | % | 557 | |||||||||||||||||
| Selling |
38,825 | 0.04 | 41,404 | 0.04 | (6.2 | )% | (2,579 | ) | ||||||||||||||||
| General and administrative |
28,770 | 0.03 | 32,424 | 0.03 | (11.3 | )% | (3,654 | ) | ||||||||||||||||
|
|
|
|
|
|
|
|
|
|
|
|||||||||||||||
| Total operating expenses |
$ | 121,141 | $ | 0.13 | $ | 126,817 | $ | 0.13 | (4.5 | )% | $ | (5,676 | ) | |||||||||||
|
|
|
|
|
|
|
|
|
|
|
|||||||||||||||
| Pounds sold |
959,234 lbs. | 973,833 lbs. | ||||||||||||||||||||||
Net Sales
The decrease in net sales for fiscal 2013 was the result of a 1% decrease in sales volume negatively affecting net sales by $17.4 million partially offset by a 1% increase in average selling prices, primarily attributable to the pass-through of higher resin costs to customers during the comparable periods, positively affecting net sales by $9.8 million. Volume sold in fiscal 2013 was negatively impacted primarily by disruptions resulting from the movement and installation of equipment related to the Webster and Transco acquisitions. Fiscal 2013 also included a $1.1 million negative impact of foreign exchange relating to our Canadian operations.
34
Table of Contents
Gross Profit
There was a $9.9 million increase in the LIFO reserve during fiscal 2013 versus a $1.2 million decrease in the LIFO reserve during fiscal 2012, representing an increase of $11.1 million year-over-year. Excluding the impact of the LIFO reserve change during fiscal 2013 and an increase in depreciation expense of $5.1 million, gross profit decreased $12.1 million resulting primarily from decreased volumes sold and from increased manufacturing costs, including costs incurred as we realigned our plants to better align with market demand and increase manufacturing capabilities.
Operating Expenses
Operating expenses decreased $5.7 million during fiscal 2013 versus fiscal 2012. Included in the prior year period was $0.6 million of acquisition-related fees associated with the Webster acquisition. Excluding such fees, operating expenses decreased $5.1 million primarily due to a $2.3 million decrease in share-based compensation costs associated with our stock options and performance units, a $2.6 million decrease in provisions related to employee cash performance incentives and $0.7 million of lower professional fees, partially offset by an increase of $0.6 million in delivery expenses primarily due to higher fuel costs and temporarily increased inter-plant transportation costs incurred to maintain traditional customer service levels as manufacturing sites were realigned, and $0.8 million in severance costs associated with our Webster operations.
Interest Expense
Interest expense for fiscal 2013 decreased $0.4 million as compared to the prior year period resulting primarily from lower average borrowings on our credit facility reducing interest expense by $0.5 million and an increase in an unrealized gain on our interest rate swap of $0.3 million as compared to the prior year period, partially offset by $0.4 million of additional interest expense on new capital leases and interest expense on the mortgage note which was entered into on July 25, 2012.
Gain On Bargain Purchase of a Business
Gain on bargain purchase of $1.0 million during fiscal 2013 resulted from the fair value of the identifiable assets acquired in the Transco acquisition exceeding the purchase price (see Note 3).
Other, Net
Other, net for fiscal 2013 amounted to $0.4 million in income, as compared to $0.8 million in income for fiscal 2012. The change between the periods is primarily attributable to the reclassification of $0.7 million of accumulated foreign currency translation gains related to our New Zealand operations into the statement of operations during fiscal 2012 as a result of the final liquidation of this subsidiary.
Income Tax Provision
The provision for income taxes for fiscal 2013 was $5.2 million on income before the provision for income taxes of $16.0 million. The difference between the effective tax rate of 32.7% and the U.S. statutory tax rate of 35.0% primarily relates to the differential in the U.S. and Canadian statutory rates (-3.4%) and the non-taxable gain on bargain purchase (-2.2%), partially offset by a provision for state taxes in the United States, net of federal benefit (+2.3%) and foreign withholding taxes paid and accrued (+2.3%).
The provision for income taxes for fiscal 2012 was $14.2 million on income before the provision for income taxes of $37.4 million. The difference between the effective tax rate of 38.1% and the U.S. statutory tax rate of 35.0% primarily relates to a deferred tax liability for the undistributed earnings of our Canadian subsidiary (+2.8%), foreign withholding taxes paid and accrued (+2.8%) and current periods state income taxes (+3.8%), partially offset by a reduction in the valuation allowance for foreign tax credits (-4.8%) and the differential in the U.S. and Canadian statutory rates (-1.1%).
35
Table of Contents
Liquidity and Capital Resources
Summary
We have historically financed our operations through cash flows generated from operations and borrowings by us and our subsidiaries under various credit facilities. Our principal uses of cash have been to fund working capital, including operating expenses, debt service and capital expenditures. In addition, we evaluate acquisitions of businesses or assets and repurchases of our equity and debt from time to time. Generally, our need to access the capital markets is limited to refinancing debt obligations and funding significant acquisitions. Market conditions may limit our sources of funds and the terms for these financing activities. As market conditions change, we continue to monitor our liquidity position.
Despite the challenging economic conditions in recent years, we continue to maintain what we believe to be a strong balance sheet and sufficient liquidity to provide us with financial flexibility. In addition to our normal operating activities during fiscal 2014, we invested approximately $26.5 million in capital expenditures and repurchased 529,312 shares of our common stock for approximately $20.0 million. Our goal, through prudent investments of capital, is to increase operational efficiency, reduce costs, minimize the decline in margins in the face of rising resin prices, grow our core business, and increase stockholder value.
As of October 31, 2014, we had a net debt position (current bank borrowings plus long term debt less cash and cash equivalents) of $255.5 million, compared with $228.9 million at the end of fiscal 2013. Availability under our credit facility and credit line available to our Canadian subsidiary for local currency borrowings was an aggregate of $111.8 million at October 31, 2014.
Our working capital amounted to $103.2 million at October 31, 2014 compared to $118.6 million at October 31, 2013. We used the LIFO method for determining the cost of approximately 84% of our total inventories at October 31, 2014. Under LIFO, the units remaining in ending inventory are valued at the oldest unit costs and the units sold in cost of sales are valued at the most recent unit costs. If the FIFO method for valuing inventory had been used exclusively, working capital would have been $147.9 million and $159.7 million at October 31, 2014 and October 31, 2013, respectively. During the twelve months ended October 31, 2014, the LIFO reserve increased $3.6 million to $44.7 million as a result of increased resin costs. Despite the possible negative effects on our results of operations and our financial position (an increase to cost of sales of $3.6 million in fiscal 2014 and a reduction of inventory of $44.7 million at October 31, 2014), we believe the use of LIFO maximizes our after tax cash flow from operations.
We believe that our expected cash flow from operations, assuming no material adverse change, combined with the availability of funds under our worldwide credit facilities, will be sufficient to meet our working capital and debt service requirements and planned capital expenditures for at least the next 12 months.
36
Table of Contents
Cash Flows
The following table summarizes our cash flows from operating, investing and financing of our operations for each of the past three fiscal years:
| For the Years Ended October 31, | ||||||||||||
| 2014 | 2013 | 2012 | ||||||||||
| (in thousands) | ||||||||||||
| Total cash provided by (used in) continuing operations: |
||||||||||||
| Operating activities |
$ | 23,649 | $ | 34,096 | $ | 72,044 | ||||||
| Investing activities |
(26,390 | ) | (46,176 | ) | (47,762 | ) | ||||||
| Financing activities |
(8,835 | ) | 23,139 | (27,909 | ) | |||||||
| Effect of exchange rate changes on cash |
(876 | ) | (547 | ) | (11 | ) | ||||||
|
|
|
|
|
|
|
|||||||
| (Decrease) increase in cash and cash equivalents |
$ | (12,452 | ) | $ | 10,512 | $ | (3,638 | ) | ||||
|
|
|
|
|
|
|
|||||||
Note: See consolidated statements of cash flows included in Item 8, “Financial Statements and Supplementary Data”, of this Annual Report on Form 10-K for additional information.
Operating Activities
Our cash and cash equivalents were $0.9 million at October 31, 2014, as compared to $13.3 million at October 31, 2013. Cash provided by operating activities during the fiscal year ended October 31, 2014 was $23.6 million, which includes a net loss of $5.5 million adjusted for non-cash items totaling $34.9 million primarily related to depreciation and amortization of $31.5 million, an increase in LIFO reserve of $3.6 million, provision for losses on accounts receivable, note receivable and inventory of $2.1 million and $1.1 million in share-based compensation, partially offset by a benefit for deferred taxes of $4.8 million. Cash provided by operating activities includes a $6.8 million decrease in inventories, excluding the non-cash effects of LIFO, primarily due to a reduction of quantities on hand, partially offset by higher resin costs. Cash used in operating activities includes a $9.4 million increase in accounts receivable reflecting higher sales in the fourth quarter of fiscal 2014 versus the fourth quarter of fiscal 2013 and a $3.9 million decrease in accrued expenses due primarily to a decrease in fiscal 2014 cash incentive payments to employees as compared to fiscal 2013 and lower share-based compensation costs associated with our stock options and performance units.
Investing Activities
Net cash used in investing activities during the fiscal year ended October 31, 2014 was $26.4 million, resulting primarily from capital expenditures during the period mainly in our food bag, retail canliner and custom product lines
Financing Activities
Net cash used in financing activities during the fiscal year ended October 31, 2014 was $8.8 million, resulting primarily from $20.0 million in repurchases of our common stock and $3.0 million in principal payments on capital lease obligations, partially offset by $14.9 million in borrowings under our credit facility.
Sources and Uses of Liquidity
Credit Facilities
We maintain a credit facility with Wells Fargo. The credit facility matures on February 21, 2017 and has a maximum borrowing amount of $150.0 million with a maximum for letters of credit of $20.0 million. The credit facility is secured by liens on most of our domestic assets (other than real property and equipment) and on 66% of our ownership interest in certain foreign subsidiaries.
37
Table of Contents
We utilize the credit facility to provide funding for operations and other corporate purposes through daily bank borrowings and/or cash repayments to ensure sufficient operating liquidity and efficient cash management. Availability at October 31, 2014 and October 31, 2013 under the credit facility was $107.4 million and $123.3 million, respectively.
In addition to the amounts available under the credit facility, we also maintain a credit facility at our Canadian subsidiary which is used to support operations and is serviced by local cash flows from operations. There were no borrowings outstanding under the Canadian credit facility at October 31, 2014 and October 31, 2013. Availability under the Canadian credit facility at October 31, 2014 and October 31, 2013 was $5.0 million Canadian dollars ($4.4 million and $4.8 million, respectively).
Please refer to Note 8 of the consolidated financial statements for further discussion of our debt.
Contractual Obligations and Off-Balance-Sheet Arrangements
Contractual Obligations and Commercial Commitments
Our contractual obligations and commercial commitments as of October 31, 2014 were as follows:
| For the Years Ended October 31, | ||||||||||||||||||||
| Borrowings(1) | Interest on Fixed Rate Borrowings(2) |
Capital Leases, Including Amounts Representing Interest |
Operating Leases |
Total Commitments |
||||||||||||||||
| (in thousands) | ||||||||||||||||||||
| 2015 |
$ | 214 | $ | 16,653 | $ | 2,812 | $ | 7,366 | $ | 27,045 | ||||||||||
| 2016 |
222 | 16,644 | 2,429 | 4,822 | 24,117 | |||||||||||||||
| 2017 |
40,742 | 16,634 | 2,429 | 3,375 | 63,180 | |||||||||||||||
| 2018 |
242 | 16,625 | 2,430 | 1,737 | 21,034 | |||||||||||||||
| 2019 |
200,252 | 8,502 | 2,261 | 847 | 211,862 | |||||||||||||||
| Thereafter |
2,905 | 274 | 533 | 516 | 4,228 | |||||||||||||||
|
|
|
|
|
|
|
|
|
|
|
|||||||||||
| Total |
$ | 244,577 | $ | 75,332 | $ | 12,894 | $ | 18,663 | $ | 351,466 | ||||||||||
|
|
|
|
|
|
|
|
|
|
|
|||||||||||
| (1) | Borrowings include $40.5 million under our credit facility maturing on February 21, 2017, $200.0 million aggregate principal amount of 2019 notes, a $3.1 million ten-year mortgage note due July 2022 related to the purchase of the Company’s corporate headquarters, and $1.0 million of a Pennsylvania Industrial loan. See Note 8 of the consolidated financial statements for further discussion of our debt. |
| (2) | In connection with the mortgage note on the Company’s corporate headquarters, we entered into a ten-year floating-to-fixed interest rate swap agreement with TD Bank, N.A. that fixes the interest rate at 3.52% per year and matures on July 25, 2022. |
In addition to the amounts reflected in the table above:
We expect to incur approximately $23 million of capital expenditures during fiscal 2015.
We expect to contribute $0.4 million during fiscal 2015 to fund the Canadian defined benefit plan and $0.1 million to fund the AEP Alabama Union Employees’ defined benefit plan. With regards to the U.S. 401(k) Savings Plan (“401(k) Plan”), we estimate contributing $3.1 million in cash in February 2015 to the 401(k) Plan effective for the 2014 year contributions.
We expect approximately 44,000 performance units to vest during fiscal 2015, provided that each employee continues to be employed by the Company on the respective anniversary dates. Settlement of
38
Table of Contents
the units is based on the Company’s stock price on the anniversary date and will be settled at the employees’ option in cash, Company stock, or a combination thereof. Historically, a significant majority of performance units have been settled in cash. Assuming all units are settled in cash, the amount of expected cash that will be used to settle the 44,000 performance units expected to vest during fiscal 2015 would be $2.4 million, based on a stock price of $54.21 per common share of the Company, the closing price on Nasdaq at January 8, 2015.
Off-Balance Sheet Arrangements
We do not engage in any off-balance sheet financing arrangements with unconsolidated entities or financial partnerships, such as entities often referred to as structured finance or special purpose entities, that have or are reasonably likely to have a current or future effect on our financial condition, changes in financial condition, revenues or expenses, results of operations, liquidity, capital expenditures or capital resources.
Effects of Inflation
Inflation is not expected to have a significant impact on our business.
Critical Accounting Policies and Estimates
Our discussion and analysis of our financial condition and results of operations are based upon our consolidated financial statements, which have been prepared in accordance with accounting principles generally accepted in the United States of America. The preparation of these consolidated financial statements requires management to make estimates and assumptions that affect the reported amounts of assets and liabilities, the disclosure of contingent assets and liabilities at the date of the consolidated financial statements and the reported amount of revenues and expenses during the reporting period. On an on-going basis, management evaluates its estimates and judgments, including those related to product returns, customer rebates and incentives, doubtful accounts, acquisitions, pension obligations, incurred but not reported medical and workers compensation claims, litigation and contingency accruals, income taxes, including valuation of deferred taxes, and impairment of long-lived assets and intangibles, including goodwill. Management bases its estimates and judgments on historical experience and various other factors that are believed to be reasonable under the circumstances, the results of which form the basis for making judgments about the carrying values of assets and liabilities that are not readily apparent from other sources. Actual results may differ from these estimates under different assumptions or conditions.
Revenue Recognition. We recognize revenue when products are shipped and the customer takes ownership and assumes risk of loss, which generally occurs on the date of shipment, collection of the relevant receivable is probable, persuasive evidence of an arrangement exists and the sales price is fixed and determinable. Concurrently, we record reductions to revenue for customer rebate programs, returns, promotions or other incentive programs that are estimated using historical experience and current economic trends. Material differences may result in the amount and timing of net sales for any period if management makes different judgments or uses different estimates.
Accrued Customer Rebates. We offer various rebate programs to our customers that are individually negotiated and contain a variety of different terms and conditions. Certain rebates are calculated as flat percentages of purchases, while others include tiered volume incentives. Rebates may be paid monthly, quarterly, or annually. The calculation of the accrued rebate balance involves management estimates, especially where the terms of the rebate involve tiered volume levels that require estimates of expected annual sales. These provisions are based on estimates derived from current program requirements and historical experience.
39
Table of Contents
Allowance for Doubtful Accounts. Management determines the allowance for doubtful accounts based on historical write-off experience and an evaluation of the likelihood of success in collecting specific customer receivables. We review our allowance for doubtful accounts monthly. Past due balances over 90 days and over a specified amount are reviewed individually for collectability. Account balances are charged off against the allowance after all means of collection have been exhausted and potential for recovery is considered remote. In addition, we maintain allowances for customer returns, discounts and invoice pricing discrepancies, primarily based on historical experience. Actual results could differ from these estimates under different assumptions and may be affected by changes in general economic conditions.
Litigation Reserves. Management’s current estimated ranges of liabilities related to pending litigation are based on input from legal counsel and our best estimate of potential loss. Final resolution of the litigation contingencies could result in amounts different from current accruals and, therefore, have an impact on our consolidated financial results in a future reporting period. At October 31, 2014, we were involved in routine litigation in the normal course of our business and based on facts currently available we believe such matters, net of insurance recoveries, will not have a material adverse impact on our results of operations, financial position or liquidity.
Pension Benefit Obligations. We sponsor a defined benefit plan in our Canada operation and in our Alabama operation. Our pension expense and obligations are developed from actuarial valuations. Two critical assumptions in determining pension expense and obligations are discount rate and expected long-term return on plan assets. We evaluate these assumptions annually. Other assumptions reflect demographic factors such as retirements, mortality and turnover and are evaluated periodically and updated to reflect our actual experience. Actual results may differ from actuarial assumptions. The discount rate represents the market rate for high-quality AA-rated corporate bonds with durations corresponding to the expected durations of the benefit obligations and is used to calculate the present value of the expected future cash flows for benefit obligations under our pension plans. A decrease in the discount rate increases the present value of pension benefit obligations. A one percent decrease in the discount rate would increase our present value of pension obligations by approximately $1.6 million at October 31, 2014. We consider the current and expected asset allocations of our pension plans, as well as historical and expected long-term rates of return on those types of plan assets, in determining the expected long-term return on plan assets. A one percent decrease in the expected long-term return on plan assets would increase our pension expense by approximately $0.1 million for fiscal 2014.
Self Insurance. We are self-insured for medical insurance benefits provided to our U.S. employees and, effective November 1, 2012, for our workers’ compensation claims. We have obtained stop-loss insurance to limit total medical claims in any one year to $200,000 per covered individual and $250,000 stop loss per workers’ compensation claim with an aggregate workers’ compensation stop loss of $3.7 million. We record a liability for known claims and an estimate for incurred but not reported (“IBNR”) claims. IBNR claims are estimated by third-party actuaries using historical lag information and other data provided by claims administrators, as well as loss development factors. While management uses what we believe are pertinent factors in estimating the liability, it is subject to change due to claim experience, type of claims, and rising medical costs.
Income Taxes. Management accounts for income taxes using an asset and liability approach. Such approach results in the recognition of deferred tax assets and liabilities for the expected future tax consequences of temporary differences between the book carrying amounts and the tax basis of assets and liabilities. As part of the process of preparing our consolidated financial statements, management is required to estimate income taxes in each of the jurisdictions in which we operate. This process involves estimating actual current tax expense together with assessing temporary differences resulting from differing treatment of items for tax and accounting purposes. These differences result in deferred tax assets and liabilities, which are included in our consolidated balance sheets.
40
Table of Contents
The realizability of our deferred tax assets is primarily dependent on the future taxable income of the entity which is related to the deferred tax assets. Management assesses the likelihood that such deferred tax assets will be recovered from future taxable income and to the extent management believes that recovery is not likely, a valuation allowance must be established. Should the future taxable income of such entities be materially different from management’s estimates, an additional valuation allowance may be necessary in future periods. Such amounts, if necessary, could be material to our results of operations and financial position.
Impairment. We review our long-lived assets, such as property, plant and equipment and intangible assets, such as trade names and customer relationships, associated with recent acquisitions, for impairment whenever events or changes in circumstances indicate that the carrying amount of these assets may not be recoverable. Factors we consider important that could trigger an impairment review include:
| • | Significant underperformance relative to expected historical or projected future operating results; |
| • | Significant change in the manner of or use of the acquired assets or the strategy of our overall business; |
| • | Significant negative industry or economic trends; |
| • | Significant decline in our stock price for a sustained period; and |
| • | Our market capitalization relative to net book value. |
Recoverability is measured by a comparison of the carrying amount of an asset to future undiscounted cash flows expected to be generated by the asset. If the assets were considered to be impaired, the impairment to be recognized would be measured by the amount by which the carrying value of the assets exceeds their fair value. Fair value is determined based on discounted cash flows, recent buy offers or appraised values, depending on the nature of the asset. Assets to be disposed of are valued at the lower of the carrying amount or their fair value less disposal costs. Actual realizable values or payments to be made may differ from such estimates, and such differences will be recognized as incurred or as better information is received. Our estimate as to fair value is regularly reviewed and subject to change as new information is made available.
Also, we perform an annual assessment as to whether or not goodwill is impaired. We performed our annual impairment analysis on September 30 based on a comparison of our market capitalization to our book value at that date. On September 30, 2014, 2013 and 2012, we concluded that there was no impairment because our market capitalization was above book value. On October 31, 2014, our market capitalization was above book value. Our policy is that impairment of goodwill will have occurred if our market capitalization was to remain below book value for a reasonable period of time. If we determine that an impairment has occurred, we would perform a second test to determine the amount of impairment loss. In the second test, the fair value of our company is estimated using comparable industry multiples of cash flows as part of an effort to measure the value of implied goodwill. We also review our financial position quarterly for other triggering events.
Acquisitions. We use the acquisition method of accounting for all business combinations (whether full, partial or step acquisition). In applying the acquisition method, the acquirer must determine and recognize the fair value of the acquired assets and liabilities assumed. Any excess of fair value of acquired net assets over the acquisition consideration results in a gain on bargain purchase and must be recognized in earnings on the acquisition date. Any excess of the acquisition consideration over the fair value of acquired net assets is recognized as goodwill. Any adjustments to the fair values assigned to the assets acquired and the liabilities assumed during the measurement period, which may be up to one
41
Table of Contents
year from the acquisition date, has a corresponding offset to the gain on bargain purchase or goodwill. The acquisition costs will be expensed as incurred and restructuring costs will be expensed in periods after the acquisition date.
New Accounting Pronouncements
Please refer to Note 2 of the consolidated financial statements for discussion on recently issued accounting pronouncements.
| ITEM 7A. | QUANTITATIVE AND QUALITATIVE DISCLOSURES ABOUT MARKET RISK |
We are exposed to market risk from changes in interest rates and foreign currency exchange rates, which may adversely affect our results of operations and financial condition. We seek to minimize these risks through operating and financing activities and, when deemed appropriate, through the use of derivative financial instruments. We do not purchase, hold or sell derivative financial instruments for trading purposes.
Interest Rates
The fair value of our fixed interest rate debt varies with changes in interest rates. Generally, the fair value of fixed rate debt will increase as interest rates fall and decrease as interest rates rise. At October 31, 2014, the carrying value of our total debt was $256.3 million of which $215.8 million was fixed rate debt (2019 notes, mortgage note, capital leases and the Pennsylvania industrial loan). As of October 31, 2014, the estimated fair value of our 2019 notes, which had a carrying value of $200.0 million, was $205.8 million. As of October 31, 2014, the carrying value of our mortgage note, capital leases and the Pennsylvania industrial loan was $15.8 million which approximates fair value because the interest rates on these debt instruments approximate market yields for similar debt instruments.
Floating rate debt at October 31, 2014 and October 31, 2013 totaled $40.5 million and $25.6 million, respectively. Based on the average floating rate debt outstanding during fiscal 2014 (our credit facility), a one-percent increase or decrease in the average interest rate during the period would have resulted in a change to interest expense of $0.5 million for the fiscal year ended October 31, 2014.
Foreign Exchange
We enter into derivative financial instruments (principally foreign exchange forward contracts) primarily to hedge intercompany transactions, trade sales and forecasted purchases. Foreign currency forward contracts reduce our exposure to the risk that the eventual cash inflows and outflows, resulting from these intercompany and third-party trade transactions denominated in a currency other than the functional currency, will be adversely affected by changes in exchange rates.
We do not use foreign currency forward contracts for speculative or trading purposes. We enter into foreign exchange forward contracts with financial institutions and have not experienced nonperformance by counterparties. We anticipate performance by all counterparties to such agreements.
Commodities
We use commodity raw materials, primarily resin, and energy products in conjunction with our manufacturing process. Generally, we acquire such components at market prices and do not use financial instruments to hedge commodity prices. As a result, we are exposed to market risks related to changes in commodity prices in connection with these components.
42
Table of Contents
We are exposed to market risk from changes in resin prices that could impact our results of operations and financial condition. Our resin purchasing strategy is to deal with only high-quality, dependable suppliers. We believe that we have maintained strong relationships with these key suppliers and expect that such relationships will continue into the foreseeable future. The resin market is a global market and, based on our experience, we believe that adequate quantities of plastic resins will be available to us at market prices, but we can give no assurances as to such availability or the prices thereof. See “Management’s Discussion and Analysis of Financial Condition and Results of Operations—Overview—Market Conditions” for further discussion of market risks related to resin prices.
43
Table of Contents
| ITEM 8. | FINANCIAL STATEMENTS AND SUPPLEMENTARY DATA |
The following financial statements and accompanying schedule and related report of our independent registered public accounting firm are set forth in a separate section of this Form 10-K beginning on page 49 and are hereby incorporated by reference.
| 49 | ||||
| Financial Statements: |
||||
| 51 | ||||
| Consolidated Statements of Operations for the years ended October 31, 2014, 2013 and 2012 |
52 | |||
| 53 | ||||
| Consolidated Statements of Shareholders’ Equity for the years ended October 31, 2014, 2013 and 2012 |
54 | |||
| Consolidated Statements of Cash Flows for the years ended October 31, 2014, 2013 and 2012 |
55 | |||
| 56 | ||||
| Financial Statement Schedule: |
||||
| 94 |
44
Table of Contents
| ITEM 9. | CHANGES IN AND DISAGREEMENTS WITH ACCOUNTANTS ON ACCOUNTING AND FINANCIAL DISCLOSURE |
Not applicable.
| ITEM 9A. | CONTROLS AND PROCEDURES |
Evaluation of Disclosure Controls and Procedures
We maintain disclosure controls and procedures that are designed to ensure that information required to be disclosed in our Exchange Act reports is recorded, processed, summarized and reported within the time periods specified in the SEC rules and forms and that such information is accumulated and communicated to our management, including our Chief Executive Officer and Chief Financial Officer (together, the “Certifying Officers”), as appropriate, to allow for timely decisions regarding required disclosure.
In designing and evaluating disclosure controls and procedures, management recognizes that any controls and procedures, no matter how well designed and operated, can provide only reasonable, not absolute, assurance of achieving the desired objectives. Also, the design of a control system must reflect the fact that there are resource constraints and the benefits of controls must be considered relative to their costs. Because of the inherent limitations in all control systems, no evaluation of controls can provide absolute assurance that misstatements due to error or fraud will not occur or that all control issues and instances of fraud, if any, have been detected. These inherent limitations include the realities that judgments in decision-making can be faulty and that breakdowns can occur because of simple error or mistake. The design of any system of controls is based, in part, upon certain assumptions about the likelihood of future events and there can be no assurance that any design will succeed in achieving its stated goals under all potential future conditions.
As of October 31, 2014, the end of the period covered by this report, we carried out an evaluation, under the supervision and with the participation of management, including the Certifying Officers, of the effectiveness of the design and operation of our disclosure controls and procedures as defined in Rules 13a-15(e) and 15d-15(e) of the Exchange Act. Our disclosure controls and procedures are designed to provide reasonable assurance of achieving their stated objectives and our Certifying Officers concluded that our disclosure controls and procedures were effective at a reasonable assurance level as of October 31, 2014.
Management Report on Internal Control Over Financial Reporting
Our management is responsible for establishing and maintaining adequate internal control over financial reporting to provide reasonable assurance regarding the reliability of our financial reporting and the preparation of financial statements for external purposes in accordance with U.S. generally accepted accounting principles. Internal control over financial reporting includes those policies and procedures that: (i) pertain to the maintenance of records that, in reasonable detail, accurately and fairly reflect the transactions and dispositions of our assets; (ii) provide reasonable assurance that transactions are recorded as necessary to permit preparation of financial statements in accordance with U.S. generally accepted accounting principles, and that our receipts and expenditures are being made only in accordance with authorizations of our management and Board; and (iii) provide reasonable assurance regarding prevention or timely detection of unauthorized acquisition, use or disposition of our assets that could have a material effect on the financial statements.
Our management, including our Certifying Officers, recognizes that our internal control over financial reporting cannot prevent or detect all error and all fraud. A control system, no matter how well designed and operated, can provide only reasonable, not absolute, assurance that the control system’s objectives will be met. The design of a control system must reflect the fact that there are resource
45
Table of Contents
constraints, and the benefits of controls must be considered relative to their costs. Further, because of the inherent limitations in all control systems, no evaluation of controls can provide absolute assurance that misstatements due to error or fraud will not occur or that all control issues and instances of fraud, if any, have been detected. The design of any system of controls is based in part on certain assumptions about the likelihood of future events, and there can be no assurance that any design will succeed in achieving its stated goals under all potential future conditions.
Management, with the participation of the Certifying Officers, assessed our internal control over financial reporting as of October 31, 2014, the end of our fiscal year. Management based its assessment on criteria established in Internal Control—Integrated Framework (1992) issued by the Committee of Sponsoring Organizations of the Treadway Commission. Based on this assessment, management has concluded that our internal control over financial reporting was effective as of October 31, 2014.
Our independent registered public accounting firm, KPMG LLP, independently assessed the effectiveness of our internal control over financial reporting as stated in their report included herein.
Changes in Internal Control over Financial Reporting
There was no change in our internal control over financial reporting that occurred during our most recently completed fiscal quarter that has materially affected, or is reasonably likely to materially affect, our internal control over financial reporting.
| ITEM 9B. | OTHER INFORMATION |
None
46
Table of Contents
| ITEM 10. | DIRECTORS, EXECUTIVE OFFICERS AND CORPORATE GOVERNANCE |
The information required by this item is set forth under the following captions in our proxy statement to be filed with respect to the 2015 annual meeting of stockholders (the “Proxy Statement”), all of which is incorporated herein by reference: “Proposal No. 1—Election of Directors,” “Board Matters—The Board of Directors,” “Board Matters—Committees of the Board,” “Board Matters—Corporate Governance,” “Certain Relationships and Related Person Transactions,” “Additional Information—Section 16(a) Beneficial Ownership Reporting Compliance,” and “Additional Information—Requirements for Submission of Stockholder Proposals and Nominations for 2016 Annual Meeting.”
| ITEM 11. | EXECUTIVE COMPENSATION |
The information required by this item is set forth under the following captions in our Proxy Statement, all of which is incorporated herein by reference: “Compensation Discussion and Analysis,” “Named Executive Officer Compensation Tables,” “Board Matters—Director Compensation,” “Compensation Committee Interlocks and Insider Participation,” and “Compensation Committee Report.”
| ITEM 12. | SECURITY OWNERSHIP OF CERTAIN BENEFICIAL OWNERS AND MANAGEMENT AND RELATED STOCKHOLDER MATTERS |
The information required by this item is set forth under the following captions in our Proxy Statement, all of which is incorporated herein by reference: “Additional Information—Equity Compensation Plans” and “Security Ownership of Certain Beneficial Owners and Management.”
| ITEM 13. | CERTAIN RELATIONSHIPS AND RELATED TRANSACTIONS, AND DIRECTOR INDEPENDENCE |
The information required by this item is set forth under the following captions in our Proxy Statement, all of which is incorporated herein by reference: “Certain Relationships and Related Person Transactions” and “Proposal No. 1—Election of Directors—Director Independence.”
| ITEM 14. | PRINCIPAL ACCOUNTING FEES AND SERVICES |
The information required by this item is set forth under the following captions in our Proxy Statement, which is incorporated herein by reference: “Audit Committee Matters.”
47
Table of Contents
| ITEM 15. | EXHIBITS AND FINANCIAL STATEMENT SCHEDULES |
| (a) | 1. | Financial Statements: | ||
| The financial statements of the Company filed in this Annual Report on Form 10-K are listed in Part II, Item 8. | ||||
| 2. | Financial Statement Schedule: | |||
| The financial statement schedule of the Company filed in this Annual Report on Form 10-K is listed in Part II, Item 8. | ||||
| 3. | Exhibits: | |||
| The exhibits required to be filed as part of this Annual Report on Form 10-K are listed in the attached Index to Exhibits. | ||||
48
Table of Contents
REPORT OF INDEPENDENT REGISTERED PUBLIC ACCOUNTING FIRM
The Board of Directors and Shareholders
AEP Industries Inc.:
We have audited the accompanying consolidated balance sheets of AEP Industries Inc. and subsidiaries as of October 31, 2014 and 2013, and the related consolidated statements of operations, comprehensive (loss) income, shareholders’ equity and cash flows for each of the years in the three-year period ended October 31, 2014. In connection with our audits of the consolidated financial statements, we also have audited financial statement schedule II. We also have audited AEP Industries Inc.’s internal control over financial reporting as of October 31, 2014, based on criteria established in Internal Control—Integrated Framework (1992) issued by the Committee of Sponsoring Organizations of the Treadway Commission (COSO). AEP Industries Inc.’s management is responsible for these consolidated financial statements and financial statement schedule, for maintaining effective internal control over financial reporting, and for its assessment of the effectiveness of internal control over financial reporting, included in the accompanying Management Report on Internal Control Over Financial Reporting. Our responsibility is to express an opinion on these consolidated financial statements and financial statement schedule, and an opinion on the Company’s internal control over financial reporting based on our audits.
We conducted our audits in accordance with the standards of the Public Company Accounting Oversight Board (United States). Those standards require that we plan and perform the audits to obtain reasonable assurance about whether the financial statements are free of material misstatement and whether effective internal control over financial reporting was maintained in all material respects. Our audits of the consolidated financial statements included examining, on a test basis, evidence supporting the amounts and disclosures in the financial statements, assessing the accounting principles used and significant estimates made by management, and evaluating the overall financial statement presentation. Our audit of internal control over financial reporting included obtaining an understanding of internal control over financial reporting, assessing the risk that a material weakness exists, and testing and evaluating the design and operating effectiveness of internal control based on the assessed risk. Our audits also included performing such other procedures as we considered necessary in the circumstances. We believe that our audits provide a reasonable basis for our opinions.
A company’s internal control over financial reporting is a process designed to provide reasonable assurance regarding the reliability of financial reporting and the preparation of financial statements for external purposes in accordance with generally accepted accounting principles. A company’s internal control over financial reporting includes those policies and procedures that (1) pertain to the maintenance of records that, in reasonable detail, accurately and fairly reflect the transactions and dispositions of the assets of the company; (2) provide reasonable assurance that transactions are recorded as necessary to permit preparation of financial statements in accordance with generally accepted accounting principles, and that receipts and expenditures of the company are being made only in accordance with authorizations of management and directors of the company; and (3) provide reasonable assurance regarding prevention or timely detection of unauthorized acquisition, use, or disposition of the company’s assets that could have a material effect on the financial statements.
Because of its inherent limitations, internal control over financial reporting may not prevent or detect misstatements. Also, projections of any evaluation of effectiveness to future periods are subject to the risk that controls may become inadequate because of changes in conditions, or that the degree of compliance with the policies or procedures may deteriorate.
In our opinion, the consolidated financial statements referred to above present fairly, in all material respects, the financial position of AEP Industries Inc. and subsidiaries as of October 31, 2014 and 2013, and the results of their operations and their cash flows for each of the years in the three-year period
49
Table of Contents
ended October 31, 2014, in conformity with U.S. generally accepted accounting principles. Also in our opinion, the related financial statement schedule II, when considered in relation to the basic consolidated financial statements taken as a whole, presents fairly, in all material respects, the information set forth therein. Also in our opinion, AEP Industries Inc. maintained, in all material respects, effective internal control over financial reporting as of October 31, 2014, based on criteria established in Internal Control—Integrated Framework (1992) issued by the Committee of Sponsoring Organizations of the Treadway Commission.
| /s/ KPMG LLP |
| Short Hills, New Jersey |
| January 14, 2015 |
50
Table of Contents
AEP INDUSTRIES INC.
AS OF OCTOBER 31, 2014 AND 2013
(in thousands, except share amounts)
| October 31, 2014 |
October 31, 2013 |
|||||||
| ASSETS | ||||||||
| CURRENT ASSETS: |
||||||||
| Cash and cash equivalents |
$ | 867 | $ | 13,319 | ||||
| Accounts receivable, less allowance for doubtful accounts of $2,831 and $2,992 in 2014 and 2013, respectively |
119,355 | 112,605 | ||||||
| Inventories, net |
86,420 | 97,091 | ||||||
| Deferred income taxes |
2,697 | 6,300 | ||||||
| Other current assets |
6,867 | 5,389 | ||||||
|
|
|
|
|
|||||
| Total current assets |
216,206 | 234,704 | ||||||
|
|
|
|
|
|||||
| PROPERTY, PLANT AND EQUIPMENT, at cost, less accumulated depreciation and amortization |
216,509 | 220,314 | ||||||
| GOODWILL |
6,871 | 6,871 | ||||||
| INTANGIBLE ASSETS, net of accumulated amortization of $2,412 and $1,894 in 2014 and 2013, respectively |
4,000 | 4,518 | ||||||
| OTHER ASSETS |
3,360 | 5,156 | ||||||
|
|
|
|
|
|||||
| Total assets |
$ | 446,946 | $ | 471,563 | ||||
|
|
|
|
|
|||||
| LIABILITIES AND SHAREHOLDERS’ EQUITY | ||||||||
| CURRENT LIABILITIES: |
||||||||
| Bank borrowings, including current portion of long-term debt |
$ | 2,636 | $ | 3,335 | ||||
| Accounts payable |
81,890 | 80,579 | ||||||
| Accrued expenses |
28,484 | 32,144 | ||||||
|
|
|
|
|
|||||
| Total current liabilities |
113,010 | 116,058 | ||||||
| LONG-TERM DEBT |
253,695 | 238,931 | ||||||
| DEFERRED INCOME TAXES |
16,322 | 25,610 | ||||||
| OTHER LONG-TERM LIABILITIES |
4,222 | 5,551 | ||||||
|
|
|
|
|
|||||
| Total liabilities |
387,249 | 386,150 | ||||||
|
|
|
|
|
|||||
| COMMITMENTS AND CONTINGENCIES |
||||||||
| SHAREHOLDERS’ EQUITY: |
||||||||
| Preferred stock, $1.00 par value; 970,000 shares authorized; none issued |
— | — | ||||||
| Series A junior participating preferred stock, $1.00 par value; 30,000 shares authorized; none issued |
— | — | ||||||
| Common stock, $0.01 par value; 30,000,000 shares authorized; 11,215,691 and 11,207,049 shares issued in 2014 and 2013, respectively |
112 | 112 | ||||||
| Additional paid-in capital |
112,978 | 112,527 | ||||||
| Treasury stock at cost, 6,135,095 and 5,605,783 shares in 2014 and 2013 |
(189,810 | ) | (169,826 | ) | ||||
| Retained earnings |
136,558 | 142,064 | ||||||
| Accumulated other comprehensive (loss) income |
(141 | ) | 536 | |||||
|
|
|
|
|
|||||
| Total shareholders’ equity |
59,697 | 85,413 | ||||||
|
|
|
|
|
|||||
| Total liabilities and shareholders’ equity |
$ | 446,946 | $ | 471,563 | ||||
|
|
|
|
|
|||||
The accompanying notes to consolidated financial statements are an integral part of these statements.
51
Table of Contents
AEP INDUSTRIES INC.
CONSOLIDATED STATEMENTS OF OPERATIONS
FOR THE YEARS ENDED OCTOBER 31, 2014, 2013 AND 2012
(in thousands, except per share data)
| 2014 | 2013 | 2012 | ||||||||||
| NET SALES |
$ | 1,192,990 | $ | 1,143,852 | $ | 1,152,535 | ||||||
| COST OF SALES |
1,071,085 | 989,380 | 969,792 | |||||||||
|
|
|
|
|
|
|
|||||||
| Gross profit |
121,905 | 154,472 | 182,743 | |||||||||
| OPERATING EXPENSES: |
||||||||||||
| Delivery |
51,589 | 53,546 | 52,989 | |||||||||
| Selling |
36,550 | 38,825 | 41,404 | |||||||||
| General and administrative |
25,772 | 28,770 | 32,424 | |||||||||
|
|
|
|
|
|
|
|||||||
| Total operating expenses |
113,911 | 121,141 | 126,817 | |||||||||
| OTHER OPERATING INCOME (EXPENSE): |
||||||||||||
| Business interruption insurance recovery |
2,050 | — | — | |||||||||
| Loss on sales of property, plant and equipment, net |
(183 | ) | (15 | ) | (278 | ) | ||||||
|
|
|
|
|
|
|
|||||||
| Operating income |
9,861 | 33,316 | 55,648 | |||||||||
| OTHER INCOME (EXPENSE): |
||||||||||||
| Interest expense |
(19,571 | ) | (18,713 | ) | (19,077 | ) | ||||||
| Gain on bargain purchase of a business |
— | 1,001 | 17 | |||||||||
| Other, net |
270 | 359 | 812 | |||||||||
|
|
|
|
|
|
|
|||||||
| (Loss) income before benefit (provision) for income taxes |
(9,440 | ) | 15,963 | 37,400 | ||||||||
| BENEFIT (PROVISION) FOR INCOME TAXES |
3,934 | (5,215 | ) | (14,248 | ) | |||||||
|
|
|
|
|
|
|
|||||||
| Net (loss) income |
$ | (5,506 | ) | $ | 10,748 | $ | 23,152 | |||||
|
|
|
|
|
|
|
|||||||
| BASIC (LOSS) EARNINGS PER COMMON SHARE: |
||||||||||||
| Net (loss) income per common share |
$ | (1.03 | ) | $ | 1.93 | $ | 4.20 | |||||
|
|
|
|
|
|
|
|||||||
| DILUTED (LOSS) EARNINGS PER COMMON SHARE: |
||||||||||||
| Net (loss) income per common share |
$ | (1.03 | ) | $ | 1.92 | $ | 4.16 | |||||
|
|
|
|
|
|
|
|||||||
The accompanying notes to consolidated financial statements are an integral part of these statements.
52
Table of Contents
AEP INDUSTRIES INC.
CONSOLIDATED STATEMENTS OF COMPREHENSIVE (LOSS) INCOME
FOR THE YEARS ENDED OCTOBER 31, 2014, 2013 AND 2012
(in thousands)
| 2014 | 2013 | 2012 | ||||||||||
| Net (loss) income |
$ | (5,506 | ) | $ | 10,748 | $ | 23,152 | |||||
| Other comprehensive income (loss), net of tax: |
||||||||||||
| Foreign currency translation adjustments |
(738 | ) | (831 | ) | 14 | |||||||
| Translation adjustment reversal into income related to AEP New Zealand |
— | — | (692 | ) | ||||||||
| Defined benefit pension plans: |
||||||||||||
| Net actuarial (losses) gains arising during the period, (net of benefit (provision) for taxes of $63, ($273) and $377 during fiscal 2014, 2013 and 2012, respectively) |
(69 | ) | 608 | (896 | ) | |||||||
| Amortization of prior service cost and net actuarial loss included in net periodic pension cost, (net of provision for taxes of $45, $62 and $45 during fiscal 2014, 2013 and 2012, respectively) |
130 | 180 | 135 | |||||||||
|
|
|
|
|
|
|
|||||||
| Net change in accumulated other comprehensive income (loss) – pension plans (net of benefit (provision) for taxes of $18, ($335) and $332 during fiscal 2014, 2013 and 2012 respectively) |
61 | 788 | (761 | ) | ||||||||
|
|
|
|
|
|
|
|||||||
| Total other comprehensive loss |
(677 | ) | (43 | ) | (1,439 | ) | ||||||
|
|
|
|
|
|
|
|||||||
| Comprehensive (loss) income |
$ | (6,183 | ) | $ | 10,705 | $ | 21,713 | |||||
|
|
|
|
|
|
|
|||||||
The accompanying notes to consolidated financial statements are an integral part of these statements.
53
Table of Contents
AEP INDUSTRIES INC.
CONSOLIDATED STATEMENTS OF SHAREHOLDERS’ EQUITY
FOR THE YEARS ENDED OCTOBER 31, 2014, 2013 AND 2012
(in thousands)
| Common Stock | Treasury Stock | Additional Paid-in- Capital |
Accumulated Other Comprehensive Income (loss) |
Retained Earnings |
||||||||||||||||||||||||
| Shares | Amount | Shares | Amount | |||||||||||||||||||||||||
| BALANCES AT OCTOBER 31, 2011 | 11,096 | $ | 111 | 5,606 | $ | (169,826 | ) | $ | 109,519 | $ | 2,018 | $ | 108,164 | |||||||||||||||
| Issuance of common stock upon exercise of stock options |
39 | 465 | ||||||||||||||||||||||||||
| Issuance of common stock upon settlement of performance units |
2 | 45 | ||||||||||||||||||||||||||
| Share-based compensation |
218 | |||||||||||||||||||||||||||
| Excess tax benefit from stock option exercises |
1,302 | |||||||||||||||||||||||||||
| Net income |
23,152 | |||||||||||||||||||||||||||
| Translation adjustments |
14 | |||||||||||||||||||||||||||
| Change in actuarial losses, net of tax |
(896 | ) | ||||||||||||||||||||||||||
| Amortization of prior service cost and actuarial losses, net of tax |
135 | |||||||||||||||||||||||||||
| Translation adjustment reversal into income related to AEP New Zealand |
(692 | ) | ||||||||||||||||||||||||||
|
|
|
|
|
|
|
|
|
|
|
|
|
|
|
|||||||||||||||
| BALANCES AT OCTOBER 31, 2012 | 11,137 | $ | 111 | 5,606 | $ | (169,826 | ) | $ | 111,549 | $ | 579 | $ | 131,316 | |||||||||||||||
| Issuance of common stock upon exercise of stock options |
64 | 1 | 571 | |||||||||||||||||||||||||
| Issuance of common stock upon settlement of performance units |
1 | 46 | ||||||||||||||||||||||||||
| Issuance of restricted stock |
5 | 330 | ||||||||||||||||||||||||||
| Unearned compensation on restricted stock |
(138 | ) | ||||||||||||||||||||||||||
| Share-based compensation |
169 | |||||||||||||||||||||||||||
| Net income |
10,748 | |||||||||||||||||||||||||||
| Translation adjustments |
(831 | ) | ||||||||||||||||||||||||||
| Actuarial gains arising during the period, net of tax |
608 | |||||||||||||||||||||||||||
| Amortization of prior service cost and actuarial losses, net of tax |
180 | |||||||||||||||||||||||||||
|
|
|
|
|
|
|
|
|
|
|
|
|
|
|
|||||||||||||||
| BALANCES AT OCTOBER 31, 2013 | 11,207 | $ | 112 | 5,606 | $ | (169,826 | ) | $ | 112,527 | $ | 536 | $ | 142,064 | |||||||||||||||
| Issuance of common stock upon settlement of performance units |
1 | 57 | ||||||||||||||||||||||||||
| Issuance of restricted stock |
8 | 275 | ||||||||||||||||||||||||||
| Unearned compensation on restricted stock |
23 | |||||||||||||||||||||||||||
| Share-based compensation |
96 | |||||||||||||||||||||||||||
| Repurchases of common stock |
529 | (19,984 | ) | |||||||||||||||||||||||||
| Net loss |
(5,506 | ) | ||||||||||||||||||||||||||
| Translation adjustments |
(738 | ) | ||||||||||||||||||||||||||
| Actuarial losses arising during the period, net of tax |
(69 | ) | ||||||||||||||||||||||||||
| Amortization of prior service cost and actuarial losses, net of tax |
130 | |||||||||||||||||||||||||||
|
|
|
|
|
|
|
|
|
|
|
|
|
|
|
|||||||||||||||
| BALANCES AT OCTOBER 31, 2014 | 11,216 | $ | 112 | 6,135 | $ | (189,810 | ) | $ | 112,978 | $ | (141 | ) | $ | 136,558 | ||||||||||||||
|
|
|
|
|
|
|
|
|
|
|
|
|
|
|
|||||||||||||||
The accompanying notes to consolidated financial statements are an integral part of these statements.
54
Table of Contents
AEP INDUSTRIES INC.
CONSOLIDATED STATEMENTS OF CASH FLOWS
FOR THE YEARS ENDED OCTOBER 31, 2014, 2013 AND 2012
(in thousands)
| 2014 | 2013 | 2012 | ||||||||||
| CASH FLOWS FROM OPERATING ACTIVITIES: |
||||||||||||
| Net (loss) income |
$ | (5,506 | ) | $ | 10,748 | $ | 23,152 | |||||
| Adjustments to reconcile net income to net cash provided by operating activities: |
||||||||||||
| Depreciation and amortization |
31,507 | 28,592 | 22,828 | |||||||||
| Gain on bargain purchase of a business |
— | (1,001 | ) | (17 | ) | |||||||
| Change in LIFO reserve |
3,647 | 9,910 | (1,181 | ) | ||||||||
| Amortization of debt fees |
953 | 953 | 985 | |||||||||
| Translation adjustment reversal related to AEP New Zealand |
— | — | (692 | ) | ||||||||
| Provision for losses on accounts receivable, notes receivable and inventories |
2,123 | 272 | 283 | |||||||||
| (Benefit) provision for deferred income taxes |
(4,788 | ) | 2,943 | 11,043 | ||||||||
| Share-based compensation expense |
1,073 | 4,060 | 6,893 | |||||||||
| Excess tax benefit from stock option exercises |
— | — | (1,302 | ) | ||||||||
| Other |
430 | 75 | 346 | |||||||||
| Changes in operating assets and liabilities: |
||||||||||||
| Increase in accounts receivable |
(9,436 | ) | (3,283 | ) | (1,078 | ) | ||||||
| Decrease (increase) in inventories |
6,783 | (11,987 | ) | 9,084 | ||||||||
| (Increase) decrease in other current assets |
(976 | ) | (2,395 | ) | 582 | |||||||
| Decrease (increase) in other assets |
330 | (58 | ) | 83 | ||||||||
| Increase in accounts payable |
1,524 | 2,062 | 1,875 | |||||||||
| Decrease in accrued expenses |
(3,867 | ) | (6,552 | ) | (497 | ) | ||||||
| Decrease in other long-term liabilities |
(148 | ) | (243 | ) | (343 | ) | ||||||
|
|
|
|
|
|
|
|||||||
| Net cash provided by operating activities |
23,649 | 34,096 | 72,044 | |||||||||
| CASH FLOWS FROM INVESTING ACTIVITIES: |
||||||||||||
| Capital expenditures |
(26,543 | ) | (46,680 | ) | (42,000 | ) | ||||||
| Deposit made for Transco acquisition |
— | — | (5,300 | ) | ||||||||
| Acquisition of Webster |
— | — | (749 | ) | ||||||||
| Net proceeds from dispositions of property, plant and equipment |
153 | 504 | 287 | |||||||||
|
|
|
|
|
|
|
|||||||
| Net cash used in investing activities |
(26,390 | ) | (46,176 | ) | (47,762 | ) | ||||||
| CASH FLOWS FROM FINANCING ACTIVITIES: |
||||||||||||
| Net borrowings (repayments) of credit facility |
14,910 | 22,800 | (29,846 | ) | ||||||||
| Repurchases of common stock |
(19,984 | ) | — | — | ||||||||
| Proceeds from capital lease obligations |
658 | 4,134 | — | |||||||||
| Proceeds from mortgage loan note |
— | — | 3,360 | |||||||||
| Principal payments on mortgage loan note |
(122 | ) | (118 | ) | (19 | ) | ||||||
| Repayments of Pennsylvania industrial loans |
(90 | ) | (152 | ) | (146 | ) | ||||||
| Principal payments on capital lease obligations |
(2,970 | ) | (2,817 | ) | (1,306 | ) | ||||||
| Proceeds from exercise of stock options |
— | 572 | 465 | |||||||||
| Excess tax benefit from stock option exercises |
— | — | 1,302 | |||||||||
| Fees paid and capitalized related to debt issuance |
— | — | (1,356 | ) | ||||||||
| Payments of withholding taxes on performance units |
(1,237 | ) | (1,280 | ) | (363 | ) | ||||||
|
|
|
|
|
|
|
|||||||
| Net cash (used in) provided by financing activities |
(8,835 | ) | 23,139 | (27,909 | ) | |||||||
| EFFECTS OF EXCHANGE RATE CHANGES ON CASH |
(876 | ) | (547 | ) | (11 | ) | ||||||
|
|
|
|
|
|
|
|||||||
| Net (decrease) increase in cash |
(12,452 | ) | 10,512 | (3,638 | ) | |||||||
| CASH AND CASH EQUIVALENTS AT BEGINNING OF YEAR |
13,319 | 2,807 | 6,445 | |||||||||
|
|
|
|
|
|
|
|||||||
| CASH AND CASH EQUIVALENTS AT END OF YEAR |
$ | 867 | $ | 13,319 | $ | 2,807 | ||||||
|
|
|
|
|
|
|
|||||||
| SUPPLEMENTAL CASH FLOW INFORMATION: |
||||||||||||
| Equipment financed through capital lease obligation |
$ | 1,679 | $ | 1,107 | $ | 6,774 | ||||||
|
|
|
|
|
|
|
|||||||
| Equipment financed through buyout of operating lease deposit |
$ | — | $ | — | $ | 419 | ||||||
|
|
|
|
|
|
|
|||||||
The accompanying notes to consolidated financial statements are an integral part of these statements.
55
Table of Contents
AEP INDUSTRIES INC.
NOTES TO CONSOLIDATED FINANCIAL STATEMENTS
| (1) | Business |
AEP Industries Inc. (the “Company”) is a manufacturer of flexible plastic packaging films in North America. The Company manufactures and markets a wide range of polyethylene and polyvinyl chloride flexible packaging products, with consumer, industrial and agricultural applications. The flexible plastic packaging films are primarily used in the packaging, transportation, beverage, food, automotive, pharmaceutical, chemical, electronics, construction, agriculture and textile industries.
| (2) | Significant Accounting Policies |
Fiscal Year:
The Company’s fiscal year-end is October 31.
Principles of Consolidation:
The consolidated financial statements include the accounts of all subsidiaries. All significant intercompany transactions have been eliminated in consolidation.
Revenue Recognition:
The Company recognizes revenue when products are shipped and the customer takes ownership and assumes risk of loss, which is primarily on the date of shipment, collection of the relevant receivable is probable, persuasive evidence of an arrangement exists and the sales price is fixed and determinable. Concurrently, the Company records reductions to revenue for estimated returns and customer rebates, promotions or other incentive programs that are estimated using historical experience and current economic trends. Material differences may result in the amount and timing of net sales for any period if management makes different judgments or uses different estimates.
Cost of Sales:
The most significant components of cost of sales are materials, including packaging, fixed manufacturing costs, labor, depreciation, inbound freight charges, utility costs used in the manufacturing process, any inventory adjustments, including LIFO adjustments, purchasing and receiving costs, research and development costs, quality control costs, and warehousing costs.
Delivery:
Delivery costs represent all costs incurred by the Company for shipping and handling of its products to the customer, including transportation costs paid to third party shippers.
Selling, General & Administrative:
Selling and general and administrative expenses consist primarily of personnel costs (including salaries, bonuses, commissions and employee benefits), facilities and equipment costs and other support costs including utilities, insurance and professional fees.
Cash and Cash Equivalents:
The Company considers all highly liquid investments purchased with an initial maturity of three months or less to be cash equivalents.
56
Table of Contents
AEP INDUSTRIES INC.
NOTES TO CONSOLIDATED FINANCIAL STATEMENTS (Continued)
| (2) | Significant Accounting Policies (Continued) |
Accounts Receivable:
Trade accounts receivable are recorded at the invoice amount and do not bear interest. The allowance for doubtful accounts is the Company’s best estimate of the amount of probable credit losses in the Company’s existing accounts receivable. The Company determines the allowance based on historical write-off experience and an evaluation of the likelihood of success in collecting specific customer receivables. The Company reviews its allowance for doubtful accounts monthly. Past due balances over 90 days and over a specified amount are reviewed individually for collectability. Account balances are charged off against the allowance after all means of collection have been exhausted and potential for recovery is considered remote. In addition, the Company maintains allowances for customer returns, discounts and invoice pricing discrepancies, primarily based on historical experience. The Company does not have any off-balance-sheet exposure related to its customers.
Use of Estimates:
The preparation of financial statements in conformity with accounting principles generally accepted in the United States of America requires management to make estimates and assumptions that affect the reported amounts of assets and liabilities, the disclosure of contingent assets and liabilities at the date of the financial statements and the reported amounts of revenues and expenses during the reporting period. These estimates and assumptions are based on management’s best estimates and judgment. Management evaluates its estimates and assumptions on an ongoing basis using historical experience and other factors, including the current economic environment. The Company adjusts such estimates and assumptions when facts and circumstances dictate. As future events and their effects cannot be determined with precision, actual results could differ significantly from these estimates. Changes in estimates are recorded in results of operations in the period that the event or circumstances giving rise to such changes occur.
The Company’s significant estimates include those related to product returns, customer rebates and incentives, doubtful accounts, acquisitions, pension obligations, incurred but not reported medical and workers’ compensation claims, litigation and contingency accruals, income taxes, including valuation of deferred income taxes, and impairment of long-lived assets and intangibles, including goodwill.
Property, Plant and Equipment:
Property, plant and equipment are stated at cost and at fair value for acquisitions. Depreciation and amortization are computed using the straight-line method over the estimated useful lives of the assets. The cost of property, plant and equipment and the related accumulated depreciation and amortization are removed from the accounts upon the retirement or disposal of such assets and the resulting gain or loss is recognized at the time of disposition. Maintenance and repairs that do not improve efficiency or extend economic life are charged to expense as incurred.
Leases:
The Company operates certain warehousing facilities, an office building and machinery and equipment under operating leases with terms greater than one year and with minimum lease payments associated with these agreements. Rent expense is recognized on a straight-line basis
57
Table of Contents
AEP INDUSTRIES INC.
NOTES TO CONSOLIDATED FINANCIAL STATEMENTS (Continued)
| (2) | Significant Accounting Policies (Continued) |
over the expected lease term. Within the provisions of certain leases are predetermined fixed escalations of the minimum rental payments over the base lease term (none of the leases contain lease concessions, including capital improvement funding, or contingent rental clauses). The effects of the escalations have been reflected in rent expense on a straight-line basis over the lease term, and the difference between the recognized rental expense and the amounts payable under the lease is recorded as deferred lease payments. The amortization period for leasehold improvements is the term used in calculating straight-line rent expense or their estimated economic life, whichever is shorter.
Impairment Charges:
Property, plant and equipment, and purchased intangibles subject to amortization, are reviewed for impairment whenever events or changes in circumstances indicate that the carrying amount of an asset may not be recoverable. Recoverability of assets to be held and used is measured by a comparison of the carrying amount of an asset to estimated undiscounted future cash flows expected to be generated by the asset. If the carrying amount of an asset exceeds its estimated undiscounted future cash flows, an impairment charge is recognized for the amount by which the carrying amount of the asset exceeds the fair value of the asset. Fair value is determined based on discounted cash flows, recent buy offers or appraised values, depending on the nature of the asset. Assets to be disposed of are separately presented in the consolidated balance sheets and reported at the lower of the carrying amount or the fair value less costs to sell, and are no longer depreciated. The asset and liabilities of a disposed group, classified as held for sale, are presented separately in the appropriate asset and liability sections of the consolidated balance sheets.
Foreign Currency Translation:
Financial statements of international subsidiaries are translated into U.S. dollars using the exchange rate at each balance sheet date for assets and liabilities and the weighted average exchange rate for each period for revenues, expenses, gains and losses. Translation adjustments are recorded as a separate component of accumulated other comprehensive (loss) income in the consolidated balance sheets and a component in arriving at comprehensive (loss) income. Foreign currency transaction gains and losses are recorded in other income (expense) in the consolidated statements of operations.
Derivative Instruments:
The Company enters into derivative financial instruments to manage exposures arising in the normal course of business. The Company enters into foreign exchange forward contracts primarily to hedge intercompany transactions and forecasted purchases. Foreign currency forward contracts reduce the Company’s exposure to the risk that the eventual cash inflows and outflows, resulting from these intercompany and third party trade transactions denominated in a currency other than the functional currency, will be adversely affected by changes in exchange rates. Foreign exchange forward contracts generally have maturities of less than six months and relate primarily to the Canadian dollar. The Company also enters into interest rate swap contracts to economically convert a variable-rate debt to a fixed-rate debt. The Company does not apply hedge accounting for foreign exchange forward contracts and interest rate swaps and as a result, these hedging instruments are adjusted to fair value through income and expense. The fair value of these contracts was immaterial at October 31, 2014 and 2013.
58
Table of Contents
AEP INDUSTRIES INC.
NOTES TO CONSOLIDATED FINANCIAL STATEMENTS (Continued)
| (2) | Significant Accounting Policies (Continued) |
Fair Value Measurements:
In determining the fair value of financial instruments, the Company utilizes valuation techniques that maximize the use of observable inputs and minimize the use of unobservable inputs to the extent possible and considers counterparty credit risk in its assessment of fair value. The Company determines the fair value of its financial instruments based on assumptions that market participants would use in pricing an asset or liability in the principal or most advantageous market. When considering market participant assumptions in fair value measurements, the following fair value hierarchy distinguishes between observable and unobservable inputs, which are categorized in one of the following levels:
| Level 1 | Unadjusted quoted prices in active markets for identical assets or liabilities at the measurement date. | |
| Level 2 | Observable inputs other than those included in Level 1. For example, quoted prices for similar assets or liabilities in active markets or quoted prices for identical assets or liabilities in inactive markets. | |
| Level 3 | Unobservable inputs reflecting management’s own assumptions about the inputs used in pricing the asset or liability at the measurement date. |
The carrying amount reported in the consolidated balance sheets for cash and cash equivalents, accounts receivable, inventories, other current assets, accounts payable and accrued expenses approximates fair value because of the short-term nature of these assets and liabilities. The Company did not have any non–financial assets and liabilities that were carried at fair value on a recurring basis in the consolidated financial statements or for which a fair value measurement was required at October 31, 2014. See Notes 8 and 9 for discussion of the fair value of the Company’s debt and the assets held in the Company’s two defined benefit pension plans, respectively.
Research and Development Costs:
Research and development costs are charged to expense as incurred and included in cost of sales in the consolidated statements of operations. Research and development costs were $2.0 million, $2.3 million and $2.1 million during fiscal 2014, 2013 and 2012, respectively.
Acquisitions:
The Company uses the acquisition method of accounting for all business combinations (whether full, partial or step acquisition). In applying the acquisition method, the Company determines the fair value of the acquired business as of the acquisition date and recognize the fair value of the acquired assets and liabilities assumed. Any excess of fair value of acquired net assets over the acquisition consideration results in a gain on bargain purchase and is recognized in earnings on the acquisition date. Any excess of the acquisition consideration over the fair value of acquired net assets is recognized as goodwill. Any adjustments to the fair values assigned to the assets acquired and the liabilities assumed during the measurement period, which may be up to one year from the acquisition date, has a corresponding offset to the gain on bargain purchase or goodwill. The acquisition costs are expensed as incurred and restructuring costs will generally be expensed in periods after the acquisition date.
59
Table of Contents
AEP INDUSTRIES INC.
NOTES TO CONSOLIDATED FINANCIAL STATEMENTS (Continued)
| (2) | Significant Accounting Policies (Continued) |
Share-Based Compensation:
Compensation expense for our shared-based compensation plans is based on the fair value of the awards granted and is recognized in income on a straight-line basis over the requisite service period of each award.
Due to the cash settlement feature of the performance units granted under the Company’s share-based plan to directors and key employees of the Company, the performance units are liability classified and are recognized at fair value, depending on the percentage of requisite service rendered at the reporting date, and are remeasured at each balance sheet date to the market value of the Company’s common stock at the reporting date. As the Units contain both a performance and service condition, the Units have been treated as a series of separate awards or tranches for purposes of recognizing compensation expense. The Company recognizes compensation expense on a tranche-by-tranche basis, recognizing the expense as the employee works over the requisite service period for that specific tranche.
Income Taxes:
Income taxes are accounted for using the asset and liability method. Such approach results in the recognition of deferred tax assets and liabilities for the expected future tax consequences of temporary differences between the book carrying amounts and the tax basis of assets and liabilities. Valuation allowances are established where expected future taxable income, the reversal of deferred tax liabilities and development of tax strategies does not support the realization of the deferred tax assets.
The Company recognizes in its consolidated financial statements the impact of a tax position if that position is more likely than not of being sustained based on the technical merits of the position. There is a two-step approach for evaluating uncertain tax positions. Step one, recognition, requires a company to determine if the weight of available evidence indicates that a tax position is more likely than not to be sustained upon audit, including resolution of related appeals or litigation processes, if any. Step two, measurement, is based on the largest amount of benefit, which is more likely than not to be realized on settlement with the taxing authority.
The Company and its subsidiaries file separate foreign, state and local income tax returns and, accordingly, provide for such income taxes on a separate company basis.
Goodwill:
Goodwill represents the excess of the purchase price over the fair value of net assets acquired in purchase business combinations. The Company has determined that it consists of a single reporting unit for the purpose of the goodwill impairment test. The Company performs its annual impairment analysis on September 30 based on a comparison of the Company’s market capitalization to its book value at that date. On September 30, 2014, 2013 and 2012, the Company concluded that there was no impairment because the Company’s market capitalization was above book value. On October 31, 2014 and 2013, the Company’s market capitalization was above book value. The Company’s policy is that impairment of goodwill will have occurred if the market capitalization of the Company were to remain below book value for a reasonable period of time. If the Company determines an impairment has occurred, it will perform a second test to determine
60
Table of Contents
AEP INDUSTRIES INC.
NOTES TO CONSOLIDATED FINANCIAL STATEMENTS (Continued)
| (2) | Significant Accounting Policies (Continued) |
the amount of the impairment loss. In the second test, the fair value of the Company is estimated using comparable industry multiples of cash flows as part of an effort to measure the value of implied goodwill.
Concentration of Risk:
The Company sells its products to a large number of geographically diverse customers in a number of different industries, thus spreading the trade credit risk. The Company extends credit based on an evaluation of the customer’s financial condition, generally without requiring collateral. The Company performs ongoing credit evaluations of its customers’ financial condition and maintains appropriate allowances for anticipated losses. No single customer accounted for more than 10% of net sales during any of the years in the three year period ended October 31, 2014. No single customer accounted for more than 10% of the Company’s account receivable balance at October 31, 2014 or 2013.
The Company purchases its resin from three principal suppliers that provided the Company with approximately 28%, 22% and 17%, respectively, of the Company’s fiscal 2014 resin supply, approximately 28%, 26% and 19%, respectively, of the Company’s fiscal 2013 resin supply and approximately 29%, 25% and 19%, respectively, of the Company’s fiscal 2012 resin supply.
The Company has three collective bargaining agreements representing approximately 19% of its workforce that expire, January 2015 (representing 6% of our workforce, negotiations are currently underway), March 2017 and December 2018, respectively.
Earnings Per Share (EPS):
Basic (loss) earnings per share (“EPS”) is calculated by dividing net (loss) income by the weighted average number of shares of common stock outstanding during the period. Diluted EPS is calculated by dividing net (loss) income by the weighted average number of common shares outstanding, adjusted to reflect potentially dilutive securities (options) using the treasury stock method, except when the effect would be anti-dilutive.
The number of shares used in calculating basic and diluted (loss) earnings per share is as follows:
| For the Years Ended October 31, |
||||||||||||
| 2014 | 2013 | 2012 | ||||||||||
| Weighted average common shares outstanding: |
||||||||||||
| Basic |
5,323,131 | 5,573,643 | 5,513,863 | |||||||||
| Effect of dilutive securities: |
||||||||||||
| Options to purchase shares of common stock |
— | 36,704 | 51,767 | |||||||||
|
|
|
|
|
|
|
|||||||
| Diluted |
5,323,131 | 5,610,347 | 5,565,630 | |||||||||
|
|
|
|
|
|
|
|||||||
For the years ended October 31, 2014, 2013 and 2012 the Company had 10,000, zero and 10,000 stock options outstanding, respectively, that could potentially dilute earnings per share in future periods but were excluded from the computation of diluted EPS because their exercise price was higher than the Company’s average stock price during the respective periods. For the year
61
Table of Contents
AEP INDUSTRIES INC.
NOTES TO CONSOLIDATED FINANCIAL STATEMENTS (Continued)
| (2) | Significant Accounting Policies (Continued) |
ended October 31, 2014, the Company had 16,168 stock options outstanding that could potentially dilute earnings per share in future periods that were excluded from the computation of diluted EPS because their effect would have been anti-dilutive given the net loss during the period.
The Company includes any non-vested restricted stock issued under the Company’s 2013 Omnibus Incentive Plan (see Note 10) in the weighted average common shares outstanding since the date of issuance as the restricted stock entitles the participant to all rights of a stockholder, including the right to vote the shares and the right to receive dividends.
Comprehensive (Loss) Income:
Comprehensive (loss) income consists of net (loss) income and other gains and losses that are not included in net (loss) income, but are recorded directly in the consolidated statements of shareholders’ equity, such as the unrealized gains and losses on the translation of the assets and liabilities of the Company’s foreign operations and gains or losses, prior service costs and transition assets or obligations associated with pension benefits, net of tax, that have not been recognized as components of net periodic benefit cost, and changes in deferred prior service costs and net actuarial losses, net of tax.
New Accounting Pronouncements Not Yet Effective
Unless otherwise discussed, the Company believes that the impact of recently issued accounting pronouncements that are not yet effective will not have a material impact on the its financial position, results of operations or cash flows.
In June 2014, the Financial Accounting Standards Board (“FASB”) issued ASU No. 2014-12 (ASU 2014-12), Accounting for Share-Based Payments When the Terms of an Award Provide That a Performance Target Could Be Achieved after the Requisite Service Period, which requires that a performance target that affects vesting and that could be achieved after the requisite service period be treated as a performance condition. ASU 2014-12 is effective for annual periods and interim periods within those annual periods beginning after December 15, 2015, which is the Company’s first quarter of fiscal year 2017. Early adoption is permitted.
In May 2014, the FASB issued ASU No. 2014-09 (ASU 2014-09), Revenue from Contracts with Customers, which supersedes nearly all existing revenue recognition guidance under U.S. GAAP. The new standard requires a company to recognize revenue when it transfers goods or services to customers in an amount that reflects the consideration that the company expects to receive for those goods or services. Additionally, the guidance requires improved disclosures to help users of financial statements better understand the nature, amount, timing, and uncertainty of revenue and cash flows arising from contracts with customers. ASU 2014-09 is effective for annual reporting periods beginning after December 15, 2016, including interim periods within that reporting period, which is the Company’s first quarter of fiscal year 2018. Early application is not permitted. The new standard allows for the amendment to be applied either retrospectively to each prior reporting period presented or retrospectively as a cumulative-effect adjustment as of the date of adoption. The Company is evaluating the effect that ASU 2014-09 will have on its consolidated financial statements and related disclosures, including which transition method it will adopt.
In April 2014, the FASB issued ASU No. 2014-08 (ASU 2014-08), Presentation of Financial Statements (Topic 205) and Property, Plant, and Equipment (Topic 360): Reporting Discontinued
62
Table of Contents
AEP INDUSTRIES INC.
NOTES TO CONSOLIDATED FINANCIAL STATEMENTS (Continued)
| (2) | Significant Accounting Policies (Continued) |
Operations and Disclosures of Disposals of Components of an Entity, which raises the threshold for disposals to qualify as discontinued operations. Under the new guidance, a disposal representing a strategic shift that has (or will have) a major effect on an entity’s financial results or a business activity classified as held for sale, should be reported as discontinued operations. ASU 2014-08 also expands the disclosure requirements for discontinued operations and adds new disclosures for individually significant dispositions that do not qualify as discontinued operations. ASU 2014-08 is effective prospectively for fiscal years, and interim reporting periods within those years, beginning after December 15, 2014, which is the Company’s first quarter of fiscal year 2016. Early adoption is permitted, but only for disposals (or classifications as held for sale) that have not been reported in the financial statements previously issued or available for issuance. As of October 31, 2014, there have been no disposals or classifications as held for sale by the Company that would be subject to ASU 2014-08.
| (3) | Acquisitions |
On November 8, 2012, the Company completed its purchase of certain machinery and equipment and related assets necessary to manufacture printed, converted and custom films of Transco Plastics Industries Ltd. (“Transco”), a Quebec company, for a purchase price of $5.3 million (deposit was made and included in other assets at October 31, 2012), excluding a one-year commission and transition service costs. The Company financed the transaction through a combination of cash on hand and availability under its credit facility.
The Transco acquisition expanded the Company’s presence in the flexible plastic packaging industry and enhanced the Company’s suite of products. The acquisition resulted in a gain on bargain purchase as the seller was motivated to sell these assets since they were no longer a part of the seller’s intended ongoing business and the seller was under a time constraint to vacate the building in which these assets were located.
The Company concluded that the Transco acquisition represented a business because it is an integrated set of activities and assets that is capable of being conducted and managed for the purpose of providing a return to the Company and its shareholders. As such, the acquisition has been accounted for using the acquisition method of accounting which requires, among other things, that assets acquired and liabilities assumed be recognized at their fair values as of the acquisition date. The following table summarizes the amounts recognized for assets acquired and liabilities assumed as of the acquisition date.
| Allocation At October 31, 2013 |
||||
| (in thousands) | ||||
| Property, plant and equipment |
$ | 5,380 | ||
| Intangible asset (customer relationships) |
1,500 | |||
|
|
|
|||
| Total identifiable assets acquired |
6,880 | |||
| Deferred income tax liability |
579 | |||
|
|
|
|||
| Total liabilities assumed |
579 | |||
| Net identifiable assets acquired |
6,301 | |||
| Purchase price |
5,300 | |||
|
|
|
|||
| Gain on bargain purchase |
$ | 1,001 | ||
|
|
|
|||
63
Table of Contents
AEP INDUSTRIES INC.
NOTES TO CONSOLIDATED FINANCIAL STATEMENTS (Continued)
| (3) | Acquisitions (Continued) |
Upon the determination that the Company was going to recognize a gain related to the bargain purchase of Transco, the Company reassessed its assumptions and measurement of identifiable assets acquired and liabilities assumed, and concluded that the valuation procedures and resulting measures were appropriate. As a result, the Company determined that the fair values of assets acquired and liabilities assumed exceeded the purchase price by approximately $1.0 million, which was recorded as a gain on bargain purchase in its consolidated statement of operations for the year ended October 31, 2013.
The intangible asset is being amortized over a straight-line basis over ten years.
The results of operations for Transco have been included in all periods since November 8, 2012.
Pro forma results of operations and other disclosures for the Transco acquisition have not been presented as they are not material in relation to the Company’s reported results.
During the fiscal year 2013 relocation of equipment purchased from Transco in Quebec, Canada to the Company’s Bowling Green, Kentucky facility, a print press was damaged in transit. The damages sustained resulted in a delay in the start-up of the machinery and the Company’s inability to supply certain customers. The Company filed a business interruption claim related to the lost margins from this incident. During the third quarter of fiscal 2014, the Company collected $2,050,000 in business interruption insurance recoveries, which is recorded as a component of other operating income in the consolidated statement of operations for the year ended October 31, 2014. The insurance award was net of a $500,000 deductible. The Company is pursuing recovery of the deductible.
| (4) | Inventories |
Inventories, stated at the lower of cost (last-in, first-out method (“LIFO”) for the U.S. operations, and the first-in, first-out method (“FIFO”) for the Canadian operation, supplies and printed and converted finished goods for the U.S. operation, and certain finished goods) or market, include material, labor and manufacturing overhead costs, less vendor rebates. The Company establishes a reserve in those situations in which cost exceeds market value.
Inventories are comprised of the following:
| October 31, 2014 |
October 31, 2013 |
|||||||
| (in thousands) | ||||||||
| Raw materials |
$ | 46,810 | $ | 48,467 | ||||
| Finished goods |
78,464 | 83,363 | ||||||
| Supplies |
5,854 | 6,322 | ||||||
|
|
|
|
|
|||||
| 131,128 | 138,152 | |||||||
| Less: LIFO reserve |
(44,708 | ) | (41,061 | ) | ||||
|
|
|
|
|
|||||
| Inventories, net |
$ | 86,420 | $ | 97,091 | ||||
|
|
|
|
|
|||||
The LIFO method was used for determining the cost of approximately 84% and 85% of total inventories at October 31, 2014 and 2013, respectively. During fiscal 2014, 2013 and 2012, the Company had certain decrements in its LIFO pools, which reduced cost of sales by $2.4 million,
64
Table of Contents
AEP INDUSTRIES INC.
NOTES TO CONSOLIDATED FINANCIAL STATEMENTS (Continued)
| (4) | Inventories (Continued) |
$2.4 million and $1.0 million, respectively. Because of the Company’s continuous manufacturing process, there is no significant work in process at any point in time.
| (5) | Property, Plant and Equipment |
A summary of the components of property, plant and equipment and their estimated useful lives is as follows:
| October 31, |
| |||||||||
| 2014 | 2013 | Estimated Useful Lives | ||||||||
| (in thousands) | ||||||||||
| Land |
$ | 11,996 | $ | 10,063 | ||||||
| Buildings |
102,330 | 96,198 | 15 to 31.5 years | |||||||
| Machinery and equipment |
445,236 | 423,106 | 5 to 9 years | |||||||
| Furniture and fixtures |
23,461 | 21,311 | 3 to 9 years | |||||||
| Leasehold improvements |
709 | 415 | Lesser of lease term or useful lives of 6 to 25 years | |||||||
| Motor vehicles |
369 | 356 | 3 years | |||||||
| Construction in progress |
10,714 | 17,384 | ||||||||
|
|
|
|
|
|||||||
| 594,815 | 568,833 | |||||||||
| Less: Accumulated depreciation and amortization |
378,306 | 348,519 | ||||||||
|
|
|
|
|
|||||||
| Property, plant and equipment, net |
$ | 216,509 | $ | 220,314 | ||||||
|
|
|
|
|
|||||||
Maintenance and repairs expense was $15.2 million, $15.4 million, and $13.5 million for the years ended October 31, 2014, 2013 and 2012, respectively.
| (6) | Intangible Assets |
Changes in the carrying amount of intangible assets during the years ended October 31, 2014, 2013 and 2012 are as follows:
| Customer List (Mercury) |
Tradenames |
Leasehold Interests |
Customer relationships |
Total | ||||||||||||||||
| Balance at October 31, 2011 |
$ | 20 | $ | 961 | $ | (23 | ) | $ | 2,966 | $ | 3,924 | |||||||||
| Amortization |
(20 | ) | (137 | ) | 6 | (237 | ) | (388 | ) | |||||||||||
|
|
|
|
|
|
|
|
|
|
|
|||||||||||
| Balance at October 31, 2012 |
— | 824 | (17 | ) | 2,729 | 3,536 | ||||||||||||||
| Transco acquisition (see Note 3) |
— | — | — | 1,500 | 1,500 | |||||||||||||||
| Amortization |
— | (137 | ) | 6 | (387 | ) | (518 | ) | ||||||||||||
|
|
|
|
|
|
|
|
|
|
|
|||||||||||
| Balance at October 31, 2013 |
— | 687 | (11 | ) | 3,842 | 4,518 | ||||||||||||||
| Amortization |
— | (137 | ) | 6 | (387 | ) | (518 | ) | ||||||||||||
|
|
|
|
|
|
|
|
|
|
|
|||||||||||
| Balance at October 31, 2014 |
$ | — | $ | 550 | $ | (5 | ) | $ | 3,455 | $ | 4,000 | |||||||||
|
|
|
|
|
|
|
|
|
|
|
|||||||||||
65
Table of Contents
AEP INDUSTRIES INC.
NOTES TO CONSOLIDATED FINANCIAL STATEMENTS (Continued)
| (6) | Intangible Assets (Continued) |
Weighted average amortization periods over a straight-line basis are as follows:
| In Years | ||||
| Trade names |
9 | |||
| Customer relationships |
12 | |||
| Leasehold Interest |
7 | |||
The estimated future amortization expense during each of the next five fiscal years is as follows:
| For the fiscal year ending October 31, |
(in thousands) | |||
| 2015 |
$ | 519 | ||
| 2016 |
524 | |||
| 2017 |
479 | |||
| 2018 |
479 | |||
| 2019 |
397 | |||
| Thereafter |
1,602 | |||
|
|
|
|||
| Total estimated future amortization expense |
$ | 4,000 | ||
|
|
|
|||
| (7) | Accrued Expenses |
At October 31, 2014 and 2013, accrued expenses consist of the following:
| October 31, | ||||||||
| 2014 | 2013 | |||||||
| (in thousands) | ||||||||
| Payroll and employee related |
$ | 8,084 | $ | 10,072 | ||||
| Customer rebates |
8,963 | 7,733 | ||||||
| Interest |
824 | 762 | ||||||
| Accrual for performance units |
1,896 | 4,037 | ||||||
| Other(A) |
8,717 | 9,540 | ||||||
|
|
|
|
|
|||||
| Accrued expenses |
$ | 28,484 | $ | 32,144 | ||||
|
|
|
|
|
|||||
| (A) | No individual item exceeded 5% of current liabilities. |
66
Table of Contents
AEP INDUSTRIES INC.
NOTES TO CONSOLIDATED FINANCIAL STATEMENTS (Continued)
| (8) | Debt |
A summary of the components of debt is as follows:
| October 31, 2014 |
October 31, 2013 |
|||||||
| (in thousands) | ||||||||
| Credit facility(a) |
$ | 40,510 | $ | 25,600 | ||||
| 8.25% senior notes due 2019(b) |
200,000 | 200,000 | ||||||
| Pennsylvania industrial loans(c) |
966 | 1,056 | ||||||
| Mortgage loan note (d) |
3,101 | 3,223 | ||||||
| Capital leases(e) |
11,754 | 12,387 | ||||||
| Foreign bank borrowings(f) |
— | — | ||||||
|
|
|
|
|
|||||
| Total debt |
256,331 | 242,266 | ||||||
| Less: current portion |
2,636 | 3,335 | ||||||
|
|
|
|
|
|||||
| Long-term debt |
$ | 253,695 | $ | 238,931 | ||||
|
|
|
|
|
|||||
(a) Credit facility
The Company is party to the Second Amended and Restated Loan and Security Agreement (the “credit facility”), dated February 22, 2012, with Wells Fargo Bank National Association (“Wells Fargo”), successor to Wachovia Bank N.A., as a lender thereunder and as agent for the secured parties thereunder. The maximum borrowing amount under the credit facility is $150.0 million with a maximum for letters of credit of $20.0 million. The credit facility’s maturity date is February 21, 2017.
The Company utilizes the credit facility to provide funding for operations and other corporate purposes through daily bank borrowings and/or cash repayments to ensure sufficient operating liquidity and efficient cash management. The Company had weighted average borrowings under the credit facility of $53.4 million and $23.6 million, with a weighted average interest rate of 2.7% and 3.0% during fiscal 2014 and 2013, respectively. Under the credit facility, interest rates are based upon the Quarterly Average Excess Availability (as defined therein) at a margin of the prime rate (defined as the greater of Wells Fargo’s prime rate or the Federal Funds rate plus 0.5%) plus 0% to 0.25% or LIBOR plus 1.75% to 2.50%.
Borrowings and letters of credit available under the credit facility are limited to a borrowing base based upon specific advance percentage rates on eligible accounts receivable and inventory, subject, in the case of inventory, to amount limitations. The sum of the eligible assets at October 31, 2014 and October 31, 2013 supported a borrowing base of $150.0 million. Availability was reduced by the aggregate amount of letters of credit outstanding totaling $2.1 million and $1.1 million at October 31, 2014 and October 31, 2013, respectively. Availability at October 31, 2014 and October 31, 2013 under the credit facility was $107.4 million and $123.3 million, respectively. The credit facility is secured by liens on most of the Company’s domestic assets (other than real property and equipment) and on 66% of the Company’s ownership interest in certain foreign subsidiaries.
The credit facility provides for events of default. If an event of default occurs and is continuing, amounts due under the credit facility may be accelerated and the commitments to extend credit thereunder terminated, and the rights and remedies of the lenders may be exercised including rights with respect to the collateral securing the obligations under the credit facility. The credit facility also
67
Table of Contents
AEP INDUSTRIES INC.
NOTES TO CONSOLIDATED FINANCIAL STATEMENTS (Continued)
| (8) | Debt (Continued) |
contains covenants, including, but not limited to, limitations on the incurrence of debt and liens, the disposition and acquisition of assets, and the making of investments and restricted payments, including the payment of cash dividends. The credit facility has a fixed charge coverage ratio test of 1.0x, which test is triggered when Excess Availability is below $22.5 million for the immediately preceding fiscal quarter.
In addition, if Excess Availability under the credit facility is less than $25.0 million, a springing cash dominion is activated and all remittances received from customers in the United States will automatically be applied to repay the balance outstanding. The automatic repayments through the springing cash dominion remain in place until Excess Availability exceeds $25.0 million, and no other event of default has occurred and is continuing, in each case for 30 consecutive days. Excess Availability under the credit facility ranged from $54.7 million to $137.8 million during fiscal 2014 and from $95.7 million to $150.0 million during fiscal 2013.
During fiscal 2012, the Company capitalized $1.3 million of fees related to the credit facility. These fees, along with the unamortized fees of $0.4 million related to the prior credit facility, are being amortized on a straight line basis over 60 months, the term of the credit facility.
The Company was in compliance with the financial covenants at October 31, 2014 and October 31, 2013.
(b) 8.25% senior notes due 2019
The Company has $200 million aggregate principal amount of 8.25% senior notes due 2019 (the “2019 notes”).
The 2019 notes mature on April 15, 2019, and the indenture governing the 2019 notes contains certain customary covenants that, among other things, limit the Company’s ability and the ability of its subsidiaries to incur additional indebtedness, declare or pay dividends, purchase or redeem its capital stock, make investments, sell assets, merge or consolidate, guarantee or pledge any assets or create liens. The Company was in compliance with all of these covenants at October 31, 2014 and October 31, 2013.
The 2019 notes do not have any sinking fund requirements. If the Company experiences certain changes in control, it must offer to repurchase all of the 2019 notes at a price equal to 101% of the principal amount, plus accrued and unpaid interest. In addition, if the Company sells certain assets, under certain circumstances, it must offer to repurchase the 2019 notes pro rata up to a maximum amount equal to the proceeds of such sale at 100% of the principal amount, plus accrued and unpaid interest.
The 2019 notes are redeemable at the option of the Company, in whole or in part, at certain fixed redemption prices plus accrued and unpaid interest.
Interest is paid semi-annually on April 15 and October 15 of each year.
The Company capitalized $4.9 million of fees related to the issuance of the 2019 notes. These fees are being amortized on a straight line basis over eight years, the term of the 2019 notes.
68
Table of Contents
AEP INDUSTRIES INC.
NOTES TO CONSOLIDATED FINANCIAL STATEMENTS (Continued)
| (8) | Debt (Continued) |
(c) Pennsylvania industrial loans
The Company has certain amortizing fixed rate term loans in connection with the expansion in fiscal 2008 of its Wright Township, Pennsylvania manufacturing facility. The following are outstanding at October 31, 2014 and 2013:
A $0.3 million five year fixed rate 5.0% loan, due November 1, 2013, of which zero and $6,256 was outstanding at October 31, 2014 and 2013, respectively;
A $1.4 million fifteen year fixed rate 4.75% loan, due November 1, 2023, of which $1.0 million was outstanding at October 31, 2014 and 2013.
This financing arrangement is secured by the real property of the manufacturing facility located in Wright Township, Pennsylvania, which had a net carrying value of $10.4 million and $11.0 million at October 31, 2014 and 2013, respectively.
(d) Mortgage loan note
On July 25, 2012, concurrent with the purchase of the Company’s corporate headquarters building in Montvale, New Jersey, the Company entered into a mortgage loan note (the “mortgage note”) having a principal amount of $3,360,000 with TD Bank, N.A. The mortgage note bears interest at a rate equal to one-month LIBOR plus 1.75% and matures on August 1, 2022. Interest is paid monthly. The mortgage note is secured by the Montvale building.
In connection with the mortgage note, the Company also entered into a ten-year floating-to-fixed interest rate swap agreement with TD Bank, N.A. with a notional value of $3,360,000, the then outstanding principal balance on the mortgage note. The interest rate swap fixes the interest rate at 3.52% per year and matures on July 25, 2022. The fair value of the Company’s interest rate swap was immaterial at October 31, 2014 and 2013.
(e) Capital leases
From time to time, the Company enters into capital leases for certain of its machinery and equipment. The interest rates on the capital leases range from 3.5% to 8.5%, with a weighted average interest rate of 4.5%. As a result of the capital lease treatment, the equipment remains as a component of property, plant and equipment in the Company’s consolidated balance sheet and is depreciated in accordance with the Company’s depreciation policy.
69
Table of Contents
AEP INDUSTRIES INC.
NOTES TO CONSOLIDATED FINANCIAL STATEMENTS (Continued)
| (8) | Debt (Continued) |
Under the terms of the capital leases, the payments are as follows:
| For the years ended October 31, |
Capital Leases |
|||
| (in thousands) | ||||
| 2015 |
$ | 2,812 | ||
| 2016 |
2,429 | |||
| 2017 |
2,429 | |||
| 2018 |
2,430 | |||
| 2019 |
2,261 | |||
| Thereafter |
533 | |||
|
|
|
|||
| Total minimum lease payments |
12,894 | |||
| Less: Amounts representing interest |
1,140 | |||
|
|
|
|||
| Present value of minimum lease payments |
11,754 | |||
| Less: Current portion of obligations under capital leases |
2,422 | |||
|
|
|
|||
| Long-term portion of obligations under capital leases |
$ | 9,332 | ||
|
|
|
|||
(f) Foreign bank borrowings
In addition to the amounts available under the credit facility, the Company also maintains a secured credit facility at its Canadian subsidiary, used to support operations, which is generally serviced by local cash flows from operations. There was zero outstanding under this arrangement at October 31, 2014 and October 31, 2013. Availability under the Canadian credit facility at October 31, 2014 and October 31, 2013, was $5.0 million in Canadian dollars or US$4.4 million and US$4.8 million, respectively.
Principal payments required on all debt outstanding during each of the next five fiscal years are as follows:
| (in thousands) | ||||||||||||
| Debt | Capital leases | Total | ||||||||||
| 2015 |
$ | 214 | $ | 2,422 | $ | 2,636 | ||||||
| 2016 |
222 | 2,123 | 2,345 | |||||||||
| 2017 |
40,742 | 2,202 | 42,944 | |||||||||
| 2018 |
242 | 2,284 | 2,526 | |||||||||
| 2019 |
200,252 | 2,199 | 202,451 | |||||||||
| Thereafter |
2,905 | 524 | 3,429 | |||||||||
|
|
|
|
|
|
|
|||||||
| $ | 244,577 | $ | 11,754 | $ | 256,331 | |||||||
|
|
|
|
|
|
|
|||||||
Cash paid for interest during fiscal 2014, 2013 and 2012 was $18.5 million, $17.9 million and $18.0 million, respectively, including $0.5 million, $0.5 million and $0.2 million paid as part of the capitalized leases during fiscal years 2014, 2013 and 2012, respectively.
70
Table of Contents
AEP INDUSTRIES INC.
NOTES TO CONSOLIDATED FINANCIAL STATEMENTS (Continued)
| (8) | Debt (Continued) |
Fair Value
The carrying value and fair value of the Company’s fixed rate debt at October 31, 2014 and October 31, 2013 are as follows:
| October 31, 2014 | October 31, 2013 | |||||||||||||||
| Carrying Value | Fair Value | Carrying Value | Fair Value | |||||||||||||
| (in thousands) | ||||||||||||||||
| 2019 notes |
$ | 200,000 | $ | 205,750 | $ | 200,000 | $ | 216,626 | ||||||||
| Mortgage loan note(a) |
3,101 | 3,101 | 3,223 | 3,223 | ||||||||||||
| Pennsylvania industrial loans |
966 | 966 | 1,056 | 1,056 | ||||||||||||
| Capital leases |
11,754 | 11,754 | 12,387 | 12,387 | ||||||||||||
|
|
|
|
|
|
|
|
|
|||||||||
| Total |
$ | 215,821 | $ | 221,571 | $ | 216,666 | $ | 233,292 | ||||||||
|
|
|
|
|
|
|
|
|
|||||||||
| (a) | The Company entered into an interest rate swap fixing the variable rate loan to a fixed rate loan at an interest rate of 3.52% per year. |
The fair value of the 2019 notes and the mortgage note are based on quoted market rates (Level 1). The Company derives its fair value estimates of the Pennsylvania industrial loans and the capital leases based on observable inputs (Level 2). Observable market inputs used in the calculation of the fair value of the Pennsylvania industrial loans and the capital leases include evaluating the nature and terms of each instrument, considering prevailing economic and market conditions, and examining the cost of similar debt offered at the balance sheet date. The fair value of the Company’s variable rate debt (credit facility) approximates fair value due to the availability and floating rate for similar instruments.
| (9) | Pensions and Retirement Savings Plan |
The Company sponsors defined contribution and defined benefit plans in the United States and in its Canadian subsidiary. Total expense for these plans for 2014, 2013 and 2012 was $3.8 million, $4.2 million and $3.3 million, respectively.
401(k) Savings Plan
Employees of the Company in the United States (with the exception of those employees covered by a collective bargaining agreement at its California facility prior to June 1, 2013 and those employees covered under the AEP Union 401(k) Plan prior to March 31, 2014) may participate in the AEP Industries Inc. 401(k) Savings Plan (the “Plan”). Effective for the fiscal 2006 plan year and thereafter, the Company has and will contribute cash to the Plan. Prior to this, the Company contributed common stock held in treasury.
The Company matches 100% of the first 3% and 50% of the following 2% of each participant’s 401(k) contribution (except the Alabama union employees) with a maximum of 5% of the participant’s annual compensation and the Company makes contributions to the Plan, for eligible employees who have completed one year of service, equal to 1% of a participant’s compensation, as defined, for the Plan year. In fiscal 2014, 2013 and 2012, the Company contributed $3.1 million, $3.0 million and $2.7 million in cash to the Plan in fulfillment of the 2013, 2012 and 2011 contribution requirement, respectively.
71
Table of Contents
AEP INDUSTRIES INC.
NOTES TO CONSOLIDATED FINANCIAL STATEMENTS (Continued)
| (9) | Pensions and Retirement Savings Plan (Continued) |
At October 31, 2014, there were 163,525 shares of the Company’s common stock held by the Plan, representing approximately 3.2% of the total number of shares outstanding. Shares of the Company’s common stock credited to each member’s account under the Plan are voted by the trustee under instructions from each individual plan member. Shares, for which no instructions are received, along with any unallocated shares held in the Plan, are not voted.
Effective March 31, 2014, the Company amended its AEP Union 401(k) Plan to cease elective deferrals and to close the plan to new participants. Effective April 1, 2014, the Plan was amended to allow for the assets and liabilities of the AEP Union 401(k) Savings Plan to be transferred and merged into the Company’s 401(k) Savings Plan. Prior to April 1, 2014, the AEP Union 401(k) Plan was funded solely by employee contributions and covered all eligible AEP Alabama union employees.
Defined Contribution Plan
The Company sponsors a defined contribution plan in Canada. The plan covers full time employees and provides for a base employer contribution of 4.5% of salary plus an additional matching contribution of 50% of employee contributions up to 5% (for a maximum employer contribution of 7% of salary). The Company’s cash contributions related to this plan for each of the fiscal years ending 2014, 2013 and 2012 totaled $0.2 million.
Defined Benefit Plans
The Company has a defined benefit plan in Canada and a defined benefit plan in the United States. Benefits under these plans are based on specified amounts per year of credited service. The Company funds these plans in accordance with the funding requirements of local law and regulations.
Effective March 31, 2014, the Company amended its Alabama Union Employees’ Pension Plan (“Alabama Plan”) to freeze participant benefits and close the plan to new participants. Benefits under the frozen plan are based on years of service. Additionally, during the fourth quarter of fiscal 2014, the Company terminated employment with certain members of the Alabama Plan and paid each a lump sum payment. Due to the volume of lump sum payments processed during the fiscal year, the Company incurred a pension curtailment settlement loss.
The components of the net periodic pension costs for the Canadian defined benefit plan and the AEP Alabama Plan in fiscal 2014, 2013 and 2012, are as follows:
| For the Years Ended October 31, |
||||||||||||
| 2014 | 2013 | 2012 | ||||||||||
| (in thousands) | ||||||||||||
| Service cost |
$ | 276 | $ | 433 | $ | 336 | ||||||
| Interest cost |
388 | 367 | 375 | |||||||||
| Expected return on assets |
(440 | ) | (380 | ) | (355 | ) | ||||||
| Curtailment, settlement loss |
53 | — | — | |||||||||
| Amortization of net actuarial loss |
56 | 117 | 52 | |||||||||
| Amortization of prior service cost |
119 | 125 | 128 | |||||||||
|
|
|
|
|
|
|
|||||||
| Net periodic pension cost |
$ | 452 | $ | 662 | $ | 536 | ||||||
|
|
|
|
|
|
|
|||||||
72
Table of Contents
AEP INDUSTRIES INC.
NOTES TO CONSOLIDATED FINANCIAL STATEMENTS (Continued)
| (9) | Pensions and Retirement Savings Plan (Continued) |
The estimated net actuarial loss and prior service cost that will be amortized from accumulated other comprehensive (loss) income into net periodic pension cost in fiscal 2015 are:
| (in thousands) | ||||
| Amortization of prior service cost |
$ | 116 | ||
| Amortization of net actuarial loss |
50 | |||
|
|
|
|||
| Total |
$ | 166 | ||
|
|
|
|||
A reconciliation of the change in benefit obligation, the change in plan assets and the net amount recognized in the consolidated balance sheets for the Canadian defined benefit plan and the U.S. defined benefit plan is shown below (based on an October 31 measurement date):
| October 31, | ||||||||
| 2014 | 2013 | |||||||
| (in thousands) | ||||||||
| Change in benefit obligation: |
||||||||
| Pension benefit obligation at beginning of year |
$ | 8,443 | $ | 8,702 | ||||
| Service cost |
276 | 433 | ||||||
| Interest cost |
388 | 367 | ||||||
| Benefit and expense payments |
(559 | ) | (562 | ) | ||||
| Settlements |
53 | — | ||||||
| Plan amendments |
26 | — | ||||||
| Actuarial (gains) losses |
549 | (244 | ) | |||||
| Foreign currency exchange rate impact |
(468 | ) | (253 | ) | ||||
|
|
|
|
|
|||||
| Pension benefit obligation at end of year |
8,708 | 8,443 | ||||||
| Change in plan assets: |
||||||||
| Fair value of plan assets at beginning of year |
7,187 | 6,281 | ||||||
| Company contributions |
562 | 790 | ||||||
| Benefit and expense payments |
(559 | ) | (562 | ) | ||||
| Actual return on plan assets |
735 | 913 | ||||||
| Foreign currency exchange rate impact |
(461 | ) | (235 | ) | ||||
|
|
|
|
|
|||||
| Fair value of plan assets at end of year |
7,464 | 7,187 | ||||||
|
|
|
|
|
|||||
| Funded status—consolidated |
(1,244 | ) | (1,256 | ) | ||||
|
|
|
|
|
|||||
| Funded status—Canada |
36 | (200 | ) | |||||
|
|
|
|
|
|||||
| Funded status—U.S. |
(1,280 | ) | (1,056 | ) | ||||
|
|
|
|
|
|||||
| Amounts recognized in the consolidated balance sheets consist of: |
||||||||
| Other long-term liabilities |
(1,244 | ) | (1,256 | ) | ||||
| Amounts recognized in accumulated other comprehensive (loss) income: |
||||||||
| Prior service cost |
(630 | ) | (778 | ) | ||||
| Net actuarial loss |
(1,488 | ) | (1,383 | ) | ||||
| Tax effect |
577 | 559 | ||||||
|
|
|
|
|
|||||
| Net amount recognized, after tax |
$ | (1,541 | ) | $ | (1,602 | ) | ||
|
|
|
|
|
|||||
| Accumulated benefit obligation |
$ | 8,708 | $ | 8,443 | ||||
|
|
|
|
|
|||||
73
Table of Contents
AEP INDUSTRIES INC.
NOTES TO CONSOLIDATED FINANCIAL STATEMENTS (Continued)
| (9) | Pensions and Retirement Savings Plan (Continued) |
The components recognized (pre-tax) in accumulated other comprehensive (loss) income remained relatively flat during fiscal 2014 as compared to fiscal 2013 and consisted of actuarial losses arising during the year primarily as a result of a decrease in the discount rate partially offset by a better than expected return on plan assets during 2014, and further offset by amortization of prior service cost and net actuarial losses and by foreign exchange impact.
Investment Policy:
It is the objective of the plan sponsor to maintain an adequate level of diversification to balance market risk, to prudently invest to preserve capital and to provide sufficient liquidity while maximizing earnings for near-term payments of benefits accrued under the plans and to pay plan administrative expenses. The assumption used for the expected long-term rate of return on plan assets is based on the long-term expected returns for the investment mix of assets currently in the portfolio. Historical return trends for the various asset classes in the class portfolio are combined with anticipated future market conditions to estimate the rate of return for each class. These rates are then adjusted for anticipated future inflation to determine estimated nominal rates of return for each class. The following table presents the weighted average actual asset allocations as of October 31, 2014 and 2013 and the target allocation of pension plan assets for fiscal 2015:
| October 31, | Target | |||||||||||
| 2014 | 2013 | Allocation | ||||||||||
| Equity securities |
62 | % | 62 | % | 61 | % | ||||||
| Debt securities |
32 | % | 32 | % | 35 | % | ||||||
| Other |
6 | % | 6 | % | 4 | % | ||||||
|
|
|
|
|
|
|
|||||||
| Total |
100 | % | 100 | % | 100 | % | ||||||
|
|
|
|
|
|
|
|||||||
The weighted-average assumptions that were used to determine the Company’s benefit obligations as of the measurement date (October 31) were as follows:
| October 31, | ||||||||||||
| 2014 | 2013 | 2012 | ||||||||||
| Discount rate |
4 | % | 5 | % | 4 | % | ||||||
| Salary progression rate |
0 | % | 0 | % | 0 | % | ||||||
The discount rates used for the defined benefit plans in Canada and for U.S. are based on high quality AA-rated corporate bonds with durations corresponding to the expected durations of the benefit obligations.
The weighted-average assumptions that were used to determine the Company’s net periodic benefit cost were as follows:
| October 31, | ||||||||||||
| 2014 | 2013 | 2012 | ||||||||||
| Discount rate |
5 | % | 4 | % | 5 | % | ||||||
| Salary progression rate |
0 | % | 0 | % | 0 | % | ||||||
| Expected long-term rate of return on plan assets |
6 | % | 6 | % | 6 | % | ||||||
74
Table of Contents
AEP INDUSTRIES INC.
NOTES TO CONSOLIDATED FINANCIAL STATEMENTS (Continued)
| (9) | Pensions and Retirement Savings Plan (Continued) |
The overall expected long-term rate of return on plan assets is a weighted-average expectation based on the targeted portfolio composition. Historical experience and current benchmarks are considered to arrive at expected long-term rates of return in each asset category.
The Company expects the following benefit payments to be paid out of the Canada and U.S. plans for the fiscal years indicated. The expected benefit payments are based on the same assumptions used to measure the Company’s benefit obligation at October 31, 2014 and include estimated future employee service. The Company does not expect any plan assets to be returned to it during fiscal 2015. Payments from the pension plan are made from the plan assets.
| (in thousands) | ||||
| 2015 |
$ | 204 | ||
| 2016 |
264 | |||
| 2017 |
302 | |||
| 2018 |
355 | |||
| 2019 |
409 | |||
| 2020-2024, in the aggregate |
3,085 | |||
During fiscal 2015, the Company expects to contribute $0.4 million to its Canada defined benefit plan and $0.1 million to the U.S. defined benefit plan.
The fair values by category of inputs as of October 31, 2014 were as follows:
| Fair Value as of October 31, 2014 |
Quoted Prices in Active Markets for Identical Assets (Level 1) |
Significant Observable Inputs (Level 2) |
Significant Unobservable Inputs (Level 3) |
|||||||||||||
| (Amounts in thousands) | ||||||||||||||||
| Cash |
$ | 431 | $ | 19 | $ | 412 | $ | — | ||||||||
| Equity securities |
4,671 | 820 | 3,851 | — | ||||||||||||
| U.S. Government securities |
— | — | — | — | ||||||||||||
| Fixed income/debt securities |
2,327 | 356 | 1,971 | — | ||||||||||||
| Other |
35 | — | 35 | — | ||||||||||||
|
|
|
|
|
|
|
|
|
|||||||||
| Total |
$ | 7,464 | $ | 1,195 | $ | 6,269 | $ | — | ||||||||
|
|
|
|
|
|
|
|
|
|||||||||
75
Table of Contents
AEP INDUSTRIES INC.
NOTES TO CONSOLIDATED FINANCIAL STATEMENTS (Continued)
| (9) | Pensions and Retirement Savings Plan (Continued) |
The fair values by category of inputs as of October 31, 2013 were as follows:
| Fair Value as of October 31, 2013 |
Quoted Prices in Active Markets for Identical Assets (Level 1) |
Significant Observable Inputs (Level 2) |
Significant Unobservable Inputs (Level 3) |
|||||||||||||
| (Amounts in thousands) | ||||||||||||||||
| Cash |
$ | 388 | $ | 79 | $ | 309 | $ | — | ||||||||
| Equity securities |
4,436 | 852 | 3,584 | — | ||||||||||||
| U.S. Government securities |
60 | 60 | — | — | ||||||||||||
| Fixed income/debt securities |
2,260 | 389 | 1,871 | — | ||||||||||||
| Other |
43 | — | 43 | — | ||||||||||||
|
|
|
|
|
|
|
|
|
|||||||||
| Total |
$ | 7,187 | $ | 1,380 | $ | 5,807 | $ | — | ||||||||
|
|
|
|
|
|
|
|
|
|||||||||
| (10) | Shareholders’ Equity |
Share-Based Compensation
The Company has a share-based plan which provides for the granting of stock options, restricted stock, performance units and other awards to officers, directors and key employees of the Company. Total share-based compensation expense related to the Company’s share-based plans is recorded in the consolidated statements of operations as follows:
| For the Years Ended October 31, |
||||||||||||
| 2014 | 2013 | 2012 | ||||||||||
| (in thousands) | ||||||||||||
| Cost of sales |
$ | 86 | $ | 598 | $ | 1,111 | ||||||
| Selling expense |
103 | 649 | 1,253 | |||||||||
| General and administrative expense |
884 | 2,813 | 4,529 | |||||||||
|
|
|
|
|
|
|
|||||||
| Total |
$ | 1,073 | $ | 4,060 | $ | 6,893 | ||||||
|
|
|
|
|
|
|
|||||||
Shared-Based Plans
At the annual meeting of stockholders of the Company on April 9, 2013, stockholders approved the AEP Industries Inc. 2013 Omnibus Incentive Plan (the “2013 Plan”). The 2013 Plan provides for the award to non-employee directors and key employees of the Company of options, restricted stock, restricted stock units, stock appreciation rights, performance awards (which may take the form of performance units or performance shares) and other awards to acquire up to an aggregate of 375,000 shares of the Company’s common stock. These shares of common stock may be made available from authorized but unissued common stock, from treasury shares or from shares purchased on the open market. The issuance of common stock resulting from the exercise of stock options and settlement of the vesting of performance units (for those employees who elected shares) during fiscal 2014 and 2013 was made from new shares.
76
Table of Contents
AEP INDUSTRIES INC.
NOTES TO CONSOLIDATED FINANCIAL STATEMENTS (Continued)
| (10) | Shareholders’ Equity (Continued) |
As a result of stockholder approval of the 2013 Plan, all awards of stock and stock unit awards subsequent to April 9, 2013 have been granted under the 2013 Plan and no new awards have been made after such date under the AEP Industries Inc. 2005 Stock Option Plan (the “2005 Option Plan”), which expired in October 2013 except as to awards previously granted prior to that date. At October 31, 2014, 362,727 shares were available to be issued under the 2013 Plan.
Stock Options
The fair value of options granted is estimated on the date of grant using a Black-Scholes options pricing model. Expected volatilities are calculated based on the historical volatility of the Company’s stock. Management monitors stock option exercise and employee termination patterns to estimate forfeitures rates within the valuation model. Separate groups of employees, including executive officers and directors, that have similar historical exercise behavior are considered separately for valuation purposes. The expected holding period of stock options represents the period of time that stock options granted are expected to be outstanding. The risk-free interest rate is based on the Treasury note interest rate in effect on the date of grant for the expected term of the stock option.
There were no options granted during the years ended October 31, 2014 and 2013.
The table below presents the weighted average assumptions used to calculate the fair value of stock options granted during the year ended October 31, 2012.
| Expected volatility |
42.43 | % | ||
| Expected life in years |
7.5 | |||
| Risk-free interest rates |
1.43 | % | ||
| Dividend rate |
0 | % | ||
| Weighted average fair value per option at date of grant |
$ | 15.79 |
77
Table of Contents
AEP INDUSTRIES INC.
NOTES TO CONSOLIDATED FINANCIAL STATEMENTS (Continued)
| (10) | Shareholders’ Equity (Continued) |
The following table summarizes the Company’s stock option plans as of October 31, 2014 and changes during each of the years in the three year period ended October 31, 2014:
| 1995 Option Plan |
2005 Option Plan |
Total Number Of Options |
Weighted Average Exercise Price per Option |
Option Price Per Share |
Weighted Average Remaining Contractual Term (years) |
Aggregate Intrinsic Value $(000) |
||||||||||||||||||||||
| Options outstanding at October 31, 2011 (142,832 options exercisable) |
142,832 | 85,000 | 227,832 | $ | 23.07 | $ | 7.87-42.60 | |||||||||||||||||||||
| Granted |
— | 12,000 | 12,000 | $ | 33.67 | $ | 33.67 | |||||||||||||||||||||
| Exercised |
(84,473 | )(a) | (9,000 | ) | (93,473 | ) | $ | 25.32 | $ | 7.87-33.84 | ||||||||||||||||||
| Forfeited/Cancelled |
— | (2,000 | ) | (2,000 | ) | $ | 42.60 | $ | 42.60 | |||||||||||||||||||
| Expired |
(1,000 | ) | — | (1,000 | ) | $ | 32.80 | $ | 32.80 | |||||||||||||||||||
|
|
|
|
|
|
|
|||||||||||||||||||||||
| Options outstanding at October 31, 2012 (108,959 options exercisable) |
57,359 | 86,000 | 143,359 | $ | 22.15 | $ | 9.30-42.60 | |||||||||||||||||||||
| Granted |
— | — | — | — | — | |||||||||||||||||||||||
| Exercised |
(57,359 | ) | (13,554 | )(b) | (70,913 | ) | $ | 14.51 | $ | 9.30-38.10 | ||||||||||||||||||
| Forfeited/Cancelled |
— | — | — | — | — | |||||||||||||||||||||||
| Expired |
— | — | — | — | — | |||||||||||||||||||||||
|
|
|
|
|
|
|
|||||||||||||||||||||||
| Options outstanding at October 31, 2013 (50,846 options exercisable) |
— | 72,446 | 72,446 | $ | 29.62 | $ | 17.07-42.60 | 4.5 | $ | 2,159 | ||||||||||||||||||
| Granted |
— | — | — | — | — | |||||||||||||||||||||||
| Exercised |
— | — | — | — | — | |||||||||||||||||||||||
| Forfeited/Cancelled |
— | — | — | — | — | |||||||||||||||||||||||
| Expired |
— | — | — | — | — | |||||||||||||||||||||||
|
|
|
|
|
|
|
|||||||||||||||||||||||
| Options outstanding at October 31, 2014 |
— | 72,446 | 72,446 | $ | 29.62 | $ | 17.07-$42.60 | 3.7 | $ | 1,186 | ||||||||||||||||||
|
|
|
|
|
|
|
|||||||||||||||||||||||
| Vested and expected to vest at October 31, 2014 |
— | 72,446 | 72,446 | $ | 29.62 | 3.7 | $ | 1,186 | ||||||||||||||||||||
|
|
|
|
|
|
|
|||||||||||||||||||||||
| Exercisable at October 31, 2014 |
— | 61,646 | 61,646 | $ | 29.36 | 3.2 | $ | 1,025 | ||||||||||||||||||||
|
|
|
|
|
|
|
|||||||||||||||||||||||
| (a) | Includes 3,419 options exercised at an exercise price of $9.30 per option and 59,180 options exercised at an exercise price of $31.60 per option for which 54,405 shares of common stock of the Company were tendered to the Company by the holder of the stock options for the payment of the exercise price of these options. |
| (b) | Includes 12,000 options exercised at an exercise price of $38.10 per option for which 6,096 shares of common stock of the Company were tendered to the Company by the holder of the stock options for the payment of the exercise price of these options. |
78
Table of Contents
AEP INDUSTRIES INC.
NOTES TO CONSOLIDATED FINANCIAL STATEMENTS (Continued)
| (10) | Shareholders’ Equity (Continued) |
The table below presents information related to stock option activity for the years ended October 31, 2014, 2013 and 2012:
| For the Years Ended October 31, |
||||||||||||
| 2014 | 2013 | 2012 | ||||||||||
| (in thousands) | ||||||||||||
| Total intrinsic value of stock options exercised |
$ | — | $ | 4,158 | $ | 951 | ||||||
| Total fair value of stock options vested |
$ | 155 | $ | 210 | $ | 229 | ||||||
The fair value of the options, less expected forfeitures, is amortized over five years on a straight-line basis. Share-based compensation expense related to the Company’s stock options recorded in the consolidated statements of operations for the years ended October 31, 2014, 2013 and 2012 was $0.1 million, $0.2 million and $0.2 million, respectively. No compensation cost related to stock options was capitalized in inventory or any other assets for the years ended October 31, 2014, 2013 and 2012, respectively. For fiscal 2014 and 2013, there were no excess tax benefits recognized resulting from share-based compensation awards as the Company was not in a federal tax paying position during those periods. For fiscal 2012, there was $1.3 million in excess tax benefits recognized resulting from share-based compensation awards, which reduced taxes otherwise payable, and is included in additional paid in capital at October 31, 2014 and October 31, 2013, respectively.
As of October 31, 2014, there was $0.1 million of total unrecognized compensation cost related to non-vested stock options granted under the plans. That cost is expected to be recognized over a weighted-average period of 2.0 years.
Non-vested Stock Options
A summary of the Company’s non-vested stock options at October 31, 2014 and changes during fiscal 2014 are presented below:
| Non-vested stock options |
Shares | Weighted Average Grant Date Fair Value |
||||||
| Non-vested at October 31, 2013 |
21,600 | $ | 14.86 | |||||
| Granted |
— | — | ||||||
| Vested |
(10,800 | ) | $ | 14.36 | ||||
| Forfeited |
— | — | ||||||
|
|
|
|||||||
| Non-vested at October 31, 2014 |
10,800 | $ | 15.36 | |||||
|
|
|
|||||||
Performance Units
The 2013 Plan provides for, and the 2005 Option Plan provided for, the granting of Board approved performance units (“Units”). Outstanding Units are subject to forfeiture based on an annual Adjusted EBITDA performance goal, as determined and adjusted by the Board. If the Company’s Adjusted EBITDA equals or exceeds the performance goal, no Units will be forfeited. If the Company’s Adjusted EBITDA is between 80% and less than 100% of the performance goal, such employee will forfeit such number of Units equal to (a) the Units granted multiplied by (b) the percentage Adjusted
79
Table of Contents
AEP INDUSTRIES INC.
NOTES TO CONSOLIDATED FINANCIAL STATEMENTS (Continued)
| (10) | Shareholders’ Equity (Continued) |
EBITDA is less than the performance goal. If Adjusted EBITDA is below 80% of the performance goal, the employee will forfeit all Units. Subsequent to the satisfaction of the performance goal, the vesting of the Units will occur equally over five years on the first through the fifth anniversaries of the grant date, provided that such person continues to be employed by the Company on such respective dates. For each Unit, upon vesting and the satisfaction of any required tax withholding obligation, the employee has the option to receive one share of the Company’s common stock, the equivalent cash value or a combination of both.
For Units granted under the 2005 Option Plan, the Units will immediately vest in the event of (1) the death of an employee, (2) the permanent disability of an employee (within the meaning of the Internal Revenue Code of 1986, as amended) or (3) a termination of employment due to the disposition of any asset, division, subsidiary, business unit, product line or group of the Company or any of its affiliates. In the case of any other termination, any unvested performance units will be forfeited. Notwithstanding the foregoing, the Compensation Committee retains discretionary authority at any time, including immediately prior to or upon a change of control, to accelerate the vesting of any award.
For Units granted under the 2013 Plan, if a participant dies during the performance year, the Compensation Committee has the discretion to waive all or a portion of the performance conditions of the Units and any earned Units will be fully vested. If a participant dies after the end of the performance year, all earned Units will become immediately vested upon death. If a participant is terminated for disability during the performance year, the Compensation Committee has the discretion to waive all or a portion of the performance conditions of the Units and to waive all or a portion of the vesting conditions. If a participant is terminated for disability after the performance year, the Compensation Committee has the discretion to waive all or a portion of the vesting conditions. If a participant retires or is terminated by the Company without cause (each as defined in the 2013 Plan) during the performance year, the Compensation Committee has the discretion to permit the participant to receive a pro rata portion of the earned Units based on the Company’s actual performance at the end of the performance year, and has the discretion to waive all or a portion of the vesting conditions. If a participant retires or is terminated by the Company without cause after the performance year, the Compensation Committee has the discretion to waive all or a portion of the vesting conditions. In the event of a change in control (as defined in the 2013 plan) or immediately prior to such event during the performance year, the Compensation Committee has the discretion to permit the participant to receive a pro rata portion of the earned Units based on a calculation specified in the award agreement and to waive all or a portion of the vesting conditions. In the event of a change in control (as defined in the 2013 plan) or immediately prior to such event after the performance year, the Compensation Committee has the discretion to waive all or a portion of the vesting conditions. Upon the occurrence of any other termination of service, any unearned or unvested Units will be forfeited.
Total share-based compensation expense related to the Units was $0.7 million, $3.7 million and $6.7 million for the years ended October 31, 2014, 2013 and 2012, respectively. During the year ended October 31, 2014, the Company paid $2.4 million in cash and issued 1,067 shares of its common stock, in each case net of withholdings, in settlement of the vesting of Units occurring during fiscal 2014. During the year ended October 31, 2013, the Company paid $2.5 million in cash and issued 757 shares of its common stock, in each case net of withholdings, in settlement of the vesting of the Units occurring during fiscal 2013. During the year ended October 31, 2012, the Company paid $0.9 million
80
Table of Contents
AEP INDUSTRIES INC.
NOTES TO CONSOLIDATED FINANCIAL STATEMENTS (Continued)
| (10) | Shareholders’ Equity (Continued) |
in cash and issued 1,591 shares of its common stock, in each case net of withholdings, in settlement of the vesting of Units occurring during fiscal 2012. At October 31, 2014 and October 31, 2013, there was $1.9 million and $4.0 million in accrued expenses and $2.3 million and $3.4 million in long-term liabilities, respectively, related to outstanding Units.
The following table summarizes the Units as of October 31, 2014 and changes during each of the three year periods ended October 31, 2014:
| 2005 Option Plan |
2013 Option Plan |
Total Number Of Units |
Weighted Average Exercise Price |
Weighted Average Remaining Contractual Term (years) |
Aggregate Intrinsic Value $(000) |
|||||||||||||||||||||||
| Units outstanding at October 31, 2011 |
147,891 | — | 147,891 | |||||||||||||||||||||||||
| Unites granted |
134,066 | (a) | — | 134,066 | ||||||||||||||||||||||||
| Units exercised |
(46,165 | ) | — | (46,165 | ) | $ | 0.00 | $ | 1,315 | |||||||||||||||||||
| Units forfeited or cancelled |
(1,800 | ) | — | (1,800 | ) | |||||||||||||||||||||||
|
|
|
|
|
|
|
|||||||||||||||||||||||
| Units outstanding at October 31, 2012 |
233,992 | — | 233,992 | |||||||||||||||||||||||||
| Units granted |
45,258 | (b) | — | 45,258 | ||||||||||||||||||||||||
| Units exercised |
(66,635 | ) | — | (66,635 | ) | $ | 0.00 | $ | 4,068 | |||||||||||||||||||
| Units forfeited or cancelled |
(8,454 | )(b) | — | (8,454 | ) | |||||||||||||||||||||||
|
|
|
|
|
|
|
|||||||||||||||||||||||
| Units outstanding at October 31, 2013 |
204,161 | — | 204,161 | 1.5 | $ | 12,134 | ||||||||||||||||||||||
| Units granted |
— | 52,896 | (c) | 52,896 | $ | 0.00 | ||||||||||||||||||||||
| Units exercised |
(73,650 | ) | — | (73,650 | ) | $ | 0.00 | $ | 3,890 | |||||||||||||||||||
| Units forfeited or cancelled |
(1,200 | ) | (52,896 | )(c) | (54,096 | ) | ||||||||||||||||||||||
|
|
|
|
|
|
|
|||||||||||||||||||||||
| Units outstanding at October 31, 2014 (250 Units exercisable) |
129,311 | — | 129,311 | $ | 0.00 | 1.2 | $ | 5,942 | ||||||||||||||||||||
|
|
|
|
|
|
|
|||||||||||||||||||||||
| Vested and expected to vest at October 31, 2014 |
126,911 | — | 126,911 | $ | 0.00 | 1.2 | $ | 5,832 | ||||||||||||||||||||
|
|
|
|
|
|
|
|||||||||||||||||||||||
| Exercisable at October 31, 2014 |
600 | (d) | — | 600 | $ | 0.00 | $ | 23 | ||||||||||||||||||||
|
|
|
|
|
|
|
|||||||||||||||||||||||
| (a) | More than 100% of the fiscal 2012 Adjusted EBITDA goal was achieved. |
| (b) | 93.5% of the fiscal 2013 Adjusted EBITDA goal was achieved, and therefore, 2,954 Units were forfeited. |
| (c) | The Units in fiscal 2014 were forfeited in its entirety because the Company did not achieve at least 80% of the Adjusted EBITDA performance goal in such fiscal year. |
| (d) | These Units immediately vested during the fourth quarter of 2014 due to the death of an employee. The Company is awaiting payout of Units to the estate. |
81
Table of Contents
AEP INDUSTRIES INC.
NOTES TO CONSOLIDATED FINANCIAL STATEMENTS (Continued)
| (10) | Shareholders’ Equity (Continued) |
Restricted Stock
In accordance with the revised non-employee director compensation program beginning in fiscal 2013, each non-employee director receives an annual restricted stock award with a grant date fair value of $55,000 under the 2013 Plan (4,698 shares and 7,575 shares granted, in aggregate, on April 12, 2013 and April 8, 2014, respectively). During the one-year restricted period, the restricted stock entitles the participant to all of the rights of a stockholder, including the right to vote the shares and the right to receive any dividends thereon. Prior to the end of the restricted period, restricted stock generally may not be sold, assigned, pledged, or otherwise disposed of or hypothecated by participants.
The share-based compensation expense associated with the restricted stock is based on the quoted market price of the Company’s common stock on the date of grant. The Company recognizes share-based compensation associated with the restricted stock on a straight-line basis over the term which is one year. Total share-based compensation expense related to the restricted stock recorded in the consolidated statements of operations for the years ended October 31, 2014 and 2013 was $0.3 million and $0.2 million, respectively. As of October 31, 2014, there was $0.1 million of total unrecognized compensation cost related to restricted stock. That cost is expected to be recognized over five months.
Treasury Shares
In February 2014 the Company’s Board of Directors authorized a stock repurchase program (the “February 2014 Stock Repurchase Program”) under which the Company could purchase up to $10.0 million of the Company’s common stock. Repurchases could be made in the open market, in privately negotiated transactions or by other means, from time to time, subject to market conditions, applicable legal requirements and other factors, including the limitations set forth in the Company’s debt covenants.
In March 2014, the Company repurchased under its February 2014 Stock Repurchase Program, 21,312 shares of its common stock in the open market at an average cost of $40.99 per share, totaling $0.9 million. On April 8, 2014, the Board approved an increase to the February 2014 Stock Repurchase Program, which had approximately $9.1 million remaining available for repurchases, to $19.1 million (an increase of $10.0 million). On April 21, 2014, the Company repurchased 508,000 shares of its common stock (the “Purchase”) owned by Crown Cork & Seal Company, Inc. Pension Plan (“Crown”) for approximately $19.1 million (priced at a 1% discount to a mid-day market price on Nasdaq on April 3, 2014, the date that agreement was reached as to the purchase price). The Purchase was made pursuant to a purchase agreement by and between the Company and KSA Capital Management, LLC, which had investment discretion over the purchased shares pursuant to an investment management agreement between KSA Capital Management, LLC and Crown. Following such transaction, there is no amount available for repurchases under the Company’s February 2014 Stock Repurchase Program.
Preferred Shares
The Board may direct the issuance of up to one million shares of the Company’s $1.00 par value Preferred Stock and may, at the time of issuance, determine the rights, preferences and limitations of each series.
On March 28, 2014, the Company adopted an amended and restated stockholder rights plan (the “Rights Plan”), which entitles the holders of the rights to purchase from the Company 1/1,000th of a
82
Table of Contents
AEP INDUSTRIES INC.
NOTES TO CONSOLIDATED FINANCIAL STATEMENTS (Continued)
| (10) | Shareholders’ Equity (Continued) |
share of Series A Junior Participating Preferred Stock, par value $1.00 per share, at a purchase price of $330.00 per share, as adjusted (a “Right”), upon certain trigger events. The Rights Plan amends and restates in its entirety that certain rights plan dated as of March 31, 2011. The Company’s Board declared a dividend of one Right per each share of common stock of the Company outstanding as of April 11, 2011. Rights are also issued in respect of all shares of common stock issued by the Company thereafter, prior to the distribution date or expiration date (each as defined in the Rights Plan), or in accordance with other specified events set forth in the Rights Plan. Each 1/1,000th of a share of Series A Junior Participating Preferred Stock has terms that are substantially the economic and voting equivalent of one share of the Company’s common stock. However, until a Right is exercised or exchanged in accordance with the provisions of the Rights Plan, the holder thereof will have no rights as a stockholder of the Company. The Rights Plan has a three-year term ending March 31, 2017 and the Board may terminate the Rights Plan at any time (subject to the redemption of the Rights for a nominal value). The Rights may cause substantial dilution to a person or group (together with all affiliates and associates of such person or group and any person or group of persons acting in concert therewith) that acquires beneficial ownership of 10% or more of the Company’s stock on terms not approved by the Board or takes other specified actions.
| (11) | Income Taxes |
The U.S. and foreign components of (loss) income, which includes a gain of $1.0 million from bargain purchase of a business in fiscal 2013, before benefit (provision) for income taxes are as follows:
| For the Years
Ended October 31, |
||||||||||||
| 2014 | 2013 | 2012 | ||||||||||
| (in thousands) | ||||||||||||
| U.S. |
$ | (12,403 | ) | $ | 10,122 | $ | 32,244 | |||||
| Foreign |
2,963 | 5,841 | 5,156 | |||||||||
|
|
|
|
|
|
|
|||||||
| Total |
$ | (9,440 | ) | $ | 15,963 | $ | 37,400 | |||||
|
|
|
|
|
|
|
|||||||
83
Table of Contents
AEP INDUSTRIES INC.
NOTES TO CONSOLIDATED FINANCIAL STATEMENTS (Continued)
| (11) | Income Taxes (Continued) |
The benefit (provision) for income taxes is summarized as follows:
| For the Years
Ended October 31, |
||||||||||||
| 2014 | 2013 | 2012 | ||||||||||
| (in thousands) | ||||||||||||
| Current: |
||||||||||||
| Federal |
$ | (108 | ) | $ | 15 | $ | (679 | ) | ||||
| State |
206 | (689 | ) | (1,211 | ) | |||||||
| Foreign |
(952 | ) | (1,598 | ) | (1,315 | ) | ||||||
|
|
|
|
|
|
|
|||||||
| (854 | ) | (2,272 | ) | (3,205 | ) | |||||||
|
|
|
|
|
|
|
|||||||
| Deferred: |
||||||||||||
| Federal |
4,412 | (2,911 | ) | (9,237 | ) | |||||||
| State |
475 | 272 | (833 | ) | ||||||||
| Foreign |
(99 | ) | (304 | ) | (973 | ) | ||||||
|
|
|
|
|
|
|
|||||||
| 4,788 | (2,943 | ) | (11,043 | ) | ||||||||
|
|
|
|
|
|
|
|||||||
| Total benefit (provision) for income taxes |
$ | 3,934 | $ | (5,215 | ) | $ | (14,248 | ) | ||||
|
|
|
|
|
|
|
|||||||
The Company has $14.2 million of undistributed earnings from its Canadian subsidiary at October 31, 2014 after it received a dividend payment of $8.2 million in April 2014. It is anticipated that the balance of these earnings will be remitted in the foreseeable future and the Company has accrued taxes attributable to the repatriation resulting in a net liability of $6.9 million at October 31, 2014. The net liability or tax cost of the repatriation, other than $0.7 million of withholding taxes, will be offset by available foreign tax credits. Undistributed earnings of the Company’s foreign subsidiaries (primarily Canada) were $21.7 million at October 31, 2013.
84
Table of Contents
AEP INDUSTRIES INC.
NOTES TO CONSOLIDATED FINANCIAL STATEMENTS (Continued)
| (11) | Income Taxes (Continued) |
The tax effects of significant temporary differences that comprise the deferred tax assets (liabilities) at October 31, 2014 and 2013 are as follows:
| October 31, | ||||||||
| 2014 | 2013 | |||||||
| (in thousands) | ||||||||
| Deferred income tax assets: |
||||||||
| Allowance for doubtful accounts |
$ | 1,178 | $ | 528 | ||||
| Inventories |
851 | 979 | ||||||
| Alternative minimum tax credits carryforwards |
6,421 | 6,317 | ||||||
| State net operating loss carryforwards |
1,658 | 1,458 | ||||||
| Net operating loss carryforwards |
— | 3,088 | ||||||
| Capital loss carryforwards |
30 | 30 | ||||||
| Foreign tax credits carryforwards |
14,527 | 13,665 | ||||||
| Other |
4,614 | 6,013 | ||||||
|
|
|
|
|
|||||
| Total gross deferred tax assets |
29,279 | 32,078 | ||||||
| Valuation allowance |
(30 | ) | (30 | ) | ||||
|
|
|
|
|
|||||
| Total net deferred tax asset |
$ | 29,249 | $ | 32,048 | ||||
| Deferred tax liabilities: |
||||||||
| Depreciation |
$ | (25,753 | ) | $ | (28,874 | ) | ||
| Deferred tax liability on undistributed earnings of foreign subsidiary |
(7,650 | ) | (11,818 | ) | ||||
| Deferred gain on redemption of senior notes |
(2,037 | ) | (2,065 | ) | ||||
| Basis differences related to acquisition |
(5,270 | ) | (5,342 | ) | ||||
| Other |
(2,164 | ) | (3,259 | ) | ||||
|
|
|
|
|
|||||
| Total gross deferred tax liabilities |
$ | (42,874 | ) | $ | (51,358 | ) | ||
|
|
|
|
|
|||||
| Total net deferred tax liabilities |
$ | (13,625 | ) | $ | (19,310 | ) | ||
|
|
|
|
|
|||||
Valuation allowances reduced the deferred tax assets attributable to capital loss carryforwards to an amount that, based on all available information, is more likely than not to be realized. The valuation allowance was $30,000 at October 31, 2014 and October 31, 2013.
85
Table of Contents
AEP INDUSTRIES INC.
NOTES TO CONSOLIDATED FINANCIAL STATEMENTS (Continued)
| (11) | Income Taxes (Continued) |
Net operating loss carryforwards, capital loss carryforwards, foreign tax credits and alternative minimum tax credits, before valuation allowances, at October 31, 2014 expire as follows:
| Related Tax Amount |
Deferred Tax Asset |
Expiration Date | ||||||||
| (in thousands) | ||||||||||
| Loss carryforwards: |
||||||||||
| State net operating loss |
$ | 40,290 | $ | 1,658 | Fiscal 2016 - 2034 | |||||
|
|
|
|
|
|||||||
| Total net operating loss carryforwards |
$ | 40,290 | $ | 1,658 | ||||||
|
|
|
|
|
|||||||
| Capital loss carryforwards: |
||||||||||
| Canada |
$ | 240 | $ | 30 | Indefinite | |||||
|
|
|
|
|
|||||||
| Total capital loss carryforwards |
$ | 240 | $ | 30 | ||||||
|
|
|
|
|
|||||||
| Tax credit carryforwards: |
||||||||||
| Foreign tax credits |
$ | 14,527 | $ | 14,527 | Fiscal 2015 - 2024 | |||||
| Alternative minimum tax credit |
6,421 | 6,421 | Indefinite | |||||||
|
|
|
|
|
|||||||
| Total tax credit carryforwards |
$ | 20,948 | $ | 20,948 | ||||||
|
|
|
|
|
|||||||
The benefits of these carryforwards are dependent on the taxable income in those jurisdictions in which they arose, and accordingly, a valuation allowance has been provided where management has determined that it is more likely than not that the carryforwards will not be utilized. Management believes that it is more likely than not that the Company’s deferred tax assets, net of existing valuation allowances, at October 31, 2014 will be realized.
A reconciliation of the benefit (provision) for income taxes on (loss) income before benefit (provision) for income taxes to that which would be computed at the statutory rate of 35% for each of the fiscal years 2014, 2013 and 2012, is as follows:
| For the Years Ended October 31, | ||||||||||||
| 2014 | 2013 | 2012 | ||||||||||
| (in thousands) | ||||||||||||
| Provision at statutory rate |
$ | 3,304 | $ | (5,587 | ) | $ | (13,090 | ) | ||||
| State tax provision, net of federal tax benefit |
443 | (372 | ) | (1,416 | ) | |||||||
| Differential in the U.S. and Canadian statutory rate |
275 | 541 | 416 | |||||||||
| Income taxes accrued on foreign undistributed earnings |
— | (130 | ) | (1,060 | ) | |||||||
| Foreign taxes paid and accrued |
(260 | ) | (365 | ) | (1,070 | ) | ||||||
| Capital losses expired |
— | (8,103 | ) | — | ||||||||
| Net valuation allowances reversed |
— | 8,103 | 1,788 | |||||||||
| Non-taxable gain on bargain purchase |
— | 350 | — | |||||||||
| Other, net |
172 | 348 | 184 | |||||||||
|
|
|
|
|
|
|
|||||||
| Benefit (provision) for income taxes |
$ | 3,934 | $ | (5,215 | ) | $ | (14,248 | ) | ||||
|
|
|
|
|
|
|
|||||||
86
Table of Contents
AEP INDUSTRIES INC.
NOTES TO CONSOLIDATED FINANCIAL STATEMENTS (Continued)
| (11) | Income Taxes (Continued) |
As with most companies, the Company’s income tax returns are periodically audited by domestic and foreign tax authorities. These audits include questions regarding tax filing positions, including the timing and amount of deductions taken. At any time, multiple tax years are subject to audit by various tax authorities. A number of years may elapse before a particular tax position, for which a reserve has been established, is audited and fully resolved. When the actual result of a tax settlement differs from the Company’s estimated reserve for a tax position, the Company adjusts the tax contingency reserve and income tax provision.
As of October 31, 2014 and 2013, the Company’s liabilities for unrecognized tax benefits for uncertain tax positions related to certain federal deductions taken for tax purposes and state income taxes, including interest and penalties, were $49,000 and $45,000, respectively, and are included in other long term liabilities in the consolidated balance sheets. The Company classifies interest and penalties on uncertain tax positions as a component of the provision for income taxes. Interest and penalties recognized in the provision for income taxes were $3,858, $3,513, and $3,240 during fiscal 2014, 2013 and 2012, respectively.
The Company files income tax returns in the U.S. federal jurisdiction, seventeen U.S. states and various foreign jurisdictions. Tax years ended October 31, 2013, 2012 and 2011 remain open for U.S. federal taxes. Tax years ended October 31, 2013, 2012 and 2011 remain open for sixteen states. With limited exception, the Company is no longer subject to examination by states for years beginning prior to 2010. Additionally, tax years 2008 through 2013 remain open and subject to examination by the governmental agencies in the Company’s various foreign jurisdictions. The Company does not anticipate any adjustments that would have a material adverse effect on its financial position, results of operations or liquidity.
Cash paid for income taxes during fiscal 2014, 2013 and 2012 was $2.0 million, $3.2 million and $3.3 million, respectively.
| (12) | Commitments and Contingencies |
Operating Lease Commitments:
The Company has lease agreements for several of its facilities and certain of its equipment expiring at various dates through March 31, 2020. Rental expense under all leases was $8.1 million, $9.0 million and $8.0 million for fiscal 2014, 2013 and 2012, respectively. Rental income under all non-cancellable subleases was $0.5 million, $0.7 million and $0.6 million for fiscal 2014, 2013 and 2012, respectively.
87
Table of Contents
AEP INDUSTRIES INC.
NOTES TO CONSOLIDATED FINANCIAL STATEMENTS (Continued)
| (12) | Commitments and Contingencies (Continued) |
Under the terms of noncancellable operating leases with terms greater than one year (including the rental payments for the Cartersville and Fontana facilities), the minimum rental, excluding the provision for real estate taxes, is as follows:
| For the years ended October 31, |
Operating Leases |
Sublease Income |
||||||
| (in thousands) | ||||||||
| 2015 |
$ | 7,366 | $ | 90 | ||||
| 2016 |
4,822 | — | ||||||
| 2017 |
3,375 | — | ||||||
| 2018 |
1,737 | — | ||||||
| 2019 |
847 | — | ||||||
| Thereafter |
516 | — | ||||||
|
|
|
|
|
|||||
| Total minimum lease payments |
$ | 18,663 | $ | 90 | ||||
|
|
|
|
|
|||||
Claims and Lawsuits:
The Company and its subsidiaries are subject to claims and lawsuits which arise in the ordinary course of business. On the basis of information presently available and advice received from counsel representing the Company and its subsidiaries, it is the opinion of management that the disposition or ultimate determination of such claims and lawsuits against the Company will not have a material adverse effect on the Company’s financial position, results of operations, or liquidity.
Employment Contracts:
The Company has employment agreements with each of the following employees of the Company: J. Brendan Barba, Paul M. Feeney, John J. Powers, Paul C. Vegliante, Robert Cron, Lawrence R. Noll and Linda N. Guerrera. Each November 1st, these agreements are extended for successive periods of one year, unless either party gives written notice to the other at least 180 days prior to the expiration of the then current term that it does not wish to extend the agreement beyond the term. The employment agreements also include terms relating to severance upon termination or a change of control, confidentiality, non-competition, non-solicitation and other customary provisions.
John J. Powers, and Paul C. Vegliante are the sons-in-law of the Company’s Chairman, President and Chief Executive Officer, J. Brendan Barba. Additionally, Mr. Barba and Robert Cron are cousins. Linda N. Guerrera is the daughter-in-law of Paul M. Feeney, the Company’s Executive Vice President, Finance and Chief Financial Officer.
| (13) | Segment and Geographic Information |
The Company’s operations are conducted within one business segment, the production, manufacture and distribution of flexible plastic packaging products, primarily for the food/beverage, industrial and agricultural markets. The Company operates in the United States and Canada. The results reported within the Other Foreign operations relates to the Company’s New Zealand subsidiary which was liquidated in the fourth quarter of fiscal 2012.
88
Table of Contents
AEP INDUSTRIES INC.
NOTES TO CONSOLIDATED FINANCIAL STATEMENTS (Continued)
| (13) | Segment and Geographic Information (Continued) |
Income from operations includes all costs and expenses directly related to the geographical area, including intercompany interest income and expense. Identifiable assets are those used in the operations of those geographical areas.
Information about the Company’s operations by geographical area, with United States and Canada stated separately, as of and for the years ended October 31, 2014, 2013 and 2012, respectively, is as follows:
| United States | Canada | Total | ||||||||||
| (in thousands) | ||||||||||||
| 2014 |
||||||||||||
| Sales—external customers |
$ | 1,117,404 | $ | 75,586 | $ | 1,192,990 | ||||||
| Intercompany sales |
43,739 | — | 43,739 | |||||||||
| Gross profit |
109,901 | 12,004 | 121,905 | |||||||||
| Operating income |
5,448 | 4,413 | 9,861 | |||||||||
| Interest income |
17 | 67 | 84 | |||||||||
| Interest expense |
19,557 | 14 | 19,571 | |||||||||
| Depreciation and amortization |
31,244 | 263 | 31,507 | |||||||||
| Benefit (provision) for income taxes |
4,725 | (791 | ) | 3,934 | ||||||||
| Net (loss) income |
(7,678 | ) | 2,172 | (5,506 | ) | |||||||
| Provision for losses on accounts receivable, note receivable and inventories |
2,042 | 81 | 2,123 | |||||||||
| Geographical area assets |
425,533 | 21,413 | 446,946 | |||||||||
| Goodwill |
3,697 | 3,174 | 6,871 | |||||||||
| Capital expenditures |
26,353 | 190 | 26,543 | |||||||||
| United States | Canada | Total | ||||||||||
| (in thousands) | ||||||||||||
| 2013 |
||||||||||||
| Sales—external customers |
$ | 1,071,410 | $ | 72,442 | $ | 1,143,852 | ||||||
| Intercompany sales |
36,677 | — | 36,677 | |||||||||
| Gross profit |
139,263 | 15,209 | 154,472 | |||||||||
| Operating income |
26,096 | 7,220 | 33,316 | |||||||||
| Interest income |
3 | 57 | 60 | |||||||||
| Interest expense |
18,700 | 13 | 18,713 | |||||||||
| Depreciation and amortization |
28,303 | 289 | 28,592 | |||||||||
| Provision for income taxes |
(3,678 | ) | (1,537 | ) | (5,215 | ) | ||||||
| Net income |
6,444 | 4,304 | 10,748 | |||||||||
| Provision for losses on accounts receivable and inventories |
220 | 52 | 272 | |||||||||
| Geographical area assets |
440,089 | 31,474 | 471,563 | |||||||||
| Goodwill |
3,697 | 3,174 | 6,871 | |||||||||
| Capital expenditures |
46,622 | 58 | 46,680 | |||||||||
89
Table of Contents
AEP INDUSTRIES INC.
NOTES TO CONSOLIDATED FINANCIAL STATEMENTS (Continued)
| (13) | Segment and Geographic Information (Continued) |
| North America | ||||||||||||||||
| United States | Canada | Other Foreign |
Total | |||||||||||||
| (in thousands) | ||||||||||||||||
| 2012 |
||||||||||||||||
| Sales—external customers |
$ | 1,075,672 | $ | 76,863 | $ | — | $ | 1,152,535 | ||||||||
| Intercompany sales |
40,627 | — | — | 40,627 | ||||||||||||
| Gross profit |
168,566 | 14,177 | — | 182,743 | ||||||||||||
| Operating income |
49,585 | 6,063 | — | 55,648 | ||||||||||||
| Interest income |
8 | 48 | — | 56 | ||||||||||||
| Interest expense |
19,057 | 20 | — | 19,077 | ||||||||||||
| Translation adjustment reversal into income |
— | — | 692 | 692 | ||||||||||||
| Depreciation and amortization |
22,524 | 304 | — | 22,828 | ||||||||||||
| Provision for income taxes |
(13,030 | ) | (1,218 | ) | — | (14,248 | ) | |||||||||
| Net income |
19,214 | 3,245 | 693 | 23,152 | ||||||||||||
| Provision for losses on accounts receivable and inventories |
218 | 65 | — | 283 | ||||||||||||
| Geographical area assets |
411,102 | 20,341 | — | 431,443 | ||||||||||||
| Goodwill |
3,697 | 3,174 | — | 6,871 | ||||||||||||
| Capital expenditures |
41,820 | 180 | — | 42,000 | ||||||||||||
Net sales by product line are as follows:
| For the Years Ended October 31, | ||||||||||||
| 2014 | 2013 | 2012 | ||||||||||
| (in thousands) | ||||||||||||
| Custom films |
$ | 379,682 | $ | 341,608 | $ | 347,258 | ||||||
| Stretch (pallet) wrap |
361,067 | 352,125 | 337,078 | |||||||||
| Food contact |
183,366 | 185,950 | 197,205 | |||||||||
| PROformance Films® |
69,220 | 71,652 | 76,227 | |||||||||
| Canliners |
126,737 | 125,615 | 123,718 | |||||||||
| Printed and converted films |
25,648 | 25,361 | 23,105 | |||||||||
| Other products and specialty films |
47,270 | 41,541 | 47,944 | |||||||||
|
|
|
|
|
|
|
|||||||
| Total |
$ | 1,192,990 | $ | 1,143,852 | $ | 1,152,535 | ||||||
|
|
|
|
|
|
|
|||||||
| (14) | Accumulated Other Comprehensive (Loss) Income |
The accumulated balances at October 31, related to each component of accumulated other comprehensive (loss) income are as follows:
| 2014 | 2013 | 2012 | ||||||||||
| (in thousands) | ||||||||||||
| Foreign currency translation adjustments |
$ | 1,400 | $ | 2,138 | $ | 2,969 | ||||||
| Unrecognized prior service cost and actuarial losses related to Canadian and U.S. defined benefit pension plans, net of tax |
(1,541 | ) | (1,602 | ) | (2,390 | ) | ||||||
|
|
|
|
|
|
|
|||||||
| Total accumulated other comprehensive (loss) income |
$ | (141 | ) | $ | 536 | $ | 579 | |||||
|
|
|
|
|
|
|
|||||||
90
Table of Contents
AEP INDUSTRIES INC.
NOTES TO CONSOLIDATED FINANCIAL STATEMENTS (Continued)
| (14) | Accumulated Other Comprehensive (Loss) Income (Continued) |
The accumulated other comprehensive loss related to the Company’s pension plans is net of tax benefits of $0.6 million, $0.6 million and $0.9 million at October 31, 2014, 2013 and 2012, respectively.
| (15) | Related Party Transactions |
During fiscal 2014, 2013 and 2012, $71,619, zero and $373,907, was paid to Skadden, Arps, Slate, Meagher and Flom LLP, one of the Company’s outside legal counsel, in which the brother of the Company’s Vice President and Controller is a partner. At October 31, 2014 and 2013, the Company owed zero and $21,514, respectively, to Skadden, Arps, Slate, Meagher and Flom LLP.
During fiscal 2014, 2013 and 2012, $56,610, $96,325 and $79,513, was paid to D.E. Smith Corp., a company owned by the son-in-law of the Chief Financial Officer and brother-in-law of the Vice President and Controller, for the production of the Company’s Annual Report and the production of marketing brochures. At October 31, 2014 and 2013, the Company owed $18,750 and zero, respectively, to D.E. Smith Corp.
During fiscal 2014, 2013 and 2012 the Company sold $650,591, $667,483 and $564,690 of product, respectively, to Allstate Poly in which the brother of the Executive Vice President, Sales and Marketing is a partner. At October 31, 2014 and 2013, the Company was owed $140,290 and $159,877 from Allstate Poly, respectively.
| (16) | Quarterly Financial Data (Unaudited) |
| January 31, | April 30, | July 31, | October 31, | |||||||||||||
| (in thousands, except per share data) | ||||||||||||||||
| 2014 |
||||||||||||||||
| Net sales |
$ | 272,517 | $ | 294,942 | $ | 308,846 | $ | 316,685 | ||||||||
| Gross profit |
$ | 24,584 | $ | 29,992 | $ | 33,212 | $ | 34,117 | ||||||||
| Net (loss) income |
$ | (3,727 | ) | $ | (2,724 | ) | $ | 1,235 | (A) | $ | (290 | )(B) | ||||
| Basic (Loss) Earnings per Common Share: |
||||||||||||||||
| Net (loss) income per common share |
$ | (0.67 | ) | $ | (0.49 | ) | $ | 0.24 | $ | (0.06 | ) | |||||
|
|
|
|
|
|
|
|
|
|||||||||
| Diluted (Loss) Earnings per Common Share: |
||||||||||||||||
| Net (loss) income per common share |
$ | (0.67 | ) | $ | (0.49 | ) | $ | 0.24 | $ | (0.06 | ) | |||||
|
|
|
|
|
|
|
|
|
|||||||||
| January 31, | April 30,(D) | July 31, | October 31, | |||||||||||||
| 2013 |
||||||||||||||||
| Net sales |
$ | 267,142 | $ | 285,574 | $ | 291,873 | $ | 299,263 | ||||||||
| Gross profit |
$ | 42,434 | $ | 37,213 | $ | 37,669 | $ | 37,156 | ||||||||
| Net income |
$ | 6,910 | (C) | $ | 1,060 | $ | 1,788 | $ | 990 | |||||||
| Basic Earnings per Common Share: |
||||||||||||||||
| Net income per common share |
$ | 1.25 | $ | 0.19 | $ | 0.32 | $ | 0.18 | ||||||||
|
|
|
|
|
|
|
|
|
|||||||||
| Diluted Earnings per Common Share: |
||||||||||||||||
| Net income per common share |
$ | 1.23 | $ | 0.19 | $ | 0.32 | $ | 0.18 | ||||||||
|
|
|
|
|
|
|
|
|
|||||||||
91
Table of Contents
AEP INDUSTRIES INC.
NOTES TO CONSOLIDATED FINANCIAL STATEMENTS (Continued)
| (16) | Quarterly Financial Data (Unaudited) (Continued) |
Earnings per share are computed independently for each of the quarters presented.
| (A) | Includes $2.1 million in business interruption insurance recoveries resulting from damages sustained in the relocation of equipment purchased from Transco in Quebec, Canada to our Bowling Green, Kentucky facility. |
| (B) | Includes $2.0 million related to the full provision of a note receivable owed from a distributor estimated to be uncollectible. |
| (C) | Includes $1.0 million gain on bargain purchase of a business. |
| (D) | During the third quarter of fiscal 2013, the Company identified an error that originated in the second quarter of fiscal 2013 and concluded that the error was not material to the previously reported results. The immaterial misstatement was the result of a keying error at the point of applying a credit in the Company’s operating system. The Company has since implemented policies and procedures to prevent this type of error from recurring. The previously issued second quarter interim financial statements for fiscal 2013 were revised resulting in an increase to net sales. Net sales and gross profit for the three months ended April 30, 2013, were increased by $1,270,000. Net income for the three months ended April 30, 2013 was increased by $838,000. The net effect on basic and diluted net income per common share for the three months ended April 30, 2013, was an increase of $0.15 per share. |
92
Table of Contents
AEP INDUSTRIES INC.
INDEX TO FINANCIAL STATEMENT SCHEDULES
SCHEDULE
II Valuation and Qualifying Accounts
Schedules other than those listed above have been omitted either because the required information is contained in the consolidated financial statements or notes thereto or because such schedules are not required or applicable.
93
Table of Contents
AEP INDUSTRIES INC.
VALUATION AND QUALIFYING ACCOUNTS
FOR EACH OF THE YEARS IN THE THREE YEAR PERIOD ENDED OCTOBER 31, 2014
(in thousands)
| Balance at Beginning of Year |
Additions Charged to Operations |
Deductions From Reserves |
Other (a) |
Balance at End of Year |
||||||||||||||||
| YEAR ENDED OCTOBER 31, 2014: |
||||||||||||||||||||
| Allowance for doubtful accounts |
$ | 2,992 | $ | 94 | $ | 243 | $ | (12 | ) | $ | 2,831 | |||||||||
| Inventories |
$ | 115 | $ | 26 | $ | 20 | $ | (9 | ) | $ | 112 | |||||||||
| Allowance for uncollectible note receivable |
$ | — | $ | 2,003 | $ | — | $ | — | $ | 2,003 | ||||||||||
| YEAR ENDED OCTOBER 31, 2013: |
||||||||||||||||||||
| Allowance for doubtful accounts |
$ | 3,198 | $ | 260 | $ | 457 | $ | (9 | ) | $ | 2,992 | |||||||||
| Inventories |
$ | 117 | $ | 12 | $ | 8 | $ | (6 | ) | $ | 115 | |||||||||
| YEAR ENDED OCTOBER 31, 2012: |
||||||||||||||||||||
| Allowance for doubtful accounts |
$ | 3,333 | $ | 252 | $ | 389 | $ | 2 | $ | 3,198 | ||||||||||
| Inventories |
$ | 89 | $ | 31 | $ | 3 | $ | — | $ | 117 | ||||||||||
| (a) | Represents foreign exchange effect. |
94
Table of Contents
POWER OF ATTORNEY
Each individual person whose signature appears below hereby appoints J. Brendan Barba and Paul M. Feeney as attorneys-in-fact with full power of substitution, severally, to execute in the name and on behalf of each such person, individually and in each capacity stated below, one or more amendments to this annual report which amendments may make such changes in the report as the attorney-in-fact acting in the premises deems appropriate, to file any such amendment to the report with the Securities and Exchange Commission (“SEC”), and to take all other actions either of them deem necessary or advisable to enable the Company to comply with the rules, regulations and requirements of the SEC.
Pursuant to the requirements of Section 13 or 15(d) of the Securities Exchange Act of 1934, the registrant has duly caused this report to be signed on its behalf by the undersigned, thereunto duly authorized.
| AEP INDUSTRIES INC. | ||||
| Dated: January 14, 2015 | By: | /S/ J. BRENDAN BARBA | ||
| J. Brendan Barba Chairman of the Board, President and Chief Executive Officer | ||||
Pursuant to the requirements of the Securities Exchange Act of 1934, this report has been signed below by the following persons on behalf of the registrant and in the capacities and on the dates indicated.
| Dated: January 14, 2015 |
By: | /S/ J. BRENDAN BARBA | ||
| J. Brendan Barba Chairman of the Board, President and Chief Executive Officer (principal executive officer) | ||||
| Dated: January 14, 2015 |
By: | /S/ PAUL M. FEENEY | ||
| Paul M. Feeney Executive Vice President, Finance Chief Financial Officer and Director (principal financial officer) | ||||
| Dated: January 14, 2015 |
By: | /S/ LINDA N. GUERRERA | ||
| Linda N. Guerrera Vice President, Controller (principal accounting officer) | ||||
| Dated: January 14, 2015 |
By: | /S/ JOHN J. POWERS | ||
| John J. Powers Director | ||||
| Dated: January 14, 2015 |
By: | /S/ ROBERT T. BELL | ||
| Robert T. Bell Director | ||||
95
Table of Contents
| Dated: January 14, 2015 |
By: | /S/ IRA M. BELSKY | ||
| Ira M. Belsky Director | ||||
| Dated: January 14, 2015 |
By: | /S/ RICHARD E. DAVIS | ||
| Richard E. Davis Director | ||||
| Dated: January 14, 2015 |
By: | /S/ FRANK P. GALLAGHER | ||
| Frank P. Gallagher Director | ||||
| Dated: January 14, 2015 |
By: | /S/ LEE C. STEWART | ||
| Lee C. Stewart Director | ||||
96
Table of Contents
INDEX TO EXHIBITS
| Incorporated by reference | ||||||||||||||||||
| Exhibit |
Exhibit description |
Filed/Furnished herewith |
Form | Period ending |
Exhibit number |
Filing date |
||||||||||||
| 3.1 | Restated Certificate of Incorporation of AEP Industries Inc. (the “Company”) | 10-Q | 04/30/97 | 3(a) | 06/13/97 | |||||||||||||
| 3.2 | Seventh Amended and Restated By-Laws of the Company | 8-K | 3.1 | 11/06/13 | ||||||||||||||
| 3.3 | Form of Certificate of Designations of Series A Junior Participating Preferred Stock of the Company | 8-K | 3.1 | 03/31/11 | ||||||||||||||
| 4.1 | Indenture (8.25% Senior Notes due 2019), dated as of April 18, 2011, by and between the Company and The Bank of New York Mellon Trust Company, N.A., as trustee | 8-K | 4.1 | 04/18/11 | ||||||||||||||
| 4.2 | First Supplemental Indenture (8.25% Senior Notes due 2019), dated as of April 18, 2011, between the Company and The Bank of New York Mellon (f/k/a The Bank of New York), as trustee | 8-K | 4.4 | 04/18/11 | ||||||||||||||
| 4.3 | Form of 8.25% Senior Note due 2019 | 8-K | 4.2 | 04/18/11 | ||||||||||||||
| 4.4 | Second Amended and Restated Loan and Security Agreement, dated February 22, 2012, by and among the Company, Wells Fargo Bank National Association, as Agent, and the financial institutions party thereto as lenders | 8-K | 4 | 02/27/12 | ||||||||||||||
| 4.5 | Amended and Restated Rights Agreement, dated as of March 28, 2014, by and between the Company and American Stock Transfer & Trust Company, LLC, as Rights Agent | 8-K | 4.1 | 03/28/14 | ||||||||||||||
| 4.6 | First Amendment to Amended and Restated Rights Agreement, dated April 16, 2014, by and between the Company and American Stock Transfer & Trust Company, LLC, as Rights Agent | 8-K | 4.1 | 04/21/14 | ||||||||||||||
| *10.1 | Amended and Restated 2005 Stock Option Plan of the Company | 10-K | 10/31/08 | 10.1 | 01/27/09 | |||||||||||||
| *10.2 | Form of Performance Unit Grant Agreement under the AEP Industries Inc. 2005 Stock Option Plan | 8-K | 10.1 | 06/20/06 | ||||||||||||||
| *10.3 | Form of Performance Unit Grant Agreement under the AEP Industries Inc. 2005 Stock Option Plan, for 409A compliance | 10-K | 10/31/08 | 10.3 | 01/27/09 | |||||||||||||
| *10.4 | Form of Stock Option Agreement (Employees) under the AEP Industries Inc. 2005 Stock Option Plan | 8-K | 10.4 | 05/10/06 | ||||||||||||||
| *10.5 | Form of Stock Option Agreement (Directors) under the AEP Industries Inc. 2005 Stock Option Plan | 8-K | 10.5 | 05/10/06 | ||||||||||||||
97
Table of Contents
| Incorporated by reference | ||||||||||||||||||
| Exhibit |
Exhibit description |
Filed/Furnished herewith |
Form | Period ending |
Exhibit number |
Filing date |
||||||||||||
| *10.6 | 2013 Omnibus Incentive Plan of the Company | Schedule 14A | Annex A | 02/22/13 | ||||||||||||||
| *10.7 | Form of Performance Unit Award Agreement under the 2013 Omnibus Incentive Plan | 8-K | 10.2 | 04/11/13 | ||||||||||||||
| *10.8 | Form of Restricted Stock Award Agreement under the 2013 Omnibus Incentive Plan | 8-K | 10.3 | 04/11/13 | ||||||||||||||
| *10.9 | Form of Stock Option Award Agreement under the 2013 Omnibus Incentive Plan | 8-K | 10.4 | 04/11/13 | ||||||||||||||
| *10.10 | Form of Management Incentive Plan of the Company | X | ||||||||||||||||
| *10.11 | Summary of Non-Employee Director Compensation | 10-K | 10/31/12 | 10.9 | 01/22/13 | |||||||||||||
| *10.12 | Employment Agreement, effective as of November 1, 2004, between the Company and J. Brendan Barba | 8-K | 10.1 | 05/13/05 | ||||||||||||||
| *10.13 | Employment Agreement, effective as of November 1, 2004, between the Company and Paul M. Feeney | 8-K | 10.2 | 05/13/05 | ||||||||||||||
| *10.14 | Employment Agreement, effective as of November 1, 2004, between the Company and John J. Powers……… | 8-K | 10.3 | 05/13/05 | ||||||||||||||
| *10.15 | Employment Agreement, effective as of November 1, 2004, between the Company and Paul C. Vegliante | 8-K | 10.5 | 05/13/05 | ||||||||||||||
| *10.16 | Employment Agreement, effective as of November 1, 2004, between the Company and Lawrence R. Noll | 8-K | 10.6 | 05/13/05 | ||||||||||||||
| *10.17 | Employment Agreement, effective as of November 1, 2008, between the Company and Linda N. Guerrera | 10-K | 10/31/08 | 10.17 | 01/27/09 | |||||||||||||
| *10.18 | Form of Amendment to Employment Agreement, between the Company and each of J. Brendan Barba, Paul M. Feeney, John J. Powers, Paul C. Vegliante, Lawrence R. Noll and Linda N. Guerrera, for 409A compliance, effective December 2008 | 10-K | 10/31/08 | 10.18 | 01/27/09 | |||||||||||||
| 10.19 | Agreement with Stockholders, dated April 16, 2014, among the Company, KSA Capital Management, LLC, Daniel D. Khoshaba and KSA Capital Master Fund, Ltd. | 8-K | 10.1 | 04/21/14 | ||||||||||||||
| 21 | List of subsidiaries of the Company at January 14, 2015 | X | ||||||||||||||||
| 23 | Consent of KPMG LLP | X | ||||||||||||||||
98
Table of Contents
| Incorporated by reference | ||||||||||||
| Exhibit |
Exhibit description |
Filed/Furnished herewith |
Form | Period ending |
Exhibit number |
Filing date | ||||||
| 24 | Power of Attorney (set forth on signature page) | X | ||||||||||
| 31.1 | Section 302 Certification—CEO | X | ||||||||||
| 31.2 | Section 302 Certification—CFO | X | ||||||||||
| 32.1 | Section 906 Certification—CEO | X | ||||||||||
| 32.2 | Section 906 Certification—CFO | X | ||||||||||
| 101.INS | XBRL Instance Document | X | ||||||||||
| 101.SCH | XBRL Taxonomy Extension Schema Document | X | ||||||||||
| 101.CAL | XBRL Taxonomy Extension Calculation Linkbase Document | X | ||||||||||
| 101.DEF | XBRL Taxonomy Extension Definition Linkbase Document | X | ||||||||||
| 101.LAB | XBRL Taxonomy Extension Label Linkbase Document | X | ||||||||||
| 101.PRE | XBRL Taxonomy Extension Presentation Linkbase Document | X | ||||||||||
| * | A management contract or compensatory arrangement required to be filed. |
99