Attached files
| file | filename |
|---|---|
| 8-K - 8-K - AMICUS THERAPEUTICS, INC. | a15-2169_18k.htm |
| EX-99.2 - EX-99.2 - AMICUS THERAPEUTICS, INC. | a15-2169_1ex99d2.htm |
Exhibit 99.1
|
|
33rd Annual J.P. Morgan Healthcare Conference John F. Crowley, Chairman and CEO January 13, 2015 |
|
|
Safe Harbor This presentation contains “forward-looking statements” within the meaning of the Private Securities Litigation Reform Act of 1995 relating to business, operations and financial conditions of Amicus including but not limited to preclinical and clinical development of Amicus’ candidate drug products, cash runway, and the timing and reporting of results from clinical trials evaluating Amicus’ candidate drug products. Words such as, but not limited to, “look forward to,” “believe,” “expect,” “anticipate,” “estimate,” “intend,” “plan,” “would,” “should” and “could,” and similar expressions or words, identify forward-looking statements. Although Amicus believes the expectations reflected in such forward-looking statements are based upon reasonable assumptions, there can be no assurance that its expectations will be realized. Actual results could differ materially from those projected in Amicus’ forward-looking statements due to numerous known and unknown risks and uncertainties, including the “Risk Factors” described in our Annual Report on Form 10-K for the year ended December 31, 2013. All forward-looking statements are qualified in their entirety by this cautionary statement, and Amicus undertakes no obligation to revise or update this presentation to reflect events or circumstances after the date hereof. |
|
|
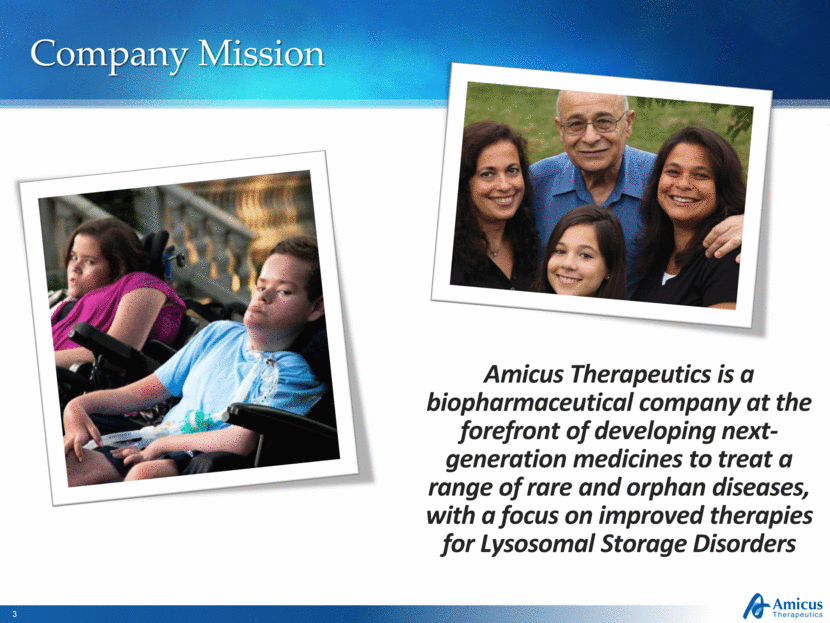
Company Mission Amicus Therapeutics is a biopharmaceutical company at the forefront of developing next-generation medicines to treat a range of rare and orphan diseases, with a focus on improved therapies for Lysosomal Storage Disorders |
|
|
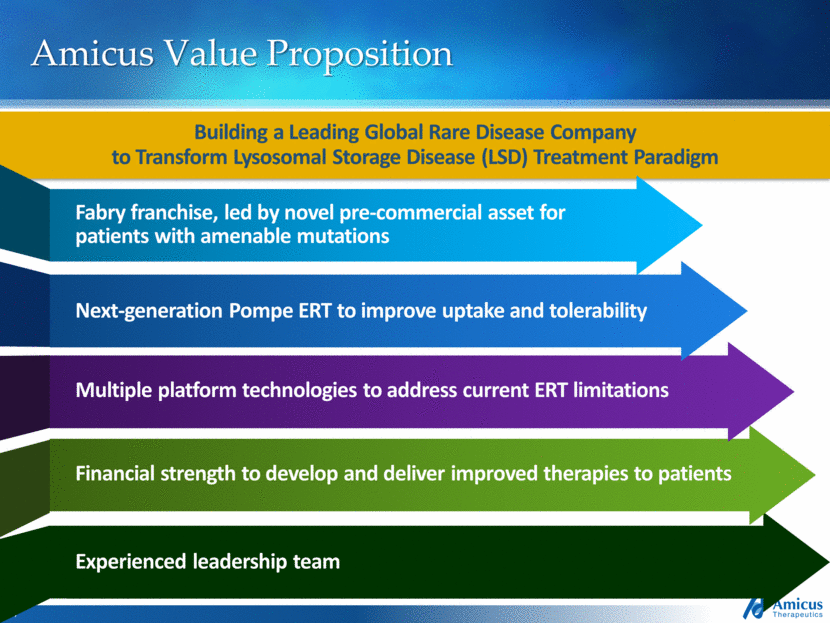
Amicus Value Proposition Building a Leading Global Rare Disease Company to Transform Lysosomal Storage Disease (LSD) Treatment Paradigm Financial strength to develop and deliver improved therapies to patients Multiple platform technologies to address current ERT limitations Next-generation Pompe ERT to improve uptake and tolerability Fabry franchise, led by novel pre-commercial asset for patients with amenable mutations NEW ARROW: Experienced Leadership team Experienced leadership team |
|
|
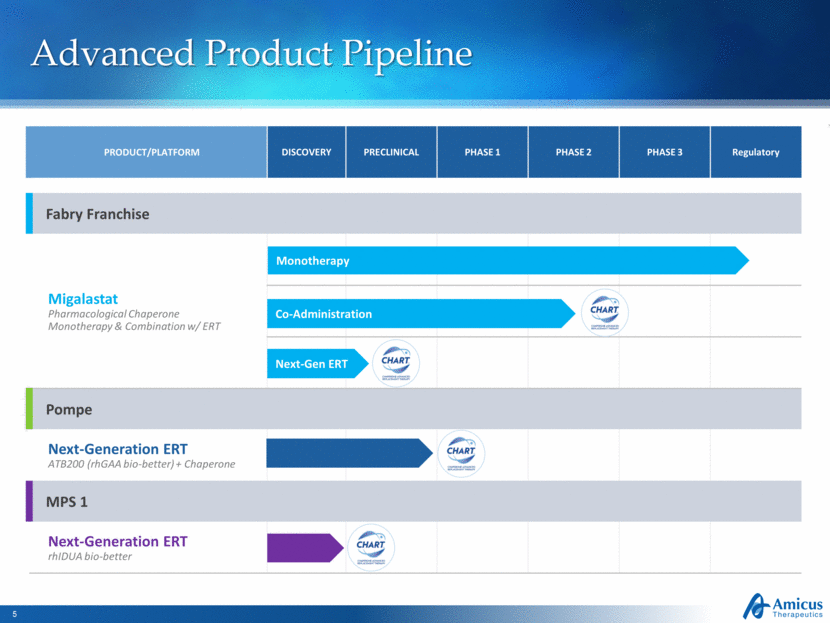
Advanced Product Pipeline PRODUCT/PLATFORM DISCOVERY PRECLINICAL PHASE 1 PHASE 2 PHASE 3 Regulatory Fabry Franchise Migalastat Pharmacological Chaperone Monotherapy & Combination w/ ERT Pompe Next-Generation ERT ATB200 (rhGAA bio-better) + Chaperone MPS 1 Next-Generation ERT rhIDUA bio-better Monotherapy Co-Administration Next-Gen ERT |
|
|
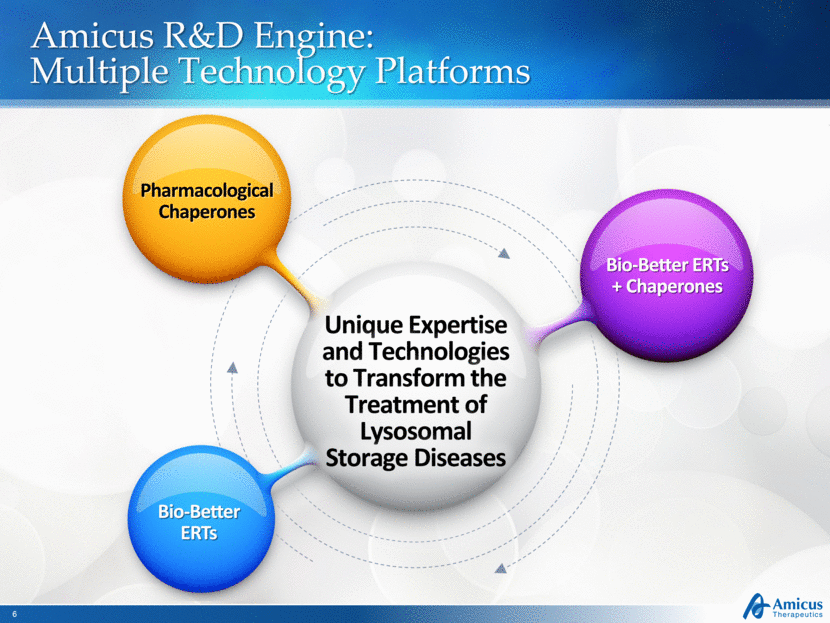
Amicus R&D Engine: Multiple Technology Platforms Unique Expertise and Technologies to Transform the Treatment of Lysosomal Storage Diseases Pharmacological Chaperones Bio-Better ERTs Bio-Better ERTs + Chaperones |
|
|
Fabry Franchise |
|
|
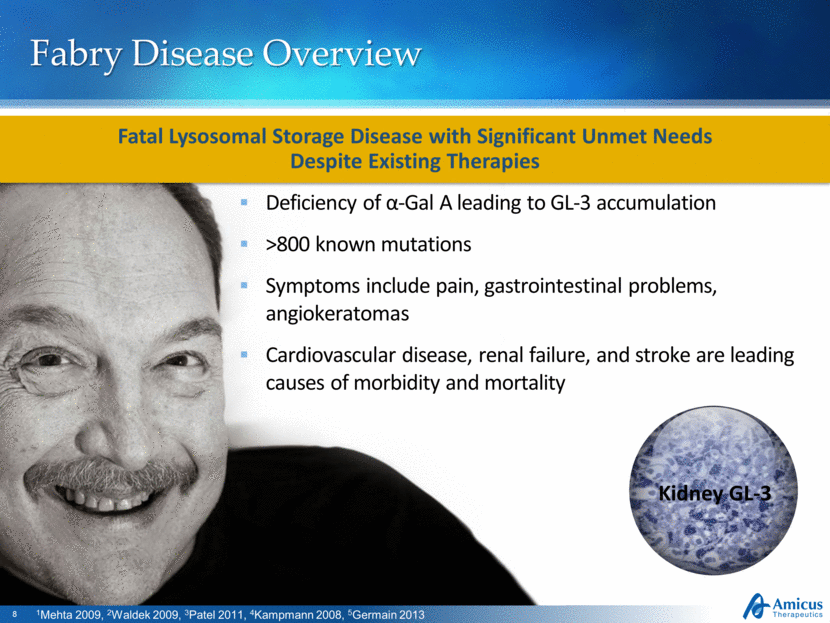
Fabry Disease Overview Deficiency of α-Gal A leading to GL-3 accumulation >800 known mutations Symptoms include pain, gastrointestinal problems, angiokeratomas Cardiovascular disease, renal failure, and stroke are leading causes of morbidity and mortality Fatal Lysosomal Storage Disease with Significant Unmet Needs Despite Existing Therapies 1Mehta 2009, 2Waldek 2009, 3Patel 2011, 4Kampmann 2008, 5Germain 2013 Kidney GL-3 |
|
|
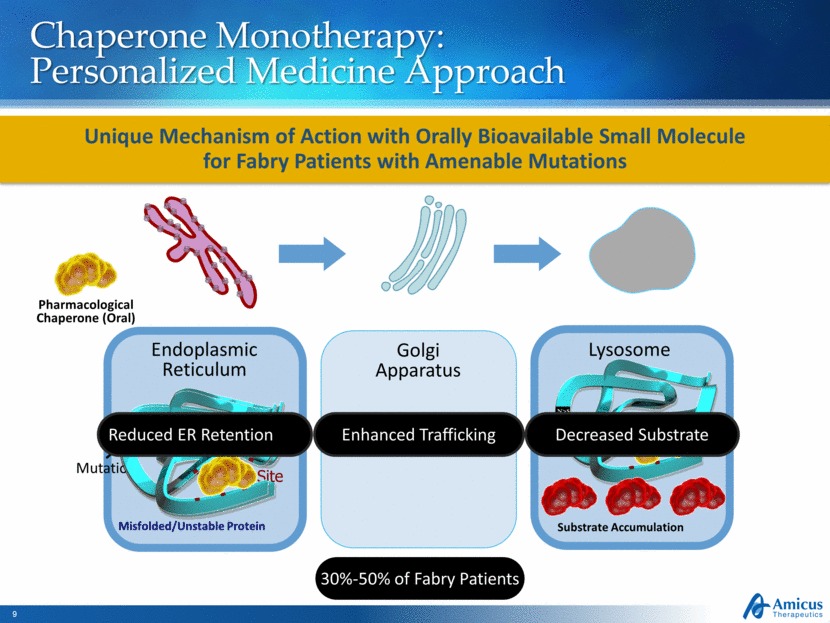
Chaperone Monotherapy: Personalized Medicine Approach Substrate Accumulation Endoplasmic Reticulum Golgi Apparatus Lysosome Pharmacological Chaperone (Oral) Misfolded/Unstable Protein Active Site Mutation Enhanced Trafficking Reduced ER Retention Decreased Substrate 30%-50% of Fabry Patients Unique Mechanism of Action with Orally Bioavailable Small Molecule for Fabry Patients with Amenable Mutations N > S N > S N > S N > S |
|
|
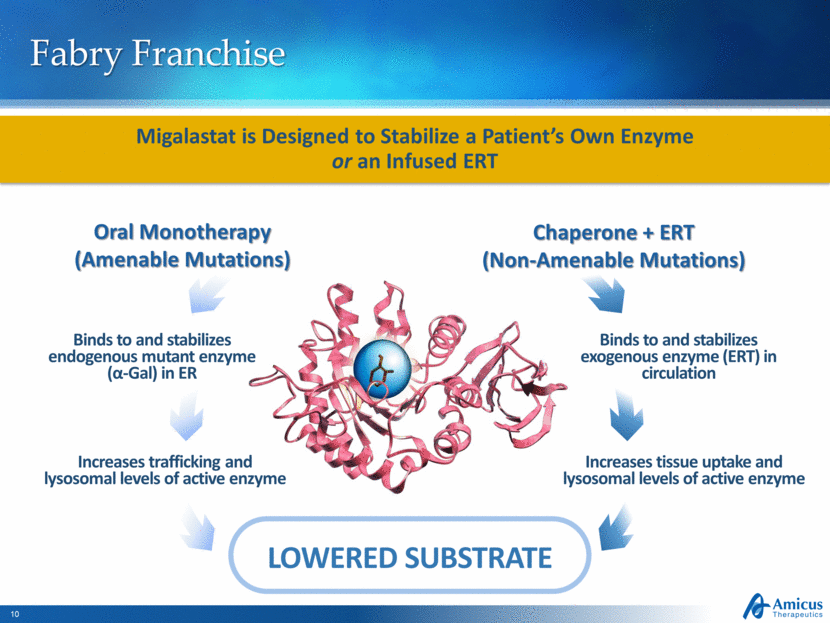
Fabry Franchise Binds to and stabilizes endogenous mutant enzyme (α-Gal) in ER Increases trafficking and lysosomal levels of active enzyme Binds to and stabilizes exogenous enzyme (ERT) in circulation Increases tissue uptake and lysosomal levels of active enzyme LOWERED SUBSTRATE Migalastat is Designed to Stabilize a Patient’s Own Enzyme or an Infused ERT Oral Monotherapy (Amenable Mutations) Chaperone + ERT (Non-Amenable Mutations) |
|
|
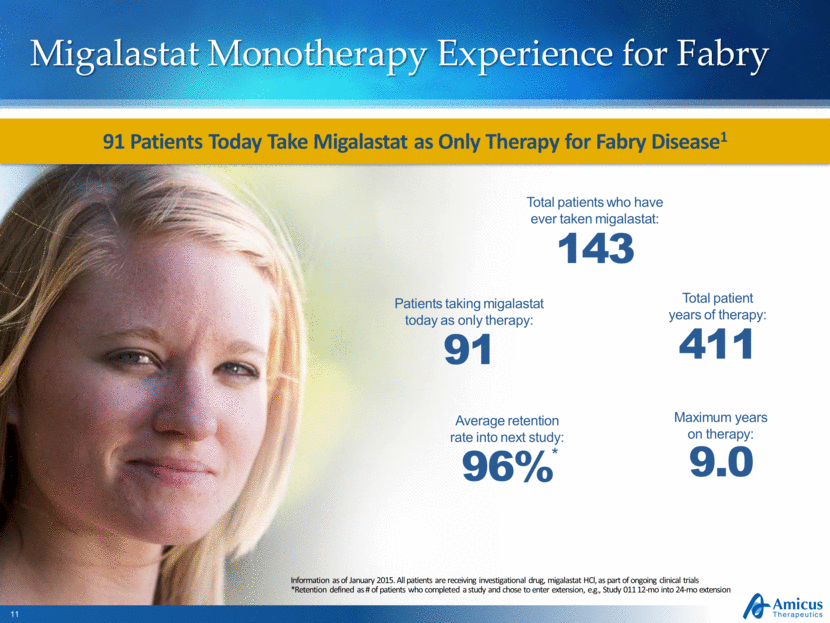
Migalastat Monotherapy Experience for Fabry Information as of January 2015. All patients are receiving investigational drug, migalastat HCl, as part of ongoing clinical trials *Retention defined as # of patients who completed a study and chose to enter extension, e.g., Study 011 12-mo into 24-mo extension Total patients who have ever taken migalastat: 143 Total patient years of therapy: 411 Maximum years on therapy: 9.0 Average retention rate into next study: 96% * Patients taking migalastat today as only therapy: 91 91 Patients Today Take Migalastat as Only Therapy for Fabry Disease1 |
|
|
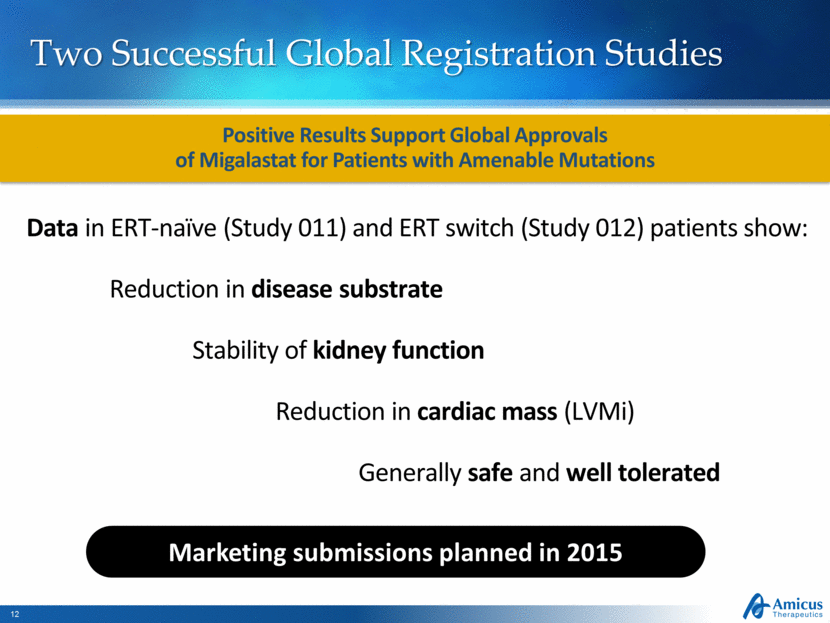
Two Successful Global Registration Studies Positive Results Support Global Approvals of Migalastat for Patients with Amenable Mutations Data in ERT-naïve (Study 011) and ERT switch (Study 012) patients show: Reduction in disease substrate Stability of kidney function Reduction in cardiac mass (LVMi) Generally safe and well tolerated Marketing submissions planned in 2015 |
|
|
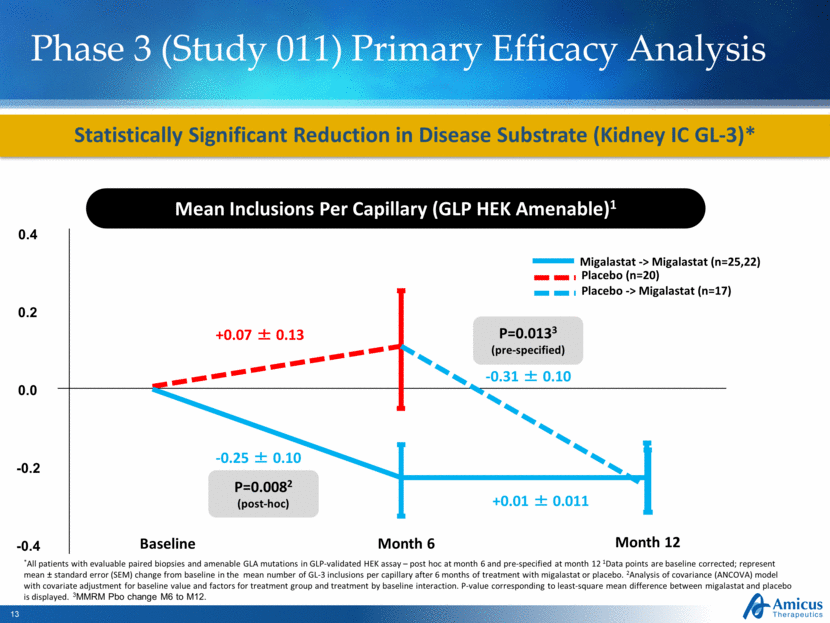
Phase 3 (Study 011) Primary Efficacy Analysis Statistically Significant Reduction in Disease Substrate (Kidney IC GL-3)* Mean Inclusions Per Capillary (GLP HEK Amenable)1 Baseline Month 6 +0.07 ± 0.13 -0.25 ± 0.10 P=0.0082 (post-hoc) *All patients with evaluable paired biopsies and amenable GLA mutations in GLP-validated HEK assay – post hoc at month 6 and pre-specified at month 12 1Data points are baseline corrected; represent mean ± standard error (SEM) change from baseline in the mean number of GL-3 inclusions per capillary after 6 months of treatment with migalastat or placebo. 2Analysis of covariance (ANCOVA) model with covariate adjustment for baseline value and factors for treatment group and treatment by baseline interaction. P-value corresponding to least-square mean difference between migalastat and placebo is displayed. 3MMRM Pbo change M6 to M12. Month 12 -0.31 ± 0.10 +0.01 ± 0.011 P=0.0133 (pre-specified) 0.4 0.0 -0.2 -0.4 0.2 Placebo -> Migalastat (n=17) Migalastat -> Migalastat (n=25,22) Placebo (n=20) |
|
|
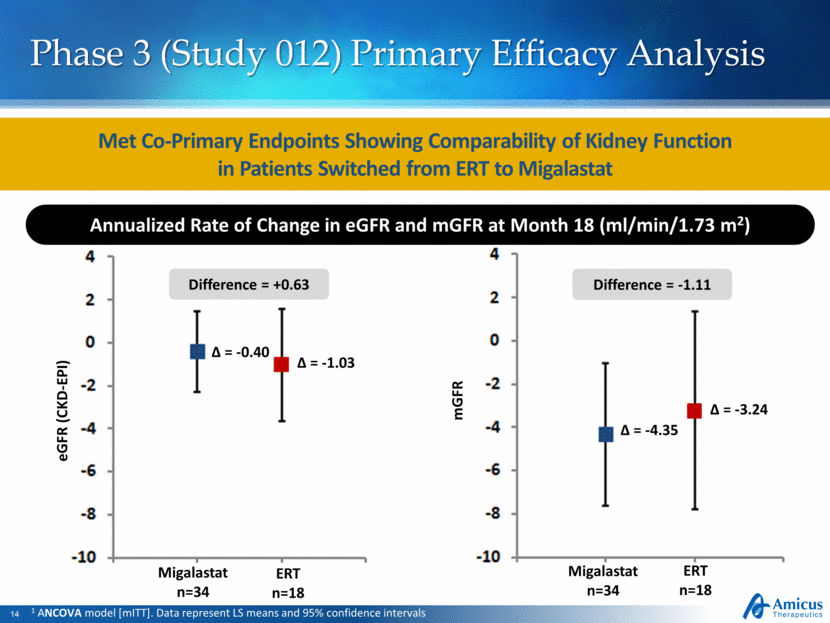
Phase 3 (Study 012) Primary Efficacy Analysis mGFR Migalastat n=34 ERT n=18 = -4.35 = -3.24 Migalastat n=34 ERT n=18 = -0.40 = -1.03 1 ANCOVA model [mITT]. Data represent LS means and 95% confidence intervals Met Co-Primary Endpoints Showing Comparability of Kidney Function in Patients Switched from ERT to Migalastat Annualized Rate of Change in eGFR and mGFR at Month 18 (ml/min/1.73 m2) eGFR (CKD-EPI) Difference = +0.63 Difference = -1.11 |
|
|
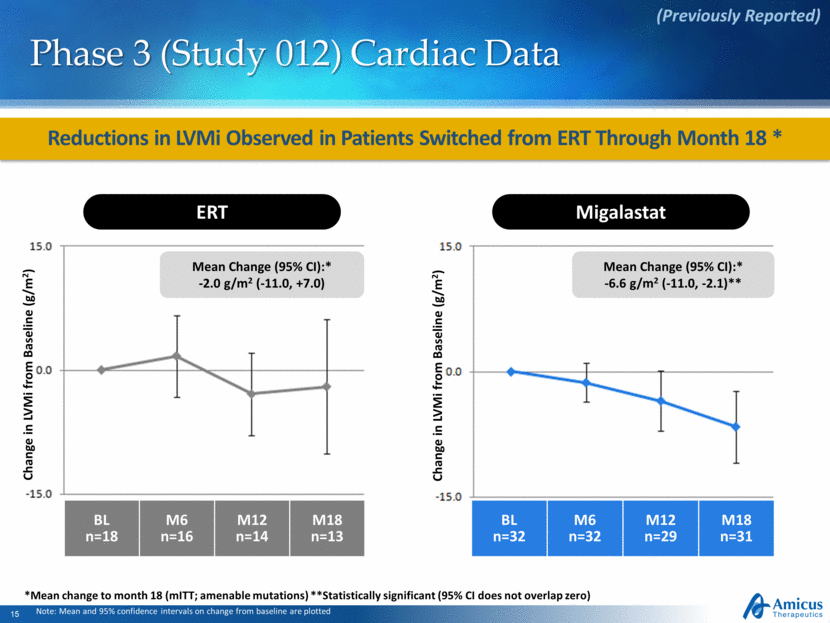
Reductions in LVMi Observed in Patients Switched from ERT Through Month 18 * Phase 3 (Study 012) Cardiac Data Note: Mean and 95% confidence intervals on change from baseline are plotted (Previously Reported) ERT Change in LVMi from Baseline (g/m2) BL n=18 M6 n=16 M12 n=14 M18 n=13 Mean Change (95% CI):* -2.0 g/m2 (-11.0, +7.0) BL n=32 M6 n=32 M12 n=29 M18 n=31 Migalastat Change in LVMi from Baseline (g/m2) Mean Change (95% CI):* -6.6 g/m2 (-11.0, -2.1)** *Mean change to month 18 (mITT; amenable mutations) **Statistically significant (95% CI does not overlap zero) |
|
|
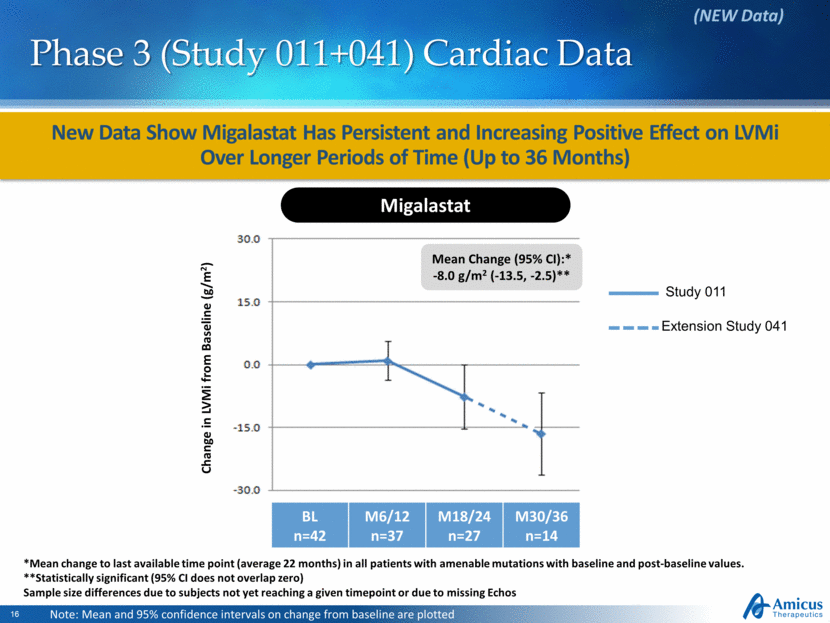
New Data Show Migalastat Has Persistent and Increasing Positive Effect on LVMi Over Longer Periods of Time (Up to 36 Months) Phase 3 (Study 011+041) Cardiac Data (NEW Data) Study 011 Extension Study 041 Note: Mean and 95% confidence intervals on change from baseline are plotted Change in LVMi from Baseline (g/m2) Migalastat BL n=42 M6/12 n=37 M18/24 n=27 M30/36 n=14 Mean Change (95% CI):* -8.0 g/m2 (-13.5, -2.5)** *Mean change to last available time point (average 22 months) in all patients with amenable mutations with baseline and post-baseline values. **Statistically significant (95% CI does not overlap zero) Sample size differences due to subjects not yet reaching a given timepoint or due to missing Echos |
|
|
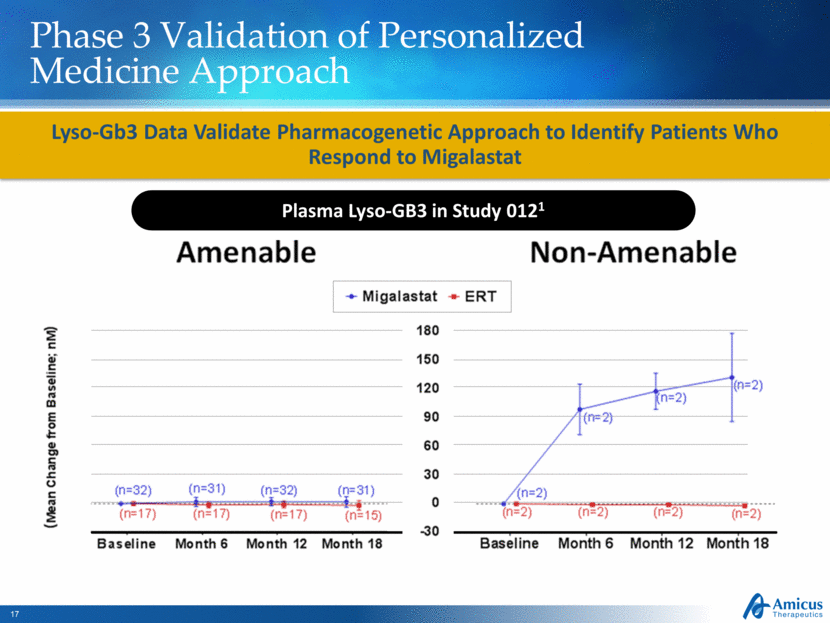
Phase 3 Validation of Personalized Medicine Approach Lyso-Gb3 Data Validate Pharmacogenetic Approach to Identify Patients Who Respond to Migalastat Plasma Lyso-GB3 in Study 0121 |
|
|
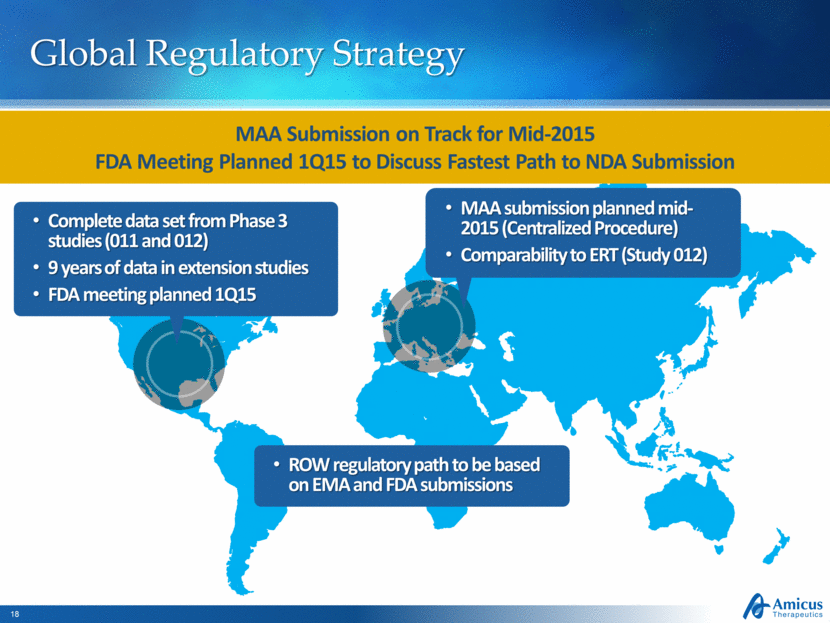
Global Regulatory Strategy Complete data set from Phase 3 studies (011 and 012) 9 years of data in extension studies FDA meeting planned 1Q15 MAA submission planned mid-2015 (Centralized Procedure) Comparability to ERT (Study 012) MAA Submission on Track for Mid-2015 FDA Meeting Planned 1Q15 to Discuss Fastest Path to NDA Submission ROW regulatory path to be based on EMA and FDA submissions |
|
|
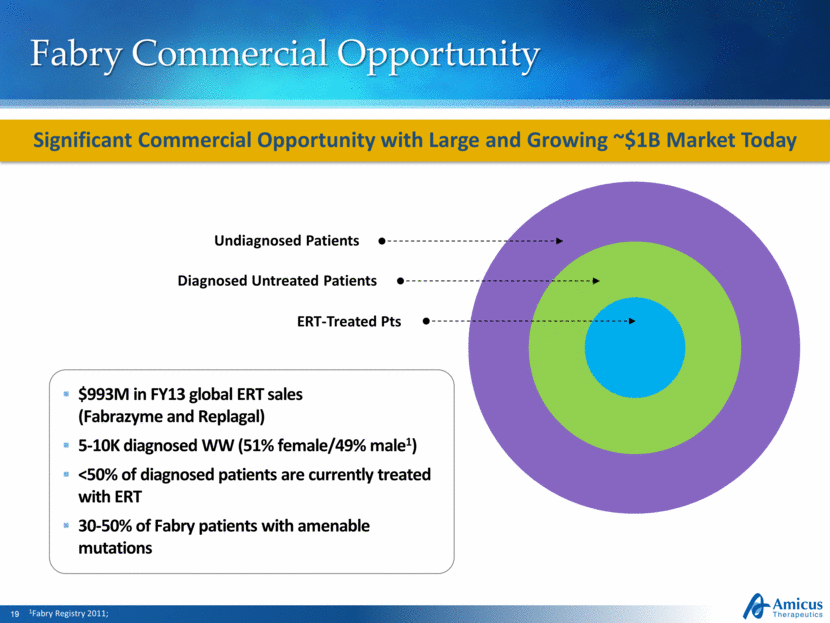
Fabry Commercial Opportunity Significant Commercial Opportunity with Large and Growing ~$1B Market Today $993M in FY13 global ERT sales (Fabrazyme and Replagal) 5-10K diagnosed WW (51% female/49% male1) <50% of diagnosed patients are currently treated with ERT 30-50% of Fabry patients with amenable mutations 1Fabry Registry 2011; ERT-Treated Pts Diagnosed Untreated Patients Undiagnosed Patients |
|
|
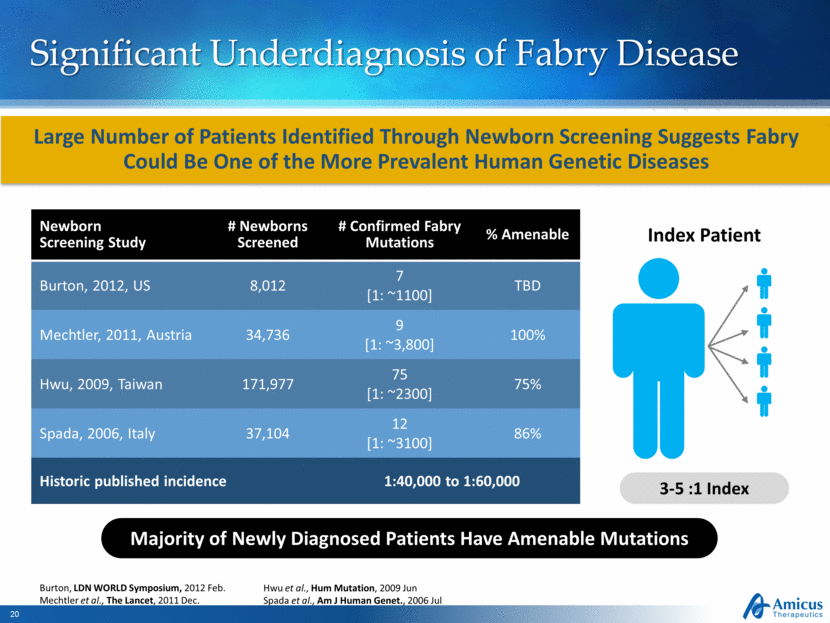
Significant Underdiagnosis of Fabry Disease Index Patient 3-5 :1 Index Burton, LDN WORLD Symposium, 2012 Feb. Mechtler et al., The Lancet, 2011 Dec. Hwu et al., Hum Mutation, 2009 Jun Spada et al., Am J Human Genet., 2006 Jul Large Number of Patients Identified Through Newborn Screening Suggests Fabry Could Be One of the More Prevalent Human Genetic Diseases Newborn Screening Study # Newborns Screened # Confirmed Fabry Mutations % Amenable Burton, 2012, US 8,012 7 [1: ~1100] TBD Mechtler, 2011, Austria 34,736 9 [1: ~3,800] 100% Hwu, 2009, Taiwan 171,977 75 [1: ~2300] 75% Spada, 2006, Italy 37,104 12 [1: ~3100] 86% Historic published incidence 1:40,000 to 1:60,000 Majority of Newly Diagnosed Patients Have Amenable Mutations |
|
|
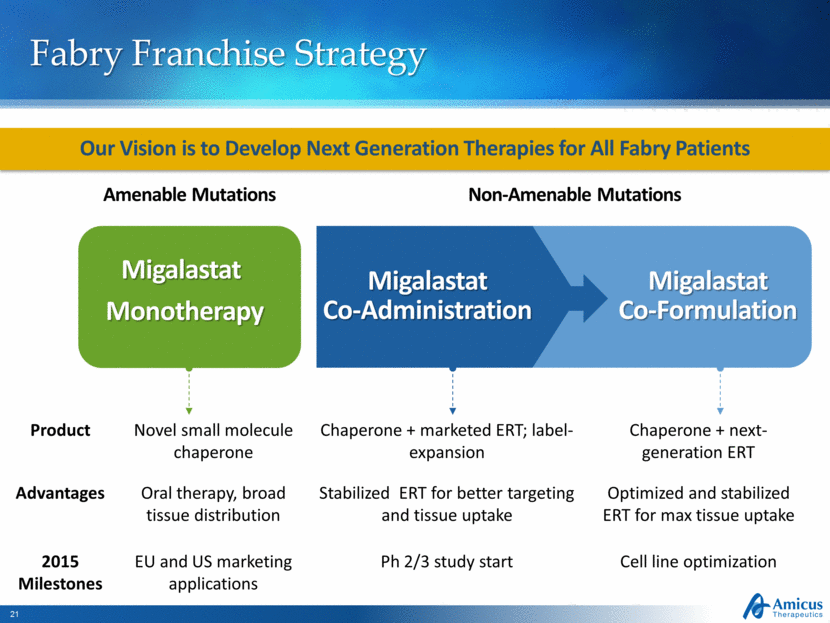
Migalastat Co-Formulation Fabry Franchise Strategy Our Vision is to Develop Next Generation Therapies for All Fabry Patients Migalastat Co-Administration Amenable Mutations Non-Amenable Mutations Migalastat Monotherapy Product Novel small molecule chaperone Chaperone + marketed ERT; label-expansion Chaperone + next-generation ERT Advantages Oral therapy, broad tissue distribution Stabilized ERT for better targeting and tissue uptake Optimized and stabilized ERT for max tissue uptake 2015 Milestones EU and US marketing applications Ph 2/3 study start Cell line optimization |
|
|
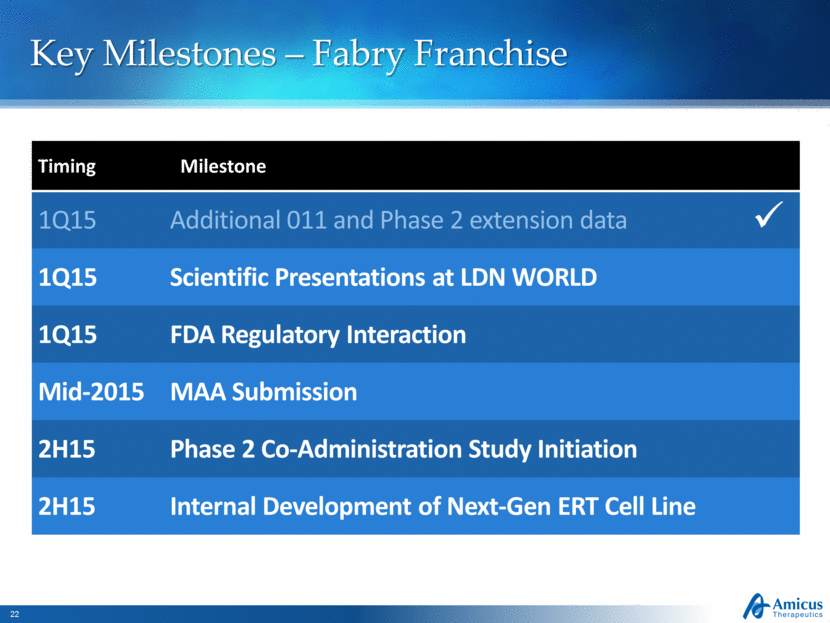
Key Milestones – Fabry Franchise Timing Milestone 1Q15 Additional 011 and Phase 2 extension data 1Q15 Scientific Presentations at LDN WORLD 1Q15 FDA Regulatory Interaction Mid-2015 MAA Submission 2H15 Phase 2 Co-Administration Study Initiation 2H15 Internal Development of Next-Gen ERT Cell Line |
|
|
Next-Generation ERT for Pompe Disease |
|
|
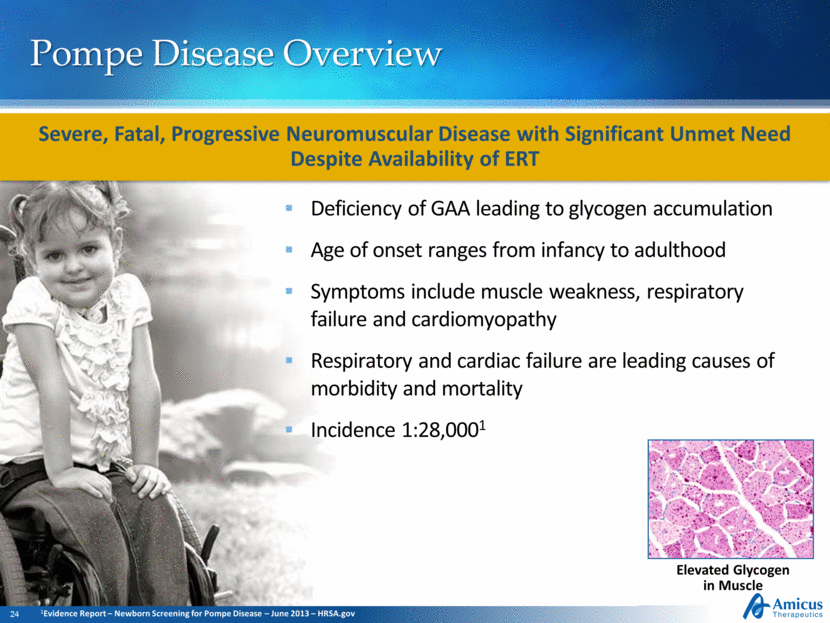
Pompe Disease Overview Deficiency of GAA leading to glycogen accumulation Age of onset ranges from infancy to adulthood Symptoms include muscle weakness, respiratory failure and cardiomyopathy Respiratory and cardiac failure are leading causes of morbidity and mortality Incidence 1:28,0001 Elevated Glycogen in Muscle Severe, Fatal, Progressive Neuromuscular Disease with Significant Unmet Need Despite Availability of ERT 1Evidence Report – Newborn Screening for Pompe Disease – June 2013 – HRSA.gov |
|
|
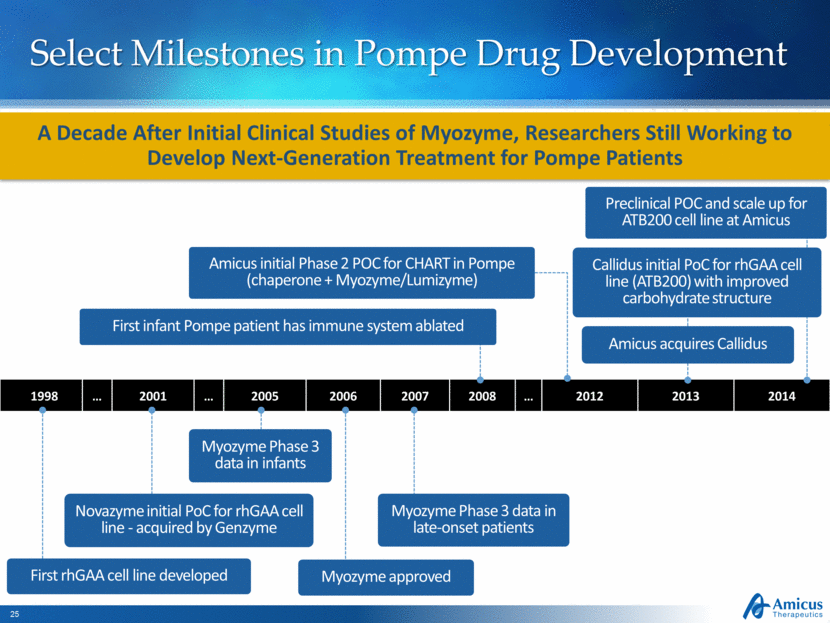
Select Milestones in Pompe Drug Development 1998 2001 2005 2006 2007 2008 2012 2013 2014 A Decade After Initial Clinical Studies of Myozyme, Researchers Still Working to Develop Next-Generation Treatment for Pompe Patients Myozyme Phase 3 data in infants Myozyme approved Novazyme initial PoC for rhGAA cell line - acquired by Genzyme Myozyme Phase 3 data in late-onset patients First rhGAA cell line developed Callidus initial PoC for rhGAA cell line (ATB200) with improved carbohydrate structure Amicus acquires Callidus Preclinical POC and scale up for ATB200 cell line at Amicus First infant Pompe patient has immune system ablated Amicus initial Phase 2 POC for CHART in Pompe (chaperone + Myozyme/Lumizyme) |
|
|
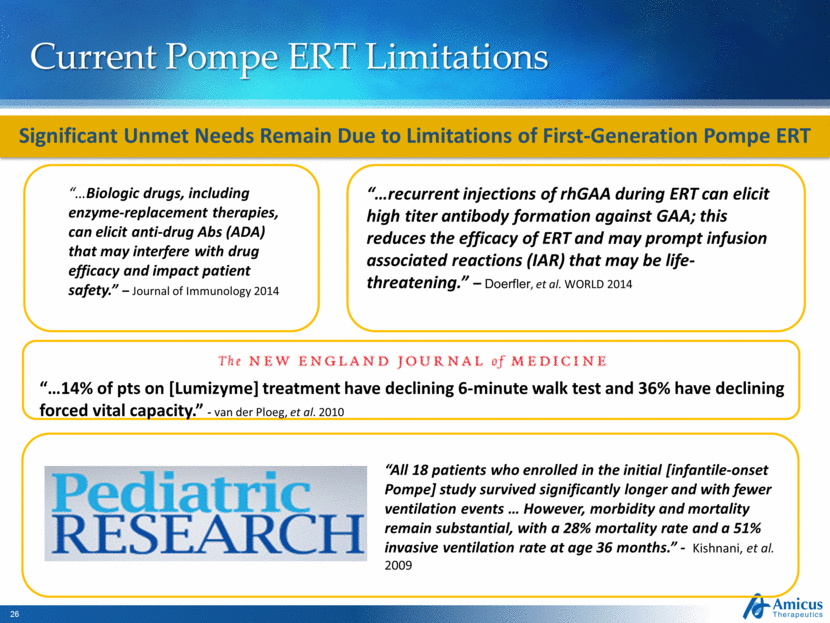
Current Pompe ERT Limitations Significant Unmet Needs Remain Due to Limitations of First-Generation Pompe ERT. “recurrent injections of rhGAA during ERT can elicit high titer antibody formation against GAA; this reduces the efficacy of ERT and may prompt infusion associated reactions (IAR) that may be life-threatening.” – Doerfler, et al. WORLD 2014 “All 18 patients who enrolled in the initial [infantile-onset Pompe] study survived significantly longer and with fewer ventilation events. However, morbidity and mortality remain substantial, with a 28% mortality rate and a 51% invasive ventilation rate at age 36 months.” - Kishnani, et al. 2009 “. 14% of pts on [Lumizyme] treatment have declining 6-minute walk test and 36% have declining forced vital capacity.” - van der Ploeg, et al. 2010 “. Biologic drugs, including enzyme-replacement therapies, can elicit anti-drug Abs (ADA) that may interfere with drug efficacy and impact patient safety.” – Journal of Immunology 2014 |
|
|
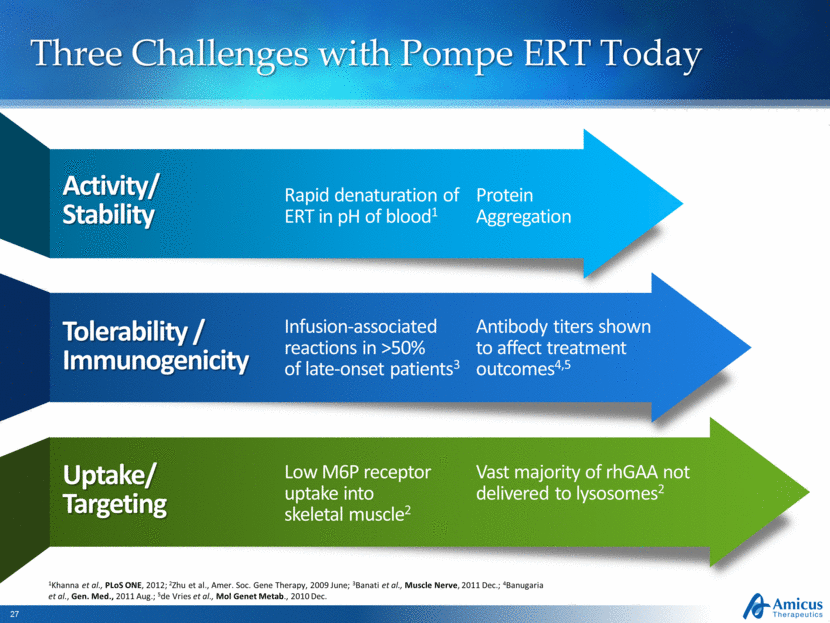
Three Challenges with Pompe ERT Today Activity/Stability Rapid denaturation of ERT in pH of blood1 Tolerability / Immunogenicity Infusion-associated reactions in >50% of late-onset patients3 Uptake/Targeting Low M6P receptor uptake into skeletal muscle2 Antibody titers shown to affect treatment outcomes4,5 Vast majority of rhGAA not delivered to lysosomes2 1Khanna et al., PLoS ONE, 2012; 2Zhu et al., Amer. Soc. Gene Therapy, 2009 June; 3Banati et al., Muscle Nerve, 2011 Dec.; 4Banugaria et al., Gen. Med., 2011 Aug.; 5de Vries et al., Mol Genet Metab., 2010 Dec. Protein Aggregation |
|
|
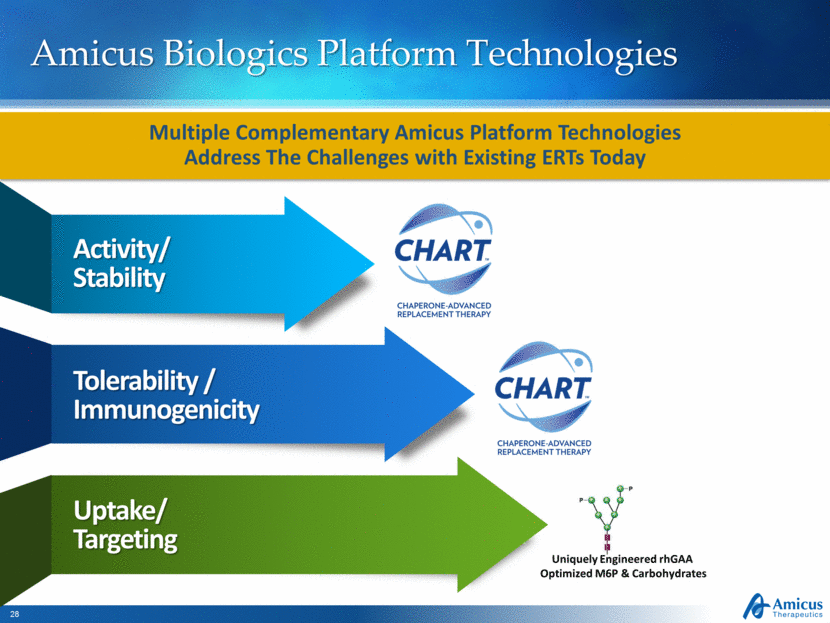
Amicus Biologics Platform Technologies Activity/Stability Tolerability / Immunogenicity Uptake/Targeting Multiple Complementary Amicus Platform Technologies Address The Challenges with Existing ERTs Today Uniquely Engineered rhGAA Optimized M6P & Carbohydrates |
|
|
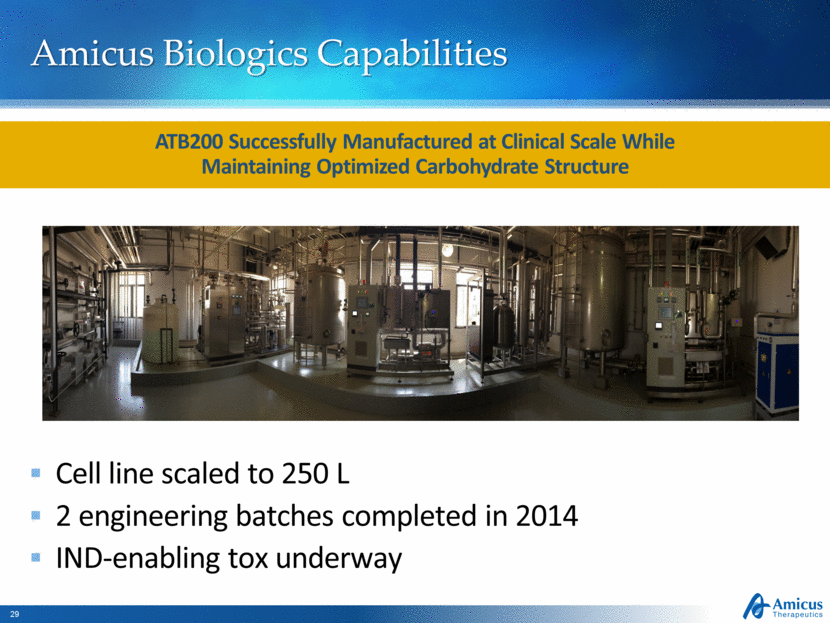
Amicus Biologics Capabilities ATB200 Successfully Manufactured at Clinical Scale While Maintaining Optimized Carbohydrate Structure Cell line scaled to 250 L 2 engineering batches completed in 2014 IND-enabling tox underway |
|
|
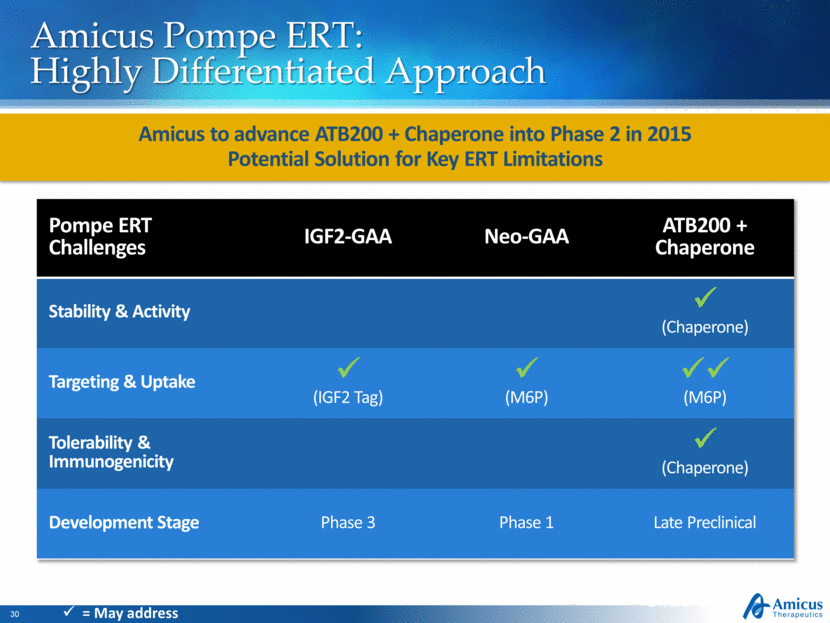
Amicus Pompe ERT: Highly Differentiated Approach Amicus to advance ATB200 + Chaperone into Phase 2 in 2015 Potential Solution for Key ERT Limitations Slide 30 Pompe ERT Challenges IGF2-GAA Neo-GAA ATB200 + Chaperone Stability & Activity (Chaperone) Targeting & Uptake (IGF2 Tag) (M6P) (M6P) Tolerability & Immunogenicity (Chaperone) Development Stage Phase 3 Phase 1 Late Preclinical = May address |
|
|
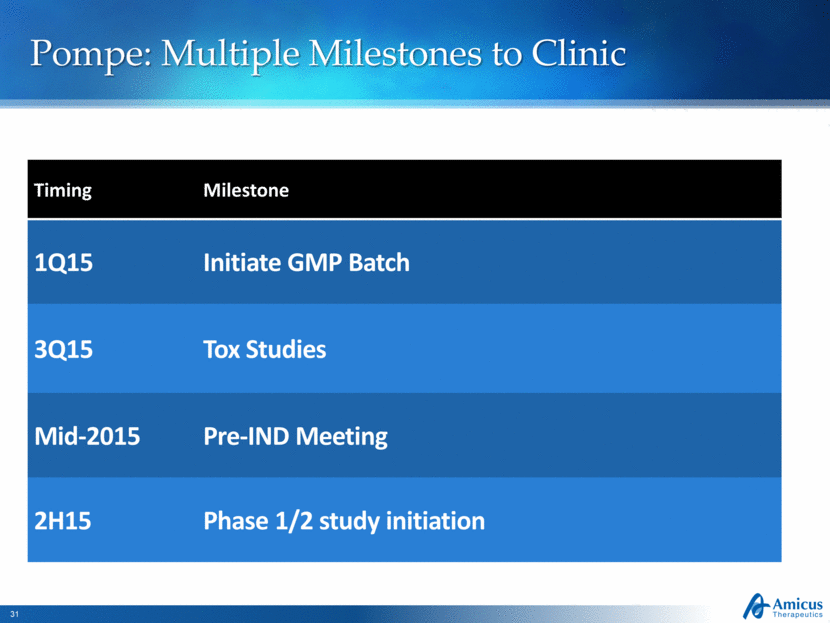
Pompe: Multiple Milestones to Clinic Timing Milestone 1Q15 Initiate GMP Batch 3Q15 Tox Studies Mid-2015 Pre-IND Meeting 2H15 Phase 1/2 study initiation |
|
|
Financial Summary |
|
|
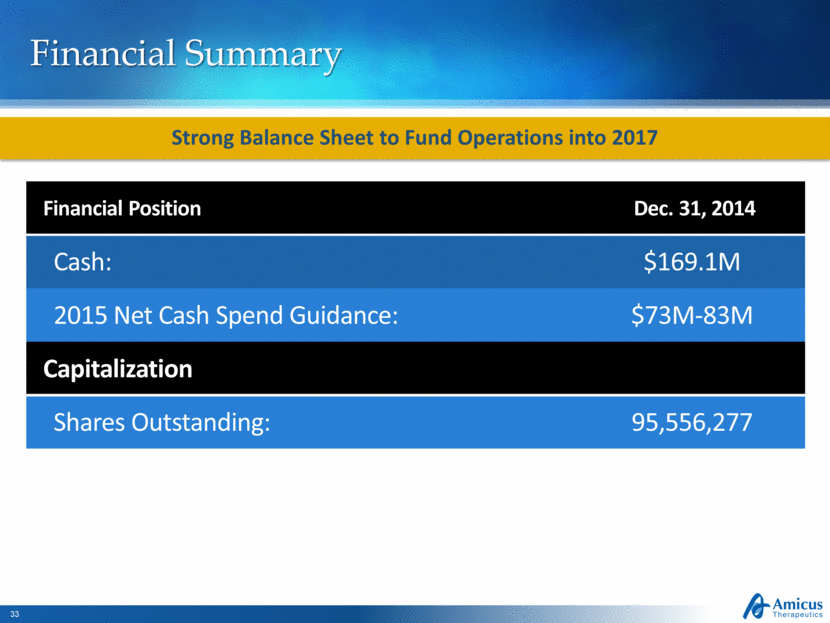
Financial Summary Financial Position Dec. 31, 2014 Cash: $169.1M 2015 Net Cash Spend Guidance: $73M-83M Capitalization Shares Outstanding: 95,556,277 Strong Balance Sheet to Fund Operations into 2017 |
|
|
33rd Annual J.P. Morgan Healthcare Conference John F. Crowley, Chairman and CEO January 13, 2015 |

