Attached files
| file | filename |
|---|---|
| EXCEL - IDEA: XBRL DOCUMENT - VALSPAR CORP | Financial_Report.xls |
| EX-23.1 - CONSENT OF INDEPENDENT REGISTERED PUBLIC ACCOUNTING FIRM - VALSPAR CORP | valspar144409s1_ex23-1.htm |
| EX-31.2 - CERTIFICATION OF CFO PURSUANT TO SECTION 302 - VALSPAR CORP | valspar144409s1_ex31-2.htm |
| EX-32.1 - CERTIFICATION OF CEO/CFO PURSUANT TO SECTION 906 - VALSPAR CORP | valspar144409s1_ex32-1.htm |
| EX-31.1 - CERTIFICATION OF CEO PURSUANT TO SECTION 302 - VALSPAR CORP | valspar144409s1_ex31-1.htm |
| EX-21.1 - SUBSIDIARIES OF THE REGISTRANT - VALSPAR CORP | valspar144409s1_ex21-1.htm |
|
UNITED STATES SECURITIES AND EXCHANGE COMMISSION
|
||
|
WASHINGTON, D.C. 20549
|
||
|
FORM 10-K
|
||
|
(Mark One)
|
|
|
x
|
ANNUAL REPORT PURSUANT TO SECTION 13 OR 15(d) OF THE SECURITIES EXCHANGE ACT OF 1934
For the fiscal year ended October 31, 2014 |
| or | |
|
o
|
TRANSITION REPORT PURSUANT TO SECTION 13 OR 15(d) OF THE SECURITIES EXCHANGE ACT OF 1934
For the transition period from _______________________ to ___________________ |
Commission File Number 1-3011
|
THE VALSPAR CORPORATION
|
||
|
(Exact name of registrant as specified in its charter)
|
||
|
Delaware
|
36-2443580
|
|
(State of incorporation)
|
(I.R.S. Employer Identification No.)
|
|
901 3rd Avenue South
|
|
|
Minneapolis, Minnesota
|
55402
|
|
(Address of principal executive offices)
|
(Zip Code)
|
Registrant’s telephone number, including area code: (612) 851-7000
Securities registered pursuant to Section 12(b) of the Act:
|
Title of Each Class
|
Name of Each Exchange on which Registered
|
|
Common Stock, $.50 Par Value
|
New York Stock Exchange
|
Securities registered pursuant to Section 12(g) of the Act: None
Indicate by check mark if the registrant is a well-known seasoned issuer, as defined in Rule 405 of the Securities Act. x Yes o No
Indicate by check mark if the registrant is not required to file reports pursuant to Section 13 or Section 15(d) of the Act. o Yes x No
Indicate by check mark whether the registrant (1) has filed all reports required to be filed by Section 13 or 15(d) of the Securities Exchange Act of 1934 during the preceding 12 months (or for such shorter period that the registrant was required to file such reports), and (2) has been subject to the filing requirements for the past 90 days. x Yes o No
Indicate by check mark whether the registrant has submitted electronically and posted on its corporate Web site, if any, every Interactive Data File required to be submitted and posted pursuant to Rule 405 of Regulation S-T (§232.405 of this chapter) during the preceding 12 months (or for such shorter period that the registrant was required to submit and post such files). x Yes o No
Indicate by check mark if disclosure of delinquent filers pursuant to Item 405 of Regulation S-K is not contained herein, and will not be contained, to the best of registrant’s knowledge, in definitive proxy or information statements incorporated by reference in Part III of this Form 10-K or any amendment to this Form 10-K. x
Indicate by check mark whether the registrant is a large accelerated filer, an accelerated filer, a non-accelerated filer, or a smaller reporting company. See definition of “large accelerated filer,” “accelerated filer” and “smaller reporting company” in Rule 12b-2 of the Exchange Act. (Check one):
| Large accelerated filer x | Accelerated filer o | Non-accelerated filer o | Smaller reporting company o |
Indicate by check mark whether the registrant is a shell company (as defined in Rule12b-2 of the Act). o Yes x No
The aggregate market value of the voting stock held by persons other than officers, directors and more than 10% stockholders of the registrant as of April 25, 2014 was approximately $4.1 billion based on the closing sales price of $72.71 per share as reported on the New York Stock Exchange. As of December 9, 2014, 81,939,836 shares of Common Stock, $0.50 par value per share (net of 36,502,788 shares in treasury), were outstanding.
DOCUMENTS INCORPORATED IN PART BY REFERENCE
Portions of The Valspar Corporation’s definitive Proxy Statement (the “Proxy Statement”), to be filed with the Securities and Exchange Commission within 120 days after the end of the fiscal year ended October 31, 2014, are incorporated by reference into Part III to the extent described in this report.
(This page has been left blank intentionally.)
|
Page
|
|||
|
1
|
|||
|
3
|
|||
|
6
|
|||
|
6
|
|||
|
7
|
|||
|
7
|
|||
|
8
|
|||
|
10
|
|||
|
11
|
|||
|
23
|
|||
|
24
|
|||
|
53
|
|||
|
53
|
|||
|
53
|
|||
|
53
|
|||
|
53
|
|||
|
53
|
|||
|
53
|
|||
|
53
|
|||
|
54
|
|||
|
56
|
|||
(This page has been left blank intentionally.)
|
BUSINESS
|
BUSINESS & PRODUCT OVERVIEW
The Valspar Corporation is a global leader in the paints and coatings industry. We develop, manufacture and distribute a broad range of coatings, paints and related products and we operate our business in two reportable segments: Coatings and Paints. Net sales in the Coatings and Paints segments in 2014 were $2,511.1 million and $1,786.4 million, respectively. We have grown our business organically by using new technologies to provide high quality products with superior value and performance. Our global growth has also been fueled by our well-executed integration of acquisitions that have expanded our scale, technology platforms and portfolio of respected brands.
The Valspar Corporation is a Delaware corporation founded in 1806. Our principal executive offices are located at 901 3rd Avenue South, Minneapolis, Minnesota 55402, and our telephone number at that address is (612) 851-7000. Our corporate website address is www.valsparglobal.com. The information on our website is not part of this filing.
Our Annual Reports on Form 10-K, Quarterly Reports on Form 10-Q and Current Reports on Form 8-K, and amendments to these reports, are made available free of charge on our website as soon as reasonably practicable after we electronically file such materials with, or furnish such materials to, the Securities and Exchange Commission. You may access these documents on the “Investors” page of our website referred to above.
Coatings Segment
Our Coatings segment includes our industrial product lines and our packaging product line. We offer a broad range of decorative and protective coatings for metal, wood and plastic, primarily for sale to original equipment manufacturing (OEM) customers in Asia, Australia, Europe, North America and South America. Products within our Coatings segment include primers, top coats, varnishes, sprays, stains, fillers and other coatings for a wide range of manufacturing industries, including agricultural and construction equipment, appliances, building products, furniture, metal fabrication, metal packaging and transportation. We use a variety of technologies to provide value to our customers. These technologies include electrodeposition, powder, solvent-based, waterborne and UV cured coatings. We also provide a wide range of technical, manufacturing and formulation services for our customers.
Our industrial product lines include general industrial, coil and wood coatings. Our general industrial product line provides customers a single source for powder, liquid and electrodeposition coatings technologies for a wide variety of industries, including agricultural and construction equipment, pipe, lawn and garden, appliance, transportation and marine shipping containers. Our coil product line produces coatings applied to metal coils used to manufacture pre-engineered buildings and building components, other metal building and architectural products and appliances. Our wood product line supplies decorative and protective coatings for wood furniture, building products, cabinets and floors. We also provide color design and technical service to our customers. We supply our industrial products throughout the world.
Our packaging product line includes coatings for the interior and exterior of packaging containers, principally metal food containers and beverage cans. We also produce coatings for aerosol and paint cans, crowns for glass bottles, plastic packaging and bottle closures. We believe we are the world’s largest supplier of metal packaging coatings. We supply our packaging products throughout the world.
Paints Segment
Our Paints segment includes our consumer paints and automotive paint refinish product lines. We offer a wide variety of paints, primers, topcoats and aerosol spray paints through retailers, distribution networks and company-owned stores.
Our consumer paints product line comprises the largest part of our Paints segment. We offer a broad portfolio of interior and exterior decorative paints, stains, primers, varnishes and specialty decorative products, such as enamels, aerosols and faux finishes, used in both the do-it-yourself and professional markets. In the U.S. and Canada, we offer our branded products and private-label brands through more than 10,000 points of sale. The primary distribution channels for these products are home centers, hardware stores, distributors and independent dealers. In China, we sell branded consumer paints primarily through distributors and exclusive retailers. In Australia and New Zealand, we sell branded consumer paints through independent dealers, hardware chains, home centers and Valspar company-owned stores. In the U.K. and Ireland, we sell branded products primarily through a large home center customer.
We develop highly customized merchandising and marketing support programs for our consumer paint customers, enabling them to differentiate their paint departments from their competitors’ through customer service, paint tinting technology, product and color selection assistance and in-store displays. Our primary brands include VALSPAR and CABOT in the U.S., HUARUN in China, WATTYL, SOLVER and VALSPAR in Australia and New Zealand and VALSPAR and PLASTI-KOTE in the U.K. and Ireland.
Our automotive product line includes refinish paints and aerosol spray paints sold through automotive refinish distributors, body shops, automotive supply distributors and automotive supply retailers. We distribute these products under the DE BEER, VALSPAR, OCTORAL and HOUSE OF KOLOR brands in many countries around the world.
| 1 |
Other and Administrative
In addition to the main product lines within our Coatings and Paints segments, we manufacture and sell specialty polymers and colorants. The specialty polymers and colorants are manufactured for internal use and for external sale to other coatings manufacturers. We also sell furniture protection plans and furniture care and repair products under the Guardsman brand.
COMPETITION
All aspects of the coatings and paints business are highly competitive. Some of our competitors are larger and have greater financial resources than we have.
Competition in our Coatings segment is based on formulating products for specific customer applications, meeting customer delivery and application requirements, new technology offerings and pricing. As one of the world’s largest industrial coatings manufacturers, we can provide coatings solutions globally and are committed to developing new technologies.
Competition in our Paints segment is based on factors such as consumer brand recognition, product quality, distribution and price. In this segment, we support our brand awareness through advertising and highly customized merchandising and marketing support programs provided to our customers.
RAW MATERIALS
We obtain raw materials from a number of suppliers. The raw materials are derived from petrochemicals, minerals and metals. Our most significant raw materials include solvents, titanium dioxide and epoxy and other resins. Historically, these materials have been generally available on the open market, with pricing and availability subject to fluctuation. Most of the raw materials used in production are purchased from outside sources. We have made, and plan to continue to make, supply arrangements to meet our current and future usage requirements. We manage sourcing of critical raw materials by establishing contracts, buying from multiple sources and identifying alternative or lower cost materials or technology, when possible. We have active initiatives to find lower cost materials, reformulate products with lower cost and more environmentally friendly raw materials and qualify multiple and local sources of supply, including suppliers from Asia and other lower cost regions of the world.
INTELLECTUAL PROPERTY
Our practice is to seek patent protection for our products and manufacturing processes when appropriate. We also license some patented technology from third parties. Nevertheless, our business is not materially dependent upon licenses or similar rights or on any single patent or group of related patents. Although we believe our patent rights are valuable, our knowledge and trade secret information regarding our manufacturing processes and materials have also been important in maintaining our competitive position. We require certain employees to sign confidentiality agreements relating to proprietary information.
While we make efforts to protect our trade secret information, others may independently develop or otherwise acquire substantially equivalent proprietary information or techniques or inappropriately gain access to our proprietary technology or disclose this technology. Any of these factors could adversely impact the value of our proprietary trade secret information and harm our business.
SEASONALITY AND WORKING CAPITAL ITEMS
Our sales volume is traditionally lowest during the first quarter of the fiscal year (November, December and January), and highest in the third quarter of the fiscal year (May, June and July), primarily due to weather and the buying cycle in our Coatings and Paints segments. When sales are lowest, we build inventory, financed by internally generated funds and short-term and long-term debt facilities discussed in Note 9 of Notes to Consolidated Financial Statements.
SIGNIFICANT CUSTOMERS
In 2014, our sales to Lowe’s Companies, Inc. exceeded 10% of consolidated net sales. Our ten largest customers accounted for approximately 33% of consolidated net sales. Our five largest customers in the Paints segment accounted for approximately 55% of our net sales in the segment. Our five largest customers in the Coatings segment accounted for approximately 17% of our net sales in the segment.
BACKLOG AND GOVERNMENT CONTRACTS
We have no significant backlog of orders and generally are able to fill orders on a current basis. No material portion of our business is subject to renegotiation of profits or termination of contracts or subcontracts at the election of the government.
RESEARCH AND DEVELOPMENT
The base technologies that support our products’ performance and applications have been developed and optimized over many years. Our on-going applied science and development efforts are focused on delivering premium, differentiated coatings solutions that meet or exceed market needs for improved performance, consistent quality and customer value. We work closely with our customers to build a deep understanding of their challenges and objectives and to foster innovation in the products and services that we provide.
Research and development costs for fiscal 2014 were $134.1 million, or 3.0% of net sales, compared to $128.3 million, or 3.1% of net sales, for fiscal 2013 and $123.4 million, or 3.1% of net sales, for fiscal 2012.
| 2 |
ENVIRONMENTAL COMPLIANCE
We undertake to comply with applicable environmental regulations. Capital expenditures for this purpose were not material in fiscal 2014, and we do not expect such expenditures will be material in fiscal 2015.
EMPLOYEES
We employ approximately 10,500 people globally, approximately 330 of whom are subject to collective bargaining agreements in the U.S. We believe our relationship with our union employees is good.
FOREIGN OPERATIONS AND EXPORT SALES
Our foreign operations are conducted primarily through majority-owned subsidiaries and, to a limited extent, through joint ventures. Revenues from foreign subsidiaries and operations comprised approximately 46% of our total consolidated net sales in 2014.
In addition to our manufacturing plants in the U.S., we have manufacturing plants in Australia, Brazil, Canada, China, France, Germany, India, Ireland, Italy, Malaysia, Mexico, The Netherlands, New Zealand, Poland, Singapore, South Africa, Switzerland, the United Kingdom and Vietnam. We also have joint ventures in Japan, South Africa, Switzerland and Vietnam and sales offices in other countries.
During fiscal 2014, export sales from the U.S. represented 3.2% of our business.
|
RISK FACTORS
|
You should consider the following risk factors, in addition to the other information presented or incorporated by reference into this Annual Report on Form 10-K, in evaluating our business and any investment in us.
Deterioration of economic conditions could harm our business.
Our business may be adversely affected by changes in national or global economic conditions, including inflation, interest rates, access to and the functioning of capital markets, consumer spending rates, energy availability and costs (including fuel surcharges) and the effects of governmental initiatives to manage economic conditions. Deterioration of national or global economic conditions may reduce demand for our products and overall growth of the paints and coatings industry.
Volatility in financial markets and the deterioration of national or global economic conditions could impact our operations as follows:
|
•
|
the financial stability of our customers and suppliers may be compromised, which could result in additional bad debts for us or non-performance by suppliers;
|
|
•
|
it may become more costly or difficult to obtain financing to fund operations or investment opportunities, or to refinance our debt in the future; and
|
|
•
|
the value of our investments in debt and equity securities may decline, including our assets held in pension plans.
|
At various times, we utilize hedges and other derivative financial instruments to reduce our exposure to various interest rate risks, which qualify for hedge accounting for financial reporting purposes. Volatile fluctuations in market conditions could cause these instruments to become ineffective, which could require any gains or losses associated with these instruments to be reported in our earnings each period.
Fluctuations in the availability and prices of raw materials could negatively impact our financial results.
We purchase the raw materials needed to manufacture our products from a number of suppliers. Most of our raw materials are derived from petroleum, minerals and metals. Under normal market conditions, these materials are generally available from one or more suppliers on the open market. From time to time, however, the availability and costs of raw materials may fluctuate significantly, which could impair our ability to procure necessary materials, or increase the cost of manufacturing our products. As a result, our raw material costs can be volatile, and we have experienced disruptions in supplies of certain raw materials at various times. These disruptions could affect our ability to manufacture products ordered by our customers, which could negatively impact sales.
When raw material costs increase, our profit margins are reduced unless and until we are able to pass along the increases to our customers through higher prices. If raw material costs increase and if we are unable to pass along, or are delayed in passing along, those increases to our customers, we will experience profit margin reductions.
Many of our customers are in cyclical industries, which may affect the demand for our products.
Many of our customers are in businesses or industries that are cyclical and sensitive to changes in general economic conditions. As a result, the demand for our products depends, in part, upon economic cycles affecting our customers’ businesses or industries and general economic conditions. Downward economic cycles affecting the industries of our customers and the deterioration of global economic conditions may reduce our sales and profitability.
| 3 |
The industries in which we operate are highly competitive, and some of our competitors are larger than we are and may have greater financial resources than we do.
All aspects of the paints and coatings business are highly competitive. We face strong competitors in all areas of our business. Any increase in competition may cause us to lose market share or compel us to reduce prices to remain competitive, which could result in reduced margins for our products. Competitive pressures may not only impair our margins but may also impact our revenues and our growth. Many of our competitors are larger than we are and may have greater financial resources than we do. Competition with these companies could curtail price increases or require price reductions or increased spending on marketing, sales and research and development, any of which could adversely affect our results of operations.
Industry sources estimate that the ten largest coatings manufacturers represent more than half of the world’s coatings sales. Our larger competitors may have more resources to finance acquisitions or internal growth in this competitive environment and may have more resources or capabilities to conduct business with large suppliers or large customers in our industry. Finally, many of our larger competitors operate businesses in addition to paints and coatings and so may be better able to compete during coatings industry downturns.
We have a significant amount of debt.
Our total long-term and short-term debt was $1,556.4 million at October 31, 2014. Our debt categorized as short-term was $606.4 million at October 31, 2014. Our level of debt may have important consequences. For example, it:
|
•
|
may require us to dedicate a material portion of our cash flows from operations to make payments on our indebtedness, thereby reducing our ability to fund working capital, capital expenditures or other general corporate purposes;
|
|
•
|
could make us less attractive to prospective or existing customers or less able to fund potential acquisitions; and
|
|
•
|
may limit our flexibility to adjust to changing business and market conditions and make us more vulnerable to a downturn in general economic conditions as compared to a competitor that may have less indebtedness.
|
Acquisitions are an important part of our growth strategy, and future acquisitions may not be available or successful.
Acquisitions have historically contributed significantly to the growth of our company. As part of our growth strategy, we intend to continue to pursue acquisitions of complementary businesses and products. If we are not able to identify and complete future acquisitions, our growth may be negatively affected. Even if we are successful in completing future acquisitions, we may experience:
|
•
|
difficulties in assimilating acquired companies and products into our existing business;
|
|
•
|
delays in realizing the benefits from the acquired companies or products;
|
|
•
|
difficulties due to lack of or limited prior experience in any new markets we may enter;
|
|
•
|
unforeseen claims and liabilities, including unexpected environmental exposures or product liability;
|
|
•
|
unforeseen adjustments, charges and write-offs;
|
|
•
|
unexpected losses of customers of, or suppliers to, acquired businesses;
|
|
•
|
difficulties in conforming the acquired business’ standards, processes, procedures and controls with our operations;
|
|
•
|
variability in financial information arising from the application of purchase price accounting;
|
|
•
|
difficulties in retaining key employees of the acquired businesses; and
|
|
•
|
challenges arising from the increased geographic diversity and complexity of our operations.
|
Any of these factors may make it more difficult to repay our debt or have an adverse effect on results of operations. In addition, an acquisition could materially impair our operating results by causing us to incur debt or requiring us to amortize acquisition-related costs or the cost of acquired assets.
We derive a substantial portion of our revenues from foreign markets, which subjects us to additional business risks.
We conduct a substantial portion of our business outside of the U.S. We currently have production facilities, research and development facilities, and administrative and sales offices located outside the U.S., including facilities and offices located in Australia, Brazil, Canada, China, Finland, France, Germany, Greece, India, Indonesia, Ireland, Italy, Japan, Malaysia, Mexico, The Netherlands, New Zealand, Poland, Russia, Singapore, South Africa, South Korea, Spain, Switzerland, the United Arab Emirates, the United Kingdom and Vietnam. In 2014, revenues from products sold outside the U.S. accounted for approximately 46% of our consolidated net sales.
| 4 |
We expect sales in international markets to represent a significant portion of our consolidated net sales. Notwithstanding the benefits of geographic diversification, our ability to achieve and maintain profitable
growth in international markets is subject to risks related to the differing legal, political, social and regulatory requirements and economic conditions
of many jurisdictions. Risks inherent in international operations include the following:
|
•
|
agreements may be difficult to enforce, and receivables may be difficult to collect or have longer payment cycles;
|
|
•
|
foreign countries may impose additional withholding taxes or otherwise tax our foreign income or adopt other restrictions on foreign trade or investment, including currency exchange controls;
|
|
•
|
foreign operations may experience labor disputes and difficulties in attracting and retaining key employees;
|
|
•
|
transportation and other shipping costs may increase;
|
|
•
|
foreign governments may nationalize private enterprises;
|
|
•
|
unexpected adverse changes may occur in export duties, quotas and tariffs and difficulties in obtaining export licenses;
|
|
•
|
intellectual property rights may be more difficult to enforce;
|
|
•
|
fluctuations in exchange rates may affect product demand and may adversely affect the profitability in U.S. dollars of products and services we provide in international markets where payment for our products and services is made in the local currency;
|
|
•
|
our business and profitability in a particular country could be affected by political or economic changes or terrorist activities and responses to such activities;
|
|
•
|
unexpected adverse changes in foreign laws or regulatory requirements may occur; and
|
|
•
|
compliance with a variety of foreign laws and regulations may be burdensome.
|
Fluctuations in foreign currency exchange rates could affect our financial results.
We earn revenues, pay expenses, own assets and incur liabilities in countries using currencies other than the U.S. dollar. Because our consolidated financial statements are presented in U.S. dollars, we translate revenues and expenses into U.S. dollars at the average exchange rate during each reporting period, as well as assets and liabilities into U.S. dollars at exchange rates in effect at the end of each reporting period. Therefore, increases or decreases in the value of the U.S. dollar against other major currencies will affect our net revenues, operating income and the value of balance sheet items denominated in foreign currencies. We do not use derivative financial instruments to hedge our exposure to translation gains and losses. Fluctuations in foreign currency exchange rates, particularly the strengthening of the U.S. dollar against major currencies, could materially affect our financial results.
We have certain key customers, and the loss of key customers could negatively affect our business.
Our relationships with certain key customers are important to us. From 2012 through 2014, sales to our largest customer exceeded 10% of our consolidated net sales. In 2014, our ten largest customers accounted for approximately 33% of our consolidated net sales. Our five largest customers in the Paints segment accounted for approximately 55% of our net sales in the segment. Although we sell various types of products through various channels of distribution, we believe that the loss of a substantial portion of net sales to our largest customers could have a material adverse impact on us.
If the reputation of our company or one or more of its key brands is damaged, it could harm our business.
Our reputation is one of the foundations of our relationships with key customers and other stakeholders. If we are unable to effectively manage real or perceived issues that negatively affect our reputation, our ability to conduct our business could be impaired, and our financial results could suffer. As we continue to invest in advertising and promotion for our key brands, our financial success is becoming more dependent on the success of our brands. The success of these brands could suffer if our marketing plans or product initiatives do not have the desired effect on a brand’s image, reputation or ability to attract customers. Further, our growth and results could be harmed if the reputation of our company or a key brand is damaged due to real or perceived quality issues, product recalls, regulatory enforcement or actions or customer claims and litigation.
Technology changes, and our ability to protect our technology, could affect our business.
Our product and application technology is supported by underlying chemistry that has been developed over many years. Ongoing research and development efforts focus on improving our internally developed and acquired technology and formulating changes to improve the performance, profitability and cost competitiveness of our products. If our competitors develop new technology, or if our customers’ technology requirements change, and we are not able to develop competitive technology, our business and financial results could suffer. Further, although we seek to protect our proprietary technology and information
| 5 |
through
confidentiality and trade secret protection programs and practices, patents, cybersecurity measures and other means, if we
were unable to protect our material proprietary technology or information, our business and financial results could
suffer.
Interruption, failure or compromise of our information systems could adversely affect our business.
We rely on information systems to run most aspects of our business, including sales and distribution of products, purchases of raw materials and supplies, accounting for purchase and sale transactions, manufacturing processes, billing and collections and managing data and records for employees and other parties. Our business may be adversely affected if these systems are interrupted, damaged or compromised or if they fail for any extended period of time due to user errors, programming errors, computer viruses, security breaches or other problems. Information security risks have generally increased in recent years because of the proliferation of new technologies and the increased sophistication and activities of cyber attackers. Although we strive to have appropriate security controls in place, prevention of security breaches cannot be assured, particularly as cyber threats continue to evolve. We may be required to expend additional resources to continue to enhance our security measures or to investigate and remediate any security vulnerabilities. In addition, third-party service providers manage a portion of our information systems, and we are subject to risk as a result of interruption, failure or security breaches of those systems. The consequences of these risks could adversely impact our results of operations and cash flows.
Numerous laws and regulations affect our business.
We are subject to numerous laws and regulations that control the manufacturing, marketing, sale, use and disposal of our products. These laws and regulations include health, safety, product liability, environmental and labeling requirements applicable to our products and business.
Environmental laws and regulations control, among other things, the discharge of pollutants into the air and water, the handling, use, treatment, storage and clean-up of hazardous and non-hazardous wastes, the investigation and remediation of soil and groundwater affected by hazardous substances, or otherwise relating to environmental protection and various health and safety matters. These environmental laws and regulations impose strict, retroactive and joint and several liability for the costs of, and damages resulting from, cleaning up current sites, past spills, disposals and other releases of hazardous substances. Violations of these laws and regulations can also result in fines and penalties. We are currently undertaking remedial activities at a number of our facilities and properties, and have received notices under the Comprehensive Environmental Response, Compensation and Liability Act, or CERCLA, or analogous state laws, of liability or potential liability in connection with the disposal of material from our operations or former operations. Pursuant to health, safety, product liability and labeling laws and regulations, we have also been subject to various governmental enforcement actions and litigation by individuals relating to the sale or use of or exposure to our products or materials used or contained in our products, including claims for property damage or personal injury claimed to have been caused by our products or materials used or contained in our products.
We are subject to the risk that adverse decisions relating to our compliance with existing laws and regulations and new laws or regulations, or changes in existing laws or regulations or their interpretation could limit our ability to generate revenues, increase our compliance costs and expand our potential liability for enforcement actions by governmental authorities and litigation by individuals.
In addition, our customers’ or consumers’ perceptions about the acceptability or potential environmental or health effects of certain substances could require us to invest additional amounts to develop products that exclude those substances. If we are unable to develop products that exclude those substances when and if required by our customers, we may experience reduced sales and profitability.
|
UNRESOLVED STAFF COMMENTS
|
Not applicable.
|
PROPERTIES
|
We lease our principal offices located in Minneapolis, Minnesota. Our North American manufacturing operations are conducted at 23 locations (22 owned; 1 leased) in the U.S., Canada and Mexico. The total combined square footage for our principal offices and manufacturing operations in North America is approximately 4,528,000. Asia Pacific manufacturing operations are conducted at 13 locations (11 owned; 2 leased) in Australia, China, Malaysia, New Zealand, Singapore and Vietnam, with a total combined square footage of approximately 2,071,000. European manufacturing operations are conducted at 12 locations (10 owned; 2 leased) in France, Germany, Ireland, Italy, The Netherlands, Poland, Switzerland and the United Kingdom, with a total combined square footage of approximately 1,408,000. In South America, we own two manufacturing facilities in Brazil with square footage of approximately 471,000. In India, we own one manufacturing facility with square footage of approximately 113,000. In South Africa, we own one manufacturing facility with square footage of approximately 96,000.
| 6 |
Shown below is a breakdown of the approximate square footage of principal facilities by region as of October 31, 2014:
|
Region
|
Approximate
Square Footage Owned |
Approximate
Square Footage Leased |
Total
|
|||||||||
|
North America
|
4,060,000 | 468,000 | 4,528,000 | |||||||||
|
Asia Pacific
|
1,968,000 | 103,000 | 2,071,000 | |||||||||
|
Europe
|
1,298,000 | 110,000 | 1,408,000 | |||||||||
|
Other
|
680,000 | — | 680,000 | |||||||||
|
Total
|
8,006,000 | 681,000 | 8,687,000 | |||||||||
Set forth below is a breakdown of the approximate square footage of principal facilities by business segment:
|
Business Segment
|
Approximate
Square Footage |
|||
|
Coatings
|
4,903,000 | |||
|
Paints
|
3,021,000 | |||
|
Other and Administrative
|
763,000 | |||
|
Total
|
8,687,000 | |||
We believe our properties are well maintained, in good operating condition and adequate for the purposes for which they are being used. Operating capacity of our manufacturing properties varies by product line, but additional production capacity is available for most product lines by increasing the number of days and/or shifts worked.
|
LEGAL PROCEEDINGS
|
Environmental Matters
We are involved in various claims relating to environmental matters at a number of current and former plant sites and waste management sites. We engage or participate in remedial and other environmental compliance activities at certain of these sites. At other sites, we have been named as a potentially responsible party (“PRP”) under federal and state environmental laws for site remediation. We analyze each individual site, considering the number of parties involved, the level of our potential liability or contribution relative to the other parties, the nature and magnitude of the hazardous wastes involved, the method and extent of remediation, the potential insurance coverage, the estimated legal and consulting expense with respect to each site and the time period over which any costs would likely be incurred. Based on the above analysis, we estimate the clean-up costs and related claims for each site. The estimates are based in part on discussion with other PRPs, governmental agencies and engineering firms.
We accrue appropriate reserves for potential environmental liabilities when the amount of the costs that will be incurred can be reasonably determined. Accruals are reviewed and adjusted as additional information becomes available. While uncertainties exist with respect to the amounts and timing of our ultimate environmental liabilities, we believe it is neither probable nor reasonably possible that such liabilities, individually or in the aggregate, will have a material adverse effect on our financial condition, results of operations or cash flows.
Other Legal Matters
We are involved in a variety of legal claims and proceedings relating to personal injury, product liability, warranties, customer contracts, employment, trade practices, environmental and other legal matters that arise in the normal course of business. These claims and proceedings include cases where we are one of a number of defendants in proceedings alleging that the plaintiffs suffered injuries or contracted diseases from exposure to chemicals or other ingredients used in the production of some of our products or waste disposal. We are also subject to claims related to the performance of our products. We believe these claims and proceedings are in the ordinary course for a business of the type and size in which we are engaged. While we are unable to predict the ultimate outcome of these claims and proceedings, we believe it is neither probable nor reasonably possible that the costs and liabilities of such matters, individually or in the aggregate, will have a material adverse effect on our financial condition, results of operations or cash flows.
|
MINE SAFETY DISCLOSURES
|
Not applicable.
| 7 |
EXECUTIVE OFFICERS OF THE REGISTRANT
The names and ages of all of our executive officers, all of whom are approved by the Board of Directors for re-election in February of each year, and the positions held by them are as listed below. There are no family relationships between any of the officers or between any officer and director.
|
Name
|
Age
|
Position
|
||
|
Gary E. Hendrickson
|
58
|
Chairman since June 2012, Chief Executive Officer since June 2011 and President since February 2008
|
||
|
James L. Muehlbauer
|
53
|
Executive Vice President and Chief Financial and Administrative Officer since March 2013
|
||
|
Rolf Engh
|
61
|
Executive Vice President since July 2005, General Counsel and Secretary since April 1993
|
||
|
Anthony L. Blaine
|
47
|
Senior Vice President, Human Resources since January 2007
|
||
|
Cynthia A. Arnold
|
57
|
Senior Vice President and Chief Technology Officer since January 2011
|
The foregoing executive officers have served in the stated capacity for the registrant during the past five years, except for the following:
Mr. Hendrickson was also Chief Operating Officer from February 2008 to June 2011.
Prior to March 2013, Mr. Muehlbauer was Executive Vice President and Chief Financial Officer at Best Buy Co., Inc. since April 2008.
Prior to January 2011, Ms. Arnold was Chief Technology Officer at Sun Chemical Corporation since July 2004.
|
ITEM 5
|
Our Common Stock is listed on the New York Stock Exchange under the trading symbol VAL. The table below sets forth the quarterly high and low market prices of Common Stock for fiscal years 2014 and 2013 as quoted on the New York Stock Exchange.
|
Market Price (high/low)
|
|||||||
|
For the Fiscal Year
|
2014
|
2013
|
|||||
|
First Quarter
|
$
|
73.74–68.18
|
$
|
68.42–55.17
|
|||
|
Second Quarter
|
$
|
76.18–66.94
|
$
|
68.30–58.97
|
|||
|
Third Quarter
|
$
|
82.00–71.78
|
$
|
74.25–62.32
|
|||
|
Fourth Quarter
|
$
|
82.26–72.15
|
$
|
71.32–61.13
|
|||
The quarterly dividend declared November 25, 2014, to be paid on December 19, 2014 to common stockholders of record December 8, 2014, was increased to $0.30 per share. The table below sets forth the quarterly dividends paid for fiscal years 2014 and 2013.
|
Per Share Dividends
|
|||||||
|
For the Fiscal Year
|
2014
|
2013
|
|||||
|
First Quarter
|
$
|
0.26
|
$
|
0.23
|
|||
|
Second Quarter
|
$
|
0.26
|
$
|
0.23
|
|||
|
Third Quarter
|
$
|
0.26
|
$
|
0.23
|
|||
|
Fourth Quarter
|
$
|
0.26
|
$
|
0.23
|
|||
|
$
|
1.04
|
$
|
0.92
|
||||
The number of record holders of our Common Stock at December 9, 2014 was 1,214.
ISSUER PURCHASES OF EQUITY SECURITIES
|
Period
|
Total Number
of Shares
Purchased1
|
Average
Price Paid
per Share
|
Total Number of
Shares Purchased as Part
of Publicly Announced
Plans or Programs1
|
Maximum Number
of Shares that May
Yet be Purchased Under
the Plans or Programs1
|
|||||||||
|
7/26/14 – 8/22/14
|
|||||||||||||
|
Repurchase program
|
308,323
|
$
|
77.33
|
308,323
|
5,871,974
|
||||||||
|
8/23/14 – 9/19/14
|
|||||||||||||
|
Repurchase program
|
297,500
|
$
|
80.34
|
297,500
|
5,574,474
|
||||||||
|
9/20/14 – 10/31/14
|
|||||||||||||
|
Repurchase program
|
555,000
|
$
|
77.76
|
555,000
|
5,019,474
|
||||||||
|
1
|
On December 5, 2012, we received board authorization to repurchase 15,000,000 shares, with no predetermined end date. In fiscal 2014, we repurchased 4,705,081 shares. On November 21, 2014, following the end of fiscal year 2014, the Board approved a new share repurchase program, with no expiration date, authorizing us to purchase up to $1.5 billion of outstanding shares of Common Stock. This new program was effective immediately and replaced the previous repurchase authorization.
|
| 8 |
Stock Performance Graph
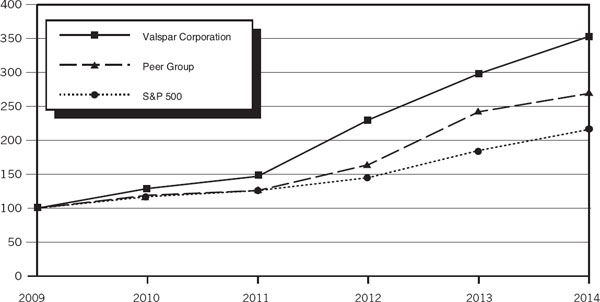
The following graph compares our cumulative total stockholder return for the last five fiscal years with the cumulative total return of the Standard & Poor’s 500 Stock Index and a peer group of companies selected by us on a line-of-business basis. The graph assumes the investment of $100 in our Common Stock, the S&P 500 Index and the peer group at the end of fiscal 2009 and the reinvestment of all dividends.
The companies selected to form the peer group index are: Akzo Nobel N.V.; Ferro Corporation; H.B. Fuller Company; Masco Corporation; Newell Rubbermaid Inc.; PPG Industries, Inc.; RPM International Inc.; and The Sherwin-Williams Company.
COMPARISON OF FIVE YEAR CUMULATIVE TOTAL RETURN
Among The Valspar Corporation, a Peer Group and the S&P 500 Index
|
Cumulative Total Return
|
|||||||||||||||||||
|
Fiscal Year End
|
2009
|
2010
|
2011
|
2012
|
2013
|
2014
|
|||||||||||||
|
Valspar
|
$
|
100
|
$
|
129
|
$
|
147
|
$
|
230
|
$
|
298
|
$
|
353
|
|||||||
|
Peer Group
|
$
|
100
|
$
|
119
|
$
|
126
|
$
|
164
|
$
|
242
|
$
|
269
|
|||||||
|
S&P 500
|
$
|
100
|
$
|
117
|
$
|
126
|
$
|
145
|
$
|
185
|
$
|
216
|
|||||||
Assumes $100 invested on October 30, 2009 in the Common Stock of The Valspar Corporation, the Peer Group and the S&P 500 Index, including reinvestment of dividends.
| 9 |
The following selected financial data has been derived from our audited Consolidated Financial Statements and should be read in conjunction with “Management’s Discussion and Analysis of Financial Condition and Results of Operations” and the Consolidated Financial Statements and related Notes included elsewhere in this Form 10-K.
|
Fiscal Years
|
||||||||||||||||||
|
(Dollars in thousands,
except per share amounts)
|
2014
|
2013
|
2012
|
2011
|
2010
|
|||||||||||||
|
Operating Results
|
Net Sales
|
$
|
4,522,424
|
$
|
4,103,776
|
$
|
4,020,851
|
$
|
3,952,954
|
$
|
3,226,687
|
|||||||
|
Cost and Expenses
|
||||||||||||||||||
|
Cost of Sales
|
2,983,378
|
2,745,718
|
2,667,147
|
2,721,146
|
2,155,009
|
|||||||||||||
|
Operating Expense
|
979,137
|
865,634
|
871,434
|
862,160
|
695,601
|
|||||||||||||
|
Impairment of Goodwill and Intangible Assets
|
—
|
—
|
—
|
409,714
|
—
|
|||||||||||||
|
Income (Loss) from Operations
|
559,909
|
492,424
|
482,270
|
(40,066
|
)
|
376,077
|
||||||||||||
|
Interest Expense
|
65,330
|
64,758
|
67,604
|
61,511
|
58,267
|
|||||||||||||
|
Other (Income) Expense – Net
|
2,697
|
3,871
|
(2,558
|
)
|
1,577
|
(1,387
|
)
|
|||||||||||
|
Income (Loss) Before Income Taxes
|
491,882
|
423,795
|
417,224
|
(103,154
|
)
|
319,197
|
||||||||||||
|
Net Income (Loss)
|
345,401
|
289,255
|
292,497
|
(138,601
|
)
|
222,056
|
||||||||||||
|
Net Income as a Percent of Sales
|
7.6
|
%
|
7.0
|
%
|
7.3
|
%
|
N/A
|
6.9
|
%
|
|||||||||
|
Return on Average Equity
|
32.4
|
%
|
24.7
|
%
|
24.0
|
%
|
N/A
|
14.2
|
%
|
|||||||||
|
Per Common Share:
|
||||||||||||||||||
|
Net Income (Loss) – Basic
|
$
|
4.13
|
$
|
3.29
|
$
|
3.20
|
$
|
(1.47
|
)
|
$ | 2.25 | |||||||
|
Net Income (Loss) – Diluted1
|
4.01
|
3.20
|
3.10
|
(1.47
|
)
|
2.20
|
||||||||||||
|
Dividends Paid
|
1.04
|
0.92
|
0.80
|
0.72
|
0.64
|
|||||||||||||
|
Financial Position
|
Total Assets
|
$
|
4,033,951
|
$
|
4,025,509
|
$
|
3,626,836
|
$
|
3,500,151
|
$
|
3,867,936
|
|||||||
|
Working Capital2
|
725,834
|
591,591
|
538,559
|
538,025
|
530,435
|
|||||||||||||
|
Property, Plant and Equipment, Net
|
645,102
|
633,475
|
550,968
|
548,253
|
567,630
|
|||||||||||||
|
Long-Term Debt, Net of Current Portion
|
950,035
|
1,037,392
|
1,012,578
|
679,805
|
943,216
|
|||||||||||||
|
Stockholders’ Equity
|
1,011,091
|
1,122,550
|
1,223,523
|
1,212,550
|
1,630,365
|
|||||||||||||
|
Other Statistics
|
Property, Plant and Equipment
|
|||||||||||||||||
|
Expenditures
|
$
|
121,271
|
$
|
116,749
|
$
|
89,363
|
$
|
66,469
|
$
|
67,732
|
||||||||
|
Depreciation and Amortization
|
||||||||||||||||||
|
Expense
|
100,910
|
88,159
|
93,704
|
97,747
|
81,312
|
|||||||||||||
|
Research and Development
|
||||||||||||||||||
|
Expense
|
134,134
|
128,265
|
123,401
|
120,056
|
105,090
|
|||||||||||||
|
Total Cash Dividends
|
$
|
87,427
|
$
|
81,189
|
$
|
73,351
|
$
|
68,164
|
$
|
63,279
|
||||||||
|
Average Diluted Common Shares Outstanding (000’s)
|
86,046
|
90,526
|
94,380
|
94,310
|
100,866
|
|||||||||||||
|
Number of Stockholders at
|
||||||||||||||||||
|
Year End
|
1,219
|
1,290
|
1,365
|
1,405
|
1,432
|
|||||||||||||
|
Number of Employees at
|
||||||||||||||||||
|
Year End
|
10,513
|
10,702
|
9,755
|
10,020
|
10,180
|
|||||||||||||
|
Market Price Range – Common Stock:
|
||||||||||||||||||
|
High
|
$
|
82.26
|
$
|
74.25
|
$
|
59.81
|
$
|
40.60
|
$
|
33.13
|
||||||||
|
Low
|
66.94
|
55.17
|
33.17
|
27.44
|
25.11
|
|||||||||||||
Reference is made to the Notes to Consolidated Financial Statements for a summary of accounting policies and additional information.
|
1
|
In 2014, 2013, 2012, 2011, and 2010, net income (loss) per common share diluted includes $0.34, $0.32, $0.18, $0.24 and $0.08 per share in restructuring charges, respectively. See Note 18 in Notes to Consolidated Financial Statements for more information on 2014, 2013 and 2012. Net income (loss) per common share diluted for 2011 includes an impairment charge on goodwill and intangible assets of $3.75. In 2013, 2011 and 2010, net income (loss) per common share diluted includes $0.02, $0.09 and $0.03 in acquisition-related charges, respectively. Net income (loss) per common share diluted in 2010 includes gains on sale of certain assets of $0.08. Adjusted net income per common share diluted, excluding the items mentioned above, was $4.35 for 2014, $3.54 for 2013, $3.28 for 2012, and $2.65 for 2011, which includes a dilutive share impact of $0.04, and $2.23 for 2010. See related reconciliation in “Management’s Discussion and Analysis of Financial Condition and Results of Operations – Non-GAAP Financial Measures” for more information on 2014 and 2013.
|
|
2
|
We define Working Capital as accounts and notes receivable plus inventory less trade accounts payable.
|
| 10 |
|
ITEM 7
|
Management’s Discussion and Analysis of Financial Condition and Results of Operations (MD&A) is intended to provide a reader of our financial statements with a narrative from the perspective of management on our financial condition, results of operations, liquidity and certain other factors that may affect our future results. Unless otherwise noted, transactions, trends and other factors significantly impacting our financial condition, results of operations and liquidity are discussed in order of magnitude. In addition, unless expressly stated otherwise, the comparisons presented in this MD&A refer to the same period in the prior year. Our MD&A is presented in seven sections:
|
•
|
Overview
|
|
•
|
Results of Operations
|
|
•
|
Financial Condition
|
|
•
|
Non-GAAP Financial Measures
|
|
•
|
Critical Accounting Estimates
|
|
•
|
Off-Balance Sheet Arrangements
|
|
•
|
Forward-Looking Statements
|
Our MD&A should be read in conjunction with the Consolidated Financial Statements and related Notes included in Item 8, Financial Statements and Supplementary Data, of this Form 10-K.
OVERVIEW
The Valspar Corporation is a global leader in the paints and coatings industry. We develop, manufacture and distribute a broad range of coatings, paints and related products and we operate our business in two reportable segments: Coatings and Paints. Our Coatings segment aggregates our industrial product lines and our packaging product line. Our Paints segment aggregates our consumer paints and automotive refinish product lines. See Note 15 in Notes to Consolidated Financial Statements for further information on our reportable segments.
We operate in over 25 countries, and approximately 46% of our total net sales in 2014 was generated outside of the U.S. In the discussions of our operating results, we sometimes refer to the impact of changes in foreign currency exchange rates or the impact of foreign currency exchange rate fluctuations, which are references to the differences between the foreign currency exchange rates we use to convert international operating results from local currencies into U.S. dollars for reporting purposes. The impact of foreign currency exchange rate fluctuations is calculated as the difference between current period activity translated using the current period’s currency exchange rates and the comparable prior-year period’s currency exchange rates. We use this method to calculate the impact of changes in foreign currency exchange rates for all countries where the functional currency is not the U.S. dollar.
We have a 4-4-5 week accounting cycle with the fiscal year ending on the Friday on or immediately preceding October 31. Fiscal year 2014 included 53 weeks while fiscal years 2013 and 2012 both included 52 weeks.
Our fundamental business objective is to create long-term value for our stockholders. We intend to accomplish this by:
|
•
|
Focusing on Customer Success by delivering coatings products and solutions that add value for our customers;
|
|
•
|
Building Strong Brands and Distribution Partners by investing in brands that are well recognized in the markets in which we operate and building differentiated distribution networks in key markets;
|
|
•
|
Developing Differentiated Technologies by investing in technologies that enhance our competitive position and add value for our customers;
|
|
•
|
Driving Industry-Leading Innovation by developing unique products and services that differentiate us in the marketplace with our customers; and
|
|
•
|
Attracting and Developing the Best People by creating a world class team with deep expertise and stockholder value orientation.
|
In addition to creating value for our shareholders, we are committed to:
|
•
|
Adhering to our values, engaging in ethical business conduct and doing business with integrity;
|
|
•
|
Improving the safety and reducing the environmental footprint of our business and the products we manufacture while also delivering solutions that enable our customers to meet their safety and environmental objectives; and
|
|
•
|
Demonstrating our corporate citizenship by supporting the communities in which we work and live through volunteer efforts and philanthropy.
|
The following discussion of results of operations and financial condition should be read in the context of this overview.
| 11 |
RESULTS OF OPERATIONS
Overview
In North America, many of the markets in which we compete continued to improve. We increased our market share and net sales in Europe and Asia despite challenging economic conditions. In Australia, we gained new business in an improving market.
Raw material costs in our industries remained stable throughout 2013 and 2014. Since our raw material costs average approximately 80% of our cost of goods sold, the efficient use of raw materials is a critical cost component of the products we manufacture.
Net sales in 2014 increased 10.2% to $4,522,424 from $4,103,776 in 2013, primarily due to our acquisition of the Inver Group, new business across all significant product lines and regions and the 53rd week in fiscal year 2014. Our gross profit rate of 34.0% increased from 33.1% in the prior year primarily due to improved productivity, favorable price/cost comparison and leverage from increased volumes. Our operating expenses, as a percentage of net sales, increased to 21.7% from 21.1% last year driven by investments to support our growth initiatives, primarily in the Paints segment, and higher incentive compensation. Net income as a percent of sales of 7.6% increased from 7.0% in the prior year despite higher restructuring charges in 2014.
Restructuring
Fiscal year 2014 restructuring expenses, relating primarily to initiatives that began in fiscal year 2013, included the following: (i) actions in the Paints segment to consolidate manufacturing and distribution operations following the acquisition of Ace Hardware Corporation’s paint manufacturing business, ongoing profit improvement plans in Australia, and other actions in Asia, (ii) actions in our Coatings segment to consolidate manufacturing operations in Europe following the acquisition of the Inver Group, and other actions to rationalize manufacturing operations and lower operating expenses, and (iii) overall initiatives to improve our global cost structure, including non-manufacturing headcount reductions. Most of these restructuring activities were completed in 2014. In the fourth quarter of 2014, we initiated activities to rationalize manufacturing operations in the Coatings segment in the Australia region, which we expect to complete in 2015. Total restructuring charges were $41,139 or $0.34 per share in fiscal year 2014 and $36,433 or $0.32 per share in fiscal year 2013. Included in fiscal year 2014 and 2013 restructuring charges were $11,141 and $6,664 of non-cash pre-tax asset impairment charges, respectively.
See Note 18 in Notes to Consolidated Financial Statements for further information on restructuring. See reconciliation in “Management’s Discussion and Analysis of Financial Condition and Results of Operations – Non-GAAP Financial Measures” for more information on the per share impact of restructuring charges.
Financial Results 2014 vs. 2013
The following tables present selected financial data for the years ended October 31, 2014 and October 25, 2013.
|
Net Sales
|
2014
|
2013
|
% Change
|
|||||||
|
Coatings
|
$
|
2,511,088
|
$
|
2,209,492
|
13.7
|
%
|
||||
|
Paints
|
1,786,448
|
1,671,228
|
6.9
|
%
|
||||||
|
Other and Administrative
|
224,888
|
223,056
|
0.8
|
%
|
||||||
|
Consolidated Net Sales
|
$
|
4,522,424
|
$
|
4,103,776
|
10.2
|
%
|
|
•
|
Consolidated Net Sales – Consolidated net sales for the year increased 10.2%, including a positive impact of 4.9% from the fiscal year 2013 acquisitions of the Inver Group and the paint manufacturing business of Ace Hardware (Ace paints), a positive impact of 1.0% from the 53rd week in fiscal year 2014 and a negative impact of 0.7% from foreign currency. The remaining increase in sales of 5.0% was due to new business across all significant product lines and growth of existing business in our consumer product lines.
|
|
•
|
Coatings Segment Net Sales – Our Coatings segment net sales for the year increased 13.7%, including a positive impact of 8.8% from our Inver Group acquisition, a positive impact of 1.1% from the 53rd week in fiscal year 2014 and a negative impact of 0.6% from foreign currency. The remaining increase in sales of 4.4% was due to volume growth driven by new business in all product lines, partially offset by continued weakness in our North America general industrial product line.
|
|
•
|
Paints Segment Net Sales – Our Paints segment net sales for the year increased 6.9%, including a positive impact of 0.8% from the 53rd week in fiscal 2014, a positive impact of 0.5% from our Ace paints acquisition and a negative impact of 1.1% from foreign currency. The remaining increase in sales of 6.7% reflects new business in all regions and growth in our North America home improvement channel.
|
|
•
|
Other and Administrative Net Sales – The Other and Administrative category includes the following product lines: resins, furniture protection plans and colorants. Other and Administrative net sales increased 0.8%, including a positive impact of 1.4% from the 53rd week in fiscal 2014 and a positive impact of 0.5% from foreign currency. The offsetting decrease of 1.1% was primarily due to decreased sales of resins.
|
| 12 |
|
Gross Profit
|
2014
|
2013
|
||||||
|
Consolidated Gross Profit
|
$ | 1,539,046 | $ | 1,358,058 | ||||
|
As a percent of Net Sales
|
34.0 | % | 33.1 | % | ||||
|
•
|
Gross Profit – The gross profit rate increased 0.9 percentage points. This was primarily due to improved productivity, including benefits from completed restructuring actions, favorable price/cost comparison and leverage from increased volumes, partially offset by investments in strategic acquisitions, which had lower initial margins. Restructuring charges of $28,471 or 0.6% of net sales and $21,916 or 0.5% of net sales were included in the 2014 and 2013 periods, respectively. There were no acquisition-related charges in 2014 compared to $513 or 0.01% of net sales in 2013.
|
|
Operating Expenses
|
2014
|
2013
|
||||||
|
Consolidated Operating Expenses1
|
$ | 979,137 | $ | 865,634 | ||||
|
As a percent of Net Sales
|
21.7 | % | 21.1 | % | ||||
|
1
|
Includes research and development, selling, general and administrative, restructuring and acquisition-related costs. For breakout see Consolidated Statements of Operations.
|
|
•
|
Consolidated Operating Expenses (dollars) – Consolidated operating expenses increased $113,503 or 13.1% compared to the prior year primarily due to investments to support our growth initiatives, the effect of our Inver Group acquisition and higher incentive compensation. Restructuring charges of $12,668 or 0.3% of net sales and $14,517 or 0.4% of net sales were included in the 2014 and 2013 periods, respectively. There were no acquisition-related charges in 2014, compared to $1,729 or 0.04% of net sales in 2013.
|
|
EBIT2
|
2014
|
2013
|
||||||
|
Coatings
|
$ | 389,390 | $ | 329,886 | ||||
|
As a percent of Net Sales
|
15.5 | % | 14.9 | % | ||||
|
Paints
|
192,222 | 168,395 | ||||||
|
As a percent of Net Sales
|
10.8 | % | 10.1 | % | ||||
|
Other and Administrative
|
(24,400 | ) | (9,728 | ) | ||||
|
As a percent of Net Sales
|
(10.8 | )% | (4.4 | )% | ||||
|
Consolidated EBIT
|
$ | 557,212 | $ | 488,553 | ||||
|
As a percent of Net Sales
|
12.3 | % | 11.9 | % | ||||
|
2
|
EBIT is defined as earnings before interest and taxes.
|
|
•
|
Consolidated EBIT – EBIT for 2014 increased $68,659 or 14.1% from the prior year. Fiscal year 2014 results included restructuring charges of $41,139 or 0.9% of net sales, compared to $36,433 or 0.9% of net sales in fiscal year 2013. There were no acquisition-related charges in fiscal year 2014, compared to charges of $2,242 or 0.1% of net sales in fiscal year 2013. Foreign currency exchange fluctuation had an immaterial effect on Consolidated and segment EBIT.
|
|
•
|
Coatings Segment EBIT – EBIT as a percent of net sales increased 60 basis points from the prior year, primarily due to improved productivity, including the benefits from completed restructuring actions, leverage from higher volumes and a favorable price/cost comparison, partially offset by higher restructuring charges and the effect of the Inver Group acquisition. Restructuring charges for the 2014 and 2013 periods were $28,902 or 1.2% of net sales and $19,492 or 0.9% of net sales, respectively. There were no acquisition-related charges in 2014, compared to $2,242 or 0.1% of net sales in 2013.
|
|
•
|
Paints Segment EBIT – EBIT as a percent of net sales increased 70 basis points from the prior year, primarily due to improved sales mix, productivity, including the benefits from completed restructuring actions, and lower restructuring charges, partially offset by investments to support our growth initiatives. Restructuring charges for 2014 and 2013 periods were $11,934 or 0.7% of net sales and $14,953 or 0.9% of net sales, respectively.
|
|
•
|
Other and Administrative EBIT – Other and Administrative EBIT includes corporate expenses. EBIT as a percent of net sales decreased 640 basis points from the prior year primarily due to higher incentive compensation accruals, partially offset by lower restructuring charges. EBIT included restructuring charges of $303 or 0.1% of net sales and $1,988 or 0.9% of net sales in the 2014 and 2013 periods, respectively.
|
|
Interest Expense
|
2014
|
2013
|
||||||
|
Consolidated Interest Expense
|
$ | 65,330 | $ | 64,758 | ||||
|
•
|
Interest Expense – Interest expense increased slightly in fiscal year 2014 primarily due to a higher average debt balance, partially offset by lower average interest rates.
|
|
Effective Tax Rate
|
2014
|
2013
|
||||||
|
Effective Tax Rate
|
29.8 | % | 31.7 | % | ||||
|
•
|
Effective Tax Rate – The lower 2014 effective tax rate was primarily due to favorable changes in geographical mix of earnings.
|
|
Net Income (Loss)
|
2014
|
2013
|
% Change
|
|||||||||
|
Consolidated Net Income (Loss)
|
$ | 345,401 | $ | 289,255 | 19.4 | % | ||||||
| 13 |
Financial Results 2013 vs. 2012
The following tables present selected financial data for the years ended October 25, 2013 and October 26, 2012.
|
Net Sales
|
2013
|
2012
|
% Change
|
|||||||||
|
Coatings
|
$ | 2,209,492 | $ | 2,175,687 | 1.6 | % | ||||||
|
Paints
|
1,671,228 | 1,604,599 | 4.2 | % | ||||||||
|
Other and Administrative
|
223,056 | 240,565 | (7.3 | )% | ||||||||
|
Consolidated Net Sales
|
$ | 4,103,776 | $ | 4,020,851 | 2.1 | % | ||||||
|
•
|
Consolidated Net Sales – Consolidated net sales for the year increased 2.1%, including a positive impact of 2.4% from acquisitions and a negative impact of 0.5% from foreign currency. The remaining increase in sales of 0.2% was due to new business across all significant product lines and regions. The increase was partially offset by volume declines caused by continued weakness in our global general industrial product line, a weak residential housing market in Australia and lower sales in our China consumer paints product line.
|
|
•
|
Coatings Segment Net Sales – Our Coatings segment net sales for the year increased 1.6%, including a positive impact of 1.4% from acquisitions and a negative impact of 0.6% from foreign currency. The remaining increase in sales of 0.8% was primarily due to volume growth driven by new business in all significant product lines, which was partially offset by continued weakness in our general industrial product line.
|
|
•
|
Paints Segment Net Sales – Our Paints segment net sales for the year increased 4.2%, including a positive impact of 4.2% from acquisitions and a negative impact of 0.3% from foreign currency. The remaining increase in sales of 0.3% reflects new business in our North America consumer paints market, partially offset by declines in international consumer markets due to a weak residential housing market in Australia and lower sales in China.
|
|
•
|
Other and Administrative Net Sales – The Other and Administrative category includes the following product lines: resins, furniture protection plans, colorants and gelcoats. Other and Administrative net sales decreased 7.3%, including a negative impact of 0.1% from foreign currency. The decline was primarily due to our exit from the gelcoat products market in the fourth quarter of 2012.
|
|
Gross Profit
|
2013
|
2012
|
||||||
|
Consolidated Gross Profit
|
$ | 1,358,058 | $ | 1,353,704 | ||||
|
As a percent of Net Sales
|
33.1 | % | 33.7 | % | ||||
|
•
|
Gross Profit – The gross profit rate decreased 0.6% primarily due to investments in strategic acquisitions, which had lower initial margins, changes in certain vendor support programs and higher restructuring charges, partially offset by slightly lower raw material costs. Restructuring charges of $21,916 or 0.5% of net sales and $16,199 or 0.4% of net sales were included in the 2013 and 2012 periods, respectively. Acquisition-related charges were $513, or 0.01% of net sales in 2013. There were no acquisition-related charges included in gross profit in the 2012 period.
|
|
Operating Expenses
|
2013
|
2012
|
||||||
|
Consolidated Operating Expenses1
|
$ | 865,634 | $ | 871,434 | ||||
|
As a percent of Net Sales
|
21.1 | % | 21.7 | % | ||||
|
1
|
Includes research and development, selling, general and administrative, restructuring and acquisition-related costs. For breakout see Consolidated Statements of Operations.
|
|
•
|
Consolidated Operating Expenses (dollars) – Consolidated operating expenses decreased 0.7% compared to the prior year primarily due to changes in certain vendor support programs in our Paints segment and lower incentive compensation, partially offset by investments to support growth initiatives in both our Paints and Coatings segments and higher restructuring charges. Restructuring charges of $14,517 or 0.4% of net sales and $9,646 or 0.2% of net sales were included in the 2013 and 2012 periods, respectively. Acquisition-related charges were $1,729, or 0.04% of net sales in 2013. There were no acquisition-related charges included in operating expenses in the 2012 period.
|
|
EBIT2
|
2013
|
2012
|
||||||
|
Coatings
|
$ | 329,886 | $ | 356,428 | ||||
|
As a percent of Net Sales
|
14.9 | % | 16.4 | % | ||||
|
Paints
|
168,395 | 159,598 | ||||||
|
As a percent of Net Sales
|
10.1 | % | 9.9 | % | ||||
|
Other and Administrative
|
(9,728 | ) | (31,198 | ) | ||||
|
As a percent of Net Sales
|
(4.4 | )% | (13.0 | )% | ||||
|
Consolidated EBIT
|
$ | 488,553 | $ | 484,828 | ||||
|
As a percent of Net Sales
|
11.9 | % | 12.1 | % | ||||
|
2
|
EBIT is defined as earnings before interest and taxes.
|
|
•
|
Consolidated
EBIT – EBIT for 2013 increased $3,725 or 0.8% from the prior year. Fiscal year 2013 results included
restructuring charges of $36,433 or 0.9% of net sales, compared to $25,845 or 0.6% of net sales in fiscal year 2012. Fiscal
year 2013 also included acquisition-related charges of $2,242 or 0.1% of net sales. There were no acquisition-related charges
in the 2012 period. Foreign currency exchange fluctuation had an immaterial effect on Consolidated EBIT, as well as EBIT of the segments discussed below.
|
| 14 |
|
•
|
Coatings Segment EBIT – EBIT as a percent of net sales decreased 150 basis points from the prior year, primarily due to higher restructuring charges, price declines and investments in long-term growth initiatives, partially offset by slightly lower raw material costs and lower incentive compensation costs. Restructuring charges for the 2013 and 2012 periods were $19,492 or 0.9% of net sales and $1,418 or 0.1% of net sales, respectively. Acquisition-related charges were $2,242 or 0.1% of net sales. There were no acquisition-related charges in the 2012 period.
|
|
•
|
Paints Segment EBIT – EBIT as a percent of net sales increased 20 basis points from the prior year, primarily due to slightly lower raw material costs and lower restructuring charges, partially offset by the effect of our Ace paints acquisition, which had lower initial margins, and investments in long-term growth initiatives. Restructuring charges for 2013 and 2012 periods were $14,953 or 0.9% of net sales and $18,392 or 1.1% of net sales, respectively.
|
|
•
|
Other and Administrative EBIT – Other and Administrative EBIT includes corporate expenses. EBIT as a percent of net sales increased 860 basis points from the prior year primarily due to lower incentive compensation and lower restructuring charges. EBIT included restructuring charges of $1,988 or 0.9% of net sales and $6,035 or 2.5% of net sales in the 2013 and 2012 periods, respectively.
|
|
Interest Expense
|
2013
|
2012
|
||||||
|
Consolidated Interest Expense
|
$ | 64,758 | $ | 67,604 | ||||
|
•
|
Interest Expense – Interest expense decreased in fiscal year 2013 due to lower average interest rates, partially offset by a higher average debt balance. In 2013, although our average debt levels increased, a greater percentage of our debt was commercial paper, which carries a lower interest rate.
|
|
Effective Tax Rate
|
2013
|
2012
|
||||||
|
Effective Tax Rate
|
31.7 | % | 29.9 | % | ||||
|
•
|
Effective Tax Rate – The higher 2013 effective tax rate was primarily due to unfavorable changes in geographical mix of earnings.
|
|
Net Income (Loss)
|
2013
|
2012
|
% Change
|
|||||||
|
Consolidated Net Income (Loss)
|
$
|
289,255
|
$
|
292,497
|
(1.1
|
)%
|
FINANCIAL CONDITION
Cash Flow and Net Working Capital
Cash flow from operations was $347,104 in 2014, compared to $398,504 in 2013 and $348,868 in 2012. The decrease in cash flow from operations in 2014 was primarily driven by higher working capital, including bankers’ acceptance drafts and commercial acceptance drafts, and cash payments on restructuring expenses. A key metric we use to measure the effectiveness of our working capital management is net working capital as a percentage of annual net sales:
|
Oct. 31,
2014
|
% of
Net
Sales
|
Oct. 25,
2013
|
% of
Net
Sales
|
||||||||||
|
Accounts and notes receivable, net
|
$
|
840,447
|
18.6
|
%
|
$
|
771,396
|
18.8
|
%
|
|||||
|
Inventories
|
486,262
|
10.8
|
%
|
438,982
|
10.7
|
%
|
|||||||
|
Trade accounts payable
|
(600,875
|
)
|
13.3
|
%
|
(618,787
|
)
|
(15.1
|
)%
|
|||||
|
Net Working Capital
|
$
|
725,834
|
16.0
|
%
|
$
|
591,591
|
14.4
|
%
|
|||||
Our net working capital as a percentage of net sales increased to 16.0% from 14.4%, primarily due to increases in accounts receivable and inventory driven by growth initiatives. Accounts payable decreased slightly due to timing of payments.
In 2014, we used cash flow from operations and $80,483 in net proceeds from issuance of debt and commercial paper and cash on hand to fund $349,181 in share repurchases and $121,271 in capital expenditures. We used cash on hand and $24,233 in proceeds from stock options exercised to fund $87,427 in dividend payments.
See Notes 1 and 7 in Notes to Consolidated Financial Statements for more information related to our restricted cash, which is restricted from withdrawal for contractual or legal reasons.
Debt and Capital Resources
The ratio of total debt to capital was 60.6% at October 31, 2014, compared to 56.8% at October 25, 2013. Average debt outstanding during 2014 was $1,608,935 at a weighted average interest rate of 4.06% versus $1,338,557 at 4.84% last year. Interest expense for 2014 was $65,330 compared to $64,758 in 2013.
We maintain an unsecured revolving credit facility with a syndicate of banks. On December 16, 2013, we entered into an amended and restated $750,000 credit facility with a syndicate of banks with a maturity date of December 14, 2018. Under certain circumstances we have the option to increase this credit facility to $1,000,000. This facility replaced the previous $550,000 credit facility scheduled to expire December 31, 2014.
| 15 |
In July 2013, we entered into a U.S. dollar equivalent unsecured committed revolving bilateral credit facility, expiring July 2014. In July 2014, this facility was extended for one year to July 2015.
As of October 31, 2014 and October 25, 2013, our bank facilities consisted of the following:
| October 31, 2014 | ||||||||
|
Total
|
Facility
|
|||||||
|
Outstanding
|
Size
|
|||||||
|
December 2018 bank syndicate facility1
|
$ | 488,876 | $ | 750,000 | ||||
|
July 2015 bilateral facility
|
13,938 | 13,938 | ||||||
|
Total unsecured committed revolving credit
|
502,814 | 763,938 | ||||||
|
Uncommitted bank lines of credit
|
17,202 | 196,301 | ||||||
|
Bankers’ Acceptance Drafts and Commercial Acceptance Drafts
|
23,838 | — | ||||||
|
Total Bank Credit Facilities
|
$ | 543,854 | $ | 960,239 | ||||
| October 25, 2013 | ||||||||
|
Total
|
Facility
|
|||||||
|
Outstanding
|
Size
|
|||||||
|
December 2018 bank syndicate facility1
|
$ | 322,483 | $ | 750,000 | ||||
|
July 2014 bilateral facility
|
107,767 | 107,767 | ||||||
|
Total unsecured committed revolving credit
|
430,250 | 857,767 | ||||||
|
Uncommitted bank lines of credit
|
10,915 | 182,778 | ||||||
|
Total Bank Credit Facilities
|
$ | 441,165 | $ | 1,040,545 | ||||
|
1
|
Our bank syndicate facility includes $100,000 of revolving credit facility borrowings as of October 31, 2014, along with $388,876 and $322,483 of commercial paper as of October 31, 2014 and October 25, 2013, respectively. We have a $450,000 commercial paper program backstopped by our $750,000 credit facility, as amended and restated.
|
We maintain uncommitted bank lines of credit to meet short-term funding needs in certain of our international locations. These arrangements are reviewed periodically for renewal and modification.
Our credit facilities have covenants that require us to maintain certain financial ratios. We were in compliance with these covenants as of October 31, 2014. Our debt covenants do not limit, nor are they reasonably likely to limit, our ability to obtain additional debt or equity financing.
As of October 31, 2014, we had total committed liquidity of $389,327, comprised of $128,203 in cash and cash equivalents and $261,124 in unused committed bank credit facilities, compared to $643,667 of total committed liquidity as of October 25, 2013. At October 31, 2014 we had unused lines of committed and uncommitted credit available from banks of $440,223.
Our cash and cash equivalent balances consist of high quality, short-term money market instruments and cash held by our international subsidiaries that are used to fund those subsidiaries’ day-to-day operating needs.
Those balances have also been used to finance international acquisitions. Our investment policy on excess cash is to preserve principal. As of October 31, 2014, $125,294 of the $128,203 of cash (on the Consolidated Balance Sheets) was held by foreign subsidiaries. If these funds were repatriated to the U.S. we would be required to accrue and pay income taxes. However, no deferred U.S. income taxes have been provided on these earnings as they are considered to be reinvested for an indefinite period of time or will be repatriated when it is tax effective to do so.
We believe cash flow from operations, existing lines of credit, access to credit facilities and access to debt and capital markets will be sufficient to meet our domestic and international liquidity needs. In the current market conditions, we have demonstrated continued access to capital markets. We have committed liquidity and cash reserves in excess of our anticipated funding requirements.
We use derivative instruments with a number of counter-parties principally to manage foreign currency exchange risks. We evaluate the financial stability of each counter-party and spread the risk among several financial institutions to limit our exposure. We will continue to monitor counterparty risk on an ongoing basis. We do not have any credit-risk related contingent features in our derivative contracts as of October 31, 2014.
We paid common stock dividends of $87,427 or $1.04 per share in 2014, an increase of 13.0% per share over 2013 common stock dividends of $81,189 or $0.92 per share.
We have continuing authorization to purchase shares of our common stock for general corporate purposes. We repurchased 4,705,081 shares totaling $349,181 in 2014 compared to 5,889,945 shares totaling $378,141 in 2013 and 5,708,300 shares totaling $272,537 in 2012. At October 31, 2014 we had 5,019,474 shares remaining under our repurchase authorization. On November 21, 2014, following the end of fiscal year 2014, the Board approved a new share repurchase program, with no expiration date, authorizing us to purchase up to $1.5 billion of outstanding shares of common stock. This new program was effective immediately and replaced the previous repurchase authorization.
We are involved in various claims relating to environmental and waste disposal matters at a number of current and former plant sites. We engage or participate in remedial and other environmental compliance activities at certain of these sites. At other sites, we have been named as a potentially responsible party (PRP) under federal and state environmental laws for the remediation of hazardous waste. We analyze each individual site, considering the number of parties involved,
| 16 |
the level of potential liability or contribution by us relative to the other parties, the nature and magnitude of the wastes
involved, the method and extent of remediation, the potential insurance coverage, the estimated legal and consulting expense
with respect to each site, and the time period over which any costs would likely be incurred. Based on the above analysis, we
estimate the remediation or other clean-up costs and related claims for each site. The estimates are based in part on
discussions with other PRPs, governmental agencies and engineering firms.
We accrue appropriate reserves for potential environmental liabilities when the amount of the costs that will be incurred can be reasonably determined. Accruals are reviewed and adjusted as additional information becomes available. While uncertainties exist with respect to the amounts and timing of our ultimate environmental liabilities, management believes it is neither probable nor reasonably possible that such liabilities, individually or in the aggregate, will have a material adverse effect on our financial condition, results of operations or cash flows.
We are involved in a variety of legal claims and proceedings relating to personal injury, product liability, warranties, customer contracts, employment, trade practices, environmental and other legal matters that arise in the normal course of business. These claims and proceedings include cases where we are one of a number of defendants in proceedings alleging that the plaintiffs suffered injuries or contracted diseases from exposure to chemicals or other ingredients used in the production of some of our products or waste disposal. We are also subject to claims related to the performance of our products. We believe these claims and proceedings are in the ordinary course for a business of the type and size in which we are engaged. While we are unable to predict the ultimate outcome of these claims and proceedings, we believe it is neither probable nor reasonably possible that the costs and liabilities of such matters, individually or in the aggregate, will have a material adverse effect on our financial condition, results of operations or cash flows.
Under various agreements, we are obligated to make future cash payments in fixed amounts. These include payments under our multi-currency credit facilities, senior notes, industrial development bonds, employee benefit plans, non-cancelable operating leases with initial or remaining terms in excess of one year, capital expenditures, commodity purchase commitments, telecommunication commitments and marketing commitments. Some of our interest charges are variable and are assumed at current rates.
Contractual Obligations
The following table summarizes our contractual obligations as of October 31, 2014 for the fiscal years ending in October:
|
2020 and
|
||||||||||||||||||||||||||||
|
2015
|
2016
|
2017
|
2018
|
2019
|
thereafter
|
Total
|
||||||||||||||||||||||
|
Notes & Interest to Banks
|
$ | 520,761 | $ | — | $ | — | $ | — | $ | — | $ | 35 | $ | 520,796 | ||||||||||||||
|
Senior Notes & Interest
|
203,363 | 47,625 | 193,087 | 38,550 | 330,394 | 437,100 | 1,250,119 | |||||||||||||||||||||
|
Industrial Development Bonds & Interest
|
12,519 | — | — | — | — | — | 12,519 | |||||||||||||||||||||
|
Bank Fees
|
1,125 | 1,125 | 1,125 | 1,125 | 141 | — | 4,641 | |||||||||||||||||||||
|
Medical Retiree/SERP/Pension
|
4,549 | 1,628 | 1,742 | 1,468 | 1,650 | 21,908 | 32,945 | |||||||||||||||||||||
|
Operating Leases
|
34,324 | 28,248 | 20,583 | 13,099 | 7,672 | 20,458 | 124,384 | |||||||||||||||||||||
|
Capital Expenditures
|
16,964 | — | — | — | — | — | 16,964 | |||||||||||||||||||||
|
Commodity Purchase Commitments
|
17,306 | 72,631 | 1,849 | — | — | — | 91,786 | |||||||||||||||||||||
|
Telecommunication Commitments
|
3,440 | 3,440 | — | — | — | — | 6,880 | |||||||||||||||||||||
|
IT Commitments
|
5,576 | 1,681 | — | — | — | — | 7,257 | |||||||||||||||||||||
|
Marketing Commitments
|
23,037 | 22,055 | 15,360 | 15,360 | 15,360 | 140,720 | 231,892 | |||||||||||||||||||||
|
Total Contractual Cash Obligations
|
$ | 842,964 | $ | 178,433 | $ | 233,746 | $ | 69,602 | $ | 355,217 | $ | 620,221 | $ | 2,300,183 | ||||||||||||||
| 17 |
We expect to make cash outlays in the future related to uncertain tax positions. However, due to the uncertainty of the timing of future cash flows, we are unable to make reasonably reliable estimates of the period of cash settlement, if any, with the respective taxing authorities. Accordingly, unrecognized tax benefits of $18,766 as of October 31, 2014, have been excluded from the contractual obligations table above. For further information related to unrecognized tax benefits, see Note 12 in Notes to Consolidated Financial Statements.
NON-GAAP FINANCIAL MEASURES
This section includes financial information prepared in accordance with accounting principles generally accepted in the United States (GAAP), as well as certain non-GAAP financial measures such as adjusted gross profit, adjusted operating expense, adjusted earnings before interest and taxes (EBIT), adjusted net income and adjusted net income per common share – diluted. Generally, a non-GAAP financial measure is a numerical measure of financial performance that excludes (or includes) amounts that are included in (or excluded from) the most directly comparable measure calculated and presented in accordance with GAAP. The non-GAAP financial measures should be viewed as a supplement to, and not a substitute for, financial measures presented in accordance with GAAP. Non-GAAP measures as presented herein may not be comparable to similarly titled measures used by other companies.
We believe that the non-GAAP financial measures provide meaningful information to assist investors in understanding our financial results and assessing prospects for future performance without regard to restructuring and acquisition-related charges. We believe adjusted gross profit, adjusted operating expense, adjusted EBIT, adjusted net income and adjusted net income per common share – diluted are important indicators of our operations because they exclude items that may not be indicative of or are unrelated to our core operating results and provide a baseline for analyzing trends in our underlying business. To measure adjusted gross profit, adjusted operating expense and adjusted EBIT, we remove the impact of before-tax restructuring and acquisition-related charges. Adjusted net income and adjusted net income per common share – diluted are calculated by removing the after-tax impact of restructuring and acquisition-related charges from our calculated net income and net income per common share – diluted. Since non-GAAP financial measures are not standardized, it may not be possible to compare these financial measures with other companies’ non-GAAP financial measures. These non-GAAP financial measures are an additional way to view aspects of our operations that, when viewed with our GAAP results and the reconciliations to corresponding GAAP financial measures below, provide a more complete understanding of our business. We strongly encourage investors and shareholders to review our financial statements and publicly filed reports in their entirety and not to rely on any single financial measure.
| 18 |
The following table reconciles gross profit, operating expense, EBIT, net income and net income per common share – diluted (GAAP financial measures) to adjusted gross profit, adjusted operating expense, adjusted EBIT, adjusted net income and adjusted net income per common share – diluted (non-GAAP financial measures) for the periods presented:
|
Fiscal Years
|
||||||||
|
2014
|
2013
|
|||||||
|
Coatings Segment
|
||||||||
|
Earnings before interest and taxes (EBIT)
|
$ | 389,390 | $ | 329,886 | ||||
|
Restructuring charges – cost of sales
|
18,269 | 11,718 | ||||||
|
Acquisition-related charges – cost of sales
|
— | 513 | ||||||
|
Restructuring charges – operating expense
|
10,633 | 7,774 | ||||||
|
Acquisition-related charges – operating expense
|
— | 1,729 | ||||||
|
Adjusted EBIT
|
$ | 418,292 | $ | 351,620 | ||||
|
Paints Segment
|
||||||||
|
EBIT
|
$ | 192,222 | $ | 168,395 | ||||
|
Restructuring charges – cost of sales
|
10,216 | 9,781 | ||||||
|
Restructuring charges – operating expense
|
1,718 | 5,172 | ||||||
|
Adjusted EBIT
|
$ | 204,156 | $ | 183,348 | ||||
|
Other and Administrative
|
||||||||
|
EBIT
|
$ | (24,400 | ) | $ | (9,728 | ) | ||
|
Restructuring charges – cost of sales
|
(14 | ) | 417 | |||||
|
Restructuring charges – operating expense
|
317 | 1,571 | ||||||
|
Adjusted EBIT
|
$ | (24,097 | ) | $ | (7,740 | ) | ||
|
Consolidated
|
||||||||
|
Gross profit
|
$ | 1,539,046 | $ | 1,358,058 | ||||
|
Restructuring charges – cost of sales
|
28,471 | 21,916 | ||||||
|
Acquisition-related charges – cost of sales
|
— | 513 | ||||||
|
Adjusted gross profit
|
$ | 1,567,517 | $ | 1,380,487 | ||||
|
Operating expense
|
$ | 979,137 | $ | 865,634 | ||||
|
Restructuring charges – operating expense
|
(12,668 | ) | (14,517 | ) | ||||
|
Acquisition-related charges – operating expense
|
— | (1,729 | ) | |||||
|
Adjusted operating expense
|
$ | 966,469 | $ | 849,388 | ||||
|
EBIT
|
$ | 557,212 | $ | 488,553 | ||||
|
Restructuring charges – total
|
41,139 | 36,433 | ||||||
|
Acquisition-related charges – total
|
— | 2,242 | ||||||
|
Adjusted EBIT
|
$ | 598,351 | $ | 527,228 | ||||
|
Net income
|
$ | 345,401 | $ | 289,255 | ||||
|
After tax restructuring charges – total1
|
28,941 | 29,094 | ||||||
|
After tax acquisition-related charges – total1
|
— | 2,083 | ||||||
|
Adjusted net income
|
$ | 374,342 | $ | 320,432 | ||||
|
Net income per common share – diluted
|
$ | 4.01 | $ | 3.20 | ||||
|
Restructuring charges – total
|
0.34 | 0.32 | ||||||
|
Acquisition-related charges – total
|
— | 0.02 | ||||||
|
Adjusted net income per common share – diluted
|
$ | 4.35 | $ | 3.54 | ||||
|
1
|
The tax effect of restructuring and acquisition-related charges is calculated using the effective tax rate of the jurisdiction in which the charges were incurred.
|
See Note 18 in Notes to Consolidated Financial Statements for further information on restructuring.
| 19 |
CRITICAL ACCOUNTING ESTIMATES
The discussion and analysis of our financial condition and results of operations are based upon our Consolidated Financial Statements, which have been prepared in accordance with generally accepted accounting principles in the United States (GAAP). The preparation of these financial statements requires us to make estimates and assumptions that affect the reported amounts of assets and liabilities, revenues and expenses, and related disclosure of any contingent assets and liabilities at the date of the financial statements. We regularly review our estimates and assumptions, which are based on historical experience and on various other factors that are believed to be reasonable under the circumstances, the results of which form the basis for making judgments about the carrying values of assets and liabilities that are not readily apparent from other sources. Actual results may differ from these estimates under different assumptions or conditions.
We believe the following areas are affected by significant judgments and estimates used in the preparation of our Consolidated Financial Statements and that the judgments and estimates are reasonable:
Revenue Recognition
Our revenue from product sales is recognized at the time the product is delivered or title has passed, a sales agreement is in place, pricing is fixed or determinable and collection is reasonably assured. Discounts provided to customers at the point of sale and freight costs on shipments to our customers are recognized as reductions in revenue as the products are sold. We offer promotional and rebate programs to our customers. These programs require estimates of customer participation and performance and are recorded at the time of sale as deductions from revenue. We also offer consumer programs to promote the sale of our products and record them as a reduction in revenue at the time the consumer offer is made using estimated redemption and participation. Revenues exclude sales taxes collected from our customers.
Additionally, in the U.S., we sell extended furniture protection plans for which revenue is deferred and recognized over the life of the contract. An actuarial study utilizing historical claims data is used to forecast claim payments over the contract period and revenue is recognized based on the forecasted claims payments. Actual claims costs are reflected in earnings in the period incurred. Anticipated losses on programs in progress are charged to earnings when identified. Differences between estimated and actual results, which have been insignificant historically, are recognized as a change in management estimate in a subsequent period.
Valuation of Goodwill and Indefinite-Lived Intangible Assets
Goodwill represents the excess of cost over the fair value of identifiable net assets of businesses acquired. Other intangible assets consist of customer lists and relationships, purchased technology and patents and trademarks.
Evaluating goodwill for impairment involves the determination of the fair value of our reporting units in which we have recorded goodwill. A reporting unit is an operating segment or a component of an operating segment for which discrete financial information is available and reviewed by management on a regular basis. We have determined that we have four separate reporting units with goodwill.
Goodwill for each of our reporting units is reviewed for impairment at least annually using a two-step process, as we have chosen not to perform a qualitative assessment for impairment. In the first step, we compare the fair value of each reporting unit to its carrying value, including goodwill. We use the following four material assumptions in our fair value analysis: (a) discount rates; (b) long-term sales growth rates; (c) forecasted operating margins; and (d) market multiples. If the fair value exceeds the carrying value, no further work is required and no impairment loss is recognized. If the carrying value exceeds the fair value, the goodwill of the reporting unit is potentially impaired and we would then complete step 2 in order to measure the impairment loss. In step 2, we would calculate the implied fair value of goodwill by deducting the fair value of all tangible and intangible net assets (including unrecognized intangible assets) of the reporting unit from the fair value of the reporting unit. If the implied fair value of goodwill is less than the carrying value of goodwill, we would recognize an impairment loss, in the period identified, equal to the difference.
We review indefinite-lived intangible assets at least annually for impairment by calculating the fair value of the assets and comparing those fair values to the carrying value, as we have chosen not to perform a qualitative assessment for impairment. In assessing fair value, we generally utilize a relief from royalty method. If the carrying value of the indefinite-lived intangible assets exceeds the fair value of the asset, the carrying value is written down to fair value in the period identified.
During the fourth quarters of 2014, 2013 and 2012, we completed our annual goodwill and indefinite-lived intangible asset impairment reviews with no impairments to the carrying values identified. There was no change to our reporting units in 2014, 2013 or 2012.
| 20 |
Considerable
management judgment is necessary to evaluate the impact of operating and macroeconomic changes and to estimate future cash
flows. Assumptions used in our impairment evaluations, such as long-term sales growth rates, forecasted operating margins,
market multiples and our discount rate, are based on the best available market information at the time of our analysis and
are consistent with our internal forecasts and operating plans. Additionally, in assessing goodwill impairment, we considered
the implied control premium and concluded it was reasonable based on other recent market transactions. Changes in these
estimates or a continued decline in general economic conditions could change our conclusion regarding an impairment of
goodwill and potentially result in a non-cash impairment loss in a future period.
The discount rate, long-term sales growth rate, forecasted operating margins and market multiple assumptions are the four material assumptions utilized in our calculations of the present value cash flows and the business enterprise fair value used to estimate the fair value of the reporting units when performing the annual goodwill impairment test and in testing indefinite-lived intangible assets for impairment. We utilize a cash flow approach (Level 3 valuation technique) in estimating the fair value of the reporting units for the income approach, where the discount rate reflects a weighted average cost of capital rate. The cash flow model used to derive fair value is most sensitive to the discount rate, long-term sales growth rate and forecasted operating margin assumptions used. For the market approach, average revenue and earnings before interest, tax, depreciation and amortization multiples derived from our peer group are weighted and adjusted for size, risk and growth of the individual reporting unit to determine the reporting unit’s business enterprise fair value. The resulting values from the two approaches are weighted to derive the final fair value of the reporting units that will be compared with the reporting units carrying value when assessing impairment in step 1.
For reporting units that pass step 1, we perform a sensitivity analysis on the discount rate, long-term sales growth rate and forecasted operating margin assumptions. The discount rate could increase by more than 10% of the discount rate utilized, the long-term sales growth rate assumption could decline to zero or costs could remain at the current spending level with no cost savings realized in future periods and our reporting units and indefinite-lived intangible assets would continue to have fair value in excess of carrying value. In fiscal 2014, we have no reporting units that are at risk of failing step 1 of our goodwill or indefinite-lived intangible asset impairment tests as the fair values of the reporting units substantially exceed their respective carrying values. There have been no significant events since the timing of our impairment tests that would have triggered additional impairment testing.
The assumptions used in our impairment testing could be adversely affected by certain risks discussed in “Risk Factors” in Item 1A of this report. For additional information about goodwill and intangible assets, see Notes 1 and 4 in Notes to Consolidated Financial Statements.
Pension and Post-Retirement Medical Obligations
We sponsor several defined benefit plans for certain hourly and salaried employees. We sponsor post-retirement medical benefits for certain U.S. employees. The amounts recognized in our financial statements are determined on an actuarial basis. To accomplish this, extensive use is made of assumptions about inflation, investment returns, mortality, turnover, medical trend rates and discount rates. A change in these assumptions could cause actual results to differ from those reported. A reduction of 50 basis points in the long-term rate of return and a reduction of 50 basis points in the discount rate would have increased our pension expense $2,685 in fiscal 2014. A 1% increase in the medical trend rates would not have a material effect on post-retirement medical expense or the post-retirement benefit obligation. See Note 11 in Notes to Consolidated Financial Statements, for further details regarding accounting for pensions and post-retirement medical benefits.
Income Taxes
At each period end, it is necessary for us to make certain estimates and assumptions to compute the provision for income taxes including, but not limited to, the projections of the proportion of income (or loss) earned and taxed in the foreign jurisdictions and the extent to which this income (or loss) may also be taxed in the United States, permanent and temporary differences, the likelihood of deferred tax assets being recovered and the outcome of uncertain tax positions. Our income tax returns, like those of most companies, are periodically audited by domestic and foreign tax authorities. These audits include questions regarding our tax filing positions, including the timing and amount of deductions and the allocation of income among various tax jurisdictions. At any one time, multiple tax years are subject to audit by the various tax authorities. We record an accrual for more likely than not exposures after evaluating the positions associated with our various income tax filings. A number of years may elapse before a particular matter for which we have established an accrual is audited and fully resolved or clarified. We adjust our tax contingencies accrual and income tax provision in the period in which matters are effectively settled with tax authorities at amounts different from our established accrual, the statute of limitations expires for the relevant taxing authority to examine the tax position or when more information becomes available. The Internal Revenue Service (IRS) has commenced an audit of our fiscal year 2010 U.S. federal amended tax return, along with our fiscal year 2013 U.S. federal tax return.
| 21 |
Fieldwork will begin in the first quarter of fiscal year 2015. The previous IRS examination of the U.S. federal tax returns for fiscal years ended 2009 and 2010 was concluded in October 2012, and resulted in no material adjustments to our income tax expense or balance of unrecognized tax benefits. We are currently under audit in several state and foreign jurisdictions. We also expect various statutes of limitation to expire during the next 12 months. While we do not expect any material adjustments in the next 12 months due to the pending audit activity or expiring statutes, we are unable to estimate a range of outcomes at this time.
Stock-based Compensation
The valuation of stock options requires us to use judgments and assumptions. Annually, we make predictive assumptions regarding future stock price volatility, employee exercise behavior, dividend yield and the forfeiture rate. We estimate our future stock price volatility using historical volatility over the expected life of the option. If all other assumptions are held constant, a one percentage point increase in our fiscal 2014 volatility assumption would increase the grant-date fair value of our fiscal 2014 option awards by 3 percent. Our expected life represents the period of time that options granted are expected to be outstanding based on historical data to estimate option exercises and employee terminations within the valuation model. An increase in the expected life by 1 year, leaving all other assumptions constant, would increase the grant date fair value of our 2014 stock option grants by 6 percent. The risk-free interest rate for periods during the expected term of the options is based on yields available on the grant date for US Treasury STRIPS with maturity consistent with the expected life assumption. We recognize compensation expense for these options ratably over the shorter of the vesting period of the stock options, three to five years, or the length of time until the grantee becomes retirement-eligible.
Inventories
We record inventories at the lower of cost or net realizable value, with expense estimates made for obsolescence or unsaleable inventory equal to the difference between the recorded cost of inventories and their estimated market value based upon assumptions about future demand and market conditions. On an ongoing basis, we monitor these estimates and record adjustments for differences between estimates and actual experience. Historically, actual results have not significantly deviated from those determined using these estimates. Our domestic inventories are recorded using the last-in, first-out (LIFO) method, while all other inventories are recorded using the first-in, first-out (FIFO) method. If inventories accounted for using the LIFO method are reduced on a year-over-year basis, liquidation of certain quantities carried at costs prevailing in prior years occurs. If inventories accounted for using the LIFO method are increased on a year-over-year basis, certain quantities are carried at costs prevailing in the current year. We evaluate our LIFO reserves and make any necessary adjustments in the fourth quarter of our fiscal year.
OFF-BALANCE SHEET ARRANGEMENTS
We do not have off-balance sheet arrangements that have, or are reasonably likely to have, a current or future material effect on our financial condition, changes in financial condition, revenues or expenses, results of operations, liquidity, capital expenditures or capital resources.
FORWARD-LOOKING STATEMENTS
Certain statements contained in “Management’s Discussion and Analysis of Financial Condition and Results of Operations” and elsewhere in this report constitute “forward-looking statements” within the meaning of Section 27A of the Securities Act of 1933, as amended, and Section 21E of the Securities Exchange Act of 1934, as amended. The Private Securities Litigation Reform Act of 1995 provides a safe harbor for forward-looking statements.
Forward-looking statements are based on management’s current expectations, estimates, assumptions and beliefs about future events, conditions and financial performance. Forward-looking statements are subject to risks, uncertainties and other factors, many of which are outside our control and could cause actual results to differ materially from such statements. Any statement that is not historical in nature is a forward-looking statement. We may identify forward-looking statements with words and phrases such as “expects,” “projects,” “estimates,” “anticipates,” “believes,” “could,” “may,” “will,” “plans to,” “intends,” “should” and similar expressions.
These risks, uncertainties and other factors include, but are not limited to, deterioration in general economic conditions, both domestic and international, that may adversely affect our business; fluctuations in availability and prices of raw materials, including raw material shortages and other supply chain disruptions, and the inability to pass along or delays in passing along raw material cost increases to our customers; dependence of internal sales and earnings growth on business cycles affecting our customers and growth in the domestic and international coatings industry; market share loss to, and pricing or margin pressure from, larger competitors with greater financial resources; significant indebtedness that restricts the use of cash flow from operations for acquisitions and other investments; dependence on acquisitions for growth, and risks related to future acquisitions, including adverse changes in the results of acquired businesses, the assumption of
| 22 |
unforeseen liabilities and disruptions resulting from the integration of acquisitions; risks and uncertainties associated
with operating in foreign markets, including achievement of profitable growth in developing markets; impact of fluctuations
in foreign currency exchange rates on our financial results; loss of business with key customers; damage to our reputation
and business resulting from product claims or recalls, litigation, customer perception and other matters; our ability to
respond to technology changes and to protect our technology; possible interruption, failure or compromise of the information
systems we use to operate our business; changes in governmental regulation, including more stringent environmental, health
and safety regulations; our reliance on the efforts of vendors, government agencies, utilities and other third parties to
achieve adequate compliance and avoid disruption of our business; unusual weather conditions adversely affecting sales;
changes in accounting policies and standards and taxation requirements such as new tax laws or revised tax law
interpretations; the nature, cost and outcome of pending and future litigation and other legal proceedings; and civil unrest
and the outbreak of war and other significant national and international events.
We undertake no obligation to subsequently revise any forward-looking statement to reflect new information, events or circumstances after the date of such statement, except as required by law.
|
QUANTITATIVE AND QUALITATIVE DISCLOSURES ABOUT MARKET RISK
|
Our foreign sales and results of operations are subject to the impact of foreign currency fluctuations. As most of our underlying costs are denominated in the same currency as our sales, the effect has not been material. We have not used derivative financial instruments to hedge our exposure to translation gains and losses. A 10% adverse change in foreign currency rates is not expected to have a material effect on our results of operations or financial position.
We are also subject to interest rate risk. At October 31, 2014, approximately 34.2% of our total debt consisted of floating rate debt. From time to time, we may enter into interest rate derivatives to hedge a portion of either our variable or fixed rate debt. Assuming the current level of borrowings, a 10% increase in interest rates from those in effect at the end of the fourth quarter would not have a material impact on our results of operations or financial position.
| 23 |
|
FINANCIAL STATEMENTS AND SUPPLEMENTARY DATA
|
Board of Directors and Stockholders
The Valspar Corporation
The Valspar Corporation’s (the “Company”) management is responsible for establishing and maintaining adequate internal control over financial reporting, as such term is defined in Exchange Act Rules 13a-15(f). The Company’s internal control system is designed to provide reasonable assurance regarding the reliability of financial reporting and the preparation of financial statements in accordance with U.S. generally accepted accounting principles. Because of its inherent limitations, internal control over financial reporting may not prevent or detect misstatements.
Under the supervision and with the participation of management, including its principal executive officer and principal financial officer, the Company’s management assessed the design and operating effectiveness of internal control over financial reporting as of October 31, 2014 based on criteria set forth in Internal Control – Integrated Framework issued by the Committee of Sponsoring Organizations of the Treadway Commission (1992 framework) (COSO).
Based on this assessment, management concluded that the Company’s internal control over financial reporting was effective as of October 31, 2014. Ernst & Young LLP, an independent registered public accounting firm, has issued an attestation report on the Company’s internal control over financial reporting as of October 31, 2014. That report is included herein.
 |
|
|
Gary E. Hendrickson
|
|
|
Chairman and Chief Executive Officer
|
|
 |
|
|
James L. Muehlbauer
|
|
|
Chief Financial and Administrative Officer
|
| 24 |
REPORT OF INDEPENDENT REGISTERED PUBLIC ACCOUNTING FIRM ON INTERNAL CONTROL OVER FINANCIAL REPORTING
The Board of Directors and Stockholders
The Valspar Corporation
We have audited The Valspar Corporation and subsidiaries’ internal control over financial reporting as of October 31, 2014, based on criteria established in Internal Control – Integrated Framework issued by the Committee of Sponsoring Organizations of the Treadway Commission (1992 framework) (the COSO criteria). The Valspar Corporation’s management is responsible for maintaining effective internal control over financial reporting, and for its assessment of the effectiveness of internal control over financial reporting included in the accompanying Report of Management on Internal Control over Financial Reporting. Our responsibility is to express an opinion on the corporation’s internal control over financial reporting based on our audit.
We conducted our audit in accordance with the standards of the Public Company Accounting Oversight Board (United States). Those standards require that we plan and perform the audit to obtain reasonable assurance about whether effective internal control over financial reporting was maintained in all material respects. Our audit included obtaining an understanding of internal control over financial reporting, assessing the risk that a material weakness exists, testing and evaluating the design and operating effectiveness of internal control based on the assessed risk, and performing such other procedures as we considered necessary in the circumstances. We believe that our audit provides a reasonable basis for our opinion.
A company’s internal control over financial reporting is a process designed to provide reasonable assurance regarding the reliability of financial reporting and the preparation of financial statements for external purposes in accordance with generally accepted accounting principles. A company’s internal control over financial reporting includes those policies and procedures that (1) pertain to the maintenance of records that, in reasonable detail, accurately and fairly reflect the transactions and dispositions of the assets of the company; (2) provide reasonable assurance that transactions are recorded as necessary to permit preparation of financial statements in accordance with generally accepted accounting principles, and that receipts and expenditures of the company are being made only in accordance with authorizations of management and directors of the company; and (3) provide reasonable assurance regarding prevention or timely detection of unauthorized acquisition, use or disposition of the company’s assets that could have a material effect on the financial statements.
Because of its inherent limitations, internal control over financial reporting may not prevent or detect misstatements. Also, projections of any evaluation of effectiveness to future periods are subject to the risk that controls may become inadequate because of changes in conditions, or that the degree of compliance with the policies or procedures may deteriorate.
In our opinion, The Valspar Corporation and subsidiaries maintained, in all material respects, effective internal control over financial reporting as of October 31, 2014, based on the COSO criteria.
We also have audited, in accordance with the standards of the Public Company Accounting Oversight Board (United States), the consolidated balance sheets of The Valspar Corporation as of October 31, 2014 and October 25, 2013, and the related consolidated statements of operations, comprehensive income, changes in equity and cash flows for each of the three years in the period ended October 31, 2014, and our report dated December 22, 2014, expressed an unqualified opinion thereon.
 |
|
|
Minneapolis, Minnesota
|
|
|
December 22, 2014
|
| 25 |
The Board of Directors and Stockholders
The Valspar Corporation
We have audited the accompanying consolidated balance sheets of The Valspar Corporation and subsidiaries (the Corporation) as of October 31, 2014 and October 25, 2013, and the related consolidated statements of operations, comprehensive income, changes in equity, and cash flows for each of the three years in the period ended October 31, 2014. Our audits also included the financial statement schedule listed in Item 15 (a). These financial statements and schedule are the responsibility of the Corporation’s management. Our responsibility is to express an opinion on these financial statements and schedule based on our audits.
We conducted our audits in accordance with the standards of the Public Company Accounting Oversight Board (United States). Those standards require that we plan and perform the audit to obtain reasonable assurance about whether the financial statements are free of material misstatement. An audit includes examining, on a test basis, evidence supporting the amounts and disclosures in the financial statements. An audit also includes assessing the accounting principles used and significant estimates made by management, as well as evaluating the overall financial statement presentation. We believe that our audits provide a reasonable basis for our opinion.
In our opinion, the financial statements referred to above present fairly, in all material respects, the consolidated financial position of The Valspar Corporation and subsidiaries at October 31, 2014 and October 25, 2013, and the consolidated results of their operations and their cash flows for each of the three years in the period ended October 31, 2014, in conformity with U.S. generally accepted accounting principles. Also, in our opinion, the related financial statement schedule, when considered in relation to the basic financial statements taken as a whole, presents fairly, in all material respects, the information set forth therein.
We also have audited, in accordance with the standards of the Public Company Accounting Oversight Board (United States), The Valspar Corporation’s internal control over financial reporting as of October 31, 2014, based on criteria established in Internal Control – Integrated Framework issued by the Committee of Sponsoring Organizations of the Treadway Commission (1992 framework), and our report dated December 22, 2014, expressed an unqualified opinion thereon.
|
|
|
Minneapolis, Minnesota
|
|
|
December 22, 2014
|
| 26 |
Consolidated Balance Sheets
(Dollars in thousands, except per share amounts)
|
October 31, 2014
|
October 25, 2013
|
||||||||
|
Assets
|
|||||||||
|
Current Assets
|
Cash and cash equivalents
|
$ | 128,203 | $ | 216,150 | ||||
|
Restricted cash
|
2,868 | 3,550 | |||||||
|
Accounts and notes receivable less allowance (2014 – $10,585; 2013 – $16,939)
|
840,447 | 771,396 | |||||||
|
Inventories
|
486,262 | 438,982 | |||||||
|
Deferred income taxes
|
28,898 | 41,855 | |||||||
|
Prepaid expenses and other
|
90,579 | 108,357 | |||||||
|
Total Current Assets
|
1,577,257 | 1,580,290 | |||||||
|
Goodwill
|
1,125,824 | 1,144,670 | |||||||
|
Intangibles, net
|
592,512 | 608,990 | |||||||
|
Other Assets
|
83,072 | 48,810 | |||||||
|
Long-Term Deferred Income Taxes
|
10,184 | 9,274 | |||||||
|
Property, Plant and Equipment
|
|||||||||
|
Land
|
77,902 | 83,930 | |||||||
|
Buildings
|
517,798 | 460,312 | |||||||
|
Machinery and equipment
|
1,034,053 | 1,086,399 | |||||||
|
Property, plant and equipment, gross
|
1,629,753 | 1,630,641 | |||||||
|
Less accumulated depreciation
|
(984,651 | ) | (997,166 | ) | |||||
|
Property, Plant and Equipment, net
|
645,102 | 633,475 | |||||||
|
Total Assets
|
$ | 4,033,951 | $ | 4,025,509 | |||||
|
Liabilities and Stockholders’ Equity
|
|||||||||
|
Current Liabilities
|
Short-term debt
|
$ | 443,854 | $ | 441,165 | ||||
|
Current portion of long-term debt
|
162,502 | — | |||||||
|
Trade accounts payable
|
600,875 | 618,787 | |||||||
|
Income taxes
|
26,017 | 4,748 | |||||||
|
Other accrued liabilities
|
471,173 | 415,873 | |||||||
|
Total Current Liabilities
|
1,704,421 | 1,480,573 | |||||||
|
Long-Term Debt, Net of Current Portion
|
950,035 | 1,037,392 | |||||||
|
Deferred Income Taxes
|
219,261 | 242,387 | |||||||
|
Other Long-Term Liabilities
|
149,143 | 142,607 | |||||||
|
Total Liabilities
|
3,022,860 | 2,902,959 | |||||||
|
Stockholders’ Equity
|
Common stock (par value $0.50; Authorized – 250,000,000 shares; shares issued, including shares in treasury – 2014: 118,442,624; 2013: 118,442,624)
|
59,220 | 59,220 | ||||||
|
Additional paid-in capital
|
458,409 | 444,609 | |||||||
|
Retained earnings
|
1,907,001 | 1,648,980 | |||||||
|
Accumulated other comprehensive income (loss)
|
(19,670 | ) | 53,419 | ||||||
|
Less cost of common stock in treasury (2014 – 36,229,538; 2013 – 32,648,667)
|
(1,393,869 | ) | (1,083,678 | ) | |||||
|
Total Stockholders’ Equity
|
1,011,091 | 1,122,550 | |||||||
|
Total Liabilities and Stockholders’ Equity
|
$ | 4,033,951 | $ | 4,025,509 | |||||
See Notes to Consolidated Financial Statements
| 27 |
Consolidated Statements of Operations
(Dollars in thousands, except per share amounts)
|
For the Year Ended
|
October 31, 2014
(53 weeks)
|
October 25, 2013
(52 weeks)
|
October 26, 2012
(52 weeks)
|
|||||||||
|
Net Sales
|
$ | 4,522,424 | $ | 4,103,776 | $ | 4,020,851 | ||||||
|
Cost of Sales
|
2,954,907 | 2,723,289 | 2,650,948 | |||||||||
|
Restructuring Charges – cost of sales
|
28,471 | 21,916 | 16,199 | |||||||||
|
Acquisition-Related Charges – cost of sales
|
— | 513 | — | |||||||||
|
Gross Profit
|
1,539,046 | 1,358,058 | 1,353,704 | |||||||||
|
Research and Development
|
134,134 | 128,265 | 123,401 | |||||||||
|
Selling, General and Administrative
|
832,335 | 721,123 | 738,387 | |||||||||
|
Restructuring Charges
|
12,668 | 14,517 | 9,646 | |||||||||
|
Acquisition-Related Charges
|
— | 1,729 | — | |||||||||
|
Operating Expenses
|
979,137 | 865,634 | 871,434 | |||||||||
|
Income (Loss) from Operations
|
559,909 | 492,424 | 482,270 | |||||||||
|
Interest Expense
|
65,330 | 64,758 | 67,604 | |||||||||
|
Other (Income) Expense – net
|
2,697 | 3,871 | (2,558 | ) | ||||||||
|
Income (Loss) before Income Taxes
|
491,882 | 423,795 | 417,224 | |||||||||
|
Income Taxes
|
146,481 | 134,540 | 124,727 | |||||||||
|
Net Income (Loss)
|
$ | 345,401 | $ | 289,255 | $ | 292,497 | ||||||
|
Net Income (Loss) Per Common Share – Basic
|
$ | 4.13 | $ | 3.29 | $ | 3.20 | ||||||
|
Net Income (Loss) Per Common Share – Diluted
|
$ | 4.01 | $ | 3.20 | $ | 3.10 | ||||||
See Notes to Consolidated Financial Statements
| 28 |
Consolidated Statements of Comprehensive Income
(Dollars in thousands)
|
For the Year Ended
|
October 31, 2014
(53 weeks)
|
October 25, 2013
(52 weeks)
|
October 26, 2012
(52 weeks)
|
|||||||||
|
Net Income (Loss)
|
$ | 345,401 | $ | 289,255 | $ | 292,497 | ||||||
|
Other Comprehensive Income (Loss):
|
||||||||||||
|
Foreign Currency Translation
|
(62,783 | ) | (26,007 | ) | 6,819 | |||||||
|
Change in Benefit Obligations
|
(17,162 | ) | 45,496 | (19,615 | ) | |||||||
|
Change in Financial Instruments
|
1,879 | 1,118 | (7,074 | ) | ||||||||
|
Income Tax Benefit (Expense)
|
4,977 | (17,460 | ) | 7,363 | ||||||||
|
Other Comprehensive Income (Loss)
|
(73,089 | ) | 3,147 | (12,507 | ) | |||||||
|
Comprehensive Income (Loss)
|
$ | 272,312 | $ | 292,402 | $ | 279,990 | ||||||
See Notes to Consolidated Financial Statements
| 29 |
Statement of Changes in Equity
(Dollars in thousands, except per share amounts)
|
Common
Stock
|
Additional
Paid-in
Capital
|
Retained
Earnings
|
Treasury
Stock
|
Accumulated
Other
Comprehensive
Income (Loss)
|
Total
|
|||||||||||||||||||
|
Balance, October 28, 2011
|
$ | 59,220 | $ | 397,793 | $ | 1,221,750 | $ | (528,992 | ) | $ | 62,779 | $ | 1,212,550 | |||||||||||
|
Net Income (Loss)
|
— | — | 292,497 | — | — | 292,497 | ||||||||||||||||||
|
Other Comprehensive Income (Loss)
|
— | — | — | — | (12,507 | ) | (12,507 | ) | ||||||||||||||||
|
Restricted Stock Granted for 77,622 Shares, net of forfeitures
|
— | 1,588 | — | 1,707 | — | 3,295 | ||||||||||||||||||
|
Director Stock Granted for 11,847 Shares
|
— | — | — | 309 | — | 309 | ||||||||||||||||||
|
Common Stock Options Exercised of 2,315,413 Shares
|
— | 18,068 | — | 51,367 | — | 69,435 | ||||||||||||||||||
|
Purchase of Shares of Common Stock for Treasury of 5,708,300 Shares
|
— | — | — | (272,537 | ) | — | (272,537 | ) | ||||||||||||||||
|
Cash Dividends on Common Stock – $0.80 per Share
|
— | — | (73,351 | ) | — | — | (73,351 | ) | ||||||||||||||||
|
Stock Option Expense
|
— | 7,801 | — | — | — | 7,801 | ||||||||||||||||||
|
Purchase of equity award shares
|
— | (3,969 | ) | — | — | — | (3,969 | ) | ||||||||||||||||
|
Balance, October 26, 2012
|
$ | 59,220 | $ | 421,281 | $ | 1,440,896 | $ | (748,146 | ) | $ | 50,272 | $ | 1,223,523 | |||||||||||
|
Net Income (Loss)
|
— | — | 289,255 | — | — | 289,255 | ||||||||||||||||||
|
Other Comprehensive Income (Loss)
|
— | — | — | — | 3,147 | 3,147 | ||||||||||||||||||
|
Restricted Stock Granted for 64,883 Shares, net of forfeitures
|
— | 2,456 | — | 1,889 | — | 4,345 | ||||||||||||||||||
|
Director Stock Granted for 12,958 Shares
|
— | — | — | 424 | — | 424 | ||||||||||||||||||
|
Common Stock Options Exercised of 1,500,661 Shares
|
— | 13,746 | — | 40,296 | — | 54,042 | ||||||||||||||||||
|
Purchase of Shares of Common Stock for Treasury of 5,889,945 Shares
|
— | — | — | (378,141 | ) | — | (378,141 | ) | ||||||||||||||||
|
Cash Dividends on Common Stock – $0.92 per Share (net of forfeited restricted stock dividends of $18)
|
— | — | (81,171 | ) | — | — | (81,171 | ) | ||||||||||||||||
|
Stock Option Expense
|
— | 7,189 | — | — | — | 7,189 | ||||||||||||||||||
|
Purchase of equity award shares
|
— | (63 | ) | — | — | — | (63 | ) | ||||||||||||||||
|
Balance, October 25, 2013
|
$ | 59,220 | $ | 444,609 | $ | 1,648,980 | $ | (1,083,678 | ) | $ | 53,419 | $ | 1,122,550 | |||||||||||
|
Net Income (Loss)
|
— | — | 345,401 | — | — | 345,401 | ||||||||||||||||||
|
Other Comprehensive Income (Loss)
|
— | — | — | — | (73,089 | ) | (73,089 | ) | ||||||||||||||||
|
Restricted Stock Granted for 62,994 Shares, net of forfeitures
|
— | 2,886 | — | 2,558 | — | 5,444 | ||||||||||||||||||
|
Director Stock Granted for 11,124 Shares
|
— | 432 | — | 423 | — | 855 | ||||||||||||||||||
|
Common Stock Options Exercised of 1,098,023 Shares
|
— | 7,855 | — | 36,009 | — | 43,864 | ||||||||||||||||||
|
Purchase of Shares of Common Stock for Treasury of 4,705,081 Shares
|
— | — | — | (349,181 | ) | — | (349,181 | ) | ||||||||||||||||
|
Cash Dividends on Common Stock – $1.04 per Share (net of forfeited restricted stock dividends of $47)
|
— | — | (87,380 | ) | — | — | (87,380 | ) | ||||||||||||||||
|
Stock Option Expense
|
— | 6,382 | — | — | — | 6,382 | ||||||||||||||||||
|
Purchase of equity award shares
|
— | (3,755 | ) | — | — | — | (3,755 | ) | ||||||||||||||||
|
Balance, October 31, 2014
|
$ | 59,220 | $ | 458,409 | $ | 1,907,001 | $ | (1,393,869 | ) | $ | (19,670 | ) | $ | 1,011,091 | ||||||||||
See Notes to Consolidated Financial Statements
| 30 |
Consolidated Statements of Cash Flows
(Dollars in thousands)
|
For the Year Ended
|
October 31, 2014
(53 weeks)
|
October 25, 2013
(52 weeks)
|
October 26, 2012
(52 weeks)
|
||||||||||
|
Operating Activities:
|
|||||||||||||
|
Net income (loss)
|
$ | 345,401 | $ | 289,255 | $ | 292,497 | |||||||
|
Adjustments to reconcile net income (loss) to net cash (used in)/provided by operating activities:
|
|||||||||||||
|
Depreciation
|
92,637 | 81,122 | 87,151 | ||||||||||
|
Amortization
|
8,273 | 7,037 | 6,553 | ||||||||||
|
Stock-based compensation
|
28,314 | 23,230 | 23,149 | ||||||||||
|
Deferred income taxes
|
(2,107 | ) | (12,740 | ) | 12,321 | ||||||||
|
(Gain)/loss on disposal of assets
|
(3,301 | ) | (376 | ) | (1,311 | ) | |||||||
|
Changes in certain assets and liabilities, net of effects of acquired businesses:
|
|||||||||||||
|
(Increase)/decrease in accounts and notes receivable
|
(116,566 | ) | (18,770 | ) | (10,883 | ) | |||||||
|
(Increase)/decrease in inventories and other assets
|
(105,841 | ) | (64,025 | ) | (35,678 | ) | |||||||
|
Increase/(decrease) in trade accounts payable and other accrued liabilities
|
84,111 | 111,825 | 51,929 | ||||||||||
|
Increase/(decrease) in income taxes payable
|
3,938 | (29,516 | ) | (32,002 | ) | ||||||||
|
Increase/(decrease) in other deferred liabilities
|
7,175 | 6,299 | (21,984 | ) | |||||||||
|
Settlement of Treasury Lock Contracts
|
— | — | (27,875 | ) | |||||||||
|
Other
|
5,070 | 5,163 | 5,001 | ||||||||||
|
Net Cash (Used In)/Provided By Operating Activities
|
347,104 | 398,504 | 348,868 | ||||||||||
|
Investing Activities:
|
|||||||||||||
|
Purchases of property, plant and equipment
|
(121,271 | ) | (116,749 | ) | (89,363 | ) | |||||||
|
Acquisition of businesses, net of cash acquired
|
— | (219,912 | ) | — | |||||||||
|
Cash proceeds on disposal of assets
|
3,872 | 6,344 | 6,205 | ||||||||||
|
Divestiture of business
|
4,716 | — | — | ||||||||||
|
(Increase)/decrease in restricted cash
|
683 | 16,357 | 471 | ||||||||||
|
Net Cash (Used In)/Provided By Investing Activities
|
(112,000 | ) | (313,960 | ) | (82,687 | ) | |||||||
|
Financing Activities:
|
|||||||||||||
|
Net proceeds from issuance of debt
|
123,867 | 107,773 | 396,816 | ||||||||||
|
Payments of debt
|
(118,714 | ) | (44,144 | ) | (230,939 | ) | |||||||
|
Net change in other borrowings
|
8,937 | 3,778 | (15,643 | ) | |||||||||
|
Net proceeds (repayments) of commercial paper
|
66,393 | 230,499 | (61,971 | ) | |||||||||
|
Proceeds from stock options exercised
|
24,233 | 32,596 | 49,989 | ||||||||||
|
Treasury stock purchases
|
(349,181 | ) | (378,141 | ) | (272,537 | ) | |||||||
|
Excess tax benefit from stock-based compensation
|
19,161 | 20,789 | 17,093 | ||||||||||
|
Dividends paid
|
(87,427 | ) | (81,189 | ) | (73,351 | ) | |||||||
|
Purchase of equity award shares
|
— | — | (7,614 | ) | |||||||||
|
Net Cash (Used In)/Provided By Financing Activities
|
(312,731 | ) | (108,039 | ) | (198,157 | ) | |||||||
|
Increase/(Decrease) in Cash and Cash Equivalents
|
(77,627 | ) | (23,495 | ) | 68,024 | ||||||||
|
Effect of exchange rate changes on Cash and Cash Equivalents
|
(10,320 | ) | (13,682 | ) | 7,136 | ||||||||
|
Cash and Cash Equivalents at Beginning of Period
|
216,150 | 253,327 | 178,167 | ||||||||||
|
Cash and Cash Equivalents at End of Period
|
$ | 128,203 | $ | 216,150 | $ | 253,327 | |||||||
See Notes to Consolidated Financial Statements
| 31 |
Notes to Consolidated Financial Statements
The Valspar Corporation • Years Ended October 2014, 2013 and 2012
The Valspar Corporation • Years Ended October 2014, 2013 and 2012
(Dollars in thousands, except per share amounts)
NOTE 1 – SIGNIFICANT ACCOUNTING POLICIES
Fiscal Year: The Valspar Corporation has a 4-4-5 week accounting cycle with the fiscal year ending on the Friday on or immediately preceding October 31. Fiscal year 2014 includes 53 weeks while fiscal years 2013 and 2012 both include 52 weeks.
Principles of Consolidation: The consolidated financial statements include the accounts of the parent company and its subsidiaries. All intercompany accounts and transactions have been eliminated in consolidation. Investments in which we have a 20-50% interest and where we do not have management control and are not the primary beneficiary are accounted for using the equity method. In order to facilitate our year-end closing process, foreign subsidiaries’ financial results are included in our consolidated financial statements on a one-month lag.
Estimates: The preparation of financial statements in conformity with United States GAAP requires us to make estimates and assumptions that affect the amounts reported in the financial statements and accompanying notes. Such estimates and assumptions impact, among others, the following: the amount of revenue deferred under extended furniture protection plans, the amount of accounts receivable that will be uncollectible, the amount of customer rebates owed, the amount of inventory reserves, the amount to be paid for other liabilities, including contingent liabilities, assumptions around the valuation of goodwill and indefinite-lived intangible assets, including impairment, our pension expense and pension funding requirements, the fair value of stock option awards and the computation of our income tax expense and liability. Actual results could differ from these estimates.
Revenue Recognition: We recognize revenue at the time the product is delivered or title has passed, a sales agreement is in place, pricing is fixed or determinable and collection is reasonably assured. Discounts provided to customers at the point of sale and freight costs on shipments to our customers are recognized as reductions in revenue as the products are sold. We offer promotional and rebate programs to our customers. These programs require estimates of customer participation and performance and are recorded at the time of sale as deductions from revenue. We also offer consumer programs to promote the sale of our products and record them as a reduction in revenue at the time the consumer offer is made using estimated redemption and participation. Revenues exclude sales taxes collected from our customers.
Additionally, in the U.S., we sell extended furniture protection plans for which revenue is deferred and recognized over the life of the contract. An actuarial study utilizing historical claims data is used to forecast claim payments over the contract period, and revenue is recognized based on the forecasted claims payments. Actual claim costs are reflected in earnings in the period incurred. Anticipated losses on programs in progress are charged to earnings when identified. Differences between estimated and actual results, which have been insignificant historically, are recognized as a change in management estimate in a subsequent period.
Allowance for Doubtful Accounts: We estimate the allowance for doubtful accounts by analyzing accounts receivable by age and specific collection risk. Accounts are written off sooner in the event of bankruptcy or other circumstances that make further collection unlikely. When it is deemed probable that a customer account is uncollectible, that balance is written off against the existing allowance.
Cash Equivalents: We consider all highly liquid instruments purchased with an original maturity of less than three months to be cash equivalents.
Restricted Cash: Restricted cash represents cash that is restricted from withdrawal for contractual or legal reasons.
Inventories: Inventories are stated at the lower of cost or market. Our domestic inventories are recorded using the last-in, first-out (LIFO) method. The remaining inventories are recorded using the first-in, first-out (FIFO) method.
Other Assets: We have long-term contracts with certain customers, and costs incurred to obtain these arrangements are recognized over the shorter of the economic or contractual life as an operating expense.
Goodwill and Indefinite-Lived Intangible Assets: Goodwill represents the excess of cost over the fair value of identifiable net assets of businesses acquired. Indefinite-lived intangible assets primarily consist of purchased technology, trademarks and trade names.
Evaluating goodwill for impairment involves the determination of the fair value of our reporting units in which we have recorded goodwill. A reporting unit is an operating segment or a component of an operating segment for which discrete financial information is available and reviewed by management on a regular basis. We have determined that we have four separate reporting units with goodwill.
| 32 |
Goodwill for each of our reporting units is reviewed for impairment at least annually using a two-step process as we have chosen not to perform a qualitative assessment for impairment. In the first step, we compare the fair value of each reporting unit to its carrying value, including goodwill. We use the following four material assumptions in our fair value analysis: (a) discount rates; (b) long-term sales growth rates; (c) forecasted operating margins; and (d) market multiples. If the fair value exceeds the carrying value, no further work is required and no impairment loss is recognized. If the carrying value exceeds the fair value, the goodwill of the reporting unit is potentially impaired and we would then complete step 2 in order to measure the impairment loss. In step 2, we would calculate the implied fair value of goodwill by deducting the fair value of all tangible and intangible net assets (including unrecognized intangible assets) of the reporting unit from the fair value of the reporting unit. If the implied fair value of goodwill is less than the carrying value of goodwill, we would recognize an impairment loss, in the period identified, equal to the difference.
We review indefinite-lived intangible assets at least annually for impairment by calculating the fair value of the assets and comparing those fair values to the carrying value, as we have chosen not to perform a qualitative assessment for impairment. In assessing fair value, we generally utilize a relief from royalty method. If the carrying value of the indefinite-lived intangible assets exceeds the fair value of the asset, the carrying value is written down to fair value in the period identified.
During the fourth quarters of 2014, 2013 and 2012, we completed our annual goodwill and indefinite-lived intangible asset impairment reviews with no impairments to the carrying values identified. There was no change to our reporting units in 2014 or 2013.
See Note 4 for more details on the results of our annual goodwill and indefinite-lived intangible asset impairment reviews.
Impairment of Long-Lived Tangible and Intangible Assets with Finite Lives: We evaluate long-lived assets, including tangible and intangible assets with finite lives, for indicators of impairment. An impairment loss is recognized whenever events or changes in circumstances indicate the carrying amount of an asset is not recoverable. When reviewing for impairment, assets are grouped and evaluated at the lowest level for which there are identifiable cash flows that are largely independent of the cash flows of other groups of assets. We consider historical performance and future estimated results in our evaluation of impairment. If the carrying amount of the asset exceeds expected undiscounted future cash flows, we measure the amount of impairment by comparing the carrying amount of the asset to its fair value, generally by discounting expected future cash flows. Intangibles with finite lives (patents and customer lists) are amortized using the straight-line method over the estimated useful lives.
Property, Plant and Equipment: Property, plant and equipment are recorded at cost. Expenditures that improve or extend the life of the respective assets are capitalized, while maintenance and repairs are expensed as incurred. Provision for depreciation of property is made by charges to operations at rates calculated to amortize the cost of the property over its useful life (20 years for buildings; 1 to 10 years for machinery and equipment) primarily using the straight-line method.
Stock-Based Compensation: Our stock-based employee compensation plans are comprised primarily of stock options, but also include cash-settled restricted stock units and restricted stock. Options generally have a contractual term of 10 years, vest ratably over 3 to 5 years for employees and immediately upon grant for non-employee directors. Expense for options with graded vesting is recognized using the straight-line method. Restricted shares and cash-settled restricted stock units vest after 3 to 5 years. Directors stock grants vest immediately upon issuance. Awards to retirement-eligible employees are expensed on the date of grant. We account for our stock-based compensation using a fair value method. Share awards are issued from common stock in treasury. See Note 10 for additional information.
Advertising Costs: Advertising costs are expensed as incurred and totaled $81,855 (1.8% of net sales), $87,498 (2.1% of net sales) and $88,934 (2.2% of net sales) in 2014, 2013 and 2012, respectively.
Foreign Currency: Foreign currency denominated assets and liabilities are translated into U.S. dollars using the exchange rates in effect at the balance sheet date. Results of operations are translated using the average exchange rates throughout the period. The effect of exchange rate fluctuations on translation of assets and liabilities is recorded as a component of stockholders’ equity (accumulated other comprehensive income (loss)). Gains and losses from foreign currency transactions are included in other expense (income), net.
Financial Instruments: All financial instruments are held for purposes other than trading. See Note 8 for additional information.
Research and Development: Research and development is expensed as incurred.
Reclassification: Certain amounts in the prior years’ financial statements have been reclassified to conform to the 2014 presentation. Such reclassifications had no effect on net income (loss), cash flows or stockholders’ equity as previously reported.
| 33 |
NOTE 2 – ACQUISITIONS AND DIVESTITURES
In the first quarter of fiscal year 2015, we completed the divestiture of a non-strategic specialty product line in our Coatings segment. The pro forma results of operations for this divestiture have not been presented, as the impact on the reported results is not material. We expect to record a pre-tax gain on the sale of the product line of approximately $48,000, which is subject to completion of a valuation in the first quarter of fiscal year 2015.
On August 1, 2013 we purchased all the outstanding shares of Inver Holding S.r.l. (Inver Group), for total consideration of approximately $210,000, including the assumption of Inver Group’s existing debt. Inver Group is an Italian-based industrial coatings company serving customers in Italy, France, the UK, Germany and other countries. The acquisition strengthens our presence in the large European industrial coatings market and broadens our range of technologies for the general industrial product line. The acquisition was recorded in our Coatings segment in the fourth quarter of fiscal year 2013 at fair value and an allocation of the purchase price has been completed. The assets, liabilities and operating results have been included in our financial statements from the date of acquisition.
On December 28, 2012, we purchased Ace Hardware Corporation’s paint manufacturing business (Ace Paints), including two manufacturing facilities near Chicago, IL for approximately $35,000. We manufacture and supply paint to Ace Hardware Corporation for sale at Ace retail locations. The acquisition was recorded in our Paints segment at fair value and an allocation of the purchase price has been completed. The assets, liabilities and operating results have been included in our financial statements from the date of acquisition.
Pro forma results of operations for the acquisitions noted above have not been presented, as they were immaterial to the reported results.
NOTE 3 – INVENTORIES
The major classes of inventories consist of the following:
|
2014
|
2013
|
||||||
|
Manufactured products
|
$
|
314,354
|
$
|
267,680
|
|||
|
Raw materials, supplies and work-in-progress
|
171,908
|
171,302
|
|||||
|
Total Inventories
|
$
|
486,262
|
$
|
438,982
|
|||
The amounts above include inventories stated at cost determined by the last-in, first-out (LIFO) method. Total LIFO inventories were $212,102 at October 31, 2014 and $187,781 at October 25, 2013, approximately $85,908 and $86,337 lower, respectively, than such costs determined under the first-in, first-out (FIFO) method.
NOTE 4 – GOODWILL AND OTHER INTANGIBLE ASSETS
The changes in the carrying amount of goodwill for the fiscal years ended October 31, 2014 and October 25, 2013 are as follows:
|
Coatings
|
Paints
|
Other
|
Total
|
|||||||||||||
|
Balance, October 26, 2012
|
$ | 784,388 | $ | 245,343 | $ | 26,938 | $ | 1,056,669 | ||||||||
|
Goodwill acquired
|
73,507 | 17,557 | — | 91,064 | ||||||||||||
|
Currency translation gain (loss)
|
(5,860 | ) | 3,217 | (420 | ) | (3,063 | ) | |||||||||
|
Balance, October 25, 2013
|
$ | 852,035 | $ | 266,117 | $ | 26,518 | $ | 1,144,670 | ||||||||
|
Currency translation gain (loss)
|
(15,441 | ) | (2,262 | ) | (1,143 | ) | (18,846 | ) | ||||||||
|
Balance, October 31, 2014
|
$ | 836,594 | $ | 263,855 | $ | 25,375 | $ | 1,125,824 | ||||||||
Information regarding our other intangible assets is as follows:
|
Estimated
Useful Life |
Carrying
Amount |
Accumulated
Amortization |
Net
|
|||||||||||
| Balance, October 31, 2014 | ||||||||||||||
|
Customer lists
|
20 to 40 years
|
$ | 279,612 | $ | (66,850 | ) | $ | 212,762 | ||||||
|
Technology
|
Indefinite
|
176,318 | — | 176,318 | ||||||||||
|
Trademarks
|
Indefinite
|
200,758 | — | 200,758 | ||||||||||
|
Other
|
10 to 40 years
|
16,843 | (14,169 | ) | 2,674 | |||||||||
|
Total
|
|
$ | 673,531 | $ | (81,019 | ) | $ | 592,512 | ||||||
|
Balance, October 25, 2013
|
|
|||||||||||||
|
Customer lists
|
20 to 40 years
|
$ | 285,104 | $ | (60,925 | ) | $ | 224,179 | ||||||
|
Technology
|
Indefinite
|
177,877 | — | 177,877 | ||||||||||
|
Trademarks
|
Indefinite
|
204,117 | — | 204,117 | ||||||||||
|
Other
|
10 to 40 years
|
14,638 | (11,821 | ) | 2,817 | |||||||||
|
Total
|
|
$ | 681,736 | $ | (72,746 | ) | $ | 608,990 | ||||||
The decrease in intangible assets was due to amortization and foreign currency translation.
During the fourth quarter of 2014 and 2013, we completed our annual goodwill and indefinite-lived intangible asset impairment reviews with no impairments to the carrying values identified.
| 34 |
Total intangible asset amortization expense was $8,273, $7,037, and $6,553 in 2014, 2013 and 2012, respectively. The remaining life averages for assets included in the customer lists and other categories were 29 years and 36 years, respectively. Estimated amortization expense for each of the five succeeding fiscal years is approximately $8,500 annually.
NOTE 5 – SUPPLEMENTAL DISCLOSURES RELATED TO CURRENT LIABILITIES
Other accrued liabilities include the following:
|
|
2014
|
2013
|
||||||
|
Employee compensation
|
$ | 169,045 | $ | 122,111 | ||||
|
Customer volume rebates and incentives
|
93,186 | 80,024 | ||||||
|
Uninsured loss reserves and deferred revenue
|
59,730 | 63,254 | ||||||
|
Taxes, insurance, professional fees and services
|
48,663 | 53,209 | ||||||
|
Advertising and promotions
|
22,921 | 13,361 | ||||||
|
Interest
|
20,839 | 19,244 | ||||||
|
Contribution to employees’ retirement trusts
|
16,544 | 16,281 | ||||||
|
Restructuring
|
14,032 | 26,949 | ||||||
|
Deferred tax liability
|
4,533 | 2,961 | ||||||
|
Derivative liability
|
— | 885 | ||||||
|
Other
|
21,680 | 17,594 | ||||||
|
Total Other Accrued Liabilities
|
$ | 471,173 | $ | 415,873 | ||||
NOTE 6 – GUARANTEES AND CONTRACTUAL OBLIGATIONS
Furniture Protection Plans and Warranties: We sell extended furniture protection plans and offer warranties for certain products. In the U.S., revenue related to furniture protection plans is deferred and recognized over the contract life. Historical claims data is used to forecast claims payments over the contract period and revenue is recognized based on the forecasted claims payments. Actual claims costs are reflected in earnings in the period incurred. Anticipated losses are charged to earnings when identified. For product warranties, we estimate the costs that may be incurred under these warranties based on historical claims data and record a liability in the amount of such costs at the time revenue is recognized. Anticipated losses are charged to earnings when identified.
We periodically assess the adequacy of these recorded amounts and adjust as necessary. Provisions for estimated losses on uncompleted contracts are made in the period in which such losses can be estimated. The extended furniture protection plans that we enter into have fixed prices. To the extent the actual costs to complete contracts differ from the amounts estimated as of the date of the financial statements, gross margin would be affected in future periods when we revise our estimates.
Changes in the recorded amounts included in other liabilities, both short-term and long-term, during the period are as follows:
|
Balance, October 28, 2011
|
$ | 73,679 | ||
|
Additional net deferred revenue/warranty accrual made during the period
|
17,596 | |||
|
Warranty payments made during the period
|
(11,003 | ) | ||
|
Balance, October 26, 2012
|
$ | 80,272 | ||
|
Amount acquired through acquisitions
|
260 | |||
|
Additional net deferred revenue/warranty accrual made during the period
|
7,436 | |||
|
Warranty payments made during the period
|
(9,150 | ) | ||
|
Balance, October 25, 2013
|
$ | 78,818 | ||
|
Additional net deferred revenue/warranty accrual made during the period
|
8,982 | |||
|
Warranty payments made during the period
|
(7,173 | ) | ||
|
Balance, October 31, 2014
|
$ | 80,627 |
Contractual Purchase Commitments: We are obligated to make payments under contractual purchase commitments, including unconditional purchase obligations. The majority of our unconditional purchase obligations relate to the supply of raw materials with a five year term. The contracts require the purchase of minimum quantities of raw materials, at current market prices. We have estimated our payment obligations under existing contracts using current market prices and currently expect our purchases to exceed our minimum payment obligations. Payments for contracts with remaining terms in excess of one year are summarized below:
|
|
Maturities
|
|||
|
2015
|
$ | 17,306 | ||
|
2016
|
72,631 | |||
|
2017
|
1,849 | |||
|
2018
|
— | |||
|
2019
|
— | |||
|
Thereafter
|
— | |||
|
Total
|
$ | 91,786 | ||
Total payments relating to unconditional purchase obligations were approximately $63,718 in 2014, $50,893 in 2013 and $48,690 in 2012.
NOTE 7 – FAIR VALUE MEASUREMENT
We measure certain assets and liabilities at fair value or disclose the fair value of certain assets and liabilities recorded at cost in the Consolidated Financial Statements on both a recurring and non-recurring basis. Fair value is defined as an exit price, or the amount that would be received to sell an asset or paid to transfer a liability in an orderly transaction between market participants at the measurement date. The fair value accounting rules establish a hierarchy for inputs used in measuring fair value that maximizes the use of observable inputs and minimizes use of unobservable inputs. Observable inputs must be used when available. Observable inputs are inputs that market participants would use in valuing the asset or liability based on market data obtained from independent
| 35 |
sources. Unobservable inputs are inputs that reflect our assumptions about the factors market participants would use in
valuing the asset or liability based upon the best information available. Assets and liabilities measured at fair value are
to be categorized into one of the three hierarchy levels based on the inputs used in the valuation. We classify assets and
liabilities in their entirety based on the lowest level of input significant to the fair value measurement. Transfers of
instruments between levels are recorded based on end of period values. There were no transfers between levels for all periods
presented. The three levels are defined as follows:
|
•
|
Level 1: Observable inputs based on quoted prices (unadjusted) in active markets for identical assets or liabilities.
|
|
•
|
Level 2: Observable inputs based on quoted prices for similar assets and liabilities in active markets, or quoted prices for identical assets and liabilities in inactive markets.
|
|
•
|
Level 3: Unobservable inputs that reflect an entity’s own assumptions about what inputs a market participant would use in pricing the asset or liability based on the best information available in the circumstances.
|
Recurring Fair Value Measurements
The following tables provide information by level for assets and liabilities that are recorded at fair value on a recurring basis:
|
|
Fair Value at
|
Fair Value Measurements Using Inputs Considered as
|
||||||||||||||
|
|
October 31, 2014
|
Level 1
|
Level 2
|
Level 3
|
||||||||||||
|
Assets
|
|
|
|
|
||||||||||||
|
Cash equivalents
|
$ | 48,198 | $ | 48,198 | $ | — | $ | — | ||||||||
|
Restricted cash1
|
2,868 | 2,868 | — | — | ||||||||||||
|
Foreign currency contracts2
|
455 | — | 455 | — | ||||||||||||
|
Total Assets
|
$ | 51,521 | $ | 51,066 | $ | 455 | $ | — | ||||||||
|
|
Fair Value at
|
Fair Value Measurements Using Inputs Considered as
|
||||||||||||||
|
|
October 25, 2013
|
Level 1
|
Level 2
|
Level 3
|
||||||||||||
|
Assets
|
|
|
|
|
||||||||||||
|
Cash equivalents
|
$ | 69,671 | $ | 69,671 | $ | — | $ | — | ||||||||
|
Restricted cash1
|
3,550 | 3,550 | — | — | ||||||||||||
|
Total Assets
|
$ | 73,221 | $ | 73,221 | $ | — | $ | — | ||||||||
|
Liabilities
|
||||||||||||||||
|
Foreign currency contracts2
|
$ | 145 | $ | — | $ | 145 | $ | — | ||||||||
|
Total Liabilities
|
$ | 145 | $ | — | $ | 145 | $ | — | ||||||||
|
1
|
Restricted cash represents cash that is restricted from withdrawal for contractual or legal reasons.
|
|
2
|
Foreign currency contracts are included in prepaid expenses and other when in an asset position and other accrued liabilities when in a liability position in the Consolidated Balance Sheets. The fair value was estimated using observable market data for similar financial instruments. See Note 8 for additional information on derivative financial instruments.
|
The following tables provide information regarding the estimated fair value of our outstanding debt which is recorded at carrying value in the Consolidated Balance Sheets:
|
|
Fair Value at
|
Fair Value Measurements Using Inputs Considered as
|
||||||||||||||
|
|
October 31, 2014
|
Level 1
|
Level 2 |
Level 3
|
||||||||||||
|
Debt3
|
|
|
|
|
||||||||||||
|
Publicly traded debt
|
$ | 1,099,695 | $ | 1,099,695 | $ | — | $ | — | ||||||||
|
Non-publicly traded debt
|
532,397 | — | 532,397 | — | ||||||||||||
|
Other4
|
23,838 | — | 23,838 | — | ||||||||||||
|
Total Debt
|
$ | 1,655,930 | $ | 1,099,695 | $ | 556,235 | $ | — | ||||||||
|
|
Fair Value at
|
Fair Value Measurements Using Inputs Considered as
|
||||||||||||||
|
|
October 25, 2013
|
Level 1
|
Level 2 |
Level 3
|
||||||||||||
|
Debt3
|
|
|
|
|
||||||||||||
|
Publicly traded debt
|
$ | 1,097,309 | $ | 1,097,309 | $ | — | $ | — | ||||||||
|
Non-publicly traded debt
|
478,557 | — | 478,557 | — | ||||||||||||
|
Total Debt
|
$ | 1,575,866 | $ | 1,097,309 | $ | 478,557 | $ | — | ||||||||
|
3
|
Debt is recorded at carrying value of $1,556,391 and $1,478,557 on the Consolidated Balance Sheets as of October 31, 2014 and October 25, 2013, respectively. The fair value of our publicly traded debt is based on quoted prices (unadjusted) in active markets. The fair value of our non-publicly traded debt was estimated using a discounted cash flow analysis based on our current borrowing costs for debt with similar maturities. In addition, the carrying values of our commercial paper included in non-publicly traded debt approximate the financial instrument’s fair value as the maturities are less than three months. See Note 9 for additional information on debt.
|
|
4
|
Other consists of bank acceptance drafts and commercial acceptance drafts from our customers that have been sold with recourse to financial institutions but have not yet matured. Refer to Note 9 for additional information.
|
| 36 |
Nonrecurring Fair Value Measurements
We measure certain assets at fair value on a nonrecurring basis. These assets primarily include assets acquired and liabilities assumed as part of an acquisition, as well as property, plant and equipment when the planned use of the asset changes. See Note 2 for additional information on our acquisitions and Note 18 for additional information on restructuring.
NOTE 8 – DERIVATIVE FINANCIAL INSTRUMENTS
We use derivative financial instruments to manage interest rate and foreign currency exchange risks. We enter into derivative financial instruments with high-credit quality counterparties and diversify our positions among such counterparties to reduce our exposure to credit losses. We do not have any credit-risk-related contingent features in our derivative contracts as of October 31, 2014.
At October 31, 2014, we had $8,927 notional amount of foreign currency contracts that mature during fiscal year 2015. These foreign currency contracts have been designated as cash flow hedges with unrealized gains or losses recorded in accumulated other comprehensive income (loss). Gains and losses are reclassified from accumulated other comprehensive income (loss) to other expense (income) in the Consolidated Statements of Operations when the underlying hedged item is realized. At October 25, 2013, we had $29,505 notional amount of foreign currency contracts maturing in fiscal year 2014. There was no material ineffectiveness for these hedges during 2014 or 2013.
At October 31, 2014 and October 25, 2013, we had no treasury lock contracts in place. The accumulated other comprehensive loss amount in our Consolidated Balance Sheets as of October 31, 2014 and October 25, 2013 represent the unamortized gains and losses, net of tax, from treasury lock contracts settled in previous periods. Unamortized gains and losses are reclassified ratably from accumulated other comprehensive income (loss) to interest expense in our Consolidated Statements of Operations over the term of the related debt. At October 31, 2014, the amount that will be recognized in interest expense in fiscal year 2015 is $1,256.
Our derivative assets and liabilities subject to fair value measurement (see Note 7) include the following:
|
Fair Value at
October 31, 2014
|
Fair Value at
October 25, 2013
|
||||||
| Assets | |||||||
|
Prepaid expenses and other:
|
|||||||
|
Foreign currency contracts
|
$
|
455
|
$
|
—
|
|||
|
Total Assets
|
$
|
455
|
$
|
—
|
|||
|
Liabilities
|
|||||||
|
Accrued liabilities other:
|
|||||||
|
Foreign currency contracts
|
$
|
—
|
$
|
145
|
|||
|
Total Liabilities
|
$
|
—
|
$
|
145
|
|||
Derivative gains (losses) recognized in AOCI1 and on the Consolidated Statements of Operations for fiscal year ended October 31, 2014 and October 25, 2013, respectively, are as follows:
|
For the Year Ended October 31, 2014
|
Amount of Gain
(Loss)
Recognized in
AOCI1
|
Statement of Operations
Classification
|
Amount of Gain
(Loss)
Recognized in
Earnings1
|
|||||||
|
Derivatives designated as cash flow hedges
|
||||||||||
|
Foreign currency contracts
|
$
|
600
|
Other income (expense), net
|
$
|
(263
|
)
|
||||
|
Treasury lock contracts
|
1,279
|
Interest expense
|
(1,279
|
)
|
||||||
|
Total derivatives designated as cash flow hedges
|
$
|
1,879
|
Total
|
$
|
(1,542
|
)
|
||||
|
For the Year Ended October 25, 2013
|
Amount of Gain
(Loss)
Recognized in
AOCI1
|
Statement of Operations
Classification
|
Amount of Gain
(Loss)
Recognized in
Earnings1
|
|||||||
|
Derivatives designated as cash flow hedges
|
||||||||||
|
Foreign currency contracts
|
$
|
(160
|
)
|
Other income (expense), net
|
$
|
135
|
||||
|
Treasury lock contracts
|
1,278
|
Interest expense
|
(1,278
|
)
|
||||||
|
Total derivatives designated as cash flow hedges
|
$
|
1,118
|
Total
|
$
|
(1,143
|
)
|
||||
|
1
|
Accumulated other comprehensive income (loss) (AOCI) is included in the Consolidated Balance Sheet in the Stockholders’ Equity section and is reported net of tax. The amounts disclosed in the above table are reported pretax and represent the full year derivative activity.
|
| 37 |
NOTE 9 – DEBT
Our debt consists of the following:
|
2014
|
2013
|
||||||
|
Notes to banks
(weighted average interest rate of 6.38% at October 31, 2014 and 2.03% at October 25, 2013) |
$
|
31,140
|
$
|
118,682
|
|||
|
Bankers’ Acceptance Drafts and Commercial Acceptance Drafts
|
23,838
|
—
|
|||||
|
Commercial Paper
(0.32% – 0.35% at October 31, 2014 and 0.31% – 0.43% at October 25, 2013) |
388,876
|
322,483
|
|||||
|
Total Short-term Debt
|
443,854
|
441,165
|
|||||
|
Industrial development bonds
(0.21% at October 31, 2014 payable in 2015) |
12,502
|
—
|
|||||
|
Senior notes – Due 2015 at 5.10%
|
150,000
|
—
|
|||||
|
Total Current Portion of Long-term Debt
|
162,502
|
—
|
|||||
|
Notes to banks
(weighted average interest rate 2.53% at October 31, 2014 and 0.89% at October 25, 2013) |
35
|
24,890
|
|||||
|
Revolving Credit Facility
|
100,000
|
—
|
|||||
| Senior notes (at fixed rates) | |||||||
|
Due 2015 at 5.10%
|
—
|
150,000
|
|||||
|
Due 2017 at 6.05%
|
150,000
|
150,000
|
|||||
|
Due 2019 at 7.25%
|
300,000
|
300,000
|
|||||
|
Due 2022 at 4.20%
|
400,000
|
400,000
|
|||||
|
Industrial development bonds
(0.25% at October 25, 2013 payable in 2015) |
—
|
12,502
|
|||||
|
Total Long-term Debt
|
950,035
|
1,037,392
|
|||||
|
Total Debt
|
$
|
1,556,391
|
$
|
1,478,557
|
|||
We maintain an unsecured revolving credit facility with a syndicate of banks. On December 16, 2013, we entered into an amended and restated $750,000 credit facility with a syndicate of banks with a maturity date of December 14, 2018 to replace the previous $550,000 credit facility that was scheduled to expire December 31, 2014. In July 2013, we entered into a U.S. dollar equivalent unsecured committed revolving bilateral credit facility, expiring July 2014. In July 2014, this facility was extended for one year to July 2015.
In certain regions we accept bankers’ acceptance drafts and commercial acceptance drafts as payment from customers. These instruments were sold with recourse to a financial institution. We record the instruments as short-term secured borrowings from the time they are sold until they reach maturity.
As of October 31, 2014 and October 25, 2013, our bank facilities consisted of the following:
|
October 31, 2014
|
|||||||
|
Total
Outstanding
|
Facility
Size
|
||||||
|
December 2018 bank syndicate facility1
|
$
|
488,876
|
$
|
750,000
|
|||
|
July 2015 bilateral facility
|
13,938
|
13,938
|
|||||
|
Total unsecured committed revolving credit
|
502,814
|
763,938
|
|||||
|
Uncommitted bank lines of credit
|
17,202
|
196,301
|
|||||
|
Bankers’ Acceptance Drafts and Commercial Acceptance Drafts
|
23,838
|
—
|
|||||
|
Total Bank Credit Facilities
|
$
|
543,854
|
$
|
960,239
|
|||
|
October 25, 2013
|
|||||||
|
Total
Outstanding
|
Facility
Size
|
||||||
|
December 2018 bank syndicate facility1
|
$
|
322,483
|
$
|
750,000
|
|||
|
July 2014 bilateral facility
|
107,767
|
107,767
|
|||||
|
Total unsecured committed revolving credit
|
430,250
|
857,767
|
|||||
|
Uncommitted bank lines of credit
|
10,915
|
182,778
|
|||||
|
Total Bank Credit Facilities
|
$
|
441,165
|
$
|
1,040,545
|
|||
|
1
|
Our bank syndicate facility includes $100,000 of revolving credit facility borrowings as of October 31, 2014, along with $388,876 and $322,483 of commercial paper as of October 31, 2014 and October 25, 2013, respectively. We have a $450,000 commercial paper program backstopped by our $750,000 credit facility, as amended and restated.
|
We maintain uncommitted bank lines of credit to meet short-term funding needs in certain of our international locations. These arrangements are reviewed periodically for renewal and modification. Borrowings under these debt arrangements had an average annual interest rate of 12.30% in 2014, 11.63% in 2013 and 9.52% in 2012.
Our credit facilities have covenants that require us to maintain certain financial ratios. We were in compliance with these covenants as of October 31, 2014. Our debt covenants do not limit, nor are they reasonably likely to limit, our ability to obtain additional debt or equity financing.
The future maturities of long-term debt are as follows:
|
Maturities
|
||||
|
2015
|
$
|
162,502
|
||
|
2016
|
—
|
|||
|
2017
|
150,000
|
|||
|
2018
|
100,000
|
|||
|
2019
|
300,000
|
|||
|
Thereafter
|
400,035
|
Interest paid during 2014, 2013, and 2012 was $65,297, $66,451, and $68,714, respectively.
| 38 |
NOTE 10 – STOCK-BASED COMPENSATION
We issue stock-based compensation through our 2009 Omnibus Equity Plan (Omnibus Plan), which permits the issuance of stock option, restricted stock, restricted stock unit and stock award grants to officers, employees, non-employee directors and consultants. Total stock-based compensation expense was $28,314, $23,230 and $23,149 in 2014, 2013 and 2012, respectively. Shares reserved for future grants under the Omnibus Plan were 1,826,739, 2,291,703 and 2,952,340 at October 31, 2014, October 25, 2013 and October 25, 2012, respectively.
Stock Options: Stock options awarded through the Omnibus Plan reduce the reserved shares pool at a rate equal to the number of options granted. Options generally have a contractual term of 10 years, vest ratably over three to five years for employees and vest immediately upon grant for non-employee directors. Awards to retirement-eligible employees are expensed on the date of grant.
Stock-based compensation expense included in our Consolidated Statements of Operations for stock options was $6,382, $7,189, and $7,801 in fiscal year 2014, 2013, and 2012, respectively. The total grant-date fair value of options vested during the year was $4,958, $4,653 and $7,639 in fiscal year 2014, 2013 and 2012, respectively. As of October 31, 2014, there was $7,095 of total unrecognized pre-tax compensation cost related to non-vested awards that are expected to be recognized over a weighted-average period of 2.1 years.
The fair value of each option grant is estimated on the date of grant using the Black-Scholes option pricing model. Annually, we make predictive assumptions regarding future stock price volatility, employee exercise behavior, dividend yield, and the forfeiture rate. The dividend yield assumption is based on the expected annual dividend yield on the grant date. Expected stock price volatility is estimated using historical volatility over the expected life of the option. The risk-free interest rate for periods during the expected term of the options is based on yields available on the grant date for US Treasury STRIPS with maturity consistent with the expected life assumption. The expected life represents the period of time that options granted are expected to be outstanding based on historical data to estimate option exercises and employee terminations within the valuation model.
The following table sets forth the weighted-average fair values and assumptions on which the fair values are determined:
|
2014
|
2013
|
2012
|
||||||||
|
Expected dividend yield
|
1.4
|
%
|
1.4
|
%
|
1.5
|
%
|
||||
|
Expected stock price volatility
|
30.0
|
%
|
30.0
|
%
|
29.0
|
%
|
||||
|
Risk-free interest rate
|
2.2
|
%
|
2.0
|
%
|
1.2
|
%
|
||||
|
Expected life of options
|
6.8 years
|
7.4 years
|
7.4 years
|
|||||||
|
Weighted average fair value on the date of grant
|
$
|
22.54
|
$
|
19.12
|
$
|
15.10
|
Stock option activity for the three years ended October 31, 2014 is summarized as follows:
|
Options
Outstanding
|
Weighted Average
Exercise Price
per share1
|
Weighted Average
Remaining
Contractual Life
|
Aggregate
Intrinsic Value2
|
||||||||||
|
Balance, October 28, 2011
|
8,908,796
|
$
|
24.88
|
6.0 years
|
$
|
97,560
|
|||||||
|
Granted
|
516,058
|
55.64
|
|||||||||||
|
Exercised
|
(2,315,413
|
)
|
23.01
|
57,466
|
|||||||||
|
Canceled
|
(9,663
|
)
|
26.37
|
||||||||||
|
Balance, October 26, 2012
|
7,099,778
|
$
|
27.73
|
6.1 years
|
$
|
194,442
|
|||||||
|
Granted
|
463,900
|
64.36
|
|||||||||||
|
Exercised
|
(1,500,661
|
)
|
24.32
|
61,042 | |||||||||
|
Canceled
|
(200
|
)
|
17.50
|
||||||||||
|
Balance, October 25, 2013
|
6,062,817
|
$
|
31.37
|
5.9 years
|
$
|
235,887
|
|||||||
|
Granted
|
297,865
|
76.50
|
|||||||||||
|
Exercised
|
(1,098,023
|
)
|
25.18
|
54,909
|
|||||||||
|
Canceled
|
(20,419
|
)
|
53.07
|
||||||||||
|
Balance, October 31, 2014
|
5,242,240
|
$
|
35.15
|
5.5 years
|
$
|
246,440
|
|||||||
|
Exercisable
|
4,489,970
|
29.74
|
4.9 years
|
235,345
|
|||||||||
|
1
|
The exercise price of the options granted during these periods was equal to the market price of the underlying stock on the date of grant.
|
|
2
|
Intrinsic value at October 31, 2014 was based on our closing stock price on the last trading day of the year for in-the-money options.
|
Options exercisable of 5,068,438 at October 25, 2013 and 5,823,529 at October 26, 2012 had weighted-average exercise prices of $26.81 and $24.87, respectively.
Restricted Stock: Restricted stock awarded through the Omnibus Plan reduces the pool of reserved shares at a multiple of 2.53 times the actual number of shares awarded. Restricted shares vest after three to five years.
| 39 |
Stock-based compensation expense included in our Consolidated Statements of Operations for restricted stock was $5,878, $1,998 and $4,515 in fiscal year 2014, 2013 and 2012, respectively. As of October 31, 2014, there was $8,161 of total unrecognized pre-tax compensation cost related to restricted stock that is expected to be recognized over a weighted-average period of 3.6 years.
The following table sets forth a reconciliation of restricted stock for the three years ended October 31, 2014:
|
Weighted Average
|
||||||||||||
|
Shares
|
Grant Date
|
Aggregate
|
||||||||||
|
Outstanding
|
Fair Value
|
Intrinsic Value1
|
||||||||||
|
Balance, October 28, 2011
|
611,207 | $ | 28.80 | 21,900 | ||||||||
|
Granted
|
77,843 | 40.03 | 3,116 | |||||||||
|
Vested
|
(214,130 | ) | 26.08 | 8,033 | ||||||||
|
Forfeited
|
(221 | ) | 27.59 | (6 | ) | |||||||
|
Balance, October 26, 2012
|
474,699 | $ | 31.87 | 26,089 | ||||||||
|
Granted
|
75,826 | 63.32 | 4,801 | |||||||||
|
Vested
|
(182,659 | ) | 29.35 | 11,727 | ||||||||
|
Forfeited
|
(10,943 | ) | 41.62 | (455 | ) | |||||||
|
Balance, October 25, 2013
|
356,923 | $ | 39.54 | 25,085 | ||||||||
|
Granted
|
85,121 | 74.78 | 6,366 | |||||||||
|
Vested
|
(139,994 | ) | 35.90 | 9,831 | ||||||||
|
Forfeited
|
(22,127 | ) | 42.79 | (947 | ) | |||||||
|
Balance, October 31, 2014
|
279,923 | $ | 51.82 | 22,998 | ||||||||
|
1
|
Intrinsic value of restricted stock vested was based on our closing stock price on the last trading day of the year.
|
Cash-settled Restricted Stock Units: Cash-settled restricted stock units granted through our Omnibus Plan do not impact the pool of reserved shares. Since the compensation expense is payable in cash, these cash-settled restricted stock units are classified as liabilities within other long-term liabilities and are marked to market each period. Cash-settled restricted stock units vest after three to five years.
Stock-based compensation expense included in our Consolidated Statements of Operations for cash-settled restricted stock units was $15,198, $13,618 and $10,524 in fiscal year 2014, 2013 and 2012, respectively. Cash payments for cash-settled restricted stock units were $8,083 in 2014. There were no payments for cash-settled restricted stock units prior to 2014. As of October 31, 2014, there was $12,221 of total unrecognized pre-tax compensation cost related to cash-settled restricted stock units that is expected to be recognized over a weighted-average period of 1.9 years.
The following table sets forth a reconciliation of cash-settled restricted stock units for the three years ended October 31, 2014:
|
Weighted Average
|
||||||||||||
|
Units
|
Grant Date
|
Aggregate
|
||||||||||
|
Outstanding
|
Fair Value
|
Intrinsic Value1
|
||||||||||
|
Balance, October 28, 2011
|
211,466 | $ | 36.30 | $ | 7,577 | |||||||
|
Granted
|
243,753 | 41.52 | 10,119 | |||||||||
|
Vested
|
(3,685 | ) | 37.30 | 169 | ||||||||
|
Forfeited
|
(6,281 | ) | 35.97 | (226 | ) | |||||||
|
Balance, October 26, 2012
|
445,253 | $ | 39.15 | $ | 24,471 | |||||||
|
Granted
|
190,609 | 63.72 | 12,145 | |||||||||
|
Vested
|
(15,219 | ) | 51.49 | 942 | ||||||||
|
Forfeited
|
(22,120 | ) | 46.03 | (1,018 | ) | |||||||
|
Balance, October 25, 2013
|
598,523 | $ | 46.41 | $ | 42,064 | |||||||
|
Granted
|
143,244 | 71.50 | 10,243 | |||||||||
|
Vested
|
(111,798 | ) | 37.62 | 7,960 | ||||||||
|
Forfeited
|
(33,881 | ) | 51.76 | (1,754 | ) | |||||||
|
Balance, October 31, 2014
|
596,088 | $ | 53.78 | $ | 48,975 | |||||||
|
1
|
Intrinsic value of cash-settled restricted stock units vested was based on our closing stock price on the last trading day of the year.
|
Stock Awards: Stock awards to Directors through the Omnibus Plan reduce the pool of available shares at a multiple of 2.53 times the actual number of shares awarded. Stock awards are issued and outstanding upon date awarded. Stock-based compensation expense included in our Consolidated Statements of Operations for stock awards was $856, $425 and $309 in fiscal year 2014, 2013 and 2012, respectively.
| 40 |
NOTE 11 – PENSIONS AND OTHER POST-RETIREMENT BENEFITS
Savings and Retirement Plan: We sponsor a Savings and Retirement Plan for substantially all of our U.S. employees. Under the Plan, we match employee contributions up to a maximum of 3% of employees’ compensation. In addition to matching employees’ contributions throughout the year, there is a year-end discretionary contribution that can range from 4% to 13% of eligible employees’ pay as defined in the Plan. U.S. employees who are not eligible for the Savings and Retirement Plan have the option to participate in a separate 401(k) Employee Stock Ownership Plan. We match employee contributions made by participants in that plan up to a maximum of 3% of employees’ compensation. In addition to matching employees’ contributions throughout the year, there is a discretionary year-end matching contribution that can range from 0-3%. Employer contributions to the Plans totaled $20,981, $25,609, and $27,629 for 2014, 2013, and 2012, respectively.
Executive Retirement Plans: We have Supplemental Executive Retirement Plans (SERPs) to provide retirement, death and disability benefits to a limited number of former employees. Annual benefits under the SERPs are based on years of service and individual compensation near retirement.
Pension and Post-Retirement Medical Plans: We sponsor several defined benefit pension plans for certain hourly and salaried employees. The benefits for most of these plans are generally based on stated amounts for each year of service. We fund the plans in amounts consistent with the limits of allowable tax deductions. During fiscal year 2014, we made contributions of approximately $3,840 to our pension plans. We also sponsor a post-retirement medical plan that provides subsidized medical benefits for eligible retired employees and their eligible dependents. The plan changed on January 1, 2009 to eliminate the subsidy for future retirees with the exception of a small group of employees near retirement that will still be eligible for the subsidized coverage at retirement. A 1% increase in the medical trend rates would not have a material effect on post-retirement medical expense or the post-retirement benefit obligation. For the fiscal year ending October 30, 2015, we expect our total contributions to our funded pension plans, unfunded pension, non-qualified plans and post-retirement medical plans to be at least $4,549.
The cost of pension and post-retirement medical benefits recognized in the Consolidated Statement of Operations is as follows:
| Pension | ||||||||||||
|
2014
|
2013
|
2012
|
||||||||||
|
Service cost
|
$ | 4,358 | $ | 4,846 | $ | 4,185 | ||||||
|
Interest cost
|
14,848 | 13,203 | 14,077 | |||||||||
|
Expected return on plan assets
|
(19,907 | ) | (19,699 | ) | (19,379 | ) | ||||||
|
Amortization of prior service cost
|
480 | 448 | 435 | |||||||||
|
Recognized actuarial loss
|
6,190 | 9,577 | 6,865 | |||||||||
|
Settlement gain
|
(422 | ) | (110 | ) | (35 | ) | ||||||
|
Curtailment
|
— | — | — | |||||||||
|
Net Periodic Benefit Cost
|
$ | 5,547 | $ | 8,265 | $ | 6,148 | ||||||
| Post-Retirement Medical | ||||||||||||
| 2014 | 2013 | 2012 | ||||||||||
|
Service cost
|
$ | 153 | $ | 238 | $ | 124 | ||||||
|
Interest cost
|
382 | 360 | 448 | |||||||||
|
Expected return on plan assets
|
N/A | N/A | N/A | |||||||||
|
Amortization of prior service cost
|
(128 | ) | (128 | ) | (128 | ) | ||||||
|
Recognized actuarial loss
|
369 | 469 | 471 | |||||||||
|
Net Periodic Benefit Cost
|
$ | 776 | $ | 939 | $ | 915 | ||||||
| 41 |
The plans’ funded status is shown below, along with a description of how the status changed during the past two years. The benefit obligation is the projected benefit obligation—the actuarial present value, as of a date, of all benefits attributed by the pension benefit formula to employee service rendered prior to that date.
|
Pension
|
Post-Retirement Medical
|
|||||||||||||||
|
Change in Benefit Obligation
|
2014
|
2013
|
2014
|
2013
|
||||||||||||
|
Benefit obligation beginning of year
|
$ | 316,097 | $ | 327,859 | $ | 8,549 | $ | 9,544 | ||||||||
|
Service cost
|
4,358 | 4,846 | 153 | 238 | ||||||||||||
|
Interest cost
|
14,848 | 13,203 | 382 | 360 | ||||||||||||
|
Plan participants’ contributions
|
569 | 677 | — | — | ||||||||||||
|
Plan amendments
|
(115 | ) | 470 | — | — | |||||||||||
|
Actuarial loss/(gain)
|
41,775 | (17,004 | ) | 1,406 | (757 | ) | ||||||||||
|
Benefits paid
|
(18,477 | ) | (14,815 | ) | (1,363 | ) | (836 | ) | ||||||||
|
Expenses paid from assets
|
(462 | ) | (143 | ) | — | — | ||||||||||
|
Currency impact
|
(3,735 | ) | 440 | — | — | |||||||||||
|
Acquisition
|
— | 4,437 | — | — | ||||||||||||
|
Curtailments
|
(455 | ) | (3,873 | ) | — | — | ||||||||||
|
Other
|
— | — | — | — | ||||||||||||
|
Benefit Obligation at End of Year
|
$ | 354,403 | $ | 316,097 | $ | 9,127 | $ | 8,549 | ||||||||
|
Pension
|
Post-Retirement Medical
|
|||||||||||||||
|
Change in Plan Assets
|
2014 | 2013 | 2014 | 2013 | ||||||||||||
|
Fair value of plan assets at beginning of year
|
$ | 301,932 | $ | 279,238 | $ | — | $ | — | ||||||||
|
Actual return on plan assets
|
38,380 | 34,227 | — | — | ||||||||||||
|
Employer contributions
|
3,840 | 3,490 | 1,363 | 836 | ||||||||||||
|
Plan participants’ contributions
|
569 | 677 | — | — | ||||||||||||
|
Benefit payments
|
(18,477 | ) | (14,815 | ) | (1,363 | ) | (836 | ) | ||||||||
|
Expenses paid from assets
|
(462 | ) | (143 | ) | — | — | ||||||||||
|
Currency impact
|
(1,908 | ) | (742 | ) | — | — | ||||||||||
|
Other
|
— | — | — | — | ||||||||||||
|
Fair Value of Assets at End of Year
|
$ | 323,874 | $ | 301,932 | $ | — | $ | — | ||||||||
|
Pension
|
Post-Retirement Medical
|
|||||||||||||||
|
Funded Status
|
2014 | 2013 | 2014 | 2013 | ||||||||||||
|
Projected benefit obligation
|
$ | (354,403 | ) | $ | (316,097 | ) | $ | (9,127 | ) | $ | (8,549 | ) | ||||
|
Plan assets at fair value
|
323,874 | 301,932 | — | — | ||||||||||||
|
Net Funded Status – Over / (Under)
|
$ | (30,529 | ) | $ | (14,165 | ) | $ | (9,127 | ) | $ | (8,549 | ) | ||||
|
Funded status – overfunded plans
|
$ | 2,765 | $ | 14,572 | $ | — | $ | — | ||||||||
|
Funded status – underfunded plans
|
(33,294 | ) | (28,737 | ) | (9,127 | ) | (8,549 | ) | ||||||||
|
Pension
|
Post-Retirement Medical
|
|||||||||||||||
|
Amounts Recognized in Balance Sheet
|
2014 | 2013 | 2014 | 2013 | ||||||||||||
|
Noncurrent assets
|
$ | 2,765 | $ | 14,572 | $ | — | $ | — | ||||||||
|
Current liabilities
|
(706 | ) | (491 | ) | (955 | ) | (987 | ) | ||||||||
|
Noncurrent liabilities
|
(32,588 | ) | (28,246 | ) | (8,172 | ) | (7,562 | ) | ||||||||
|
Pension
|
Post-Retirement Medical
|
|||||||||||||||
|
Amounts in Accumulated Other Comprehensive Income
|
2014 | 2013 | 2014 | 2013 | ||||||||||||
|
Net (gain) loss
|
$ | 116,787 | $ | 100,181 | $ | 5,182 | $ | 4,146 | ||||||||
|
Net prior service cost (credit)
|
4,205 | 4,813 | (311 | ) | (439 | ) | ||||||||||
|
Other Comprehensive (Income) Loss – Total
|
$ | 120,992 | $ | 104,994 | $ | 4,871 | $ | 3,707 | ||||||||
| Amortization Expense Expected to Be Recognized During Next Fiscal Year |
Pension
|
Post-Retirement Medical
|
||||||||||||||
| 2014 | 2013 | 2014 | 2013 | |||||||||||||
|
Prior service cost (credits)
|
$ | 451 | $ | 480 | $ | (128 | ) | $ | (128 | ) | ||||||
|
Net loss
|
6,705 | 6,168 | 431 | 369 | ||||||||||||
| 42 |
Our pension and post-retirement medical plans with accumulated benefit obligations in excess of plan assets were as follows:
|
Pension
|
Post-Retirement Medical
|
|||||||||||||||
|
2014
|
2013
|
2014
|
2013
|
|||||||||||||
|
Projected/accumulated post-retirement benefit obligation
|
$ | 290,777 | $ | 93,298 | $ | 9,127 | $ | 8,549 | ||||||||
|
Accumulated benefit obligation
|
282,925 | 88,765 | N/A | N/A | ||||||||||||
|
Fair value of plan assets
|
257,483 | 64,561 | N/A | N/A | ||||||||||||
Our pension and post-retirement medical plans with projected benefit obligations in excess of plan assets were as follows:
|
Pension
|
Post-Retirement Medical
|
|||||||||||||||
|
2014
|
2013
|
2014
|
2013
|
|||||||||||||
|
Projected benefit obligation
|
$ | 290,777 | $ | 93,298 | N/A | N/A | ||||||||||
|
Accumulated benefit obligation
|
282,925 | 88,765 | N/A | N/A | ||||||||||||
|
Fair value of plan assets
|
257,483 | 64,591 | N/A | N/A | ||||||||||||
Our pension and post-retirement medical plans with projected benefit obligations less than plan assets were as follows:
|
Pension
|
Post-Retirement Medical
|
|||||||||||||||
|
2014
|
2013
|
2014
|
2013
|
|||||||||||||
|
Projected benefit obligation
|
$ | 63,626 | $ | 222,798 | N/A | N/A | ||||||||||
|
Accumulated benefit obligation
|
63,521 | 219,155 | N/A | N/A | ||||||||||||
|
Fair value of plan assets
|
66,390 | 237,371 | N/A | N/A | ||||||||||||
Actuarial Assumptions: We determine our actuarial assumptions on an annual basis. These assumptions are weighted to reflect each country having requirements that may impact the cost of providing retirement benefits. We employ a total return investment approach for the domestic and foreign pension plan assets. A mix of equities and fixed income investments are used to maximize the long-term return on plan assets for a prudent level of risk. In determining the expected long-term rate of return, management considers the historical rates of return, the nature of investments and an expectation of future investment strategies. Our expected return on plan assets utilizes a calculated-value technique that recognizes changes in actual investment return from expected investment return in a systematic and rational manner over a 5 year-period. We use the most-recent mortality tables available for each country.
|
Pension
|
Post-Retirement Medical
|
|||||||||||||||
|
Assumption ranges used in net periodic benefit cost
|
2014
|
2013
|
2014
|
2013
|
||||||||||||
|
Discount rate
|
3.00% – 5.00 | % | 3.00% – 4.75 | % | 4.75 | % | 4.00 | % | ||||||||
|
Expected long-term return on plan assets
|
3.75% – 7.50 | % | 3.75% – 7.75 | % | N/A | N/A | ||||||||||
|
Average increase in compensation
|
2.25% – 3.25 | % | 2.25% – 3.75 | % | N/A | N/A | ||||||||||
|
Initial medical trend rate
|
N/A | N/A | 7.50 | % | 8.00 | % | ||||||||||
|
Ultimate medical trend rate
|
N/A | N/A | 5.00 | % | 5.00 | % | ||||||||||
|
Years to ultimate rate
|
N/A | N/A |
5 Years
|
6 Years
|
||||||||||||
|
Pension
|
Post-Retirement Medical
|
|||||||||||||||
|
Assumption ranges used to determine benefit obligation
|
2014 | 2013 | 2014 | 2013 | ||||||||||||
|
Discount rate
|
2.50% – 4.50 | % | 3.00% – 5.00 | % | 4.25 | % | 4.75 | % | ||||||||
|
Rate of compensation increase
|
2.25% – 3.25 | % | 2.25% – 3.25 | % | N/A | N/A | ||||||||||
|
Initial medical trend rate
|
N/A | N/A | 7.00 | % | 7.50 | % | ||||||||||
|
Ultimate medical trend rate
|
N/A | N/A | 5.00 | % | 5.00 | % | ||||||||||
|
Years to ultimate rate
|
N/A | N/A |
4 Years
|
5 Years
|
||||||||||||
Investment Strategy: We have a master trust that holds the assets for all our U.S. pension plans. For investment purposes, the plans are managed in an identical way, as their objectives are similar. The Benefit Funds Investment Committee (Committee), along with assistance from external consultants, sets investment guidelines and makes asset allocation decisions based on market conditions, risk tolerance, funding requirements and expected benefit payments. The Committee also oversees the selection of investment managers and monitors asset performance. As pension liabilities are long-term in nature, the Committee employs a long-term rate of return on plan assets approach for a prudent level of risk. Historical returns are considered as well as advice from investment experts. Annually, the Committee and the consultants review the risk versus the return of the investment portfolio to assess the long-term rate of return assumption.
| 43 |
The U.S. investment portfolio contains a diversified portfolio of investment categories, including domestic and international equities and short and long-term fixed income securities. Among the equity investments there is also diversity of style, growth versus value. Plan assets did not include investments in our stock as of the reported dates. The Committee believes with prudent risk tolerance and asset diversification, the plans should be able to meet their pension obligations in the future.
The weighted average asset allocations for the past two fiscal years by asset category are as follows:
|
Pension Plans
|
||||||||||||
|
Target
|
||||||||||||
|
Asset Allocation
|
2014
|
2013
|
Allocation
|
|||||||||
|
Equity securities
|
56 | % | 56 | % | 50% – 60 | % | ||||||
|
Debt securities
|
36 | % | 37 | % | 40% – 50 | % | ||||||
|
Other
|
8 | % | 7 | % | — | % | ||||||
|
Total
|
100 | % | 100 | % | 100 | % | ||||||
The following tables provide information on the fair value of pension plan assets. See Note 7 for more information on fair value measurements.
|
Fair Value at
|
Fair Value Measurements Using Inputs Considered as
|
|||||||||||||||
|
October 31, 2014
|
Level 1
|
Level 2
|
Level 3
|
|||||||||||||
|
Domestic Equity Securities
|
||||||||||||||||
|
Commingled Trust
|
$ | 80,185 | $ | — | $ | 80,185 | $ | — | ||||||||
|
Mutual Fund
|
30,874 | 30,874 | — | — | ||||||||||||
|
International Equity Securities
|
||||||||||||||||
|
Mutual Funds
|
71,632 | 32,335 | 39,297 | — | ||||||||||||
|
Total Equity Securities
|
182,691 | 63,209 | 119,482 | — | ||||||||||||
|
Domestic Fixed Income
|
||||||||||||||||
|
Mutual Fund
|
93,196 | 93,196 | — | — | ||||||||||||
|
International Fixed Income
|
||||||||||||||||
|
Debt Securities
|
10,122 | — | 10,122 | — | ||||||||||||
|
Mutual Funds
|
13,662 | — | 13,662 | — | ||||||||||||
|
Total Fixed Income
|
116,980 | 93,196 | 23,784 | — | ||||||||||||
|
Other Investments
|
||||||||||||||||
|
Insurance Contracts
|
20,274 | — | — | 20,274 | ||||||||||||
|
Cash
|
2,541 | 2,541 | — | — | ||||||||||||
|
Real Estate
|
1,388 | — | 888 | 500 | ||||||||||||
|
Total Other Investments
|
24,203 | 2,541 | 888 | 20,774 | ||||||||||||
|
Total
|
$ | 323,874 | $ | 158,946 | $ | 144,154 | $ | 20,774 | ||||||||
|
Fair Value at
|
Fair Value Measurements Using Inputs Considered as
|
|||||||||||||||
|
October 25, 2013
|
Level 1
|
Level 2
|
Level 3
|
|||||||||||||
|
Domestic Equity Securities
|
||||||||||||||||
|
Commingled Trust
|
$ | 71,410 | $ | — | $ | 71,410 | $ | — | ||||||||
|
Mutual Fund
|
29,378 | 29,378 | — | — | ||||||||||||
|
International Equity Securities
|
||||||||||||||||
|
Mutual Funds
|
68,374 | 33,659 | 34,715 | — | ||||||||||||
|
Total Equity Securities
|
169,162 | 63,037 | 106,125 | — | ||||||||||||
|
Domestic Fixed Income
|
||||||||||||||||
|
Mutual Funds
|
86,587 | 86,587 | — | — | ||||||||||||
|
International Fixed Income
|
||||||||||||||||
|
Debt Securities
|
3,974 | — | 3,974 | — | ||||||||||||
|
Mutual Funds
|
19,739 | — | 19,739 | — | ||||||||||||
|
Total Fixed Income
|
110,300 | 86,587 | 23,713 | — | ||||||||||||
|
Other Investments
|
||||||||||||||||
|
Insurance Contracts
|
14,456 | — | — | 14,456 | ||||||||||||
|
Cash
|
5,458 | 5,458 | — | — | ||||||||||||
|
Real Estate
|
2,556 | — | 2,056 | 500 | ||||||||||||
|
Total Other Investments
|
22,470 | 5,458 | 2,056 | 14,956 | ||||||||||||
|
Total
|
$ | 301,932 | $ | 155,082 | $ | 131,894 | $ | 14,956 | ||||||||
Pension plan investments in corporate stocks and mutual funds are classified as Level 1 investments within the fair value hierarchy, as determined by quoted market prices. Pension plan investments in mutual funds that are not exchange-traded, and commingled trusts, and certain other investments are classified as Level 2 investments within the fair value hierarchy. These investments are valued at net asset value based on the underlying securities, as determined by the sponsor. Level 3 investments are primarily related to insurance contracts required in certain foreign-based plans. The fair value is determined based on the expected benefits to be paid under the contract, discounted at a rate consistent with the related benefit obligation. There were no transfers between levels for all periods presented.
Investment securities, in general, are exposed to various risks such as interest rate, credit and overall market volatility. Due to the level of risk associated with certain investment securities, it is reasonably possible that changes in the values of investment securities will occur in the near term and that such changes could materially affect the amounts reported. The valuation methods previously described above may produce a fair value calculation that may not be indicative of net realized value or reflective of future fair values.
| 44 |
The following table provides a reconciliation of the beginning and ending balances of pension assets measured at fair value that used significant unobservable inputs (Level 3):
|
Total
|
U.S.
|
Non-U.S.
|
||||||||||
|
Balance, October 26, 2012
|
$ | 12,970 | $ | 585 | $ | 12,385 | ||||||
|
Actual return on plan assets Relating to assets still held at reporting date
|
212 | (85 | ) | 297 | ||||||||
|
Purchases
|
1,215 | — | 1,215 | |||||||||
|
Settlements
|
(97 | ) | — | (97 | ) | |||||||
|
Transfers in and/or out of Level 3
|
— | — | — | |||||||||
|
Currency impact
|
656 | — | 656 | |||||||||
|
Balance, October 25, 2013
|
$ | 14,956 | $ | 500 | $ | 14,456 | ||||||
|
Actual return on plan assets Relating to assets still held at reporting date
|
5,841 | — | 5,841 | |||||||||
|
Purchases
|
1,428 | — | 1,428 | |||||||||
|
Settlements
|
(111 | ) | — | (111 | ) | |||||||
|
Transfers in and/or out of Level 3
|
— | — | — | |||||||||
|
Currency impact
|
(1,340 | ) | — | (1,340 | ) | |||||||
|
Balance, October 31, 2014
|
$ | 20,774 | $ | 500 | $ | 20,274 | ||||||
Estimated Future Benefits: The following benefit payments, which reflect expected future service, as appropriate, are expected to be paid as follows:
|
Post-retirement
|
||||||||
|
Pension
|
Medical
|
|||||||
|
2015
|
$ | 15,454 | $ | 975 | ||||
|
2016
|
15,365 | 908 | ||||||
|
2017
|
15,661 | 828 | ||||||
|
2018
|
16,120 | 633 | ||||||
|
2019
|
16,899 | 519 | ||||||
|
2020 – 2024
|
91,774 | 2,496 | ||||||
|
Total
|
$ | 171,273 | $ | 6,359 | ||||
NOTE 12 – INCOME TAXES
Income (loss) before income taxes consisted of the following:
|
2014
|
2013
|
2012
|
||||||||||
|
Domestic
|
$ | 349,174 | $ | 331,482 | $ | 265,681 | ||||||
|
Foreign
|
142,708 | 92,313 | 151,543 | |||||||||
|
Total Income (Loss) Before Income Taxes
|
$ | 491,882 | $ | 423,795 | $ | 417,224 | ||||||
Significant components of the provision for income taxes are as follows:
|
2014
|
2013
|
2012
|
||||||||||
|
Current
|
||||||||||||
|
Federal
|
$ | 86,698 | $ | 101,169 | $ | 66,957 | ||||||
|
State
|
9,908 | 14,084 | 7,696 | |||||||||
|
Foreign
|
51,982 | 32,027 | 37,753 | |||||||||
|
Total Current
|
148,588 | 147,280 | 112,406 | |||||||||
|
Deferred
|
||||||||||||
|
Federal
|
20,166 | (6,160 | ) | 15,927 | ||||||||
|
State
|
436 | (6,921 | ) | 2,230 | ||||||||
|
Foreign
|
(22,709 | ) | 341 | (5,836 | ) | |||||||
|
Total Deferred
|
(2,107 | ) | (12,740 | ) | 12,321 | |||||||
|
Total Income Taxes
|
$ | 146,481 | $ | 134,540 | $ | 124,727 | ||||||
Significant components of our deferred tax assets and liabilities are as follows:
|
2014
|
2013
|
|||||||
|
Deferred tax assets
|
||||||||
|
Insurance reserves
|
$ | 7,800 | $ | 9,345 | ||||
|
Compensation
|
45,104 | 40,442 | ||||||
|
Deferred revenue
|
12,401 | 11,077 | ||||||
|
Pension
|
8,880 | 2,288 | ||||||
|
Accrued expenses
|
25,750 | 32,750 | ||||||
|
Tax credits and carryforwards
|
17,097 | 29,191 | ||||||
|
Other
|
11,672 | 9,009 | ||||||
| 128,704 | 134,102 | |||||||
|
Less: Valuation Allowance
|
(14,062 | ) | (23,075 | ) | ||||
|
Total Deferred Tax Assets
|
114,642 | 111,027 | ||||||
|
Deferred tax liabilities
|
||||||||
|
Prepaids
|
(19,820 | ) | (4,762 | ) | ||||
|
Tax in excess of book depreciation
|
(29,575 | ) | (45,066 | ) | ||||
|
LIFO
|
(12,631 | ) | (11,796 | ) | ||||
|
Intangible assets
|
(233,776 | ) | (238,359 | ) | ||||
|
Other
|
(3,552 | ) | (5,262 | ) | ||||
|
Total Deferred Tax Liabilities
|
(299,354 | ) | (305,245 | ) | ||||
|
Net Deferred Tax Liabilities
|
$ | (184,712 | ) | $ | (194,218 | ) | ||
We recognize a valuation allowance if, based on the weight of available evidence, it is more likely than not that some portion, or all, of a deferred tax asset will not be realized. The valuation allowances of $14,062, $23,075 and $15,377 at the end of fiscal years 2014, 2013, and 2012, respectively, primarily relate to foreign net operating losses.
Cumulative foreign tax loss carryforwards at the end of fiscal year 2014 were $64,694. Of this amount, $23,849 will be subject to expiration between fiscal year 2016 and fiscal year 2026. The remaining losses of
| 45 |
$40,845 are not subject to expiration. Cumulative foreign tax credits at the end of fiscal year 2014 were $3,300. The majority of these foreign tax credits will be subject to expiration between fiscal year 2020 and fiscal year 2021.
A reconciliation of income tax computed at the U.S. federal statutory tax rate to the effective income tax rate is as follows:
|
2014
|
2013
|
2012
|
||||||||||
|
Tax (benefit) at U.S. statutory rate
|
35.0 | % | 35.0 | % | 35.0 | % | ||||||
|
State income taxes, net of federal benefit
|
1.3 | % | 2.0 | % | 1.3 | % | ||||||
|
Domestic manufacturing activities
|
(1.6 | )% | (2.0 | )% | (1.3 | )% | ||||||
|
Non-U.S. taxes
|
(2.4 | )% | (1.8 | )% | (5.1 | )% | ||||||
|
Valuation allowance
|
(1.8 | )% | 1.8 | % | — | % | ||||||
|
Other
|
(0.7 | )% | (3.3 | )% | — | % | ||||||
|
Total Effective Income Tax Rate
|
29.8 | % | 31.7 | % | 29.9 | % | ||||||
No provision has been made for U.S. federal income taxes on certain undistributed earnings of foreign subsidiaries that we intend to permanently invest or that may be remitted substantially tax-free. The total of undistributed earnings that would be subject to federal income tax if remitted under existing law is approximately $494,670 at October 31, 2014. Determination of the unrecognized deferred tax liability related to these earnings is not practicable because of the complexities with its hypothetical calculation. Upon distribution of these earnings, we will be subject to U.S. taxes and withholding taxes payable to various foreign governments. A credit for foreign taxes already paid would be available to reduce the U.S. tax liability.
We recognize investment tax credits under the “flow-through” method, with the credit reflected as a reduction to income taxes payable and a current income tax benefit in the year realized. Income taxes paid during 2014, 2013, and 2012 were $104,291, $124,530, and $110,124, respectively.
Our income tax returns, like those of most companies, are periodically audited by domestic and foreign tax authorities. These audits include questions regarding our tax filing positions, including the timing and amount of deductions and the allocation of income among various tax jurisdictions. At any one time, multiple tax years are subject to audit by the various tax authorities. We record an accrual for uncertain tax positions after evaluating the positions associated with our various income tax filings. A number of years may elapse before a particular matter for which we have established an accrual is audited and fully resolved or clarified. We adjust our tax contingencies accrual and income tax provision in the period in which matters are effectively settled with tax authorities at amounts different from our established accrual, the statute of limitations expires for the relevant taxing authority to examine the tax position or when more information becomes available.
A reconciliation of the beginning and ending amount of unrecognized tax benefits (excluding interest and penalties) for fiscal year 2011 through 2014 is as follows:
|
Unrecognized tax benefits at October 28, 2011
|
$ | 12,948 | ||
|
Increases in tax positions for prior years
|
159 | |||
|
Decreases in tax positions for prior years
|
(447 | ) | ||
|
Increases in tax positions for current year
|
2,165 | |||
|
Settlements
|
(2,957 | ) | ||
|
Lapse in statute of limitations
|
(1,903 | ) | ||
|
Unrecognized tax benefits at October 26, 2012
|
$ | 9,965 | ||
|
Increases in tax positions for prior years
|
5,265 | |||
|
Decreases in tax positions for prior years
|
(864 | ) | ||
|
Increases in tax positions for current year
|
2,719 | |||
|
Settlements
|
— | |||
|
Lapse in statute of limitations
|
(1,722 | ) | ||
|
Unrecognized tax benefits at October 25, 2013
|
$ | 15,363 | ||
|
Increases in tax positions for prior years
|
3,004 | |||
|
Decreases in tax positions for prior years
|
(217 | ) | ||
|
Increases in tax positions for current year
|
3,029 | |||
|
Settlements
|
— | |||
|
Lapse in statute of limitations
|
(2,413 | ) | ||
|
Unrecognized tax benefits at October 31, 2014
|
$ | 18,766 | ||
We recognize interest and penalties related to unrecognized tax benefits in income tax expense. We had recognized accrued interest and penalties relating to unrecognized tax benefits of $5,380 and $4,461, as of October 31, 2014 and October 25, 2013, respectively. The gross amount of interest expense/(income) and penalties included in tax expense for the year ended October 31, 2014, October 25, 2013, and October 26, 2012 was $61, $(422), and $(2,038), respectively.
The total amount of unrecognized tax benefits that would affect our effective tax rate if recognized was $18,169, $14,485, and $8,718 as of October 31, 2014, October 25, 2013, and October 26, 2012, respectively.
The company and its subsidiaries file income tax returns in the U.S. federal jurisdiction, and numerous state and foreign jurisdictions. With few exceptions, we are no longer subject to U.S. federal, state and local, or non-U.S. income tax examinations by tax authorities for years before 2009. The Internal Revenue Service (IRS) has commenced an audit of our fiscal year 2010 U.S. federal amended tax return, along with our fiscal year 2013 U.S. federal tax return. Fieldwork will begin in the first quarter of fiscal year 2015. The previous IRS examination of the U.S. federal tax returns for fiscal years ended 2009 and 2010 was concluded in October 2012, and resulted in no material adjustments to our income tax expense or balance of unrecognized tax benefits. We are currently under audit in several state and foreign jurisdictions. We also expect various statutes of limitation to expire during the next 12 months. Due to the uncertain response of taxing authorities, a range of outcomes cannot be reasonably estimated at this time.
| 46 |
NOTE 13 – NET INCOME (LOSS) PER COMMON SHARE
The following table presents the net income (loss) per common share calculations for the three most recent fiscal years:
|
2014
|
2013
|
2012
|
||||||||||
|
Basic
|
||||||||||||
|
Net income (loss)
|
$ | 345,401 | $ | 289,255 | $ | 292,497 | ||||||
|
Weighted-average common shares outstanding – basic
|
83,710,111 | 87,793,543 | 91,415,055 | |||||||||
|
Net Income (Loss) per Common Share – Basic
|
$ | 4.13 | $ | 3.29 | $ | 3.20 | ||||||
|
Diluted
|
||||||||||||
|
Net income (loss)
|
$ | 345,401 | $ | 289,255 | $ | 292,497 | ||||||
|
Weighted-average common shares outstanding – basic
|
83,710,111 | 87,793,543 | 91,415,055 | |||||||||
|
Dilutive effect of stock options and unvested restricted stock
|
2,335,946 | 2,732,742 | 2,965,421 | |||||||||
|
Equivalent average common shares outstanding – diluted
|
86,046,057 | 90,526,285 | 94,380,476 | |||||||||
|
Net Income (Loss) per Common Share – Diluted
|
$ | 4.01 | $ | 3.20 | $ | 3.10 | ||||||
Basic earnings per share are based on the weighted-average number of common shares outstanding during each period. In computing diluted earnings per share, the number of common shares outstanding is increased by common stock options with exercise prices lower than the average market prices of common shares during each period and reduced by the number of shares assumed to have been purchased with proceeds from the exercised options. Potential common shares of 209,523, 284,663, and 67,411 related to our outstanding stock options were excluded from the computation of diluted earnings per share for 2014, 2013, and 2012, respectively, as inclusion of these shares would have been antidilutive.
NOTE 14 – ACCUMULATED OTHER COMPREHENSIVE INCOME (LOSS)
Accumulated other comprehensive income (loss), net of tax, consists of the following:
|
Foreign Currency
Translation |
Benefit
Obligations |
Financial
Instruments |
Accumulated
Other Comprehensive Income (Loss) |
|||||||||||||
|
Balance, October 28, 2011
|
$ | 152,791 | $ | (84,432 | ) | $ | (5,580 | ) | $ | 62,779 | ||||||
|
Other comprehensive income (loss), net of tax
|
6,819 | (14,975 | ) | (4,351 | ) | (12,507 | ) | |||||||||
|
Balance, October 26, 2012
|
159,610 | (99,407 | ) | (9,931 | ) | 50,272 | ||||||||||
|
Other comprehensive income (loss), net of tax
|
(26,007 | ) | 28,467 | 687 | 3,147 | |||||||||||
|
Balance, October 25, 2013
|
133,603 | (70,940 | ) | (9,244 | ) | 53,419 | ||||||||||
|
Other comprehensive income before reclassifications
|
(62,783 | ) | — | 337 | (62,446 | ) | ||||||||||
|
Amounts reclassified from accumulated other comprehensive income
|
— | (11,462 | ) | 819 | (10,643 | ) | ||||||||||
|
Balance, October 31, 2014
|
$ | 70,820 | $ | (82,402 | ) | $ | (8,088 | ) | $ | (19,670 | ) | |||||
The tax effects of each component of other comprehensive income (loss) are as follows:
|
For the Year Ended
|
October 31, 2014
|
October 25, 2013 |
October 26, 2012
|
|||||||||
|
Foreign Currency Translation
|
$ | (62,783 | ) | $ | (26,007 | ) | $ | 6,819 | ||||
|
Change in Benefit Obligations
|
||||||||||||
|
(Increase)/decrease in net loss
|
(24,201 | ) | 35,612 | (27,049 | ) | |||||||
|
Reclassification for recognition of net loss included in net periodic benefit cost
|
6,559 | 10,046 | 7,336 | |||||||||
|
(Increase)/decrease in net prior service cost
|
128 | (482 | ) | (209 | ) | |||||||
|
Reclassification for amortization of prior service (credit) cost included in net periodic pension cost
|
352 | 320 | 307 | |||||||||
|
Income tax benefit (expense)
|
5,700 | (17,029 | ) | 4,640 | ||||||||
|
Change in Benefit Obligations
|
(11,462 | ) | 28,467 | (14,975 | ) | |||||||
|
Change in Financial Instruments
|
||||||||||||
|
Net unrealized holding gains (losses)
|
337 | (25 | ) | (7,424 | ) | |||||||
|
Reclassification adjustment for net (gains) losses included in net income
|
1,542 | 1,143 | 350 | |||||||||
|
Income tax benefit (expense)
|
(723 | ) | (431 | ) | 2,723 | |||||||
|
Change in Financial Instruments
|
1,156 | 687 | (4,351 | ) | ||||||||
|
Other Comprehensive Income (Loss)
|
$ | (73,089 | ) | $ | 3,147 | $ | (12,507 | ) | ||||
| 47 |
We deem our foreign investments to be permanent in nature and therefore do not provide for taxes on foreign currency translation adjustments.
Amounts related to financial instruments are reclassified from accumulated other comprehensive income (loss) to net income based on the nature of the instrument. Gains and losses on foreign currency contracts are reclassified to other expense (income) in the Consolidated Statement of Operations when the underlying hedged item is realized. Unamortized gains and losses on treasury lock contracts are reclassified ratably to interest expense in our Consolidated Statements of Operations over the term of the related debt. See Note 8 for further information on financial instrument reclassifications.
Amounts related to pension and post-retirement medical adjustments are reclassified from accumulated other comprehensive income (loss) to pension cost, which is allocated to cost of sales and operating expenses based on salaries and wages, approximately as follows (in thousands):
|
2014
|
2013
|
2012
|
||||||||||
|
Cost of Sales
|
$ | 2,656 | $ | 4,056 | $ | 3,056 | ||||||
|
Research and Development
|
964 | 1,352 | 1,039 | |||||||||
|
Selling, General and Administrative
|
3,291 | 4,958 | 3,548 | |||||||||
|
Total Before Income Taxes
|
$ | 6,911 | $ | 10,366 | $ | 7,643 | ||||||
NOTE 15 – SEGMENT INFORMATION
Based on the nature of our products, technology, manufacturing processes, customers and regulatory environment, we aggregate our operating segments into two reportable segments: Coatings and Paints. We are required to report segment information in the same way that management internally organizes its business for assessing performance and making decisions regarding allocation of resources. We evaluate the performance of operating segments and allocate resources based on profit or loss from operations before interest expense and taxes (EBIT).
The Coatings segment aggregates our industrial product lines and packaging product line. Industrial products include a broad range of decorative and protective coatings for metal, wood and plastic. Packaging products include both interior and exterior coatings used in packaging containers, principally metal food containers and beverage cans. The products of this segment are sold throughout the world.
The Paints segment aggregates our consumer paint and automotive refinish product lines. Consumer paint products include interior and exterior decorative paints, stains, primers, varnishes, high performance floor paints and specialty decorative products, such as enamels, aerosols and faux finishes primarily distributed for the do-it-yourself and professional markets in Australia, China, Europe and North America. Automotive refinish products include refinish paints and aerosol spray paints sold through automotive refinish distributors, body shops and automotive supply distributors and retailers in many countries around the world.
Our remaining activities are included in Other and Administrative. These activities include specialty polymers and colorants that are used internally and sold to other coatings manufacturers, as well as related products and furniture protection plans. In the fourth quarter of fiscal year 2012, we exited the gelcoat products market. Also included within Other and Administrative are our corporate administrative expenses. The administrative expenses include expenses not directly allocated to any other reportable segment.
In the following table, sales between segments are recorded at selling prices that are below market prices, generally intended to recover internal costs. Segment EBIT includes income realized on inter-segment sales. Comparative segment data for fiscal years 2014, 2013, and 2012 are as follows:
|
2014
|
2013
|
2012
|
||||||||||
|
Net Sales
|
||||||||||||
|
Coatings
|
$ | 2,511,088 | $ | 2,209,492 | $ | 2,175,687 | ||||||
|
Paints
|
1,786,448 | 1,671,228 | 1,604,599 | |||||||||
|
Other and Administrative
|
402,382 | 377,991 | 380,698 | |||||||||
|
Less Intersegment sales
|
(177,494 | ) | (154,935 | ) | (140,133 | ) | ||||||
|
Total Net Sales
|
$ | 4,522,424 | $ | 4,103,776 | $ | 4,020,851 | ||||||
| 2014 | 2013 | 2012 | ||||||||||
|
EBIT
|
||||||||||||
|
Coatings
|
$ | 389,390 | $ | 329,886 | $ | 356,428 | ||||||
|
Paints
|
192,222 | 168,395 | 159,598 | |||||||||
|
Other and Administrative
|
(24,400 | ) | (9,728 | ) | (31,198 | ) | ||||||
|
Total EBIT
|
557,212 | 488,553 | 484,828 | |||||||||
|
Interest Expense
|
65,330 | 64,758 | 67,604 | |||||||||
|
Income (Loss) before Income Taxes
|
$ | 491,882 | $ | 423,795 | $ | 417,224 | ||||||
| 2014 | 2013 | 2012 | ||||||||||
|
Depreciation and Amortization
|
||||||||||||
|
Coatings
|
$ | 54,039 | $ | 39,705 | $ | 39,166 | ||||||
|
Paints
|
30,676 | 33,825 | 35,220 | |||||||||
|
Other and Administrative
|
16,195 | 14,629 | 19,318 | |||||||||
|
Total Depreciation and Amortization
|
$ | 100,910 | $ | 88,159 | $ | 93,704 | ||||||
| 2014 | 2013 | |||||||||||
|
Identifiable Assets
|
||||||||||||
|
Coatings
|
$ | 2,400,261 | $ | 2,346,701 | ||||||||
|
Paints
|
1,306,805 | 1,309,214 | ||||||||||
|
Other and Administrative1
|
326,885 | 369,594 | ||||||||||
|
Total Identifiable Assets
|
$ | 4,033,951 | $ | 4,025,509 | ||||||||
|
1
|
Includes our consolidated cash and cash equivalent balances and restricted cash.
|
|
2014
|
2013
|
2012
|
||||||||||
|
Capital Expenditures
|
||||||||||||
|
Coatings
|
$ | 47,122 | $ | 46,194 | $ | 52,575 | ||||||
|
Paints
|
42,313 | 32,856 | 20,839 | |||||||||
|
Other and Administrative
|
31,836 | 37,699 | 15,949 | |||||||||
|
Total Capital Expenditures
|
$ | 121,271 | $ | 116,749 | $ | 89,363 | ||||||
It is not practicable to obtain the information needed to disclose revenues attributable to each of our identified product lines within our reportable segments.
Geographic net sales are based on the country from which the customer was billed for the products sold. The United States is the largest country for customer sales. China and Australia are the only countries outside of the United States that represent more than 10% of consolidated sales. Long-lived assets include property, plant and equipment, intangibles and goodwill attributable to each country’s operations. Net sales and long-lived assets by geographic region are as follows:
|
2014
|
2013
|
2012
|
||||||||||
|
Net Sales – External
|
||||||||||||
|
United States
|
$ | 2,425,348 | $ | 2,310,786 | $ | 2,177,694 | ||||||
|
China
|
533,405 | 484,689 | 498,352 | |||||||||
|
Australia
|
341,808 | 356,780 | 411,433 | |||||||||
|
Other Countries
|
1,221,863 | 951,521 | 933,372 | |||||||||
|
Total Net Sales – External
|
$ | 4,522,424 | $ | 4,103,776 | $ | 4,020,851 | ||||||
| 2014 | 2013 | |||||||||||
|
Long-lived Assets
|
||||||||||||
|
United States
|
$ | 1,244,182 | $ | 1,215,784 | ||||||||
|
China
|
414,326 | 412,122 | ||||||||||
|
Australia
|
107,037 | 121,700 | ||||||||||
|
Other Countries
|
597,893 | 637,529 | ||||||||||
|
Total Long-lived Assets
|
$ | 2,363,438 | $ | 2,387,135 | ||||||||
We have one significant customer in the Paints segment whose net sales were 17.3%, 17.9%, and 16.8% of total consolidated net sales in 2014, 2013, and 2012 respectively.
NOTE 16 – LEGAL PROCEEDINGS
Environmental Matters
We are involved in various claims relating to environmental matters at a number of current and former plant sites and waste management sites. We engage or participate in remedial and other environmental compliance activities at certain of these sites. At other sites, we have been named as a potentially responsible party (PRP) under federal and state environmental laws for site remediation. We analyze each individual site, considering the number of parties involved, the level of our potential liability or contribution relative to the other parties, the nature and magnitude of the hazardous wastes involved, the method and extent of remediation, the potential insurance coverage, the estimated legal and consulting expense with respect to each site and the time period over which any costs would likely be incurred. Based on the above analysis, we estimate the clean-up costs and related claims for each site. The estimates are based in part on discussion with other PRPs, governmental agencies and engineering firms.
We accrue appropriate reserves for potential environmental liabilities when the amount of the costs that will be incurred can be reasonably determined. Accruals are reviewed and adjusted as additional information becomes available. While uncertainties exist with respect to the amounts and timing of our ultimate environmental liabilities, management believes it is neither probable nor reasonably possible that such liabilities, individually or in the aggregate, will have a material adverse effect on our financial condition, results of operations or cash flows.
Other Legal Matters
We are involved in a variety of legal claims and proceedings relating to personal injury, product liability, warranties, customer contracts, employment, trade practices, environmental and other legal matters that arise in the normal course of business. These claims and proceedings include cases where we are one of a number of defendants in proceedings alleging that the plaintiffs suffered injuries or contracted diseases from exposure to chemicals or other ingredients used in the production of some of our products or waste disposal. We are also subject to claims related to the performance of our products. We believe these claims and proceedings are in the ordinary course for a business of the type and size in which we are engaged. While we are unable to predict the ultimate outcome of these claims and proceedings, we believe it is neither probable nor reasonably possible that the costs and liabilities of such matters, individually or in the aggregate, will have a material adverse effect on our financial condition, results of operations or cash flows.
NOTE 17 – LEASING ARRANGEMENTS
We have operating lease commitments outstanding at October 31, 2014, for plant and warehouse equipment, office and warehouse space, vehicles and retail stores. The leases have initial periods ranging from one to ten years, with minimum lease payments as follows:
|
Minimum
Lease Payments
|
||||
|
2015
|
$ | 34,324 | ||
|
2016
|
28,248 | |||
|
2017
|
20,583 | |||
|
2018
|
13,099 | |||
|
2019
|
7,672 | |||
|
Thereafter
|
20,458 | |||
|
Total
|
$ | 124,384 | ||
Rent expense for operating leases was $43,348 in 2014, $40,266 in 2013, and $44,167 in 2012.
| 49 |
NOTE 18 – RESTRUCTURING
Fiscal year 2014 and 2013 restructuring initiatives related primarily to initiatives that began in fiscal year 2013, including the following: (i) actions in the Paints segment to consolidate manufacturing and distribution operations following the acquisition of Ace Hardware Corporation’s paint manufacturing business (Ace Paints), ongoing profit improvement plans in Australia, and other actions in Asia, (ii) actions in our Coatings segment to consolidate manufacturing operations in Europe following the acquisition of the Inver Group, and other actions to rationalize manufacturing operations and lower operating expenses, (iii) overall initiatives to improve our global cost structure, including non-manufacturing headcount reductions, and (iv) in the fourth quarter of 2014, we initiated activities to rationalize manufacturing operations in the Coatings segment in the Australia region. These restructuring activities resulted in pre-tax charges of $41,139 and $36,433 in fiscal year 2014 and 2013, respectively. Included in fiscal year 2014 and 2013 restructuring charges were $11,141 and $6,664 in non-cash pre-tax asset impairment charges, respectively. See Note 2 in Notes to Consolidated Financial Statements for further information on our Inver Group and Ace Paints acquisitions.
In fiscal year 2012, we exited the gelcoat products market and consolidated a manufacturing facility in our Paints segment. Our gelcoat product line was categorized in Other and Administrative. During fiscal year 2012, we also completed restructuring initiatives announced in 2011, including certain actions in our Coatings and Paints segments. In our Coatings segment, we rationalized our manufacturing capacity and reduced our overall global headcount, primarily in our wood product line. In our Paints segment, we completed the first phase of actions to improve the profitability of Australia operations, which included facility consolidations in manufacturing and distribution, store rationalization and the reduction of other related costs. These restructuring activities were completed in 2012 and resulted in pre-tax charges of $25,845 in fiscal year 2012. Included in fiscal year 2012 restructuring charges were $11,721 in non-cash pre-tax asset impairment charges.
The total resulting expenses recognized in fiscal year 2014, 2013, and 2012 included severance and employee benefits, asset impairments, professional services and site clean-up. We plan to pay the majority of the current restructuring liabilities within the next twelve months.
The following restructuring charges by segment were recorded in 2014, 2013 and 2012:
|
For the Year Ended October 31, 2014
|
Liability
Beginning
Balance
10/25/2013
|
Expense
|
Payments
and Other
Activity
|
Liability
Ending
Balance
10/31/2014
|
||||||||||||
|
Coatings
|
||||||||||||||||
|
Severance and employee benefits
|
$ | 18,899 | $ | 10,668 | $ | (20,856 | ) | $ | 8,711 | |||||||
|
Asset impairments
|
— | 9,572 | (9,572 | ) | — | |||||||||||
|
Exit costs (consulting/site clean-up)
|
119 | 8,662 | (4,344 | ) | 4,437 | |||||||||||
|
Total Coatings
|
19,018 | 28,902 | (34,772 | ) | 13,148 | |||||||||||
|
Paints
|
||||||||||||||||
|
Severance and employee benefits
|
6,118 | 6,593 | (11,908 | ) | 803 | |||||||||||
|
Asset impairments
|
— | 1,569 | (1,569 | ) | — | |||||||||||
|
Exit costs (consulting/site clean-up)
|
2,196 | 3,772 | (4,067 | ) | 1,901 | |||||||||||
|
Total Paints
|
8,314 | 11,934 | (17,544 | ) | 2,704 | |||||||||||
| Other and Administrative | ||||||||||||||||
|
Severance and employee benefits
|
1,791 | 303 | (1,942 | ) | 152 | |||||||||||
|
Total Other and Administrative
|
1,791 | 303 | (1,942 | ) | 152 | |||||||||||
|
Total
|
$ | 29,123 | $ | 41,139 | $ | (54,258 | ) | $ | 16,004 | |||||||
| 50 |
|
For the Year Ended October 25, 2013
|
Liability
Beginning
Balance
10/26/2012
|
Expense
|
Payments
and Other
Activity
|
Liability
Ending
Balance
10/25/2013
|
||||||||||||
|
Coatings
|
||||||||||||||||
|
Severance and employee benefits
|
$ | 2,234 | $ | 17,772 | $ | (1,107 | ) | $ | 18,899 | |||||||
|
Asset impairments
|
— | 1,565 | (1,565 | ) | — | |||||||||||
|
Exit costs (consulting/site clean-up)
|
390 | 155 | (426 | ) | 119 | |||||||||||
|
Total Coatings
|
2,624 | 19,492 | (3,098 | ) | 19,018 | |||||||||||
|
Paints
|
||||||||||||||||
|
Severance and employee benefits
|
2,104 | 9,470 | (5,456 | ) | 6,118 | |||||||||||
|
Asset impairments
|
— | 5,038 | (5,038 | ) | — | |||||||||||
|
Exit costs (consulting/site clean-up)
|
3,984 | 445 | (2,233 | ) | 2,196 | |||||||||||
|
Total Paints
|
6,088 | 14,953 | (12,727 | ) | 8,314 | |||||||||||
|
Other and Administrative
|
||||||||||||||||
|
Severance and employee benefits
|
297 | 1,779 | (285 | ) | 1,791 | |||||||||||
|
Asset impairments
|
— | 61 | (61 | ) | — | |||||||||||
|
Exit costs (consulting/site clean-up)
|
— | 148 | (148 | ) | — | |||||||||||
|
Total Other and Administrative
|
297 | 1,988 | (494 | ) | 1,791 | |||||||||||
|
Total
|
$ | 9,009 | $ | 36,433 | $ | (16,319 | ) | $ | 29,123 | |||||||
|
For the Year Ended October 26, 2012
|
Liability
Beginning
Balance
10/28/2011
|
Expense
|
Payments
and Other
Activity
|
Liability
Ending
Balance
10/26/2012
|
||||||||||||
|
Coatings
|
||||||||||||||||
|
Severance and employee benefits
|
$ | 3,884 | $ | 545 | $ | (2,195 | ) | $ | 2,234 | |||||||
|
Asset impairments
|
— | 658 | (658 | ) | — | |||||||||||
|
Exit costs (consulting/site clean-up)
|
2,802 | 215 | (2,627 | ) | 390 | |||||||||||
|
Total Coatings
|
6,686 | 1,418 | (5,480 | ) | 2,624 | |||||||||||
|
Paints
|
||||||||||||||||
|
Severance and employee benefits
|
2,915 | 5,544 | (6,355 | ) | 2,104 | |||||||||||
|
Asset impairments
|
— | 7,447 | (7,447 | ) | — | |||||||||||
|
Exit costs (consulting/site clean-up)
|
408 | 5,401 | (1,825 | ) | 3,984 | |||||||||||
|
Total Paints
|
3,323 | 18,392 | (15,627 | ) | 6,088 | |||||||||||
|
Other and Administrative
|
||||||||||||||||
|
Severance and employee benefits
|
437 | 1,551 | (1,691 | ) | 297 | |||||||||||
|
Asset impairments
|
— | 3,616 | (3,616 | ) | — | |||||||||||
|
Exit costs (consulting/site clean-up)
|
— | 868 | (868 | ) | — | |||||||||||
|
Total Other and Administrative
|
437 | 6,035 | (6,175 | ) | 297 | |||||||||||
|
Total
|
$ | 10,446 | $ | 25,845 | $ | (27,282 | ) | $ | 9,009 | |||||||
The ending liability balance at October 31, 2014, October 25, 2013, and October 26, 2012 is included in other accrued liabilities and other long-term liabilities on our Consolidated Balance Sheets. For 2014, $28,471 was charged to cost of sales, $2,247 was recorded to research and development (R&D) expenses and $10,421 was charged to selling, general and administrative (SG&A) expenses. For 2013, $21,916 was charged to cost of sales, $5,524 was recorded to R&D expenses and $8,993 was charged to SG&A expenses. For 2012, $16,199 was charged to cost of sales, $243 was recorded to R&D expenses and $9,403 was charged to SG&A expenses. The restructuring reserve balances presented are considered adequate to cover committed restructuring actions.
| 51 |
NOTE 19 – QUARTERLY RESULTS OF OPERATIONS (UNAUDITED)
The following is a tabulation of the unaudited quarterly results for the years ended October 31, 2014 and October 25, 2013:
|
Net Sales
|
Gross
Profit
|
Net Income
(Loss)
|
Net Income
(Loss) per
Common
Share –
Basic
|
Net Income
(Loss) per
Common
Share –
Diluted
|
||||||||||||||||
|
2014 Quarter Ended
|
||||||||||||||||||||
|
January 24
|
$ | 956,119 | $ | 319,053 | $ | 53,553 | $ | 0.63 | $ | 0.61 | ||||||||||
|
April 25
|
1,130,178 | 380,758 | 85,959 | 1.02 | 0.99 | |||||||||||||||
|
July 25
|
1,203,062 | 416,692 | 97,833 | 1.18 | 1.14 | |||||||||||||||
|
October 31
|
1,233,065 | 422,543 | 108,056 | 1.31 | 1.28 | |||||||||||||||
| $ | 4,522,424 | $ | 1,539,046 | $ | 345,401 | $ | 4.13 | $ | 4.01 | |||||||||||
|
2013 Quarter Ended
|
||||||||||||||||||||
|
January 25
|
$ | 875,242 | $ | 294,351 | $ | 55,029 | $ | 0.62 | $ | 0.60 | ||||||||||
|
April 26
|
1,031,219 | 338,553 | 76,908 | 0.87 | 0.84 | |||||||||||||||
|
July 26
|
1,089,013 | 369,361 | 93,808 | 1.08 | 1.04 | |||||||||||||||
|
October 25
|
1,108,302 | 355,793 | 63,510 | 0.74 | 0.72 | |||||||||||||||
| $ | 4,103,776 | $ | 1,358,058 | $ | 289,255 | $ | 3.29 | $ | 3.20 | |||||||||||
The quarters will not sum to the fiscal year amount due to rounding and the effect of weighting.
NOTE 20 – RECENTLY ISSUED ACCOUNTING STANDARDS
In May 2014, the Financial Accounting Standards Board (“FASB”) issued revised guidance on revenue recognition. The standard provides a single revenue recognition model which is intended to improve comparability over a range of industries, companies and geographical boundaries and to enhance disclosures. The guidance is effective for fiscal years, and interim periods within those years, beginning after December 15, 2016, which means the first quarter of our fiscal year 2018, and either full retrospective adoption or modified retrospective adoption is permitted. We are currently reviewing the revised guidance and assessing the potential impact on our consolidated financial statements.
In April 2014, the FASB issued guidance that changes the criteria for determining which disposals can be presented as discontinued operations and modifies related disclosure requirements. Under the new guidance, a discontinued operation is defined as a component or group of components that is disposed of or is classified as held for sale and represents a strategic shift that has or will have a major effect on an entity’s operations and financial results. The change is effective for fiscal years, and interim reporting periods within those years, beginning on or after December 15, 2014, which means the first quarter of our fiscal year 2016, with early adoption permitted. The guidance applies prospectively to new disposals and new classifications of disposal groups as held for sale after the effective date. This new guidance will not affect our consolidated financial position, results of operations or cash flows.
In July 2013, the Financial Accounting Standards Board (“FASB”) issued guidance on classification of an unrecognized tax benefit. An unrecognized tax benefit should be presented as a reduction of a deferred tax asset for a net operating loss carry-forward or other tax credit carry-forward when settlement in this manner is available under the tax law. The change is effective for fiscal years, and interim periods within those years, beginning after December 15, 2013, which means the first quarter of our fiscal year 2015, and is to be applied prospectively. We do not expect the adoption of this accounting guidance to have an effect on our consolidated financial statements.
In March 2013, the FASB issued guidance on a parent’s accounting for the cumulative translation adjustment (CTA) under certain circumstances. The new guidance requires a transfer from CTA into net income when a parent either sells a part or all of its investment in a foreign entity, or no longer holds a controlling financial interest in a subsidiary or group of assets that is a business. This update aims to resolve diversity in practice in accounting for the CTA transfer into net income. The change is effective for fiscal years, and interim reporting periods within those years, beginning after December 15, 2013, which means the first quarter of our fiscal year 2015, and is to be applied prospectively. We do not expect the adoption of these updated disclosure requirements to have an effect on our consolidated results of operations, financial condition or liquidity.
We have determined that all other recently issued accounting standards will not have a material impact on our consolidated financial statements or do not apply to our operations.
| 52 |
None.
Disclosure controls and procedures (as defined in Exchange Act Rules 13a-15(e) and 15d-15(e)) are our controls and other procedures that are designed to ensure that information required to be disclosed by us in the reports that we file or submit under the Exchange Act is recorded, processed, summarized and reported within the time periods specified in the Securities and Exchange Commission’s rules and forms. Disclosure controls and procedures include, without limitation, controls and procedures designed to ensure that information required to be disclosed by us in the reports that we file or submit under the Exchange Act is accumulated and communicated to our management, including our Chief Executive Officer and Chief Financial Officer, as appropriate, to allow timely decisions regarding required disclosure.
Evaluation of Disclosure Controls and Procedures
We have evaluated the effectiveness of the design and operation of our disclosure controls and procedures as of October 31, 2014. Based on that evaluation, the Chief Executive Officer and Chief Financial Officer concluded that our disclosure controls and procedures are effective.
Changes in Internal Controls
The report of Management on Internal Control over Financial Reporting is set forth on page 24.
The Report of the Independent Registered Public Accounting Firm on Internal Control over Financial Reporting is set forth on page 25.
There were no changes in our internal control over financial reporting during the quarter ended October 31, 2014 that have materially affected, or are reasonably likely to materially affect, our internal control over financial reporting.
Not applicable.
The information in the sections titled “Election of Directors,” “Section 16(a) Beneficial Ownership Reporting Compliance” and “Corporate Governance” in the Proxy Statement is incorporated herein by reference. The information regarding executive officers is set forth in Part I of this report.
The information in the sections titled “Compensation Committee Report” and “Executive and Director Compensation” in the Proxy Statement is incorporated herein by reference.
|
SECURITY OWNERSHIP OF CERTAIN BENEFICIAL OWNERS AND MANAGEMENT AND RELATED STOCKHOLDER MATTERS
|
The information in the sections titled “Share Ownership of Certain Beneficial Owners” and “Share Ownership of Management” in the Proxy Statement is incorporated herein by reference.
EQUITY COMPENSATION PLANS
|
Number of Securities
|
Weighted-Average
|
Number of Securities
|
||||||||||
|
to be Issued Upon
|
Exercise Price of
|
Remaining Available
|
||||||||||
|
Exercise of
|
Outstanding
|
for Future Issuance
|
||||||||||
|
Outstanding Options,
|
Options, Warrants
|
Under Equity
|
||||||||||
|
Plan Category
|
Warrants and Rights
|
and Rights
|
Compensation Plans1
|
|||||||||
|
Equity Compensation Plans Approved by Security Holders
|
5,242,240 | $ | 35.15 | 1,826,739 | ||||||||
|
Equity Compensation Plans Not Approved by Security Holders
|
None
|
None
|
None
|
|||||||||
|
Total
|
5,242,240 | $ | 35.15 | 1,826,739 | ||||||||
|
1
|
The number of securities remaining available for future issuance under equity compensation plans consists of shares issuable under outstanding stock options under The Valspar Corporation 1991 Stock Option Plan and The Valspar Corporation Stock Option Plan for Non-Employee Directors. In December 2008, the Board of Directors approved the 2009 Omnibus Equity Plan, which was approved by the stockholders in February 2009. The 2009 Omnibus Equity Plan replaced other equity compensation plans for future grants.
|
The information in the sections titled “Corporate Governance – Director Independence” and “Certain Relationships and Related Transactions” in the Proxy Statement is incorporated herein by reference.
The information in the sections titled “Audit Fee Information” and “Pre-Approval of Services by Independent Auditors” in the Proxy Statement is incorporated herein by reference.
| 53 |
|
(a)
|
Documents filed as part of this report.
|
|
(1)
|
Financial Statements
|
|
Page
|
||
|
24
|
||
|
25
|
||
|
26
|
||
|
27
|
||
|
28
|
||
|
29
|
||
|
30
|
||
|
31
|
||
|
32–52
|
||
|
52
|
|
(2)
|
Financial Statement Schedules
|
|
Schedule II – Valuation and Qualifying Accounts and Reserves can be found on page 57.
|
|
|
All other schedules for which provision is made in the applicable accounting regulations of the Securities and Exchange Commission are not required under the related instructions or are inapplicable and therefore have been omitted.
|
|
|
(3)
|
Exhibits
|
|
Exhibit
Number
|
Description
|
||
|
3.1
|
Certificate of Incorporation – as amended to and including June 30, 1970, with further amendments to Article Four dated February 29, 1984, February 25, 1986, February 26, 1992, February 26, 1997 and May 22, 2003 and to Article Eleven dated February 25, 1987 (incorporated by reference to Form 10-K for the period ended October 31, 1997, amendment filed with Form 10-Q for the quarter ended April 25, 2003)
|
||
|
3.2
|
By-Laws – as amended and restated, effective August 19, 2009 (incorporated by reference to Form 10-Q for the quarter ended July 31, 2009)
|
||
|
4.1
|
Indenture dated April 24, 2002, between the Registrant and Bank One Trust Company, N.A., as Trustee, relating to Registrant’s 6% Notes due 2007 (The Bank of New York Trust Company, N.A. is the successor in interest to Bank One) (incorporated by reference to Form 10-K for the period ended October 25, 2002, amendment filed with Form 10-Q for the quarter ended April 30, 2004)
|
||
|
4.2
|
Second Supplemental Indenture, dated as of April 17, 2007, to indenture dated as of April 24, 2002, between the Registrant and The Bank of New York Trust Company, N.A. relating to the Registrant’s 5.625% Notes due 2012 and 6.050% Notes due 2017 (incorporated by reference to Exhibit 4.2 to Form 8-K filed on April 18, 2007)
|
||
|
4.3
|
Indenture dated July 15, 2005 between the Registrant and The Bank of New York Trust Company, N.A., as Trustee, relating to the Company’s 5.100% Notes due 2015, including form of Registrant’s 5.100% Notes due 2015 (incorporated by reference to Form 8-K filed on July 18, 2005)
|
||
|
4.4
|
Third Supplemental Indenture, between the Registrant and U.S. Bank, National Association, as Trustee, dated June 19, 2009, to Indenture dated April 24, 2002, between the Registrant and The Bank of New York Trust Company, N.A. relating to the Registrant’s 7.250% Notes due 2019 (incorporated by reference to Form 8-K filed on June 23, 2009)
|
||
|
4.5
|
Fourth Supplemental Indenture, between the Registrant and U.S. Bank, National Association, as Series Trustee, and The Bank of New York Mellon Trust Company, N.A., as Original Trustee, dated January 13, 2012, to Indenture dated April 24, 2002, between the Registrant and The Bank of New York Mellon Trust Company, N.A. relating to the Registrant’s 4.200% Notes due 2022 (incorporated by reference to Form 8-K filed on January 17, 2012)
|
||
|
10.1
|
The Valspar Corporation Key Employees’ Supplementary Retirement Plan, restated effective October 15, 2008 (incorporated by reference to Form 10-K for the period ended October 31, 2008)*
|
||
|
10.2
|
The Valspar Corporation 1991 Stock Option Plan – as amended through August 21, 2007 (incorporated by reference to Form 10-K for the period ended October 31, 2008)*
|
||
|
10.3
|
The
Valspar Corporation Key Employee Annual Bonus and Long-term Incentive Plan, as amended and restated on September 30, 2014
(incorporated by reference to Form 8-K filed on October 6, 2014)*
|
||
| 54 |
|
Exhibit
Number
|
Description
|
||
|
10.4
|
The Valspar Corporation Stock Option Plan for Non-Employee Directors – as amended through October 17, 2007 (incorporated by reference to Form 10-K for the period ended October 31, 2008)*
|
||
|
10.5
|
Form of Change in Control Employment Agreement between the Registrant and the Registrant’s Named Executives – as amended through December 10, 2008 (incorporated by reference to Form 10-K for the period ended October 31, 2008)*
|
||
|
10.6
|
Form of Nonstatutory Stock Option Agreement for Officers under the Corporation’s 1991 Stock Option Plan – as amended August 21, 2007 (incorporated by reference to Form 10-K for the period ended October 31, 2008)*
|
||
|
10.7
|
Amended
and Restated Credit Agreement dated as of December 16, 2013, by and among the registrant, certain subsidiaries of
the registrant, Wells Fargo Bank, National Association, as administrative agent for the lenders and an issuing bank and
lender, Bank of America, N.A., as syndication agent and an issuing bank and lender, and certain other lenders
(incorporated by reference to Form 8-K filed on December 18, 2013)
|
||
|
10.8
|
Form of Stock Option Granted to Non-Employee Directors – as amended October 17, 2007 (incorporated by reference to Form 10-K for the period ended October 31, 2008)*
|
||
|
10.9
|
Form of Stock Option Granted to Certain Executive Officers (incorporated by reference to Form 10-Q for the quarter ended April 28, 2006)*
|
||
|
10.10
|
The Valspar Corporation 2009 Omnibus Equity Plan (as amended through February 15, 2012) (incorporated by reference to Form 10-Q for the quarter ended April 27, 2012)*
|
||
|
10.11
|
Amendment to The Valspar Corporation 2009 Omnibus Equity Plan (incorporated by reference to Form 8-K filed on October 6, 2014)*
|
||
|
10.12
|
Form of Indemnification Letter Agreement to Non-Employee Directors and Certain Executive Officers (incorporated by reference to Form 10-Q for the quarter ended January 30, 2009)*
|
||
|
10.13
|
Term Sheet for Compensation Program for Non-Employee Directors (incorporated by reference to Form 8-K filed on October 23, 2009)*
|
||
|
10.14
|
Letter Agreement between Registrant and Gary E. Hendrickson dated as of February 17, 2011 (incorporated by reference to Form 10-Q filed for the quarter ended January 28, 2011)*
|
||
|
10.15
|
Confidentiality and Noncompetition Agreement between Registrant and Gary E. Hendrickson dated as of February 17, 2011 (incorporated by reference to Form 10-Q filed for the quarter ended January 28, 2011)
|
||
|
10.16
|
Restricted Stock Unit Agreement between Registrant and Gary E. Hendrickson dated effective as of June 1, 2011 (incorporated by reference to Form 10-Q filed for the quarter ended January 28, 2011)*
|
||
|
10.17
|
Letter Agreement with James L. Muehlbauer dated as of February 11, 2013 (incorporated by reference to Form 8-K filed on March 4, 2013)*
|
||
|
10.18
|
Form of Change in Control Employment Agreement (for executive officers first elected in fiscal 2013) (incorporated by reference to Form 10-Q filed for the quarter ended April 26, 2013)*
|
||
|
10.19
|
Adoption Agreement for The Valspar Corporation Nonqualified Deferred Compensation Plan (incorporated by reference to Form 8-K filed on May 15, 2014)*
|
||
|
10.20
|
The Valspar Corporation Nonqualified Deferred Compensation Plan (incorporated by reference to Form 8-K filed on May 15, 2014)*
|
||
14.1 |
† | Code of Ethics and Business Conduct (incorporated by reference to Form 10-K for the period ended October 29, 2004) | |
21.1 |
** | Subsidiaries of the Registrant | |
23.1 |
** | Consent of Independent Registered Public Accounting Firm – Ernst & Young LLP | |
31.1 |
** | Section 302 Certification of the Chief Executive Officer | |
31.2 |
** | Section 302 Certification of the Chief Financial Officer | |
32.1 |
** | Certification of Chief Executive Officer and Chief Financial Officer Pursuant to 18 U.S.C. §1350, as Adopted Pursuant to Section 906 of the Sarbanes-Oxley Act of 2002 | |
|
101.INS**
|
XBRL Instance Document
|
||
|
101.SCH**
|
XBRL Schema Document
|
||
|
101.CAL**
|
XBRL Calculation Linkbase Document
|
||
|
101.DEF**
|
XBRL Definition Linkbase Document
|
||
|
101.LAB**
|
XBRL Label Linkbase Document
|
||
|
101.PRE**
|
XBRL Presentation Linkbase Document
|
||
*Compensatory plans or arrangements required to be filed pursuant to Item 15(b) of Form 10-K.
**Filed electronically herewith.
†Available at the Registrant’s website at http://www.valsparglobal.com.
Portions of the 2014 Proxy Statement are incorporated herein by reference as set forth in Items 10, 11, 12, 13 and 14 of this report. Only those portions expressly incorporated by reference herein shall be deemed filed with the Commission.
| 55 |
Pursuant to the requirements of Section 13 or 15(d) of the Securities Exchange Act of 1934, the registrant has duly caused this report to be signed on its behalf by the undersigned, thereunto duly authorized.
|
THE VALSPAR CORPORATION
|
|||||
|
/s/ Rolf Engh
|
12/22/14
|
||||
|
Rolf Engh, Secretary
|
Pursuant to the requirements of the Securities Exchange Act of 1934, this report has been signed below by the following persons on behalf of the registrant and in the capacities and on the dates indicated.
|
/s/ Gary E. Hendrickson
|
12/22/14
|
/s/ Jack J. Allen
|
12/22/14
|
|||
|
Gary E. Hendrickson, Chairman and Chief Executive Officer
(principal executive officer) |
Jack J. Allen, Director
|
|||||
|
/s/ John M. Ballbach
|
12/22/14
|
|||||
|
John M. Ballbach, Director
|
||||||
|
/s/ James L. Muehlbauer
|
12/22/14
|
|||||
|
James L. Muehlbauer, Executive Vice President and Chief Financial and Administrative Officer (principal financial officer)
|
||||||
|
/s/ John S. Bode
|
12/22/14
|
|||||
|
John S. Bode, Director
|
||||||
|
/s/ Brenda A. McCormick
|
12/22/14
|
/s/ William M. Cook
|
12/22/14
|
|||
|
Brenda A. McCormick, Vice President and Corporate Controller (principal accounting officer)
|
William M. Cook, Director
|
|||||
|
/s/ Jeffrey H. Curler
|
12/22/14
|
|||||
|
Jeffrey H. Curler, Director
|
||||||
|
/s/ Shane D. Fleming
|
12/22/14
|
|||||
|
Shane D. Fleming, Director
|
||||||
|
/s/ Ian R. Friendly
|
12/22/14
|
|||||
|
Ian R. Friendly, Director
|
||||||
|
/s/ Janel S. Haugarth
|
12/22/14
|
|||||
|
Janel S. Haugarth, Director
|
||||||
|
/s/ Mae C. Jemison
|
12/22/14
|
|||||
|
Mae C. Jemison, Director
|
| 56 |
The Valspar Corporation
Schedule II – Valuation and Qualifying Accounts and Reserves
Changes in the allowance for doubtful accounts were as follows:
|
(dollars in thousands)
|
2014
|
2013
|
2012
|
|||||||||
|
Beginning balance
|
$ | 16,939 | $ | 13,223 | $ | 14,977 | ||||||
|
Amount acquired through acquisitions
|
— | 7,273 | — | |||||||||
|
Bad debt expense
|
(4,512 | ) | 669 | 4,009 | ||||||||
|
Uncollectable accounts written off, net of recoveries
|
(1,842 | ) | (4,226 | ) | (5,763 | ) | ||||||
|
Ending balance
|
$ | 10,585 | $ | 16,939 | $ | 13,223 | ||||||
| 57 |