Attached files
| file | filename |
|---|---|
| 8-K - 8-K - UMB FINANCIAL CORP | d837997d8k.htm |
| EX-2.1 - EX-2.1 - UMB FINANCIAL CORP | d837997dex21.htm |
| EX-99.1 - EX-99.1 - UMB FINANCIAL CORP | d837997dex991.htm |
 Acquisition of Marquette Financial Companies
Strategically Compelling, Financially Attractive
December 15, 2014
UMB Financial Corporation
Exhibit 99.2 |
 Cautionary Notice about Forward-Looking Statements
2
This presentation contains, and our other communications may contain,
forward-looking statements within the meaning of the Private Securities
Litigation Reform Act of 1995. These statements can be identified by the fact that they do not relate strictly
to historical or current facts—such as our statements about accretion to
tangible book value per share or earnings per share, post-closing
capital ratios, cost savings, pro forma ownership, deposit share ranking, and the phase-out of high-cost funding.
Forward-looking
statements
often
use
words
such
as
“believe,”
“expect,”
“anticipate,”
“intend,”
“estimate,”
“project,”
“outlook,”
“forecast,”
“target,”
“trend,”
“plan,”
“goal,”
or other words of comparable meaning or future-tense or conditional verbs such
as “may,”
“will,”
“should,”
“would,”
or “could.”
Forward-looking statements convey our expectations, intentions, or forecasts
about future events, circumstances, results, or aspirations.
All forward-looking statements are subject to assumptions, risks, and
uncertainties, which may change over time and many of which are beyond our
control. You should not rely on any forward-looking statement as a prediction or guarantee about the
future. Our actual future objectives, strategies, plans, prospects, performance,
condition, or results may differ materially from those set forth in any
forward-looking statement. Some of the factors that may cause actual results or other future events,
circumstances, or aspirations to differ from those in forward-looking
statements are described in our Annual Report on Form 10-K
for
the
year
ended
December
31,
2013,
our
subsequent
Quarterly
Reports
on
Form 10-Q or Current Reports on Form 8-
K, or other applicable documents that are filed or furnished with the Securities
and Exchange Commission (SEC). Any forward-looking statement made by us
or on our behalf speaks only as of the date that it was made. We do not
undertake to update any forward-looking statement to reflect the impact of events, circumstances, or results that
arise after the date that the statement was made. You, however, should consult
further disclosures (including disclosures of a forward-looking
nature)
that
we
may
make
in
any
subsequent
Annual
Report
on
Form
10-K, Quarterly Report on Form 10-Q,
Current Report on Form 8-K, or other applicable document that is filed or
furnished with the SEC. |
 Transaction Rationale
Complementary balance sheet combining Marquette Financial Companies’
higher-yielding loans and higher loan-to-deposit ratio with UMB’s
low-cost funding
Enhances UMB’s market share in important Dallas and Phoenix markets
Adds national specialty-lending businesses—asset-based lending and
transportation-focused factoring—and an asset-management
business Expected
to
be
immediately
accretive
to
UMBF
TBV
per
share
at
closing
(1)
Estimated to be accretive to 2016 EPS
Attractively
priced
at
approximately
1.6x
MFC
TBV
(1)
Comprehensive diligence performed
Strong understanding of MFC’s geographies
Compatible banking cultures
Strong post-closing capital ratios anticipated
3
(1)
See pages 13 and 14 for explanation of non-GAAP financial measures. UMBF and
MFC TBV as of 9/30/2014. Pricing based on UMBF 12/12/2014, closing share
price of $53.16. Strategically
Compelling
Strong Transaction
Economics
Low Execution Risk |
 Transaction Overview
Approximately $182.5
million, or 3.4 million shares of UMBF (100% stock
consideration),
subject
to
closing
equity
adjustments
and
fill-or-kill
rights
(1)
Customary regulatory approvals
Mid-2015
1.6x MFC TBV, versus a median of 2.1x for recent
Southwest transactions
(1) (2) (3)
4
(2)
Southwest includes Arizona, Colorado, Louisiana, New Mexico, Oklahoma, Texas &
Utah. 2.1x is the median of transactions since 2011 with target assets between
Approximately $14 million (23% of the past twelve months of MFC
noninterest
expense
at
September
30,
2014)
to
be
phased
in
over
2
years
(4)
$23 million
(3)
See pages 13 and 14 for explanation of non-GAAP financial measures. UMBF and
MFC TBV as of 9/30/2014. (1)
Pricing based on UMBF 12/12/2014, closing share price of $53.16.
(4)
Source: MFC financial reports.
Approximately
7%
of
UMBF
shares
to
be
owned
by
the
Pohlad
family
(1)
Required Approvals
Anticipated Closing
Pro Forma Ownership
Transaction Costs
Cost Savings
Pricing
Consideration
$750mm - $5.0bn and NPAs / Assets <5.0%. Source: SNL
Financial. |
 Overview of Marquette Financial Companies
$1.3 billion in assets, $1.0 billion in loans & leases, $1.0 billion in
deposits Original bank formed 36 years ago in Phoenix
Privately owned by the Pohlad family
Assets under management of $716 million
5 branches and $318 million of loans and $378 million of deposits in Dallas
8 branches and $322 million of loans and $574 million of deposits in Phoenix
Commercially focused, with C&I and owner-occupied CRE comprising 57%
of loans
Middle-market ABL with $230 million in loans outstanding
Factoring business with $102 million in loans outstanding
Attractive risk-adjusted loan yields
Significant deposit and wholesale-funding synergistic opportunities
High loan-to-deposit ratio and net interest margin
Overall
Attractive Community
Banking Franchise
High Quality National
Specialty Lending
Complementary
Balance Sheet
5
Note: Financial data as of 9/30/2014. Source: MFC financial reports and regulatory
filings. |
 Arizona and Texas Franchises
Meridian Bank, N.A.
Meridian Bank Texas
Phoenix
ranked
as
the
3
rd
fastest-growing
large
metro
market in the U.S.
Favorable competitive dynamics to grow UMB model
Will expand UMB branches from 2 to 10
Will add $322 million of in-market loans and $574
million of deposits
Platform for delivering enhanced banking services
Will increase UMB’s FDIC deposit share ranking to 12
from 28
Dallas/Fort Worth ranked as the 4
th
fastest-growing
large metro market in the U.S.
Will expand UMB branches from 2 to 7
Will add $318 million of in-market loans and $378
million of deposits
Will complement existing loan-production team
Will increase UMB’s FDIC deposit share ranking to
41 from 146
6
Note: Financial data as of 9/30/2014. Source: UMBF public filings and MFC
regulatory reports. Maps from SNL Financial. (1)
Source: Forbes’
“America's 20 Fastest-Growing
Cities,”
2/14/2014; ranked on growth in population and jobs, gross metro product
growth, unemployment and median salaries for college-educated
workers. (1)
(1)
UMBF
MFC
: 8 Branches
UMBF
MFC
: 5 Branches |
 Financial Summary
2011
2012
2013
YTD
9/30/14
Gross Loans ($000s)
213,038
185,335
226,840
229,898
Yield on Earning Asset
8.44%
7.66%
7.80%
7.84%
NPAs/Assets
2.11%
1.08%
0.11%
0.21%
NCOs/Average Loans
-0.74%
0.42%
0.06%
0.00%
National Specialty-Lending Businesses
Middle-Market Asset-Based Lending
Factoring Business
$230 million in loans outstanding
ABL providing $1 -
$15 million in credit
Secured lines of credit against A/R, inventory,
machinery and equipment, real estate loans, cash-
flow-supported term loans
7.84%
earning-asset
yield
in
3
rd
quarter
2014
Low historical charge-offs
Key Data
National lender with industry-focused solutions for
transportation businesses
$102 million in loans outstanding
Financing on average $120 million per month
Lines of credit from $0.2 to $15 million
14.40%
earning-asset
yield
in
3
rd
quarter
2014
Low historical charge-offs
Key Data
7
Note: Financial data as of 9/30/2014. Source: MFC financial reports.
Financial Summary
2011
2012
2013
YTD
9/30/14
Gross Loans ($000s)
90,908
101,786
112,107
101,765
Yield on Earning Asset
13.12%
13.13%
13.97%
14.40%
NPAs/Assets
0.55%
0.00%
0.03%
0.17%
NCOs/Average Loans
0.89%
0.04%
-0.08%
0.15% |
 Loan
Composition UMB Financial
MFC
Pro Forma
(1)
MFC Loans by Business Unit
Key Takeaways
Gross Loans: $7.1 billion
Avg. Yield: 3.50%
Gross Loans: $1.0 billion
Avg. Yield: 7.00%
Gross Loans: $8.1 billion
Avg. Yield: 3.92%
Asset-Based
Lending
Arizona Bank
Texas Bank
8
Portfolio exhibiting favorable growth trends
National specialty-lending businesses further diversify and enhance
UMB’s strong commercial-loan portfolio and provide opportunities for
growth across the UMB footprint
Strong yield principally driven by attractive risk-adjusted returns from
ABL and factoring businesses
(1)
Pro forma is defined as 9/30/2014 financials for both UMBF and MFC combined.
Includes no growth projections or purchase-accounting adjustments. Note:
Financial data as of 9/30/2014. Source: UMBF public filings and MFC financial reports and regulatory filings. Avg. yield for 3Q 2014.
33%
33%
24%
10%
C&I
47%
Owner
-
Occupied
CRE
16%
Investor
CRE
6%
1-4 Family
14%
Other
17%
C&I
46%
Owner-
Occupied
CRE
11%
Investor
CRE
15%
1-4 Family
16%
Other
12%
C&I
47%
Owner-
Occupied
CRE
16%
Investor
CRE
5%
1-4 Family
13%
Other
19%
Factoring |
 MFC
UMB
Deposit and Funding Composition
Cost of Funds
Pro Forma
(1)
Total Deposits: $12.8 billion
Avg. Cost of Deposits: 0.10%
Total Deposits: $1.0 billion
Avg. Cost of Deposits: 0.56%
9
Total Deposits: $13.7 billion
Avg. Cost of Deposits: 0.13%
Key Takeaways
MFC average cost of deposits of 0.56%
Offer clients UMB’s enhanced deposit services
High-cost funding expected to be phased out
Credit lines paid off at closing
FHLB borrowing runoff based on maturity schedule
Brokered deposits and jumbo CDs runoff based on
maturity schedule
(1)
Pro forma is defined as 9/30/2014 financials for both UMBF and MFC combined.
Includes no growth projections or purchase-accounting adjustments.
Note:
Financial
data
as
of
9/30/2014.
Source:
UMBF
public
filings
and
MFC
regulatory
filings.
MFC
cost
of
funds
from
SNL
Financial.
Avg.
cost
of
deposits
for
3Q
2014.
0.09%
1.01%
0.17%
UMBF
MFC
Pro Forma
MMDA &
Savings
70%
Transaction
23%
Jumbo CDs
4%
Retail CDs
3%
MMDA &
Savings
42%
Transaction
17%
Jumbo CDs
29%
Retail CDs
12%
MMDA &
Savings
68%
Transaction
22%
Jumbo CDs
6%
Retail CDs
4% |
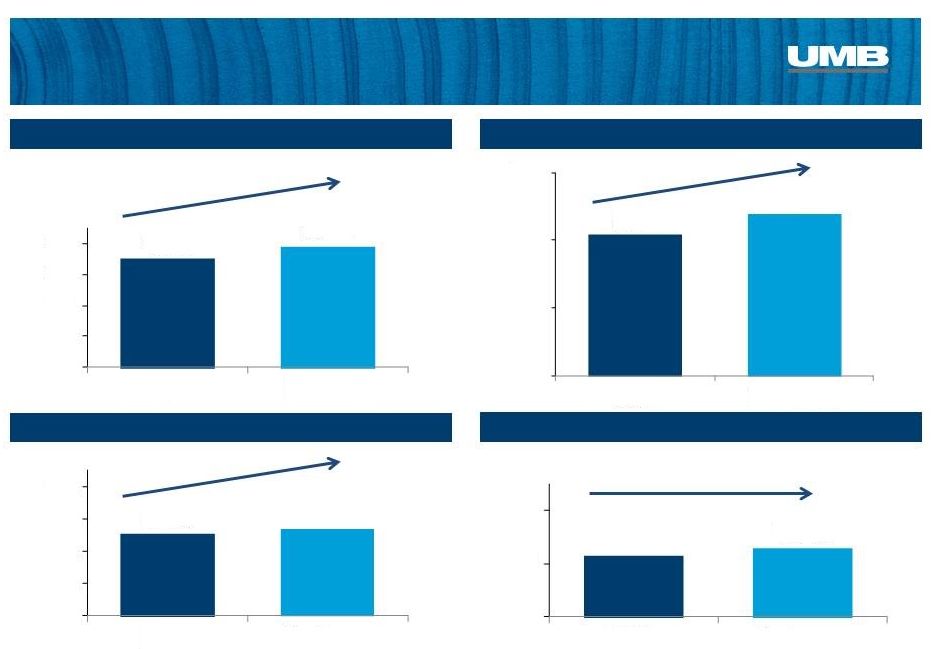 Average Yield on Loans
Key Pro Forma Performance Metrics
Average Loans / Deposits
Nonperforming Loans/Total Loans
Net Interest Margin
10
(1)
Pro forma is defined as 9/30/2014 financials for both UMBF and MFC combined.
Includes no growth projections or purchase-accounting adjustments.
(1)
(1)
(1)
(1)
Note: Financial data as of 9/30/2014. Source: UMBF public filings and MFC
regulatory filings. Avg. yield for 3Q 2014. 3.50%
3.92%
0.0%
1.0%
2.0%
3.0%
4.0%
UMBF
Pro Forma
55.95%
58.86%
35.0%
45.0%
55.0%
65.0%
UMBF
Pro Forma
2.53%
2.70%
0.0%
1.0%
2.0%
3.0%
4.0%
UMBF
Pro Forma
0.46%
0.52%
0.0%
0.4%
0.8%
UMBF
Pro Forma |
 Summary
Strategically Compelling
Financially Attractive
Low Execution Risk
Complementary balance sheet
Enhances share in two important markets
Adds national lending businesses and asset-
management firm
Expected to be accretive to TBV per share
Estimated to be accretive to EPS
Strong understanding of company, business
model, and markets
Similar cultures
11 |
 Appendix
December 15, 2014
UMB Financial Corporation |
 Non-GAAP Reconciliation
13
Tangible Book Value Per Share of UMBF at September 30, 2014
GAAP
Total
Shareholders’
Equity
$1,615,349
Deduct:
Goodwill
and
Other
Intangibles
($256,724)
Tangible
Book
Value
$1,358,625
UMBF
Shares
Outstanding
45,485
Tangible
Book
Value
Per
Share
$29.87
GAAP
Total
Shareholders’
Equity
Per
Share
$35.51
In this presentation, we provide information using the tangible book value (TBV)
per share of UMBF and the TBV of MFC. This information supplements the
results that are reported according to generally accepted accounting
principles (GAAP) and should not be viewed in isolation from, or as a
substitute for, GAAP results. The difference between each of the TBV per share of UMBF and the
TBV of MFC, as applicable on the one hand, and the comparable GAAP measure, on the
other hand, is reconciled in this and the following slide. We believe that
this information and the reconciliations
may
be
useful
to
investors
because
TBV
per
share
and
TBV
are
commonly
used
by
investors as an additional measure of a company’s total value and the strength
and adequacy of its capital-management strategies.
Note: Unaudited. Values in thousands except per share data.
Source: UMBF Public Filings |
 Non-GAAP Reconciliation
Price to MFC Tangible Book Value at September 30, 2014
GAAP
Total
Shareholders’
Equity
$123,681
Deduct: Goodwill and Other Intangibles
($7,658)
Tangible Book Value
$116,023
Total
Expected
Consideration
(1)
$182,522
Price to Tangible Book Value
157%
Price
to
GAAP
Total
Shareholders’
Equity
148%
Note: Unaudited. Values in thousands except per share data.
Source: MFC regulatory filings.
14
(1)
Based on UMBF 12/12/2014 closing share price of $53.16 and consideration of 3.4
million shares of UMBF stock. |
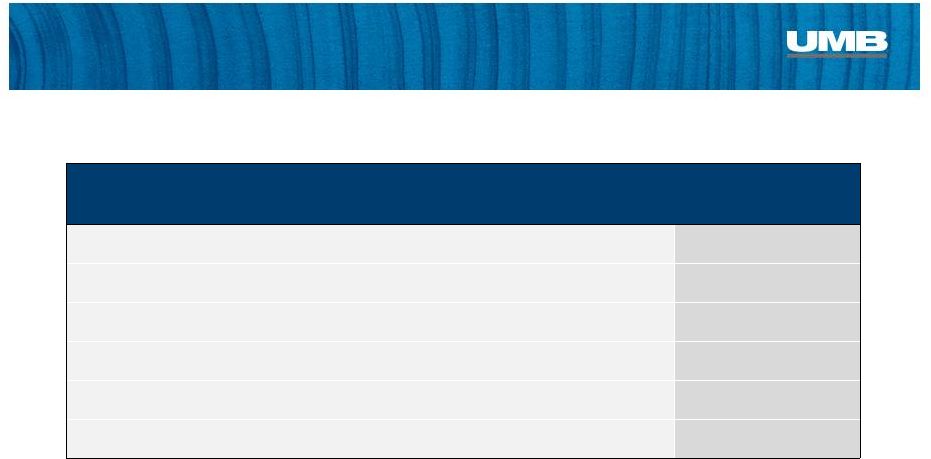
 Estimated Transaction Costs
(1)
Total includes $20.0 million of direct expense and $3.0 million of capitalized
costs. 15
(Dollars in millions)
HR Costs
$7.2
Technology Integration
$6.8
Professional Fees
$3.5
Other Integration Fees
$5.5
Total Estimated Transaction Costs
(1)
$23.0 |