Attached files
| file | filename |
|---|---|
| 8-K - 8-K - O-I Glass, Inc. /DE/ | a14-25935_18k.htm |
Exhibit 99.1
|
|
Bank of America Merrill Lynch 2014 U.S. Basic Materials Conference Owens-Illinois, Inc. December 11, 2014 |

|
|
Safe Harbor Comments Regulation G The information presented here regarding adjusted net earnings relates to net earnings from continuing operations attributable to the Company exclusive of items management considers not representative of ongoing operations and does not conform to U.S. generally accepted accounting principles (GAAP). It should not be construed as an alternative to the reported results determined in accordance with GAAP. Management has included this non-GAAP information to assist in understanding the comparability of results of ongoing operations. Further, the information presented here regarding free cash flow does not conform to GAAP. Management defines free cash flow as cash provided by continuing operating activities less capital spending (both as determined in accordance with GAAP) and has included this non-GAAP information to assist in understanding the comparability of cash flows. Management uses non-GAAP information principally for internal reporting, forecasting, budgeting and calculating compensation payments. Management believes that the non-GAAP presentation allows the board of directors, management, investors and analysts to better understand the Company’s financial performance in relationship to core operating results and the business outlook. Forward Looking Statements This document contains "forward looking" statements within the meaning of Section 21E of the Securities Exchange Act of 1934 and Section 27A of the Securities Act of 1933. Forward looking statements reflect the Company's current expectations and projections about future events at the time, and thus involve uncertainty and risk. The words “believe,” “expect,” “anticipate,” “will,” “could,” “would,” “should,” “may,” “plan,” “estimate,” “intend,” “predict,” “potential,” “continue,” and the negatives of these words and other similar expressions generally identify forward looking statements. It is possible the Company's future financial performance may differ from expectations due to a variety of factors including, but not limited to the following: (1) foreign currency fluctuations relative to the U.S. dollar, specifically the Euro, Brazilian Real and Australian Dollar, (2) changes in capital availability or cost, including interest rate fluctuations and the ability of the Company to refinance debt at favorable terms, (3) the general political, economic and competitive conditions in markets and countries where the Company has operations, including uncertainties related to economic and social conditions, disruptions in capital markets, disruptions in the supply chain, competitive pricing pressures, inflation or deflation, and changes in tax rates and laws, (4) consumer preferences for alternative forms of packaging, (5) cost and availability of raw materials, labor, energy and transportation, (6) the Company’s ability to manage its cost structure, including its success in implementing restructuring plans and achieving cost savings, (7) consolidation among competitors and customers, (8) the ability of the Company to acquire businesses and expand plants, integrate operations of acquired businesses and achieve expected synergies, (9) unanticipated expenditures with respect to environmental, safety and health laws, (10) the Company’s ability to further develop its sales, marketing and product development capabilities, and (11) the timing and occurrence of events which are beyond the control of the Company, including any expropriation of the Company’s operations, floods and other natural disasters, events related to asbestos-related claims, and the other risk factors discussed in the Company’s Annual Report on Form 10-K for the year ended December 31, 2013 and any subsequently filed Annual Report on Form 10-K or Quarterly Report on Form 10-Q. It is not possible to foresee or identify all such factors. Any forward looking statements in this document are based on certain assumptions and analyses made by the Company in light of its experience and perception of historical trends, current conditions, expected future developments, and other factors it believes are appropriate in the circumstances. Forward looking statements are not a guarantee of future performance and actual results or developments may differ materially from expectations. While the Company continually reviews trends and uncertainties affecting the Company's results of operations and financial condition, the Company does not assume any obligation to update or supplement any particular forward looking statements contained in this document. Presentation Note Unless otherwise noted, the information presented in this presentation reflects continuing operations only. 1 |

|
|
O-I: The only truly global glass container franchise #1 position in Europe #1 position in North America #1 position in Oceania #1 position in South America Leading position within SE Asia Foothold in China Emerging markets Mature markets Strong, brand-building partnerships with blue chip companies Leading positions and largest installed capacity 2 |

|
|
Consistent end-market demand trends 3 Europe Stable end markets Exports outperform domestic demand Asia Pacific Sluggish demand in Oceania Mid single-digit growth in China & SEA North America Growth in craft beer, wine, spirits, premium food and non-alcoholic beverages Ongoing decline in megabeer South America Market commitment to refillables favors glass Low single-digit growth in medium term, after strong demand in last four quarters Source: Euromonitor and Company estimates |

|
|
Creating shareholder value O-I’s global presence O-I’s unparalleled expertise Over 100 years of experience Stable end markets Steady glass demand Consumer preference for glass 4 |

|
|
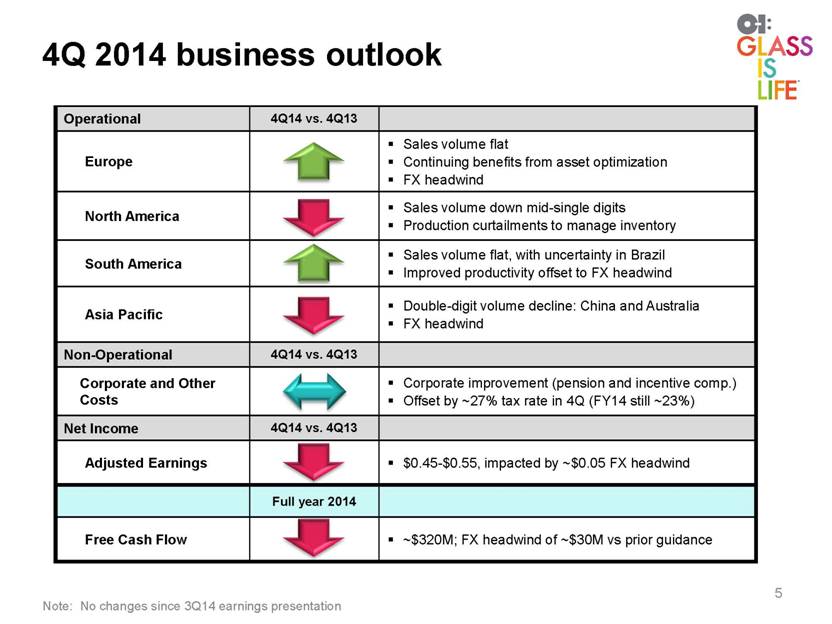
4Q 2014 business outlook 5 Operational 4Q14 vs. 4Q13 Europe Sales volume flat Continuing benefits from asset optimization FX headwind North America Sales volume down mid-single digits Production curtailments to manage inventory South America Sales volume flat, with uncertainty in Brazil Improved productivity offset to FX headwind Asia Pacific Double-digit volume decline: China and Australia FX headwind Non-Operational 4Q14 vs. 4Q13 Corporate and Other Costs Corporate improvement (pension and incentive comp.) Offset by ~27% tax rate in 4Q (FY14 still ~23%) Net Income 4Q14 vs. 4Q13 Adjusted Earnings $0.45-$0.55, impacted by ~$0.05 FX headwind Full year 2014 Free Cash Flow ~$320M; FX headwind of ~$30M vs prior guidance Note: No changes since 3Q14 earnings presentation |
|
|
2015 business outlook 6 2015 YoY segment operating profit on an FX neutral basis* Europe Stable volume Continued savings from asset optimization program North America Stable volume, with more exposure to beer imports Productivity and supply chain improvements South America Volume plateaus against strong comparables Inflation headwinds, particularly in energy Asia Pacific Low single digit volume contraction, pronounced in 1H Improving operating leverage in 2H Segment Operating Profit Underlying operations expected to strengthen in largely stable macros * Assumes average 2014 currency rates. |

|
|
Currency headwinds intensify 7 Dec 2014 FX rates compared with Jan-Nov 2014 rates South America -14% Europe -8% Asia Pacific -8% O-I Total -11% Note the following time periods: Current FX rates as of December 8, 2014 2014 rates are average January – November 2014 At current rates, the strength of USD Generates a ~$50M headwind to segment operating profit on YoY basis |

|
|
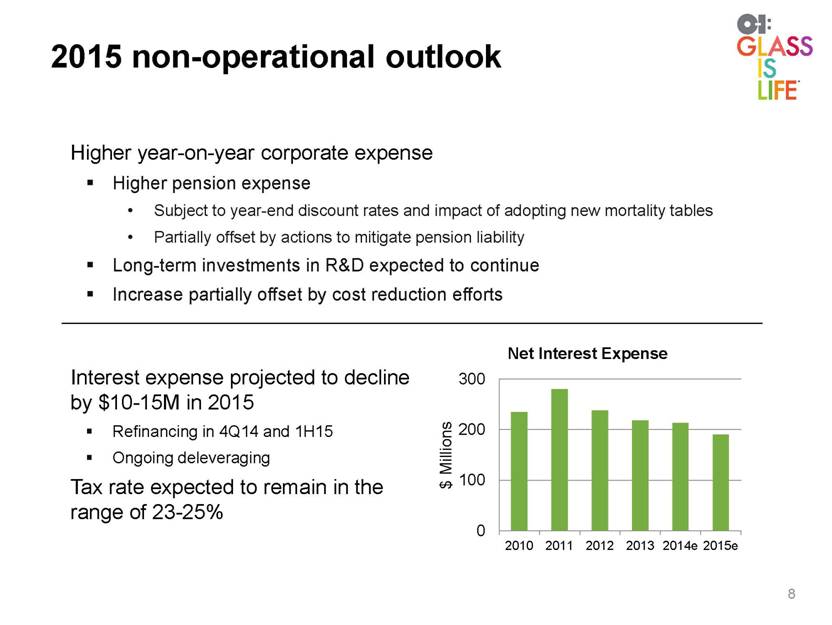
2015 non-operational outlook 8 Higher year-on-year corporate expense Higher pension expense Subject to year-end discount rates and impact of adopting new mortality tables Partially offset by actions to mitigate pension liability Long-term investments in R&D expected to continue Increase partially offset by cost reduction efforts Interest expense projected to decline by $10-15M in 2015 Refinancing in 4Q14 and 1H15 Ongoing deleveraging Tax rate expected to remain in the range of 23-25% |
|
|
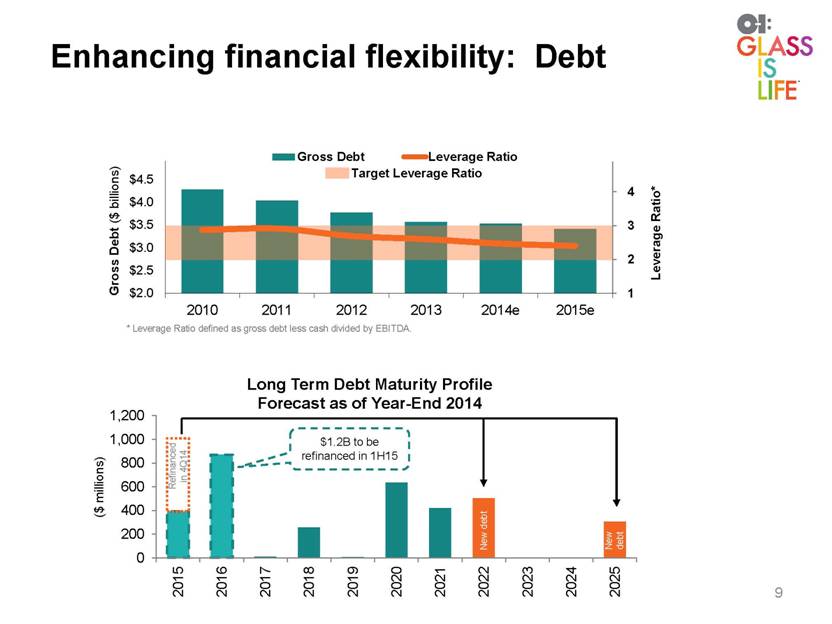
Enhancing financial flexibility: Debt Refinanced in 4Q14 * Leverage Ratio defined as gross debt less cash divided by EBITDA. Target Leverage Ratio New debt New debt 9 |
|
|
Pension expense headwind since 2008 Current pension headwinds sharply contrast with pre-recession era Sustained non cash pension expense1 substantially lowers reported Company financial performance 1 Related to the “amortization of actuarial loss” component of pension expense. 2 Adjusted earnings refers to earnings from continuing operations attributable to the Company, excluding items management does not consider representative of ongoing operations. ~$70M delta $0.50 impact 10 2 2 |

|
|
Enhancing financial flexibility: Pension Manage pension liabilities Reduce benefits and close plans to new hires Convert to defined contribution plans Buy out term vested participants Annuitize Manage pension assets Make discretionary cash contributions Pension liability reduced by ~$750M from actions since 2012 Required contributions down to ~$25M in 2015 Pension Contributions 11 |

|
|
Favorable trends in asbestos payments Outstanding cases down ~80% since 2008 Average age of claimant is >80 years old Payments down ~30% since 2008 12 |

|
|
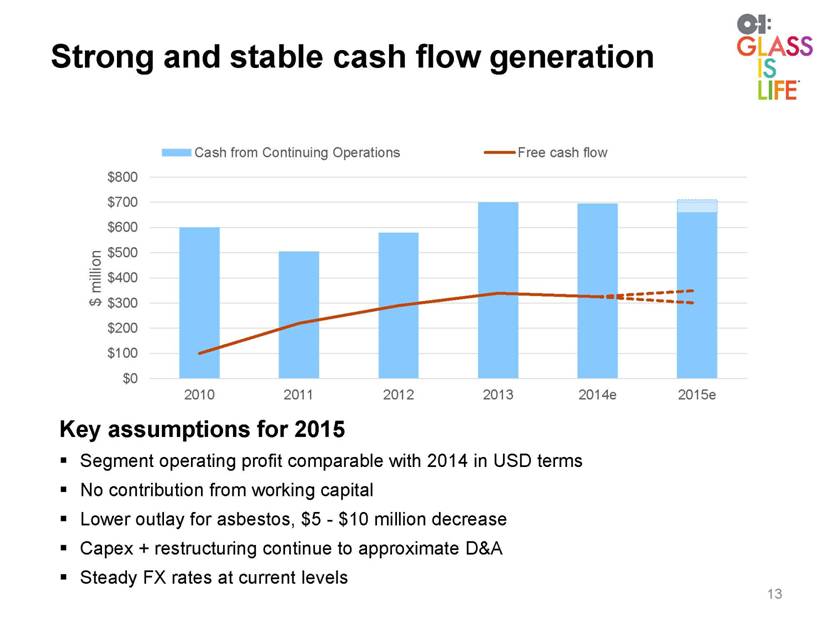
Strong and stable cash flow generation Key assumptions for 2015 Segment operating profit comparable with 2014 in USD terms No contribution from working capital Lower outlay for asbestos, $5 - $10 million decrease Capex + restructuring continue to approximate D&A Steady FX rates at current levels 13 |
|
|
Balanced approach to use of cash 14 • Continue strong operating profit generation • Enhance productivity and flexibility Maintenance • Exceed cost of capital • Greenfield/brownfield (e.g., Brazil furnace in early 2013) • Non-organic growth (e.g., JV with CBI in Mexico) • Invest in technology and innovation Strategic • Improve financial flexibility • Lower interest expense • Manage pension and asbestos liabilities Liabilities • Increase share buybacks • $500M share repurchase program through 2017 • ~$125-$150M in 2015, predominantly in first half Shareholders Capital Investment Capital Allocation |

|
|
Q&A 15 |

|
|
Appendix 16 |

|
|
Reconciliation to Free Cash Flow 17 $ Millions 2013 2012 2011 2010 Cash provided by continuing operating activities 700 $ 580 $ 505 $ 600 $ Additions to property, plant and equipment - continuing (361) (290) (285) (500) Free cash flow 339 $ 290 $ 220 $ 100 $ Year ended December 31 |

|
|
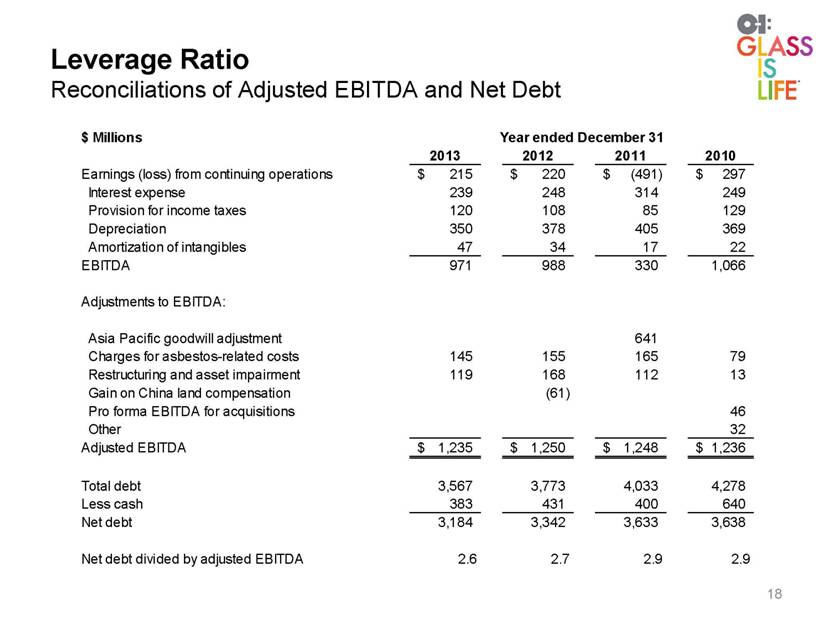
Leverage Ratio Reconciliations of Adjusted EBITDA and Net Debt 18 $ Millions 2013 2012 2011 2010 Earnings (loss) from continuing operations 215 $ 220 $ (491) $ 297 $ Interest expense 239 248 314 249 Provision for income taxes 120 108 85 129 Depreciation 350 378 405 369 Amortization of intangibles 47 34 17 22 EBITDA 971 988 330 1,066 Adjustments to EBITDA: Asia Pacific goodwill adjustment 641 Charges for asbestos-related costs 145 155 165 79 Restructuring and asset impairment 119 168 112 13 Gain on China land compensation (61) Pro forma EBITDA for acquisitions 46 Other 32 Adjusted EBITDA 1,235 $ 1,250 $ 1,248 $ 1,236 $ Total debt 3,567 3,773 4,033 4,278 Less cash 383 431 400 640 Net debt 3,184 3,342 3,633 3,638 Net debt divided by adjusted EBITDA 2.6 2.7 2.9 2.9 Year ended December 31 |