Attached files
| file | filename |
|---|---|
| 8-K - FORM 8-K - BRINKS CO | form_8-k.htm |

Company November 5th 2013 Name Last Name Brink’s EMEA Position in the company The Brink’s Company Investor Overview December 2014 Exhibit 99.1

Forward Looking Statements This presentation, including questions and answers, contains forward-looking information within the meaning of the Private Securities Litigation Reform Act of 1995. Actual results could differ materially from projected results. Additional information regarding factors that could affect financial performance is in our most recent financial results press release, and in our filings with the Securities and Exchange Commission, including our most recent forms 10-K and 10-Q. Unless otherwise noted herein, information included in this presentation is representative as of today only and the company assumes no obligation to update any forward-looking statements. Note: This presentation contains non-GAAP financial figures including segment margin and adjusted earnings per share. All information is based on amounts disclosed and reconciled in the 2013 Annual Report on Form 10-K and the most current Form 10-Q. *

The world’s premier provider of secure transportation and cash management services * 2013 Adjusted Non-GAAP Revenue $3.6B 2013 Adjusted Non-GAAP EPS $1.52 2013 Non-GAAP CFOA $206M Head Count ~65,000 Operations in 42 Countries Company Overview Facilities ~1,000 Revenue ~80% International Vehicles ~13,000 Customers in ~100 Countries See appendix for information regarding reconciling to GAAP

* What We Do 2013 Revenue = $3.6B Adjusted Non-GAAP Armored Transport Cash, coins, checks and other valuables; ATM services Global Infrastructure Supports Global Services and Cash Logistics Cash-in-Transit Global Services Secure long-distance transport of valuables Cash Logistics Money processing Vaulting CompuSafe® Service Adjacencies Payment Services Commercial Security Security Services Guarding in select countries Airports, embassies Lines of Business

2016 Targets * 2016 Non-GAAP Targets (a) 8% segment margin $290 - $330 million segment profit $2.50 - $3.00 EPS How We Get There Fix U.S. and Mexico Rest of world margin +1.0% point Organic revenue growth 5% Operational excellence Global procurement Centralization (a) See appendix for information regarding reconciling to GAAP *

* Non-GAAP 2016 Targets (a) 2013 Non-GAAP results adjusted for Venezuelan results at 50 bolivars per U.S. dollar. See appendix for reconciliations to GAAP and other information. Includes all regional/corporate allocated costs 2016 Target Margin / Potential EPS Growth(a) 2016 Target Margin / Potential EPS Growth(a) 2016 Target Margin / Potential EPS Growth(a) 2016 Target Margin / Potential EPS Growth(a) Segment Op Profit EPS 2013 Actual 2013 Actual $210 $1.52 U.S. at 6% Margin U.S. at 6% Margin $30 $0.34 Mexico at 10% Margin Mexico at 10% Margin $22 $0.26 Rest of World +1% Margin Rest of World +1% Margin $28 $0.38 2016 Target 8% Margin 2016 Target 8% Margin ~$290 ~$2.50 Add 5% annual organic revenue growth ‘14 – ’16 Add 5% annual organic revenue growth ‘14 – ’16 ~$40 ~$0.50 Potential 2016 $290 - $330 $290 - $330 $2.50 - $3.00 $13 Op Profit 1.8% Margin $23 Op Profit 5.0% Margin $174 Op Profit 7.3% Margin (b) ($ millions, except where noted) 2013 Adjusted Non-GAAP Results (a) $3.6 Billion Revenue $210 Op Profit 5.9% Margin Revenue
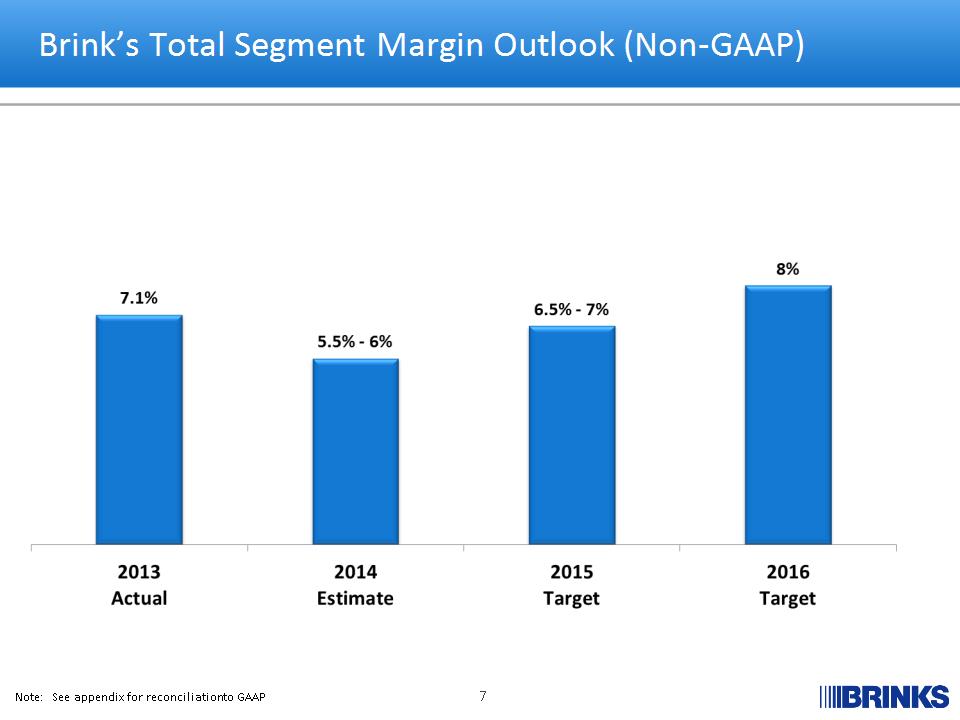
* Brink’s Total Segment Margin Outlook (Non-GAAP) Note: See appendix for reconciliation to GAAP

% of Revenue 16% 18% % of Revenue 14% 12% * U.S. Profit Improvement 2013 2016 2% CAGR ($ millions) Revenue Operating Profit (a) SG&A (a) Branch Margin (a) Profit Costs % of Revenue 2% 6% (a) On a Non-GAAP basis. See reconciliation to GAAP results in appendix.

* U.S. – Performing Branches Performing branch = Operating profit above breakeven on a fully loaded cost basis Productivity Projects Route logistics Field force automation Centralized billing CompuSafe® service focus Vehicle armoring and maintenance One-man crew on CIT Project management organization support

% of Revenue 9% 8% % of Revenue 14% 18% % of Revenue 5% 10% * Mexico Profit Improvement 2013 2016 Revenue Operating Profit(a) Branch Margin(a) Profit 3% CAGR ($ millions) (a) See reconciliation to GAAP and other information in appendix SG&A(a) Costs

* Mexico Branch Margin Improvement 4% Reduction ($ millions) Operational Structure (Branch Costs) 10% Reduction Administrative Structure (Support Functions) Productivity Projects “Standard” branch structure Centralization Finance shared services Money processing Global procurement (a) (a) Excludes organic growth

* Mexico Money Processing Improvements 10% Reduction Money Processing Efficiency Metric (notes per hour, per person) (thousands) Capex Spend (millions) 8% Reduction 20% Increase 20% Increase Headcount

* Operational Excellence Global Procurement IT Centralization
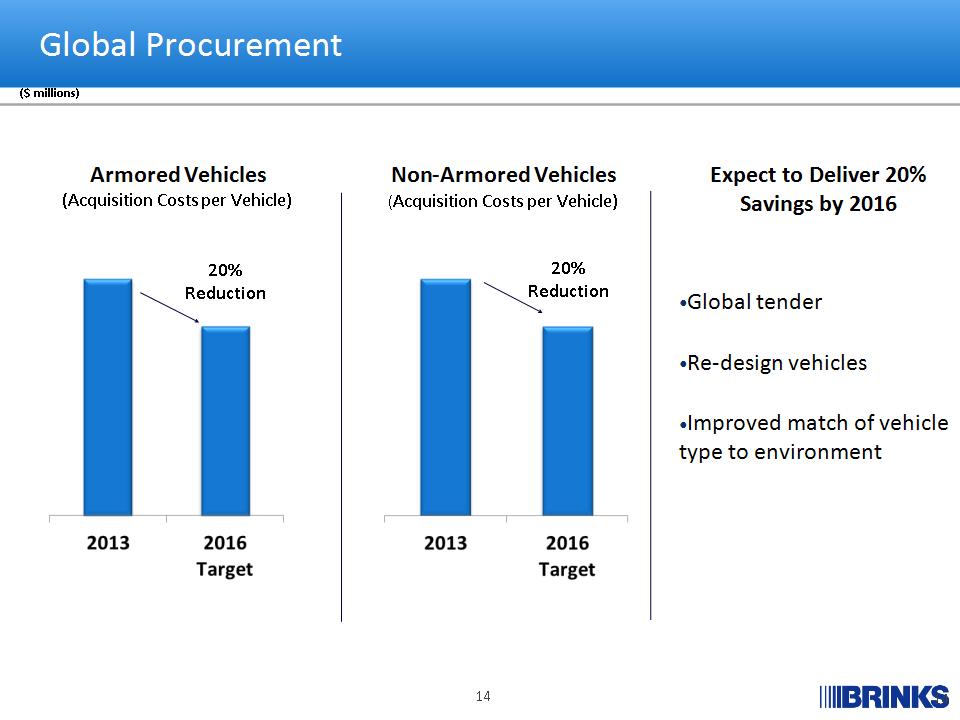
* Global Procurement 20% Reduction Armored Vehicles (Acquisition Costs per Vehicle) Expect to Deliver 20% Savings by 2016 Global tender Re-design vehicles Improved match of vehicle type to environment Non-Armored Vehicles (Acquisition Costs per Vehicle) 20% Reduction ($ millions) *
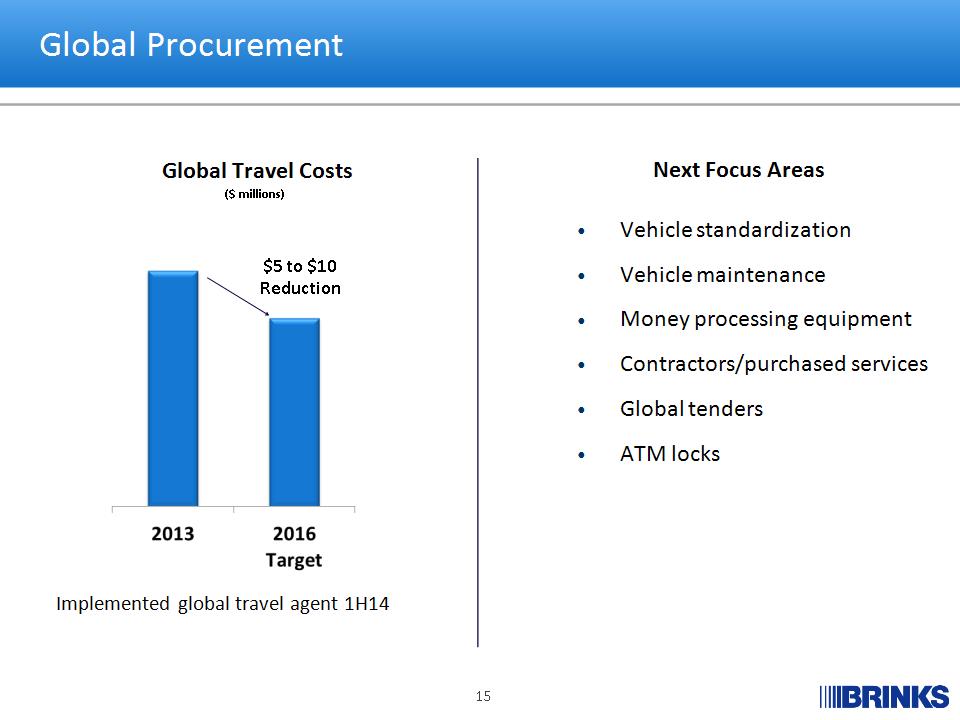
* Global Procurement Vehicle standardization Vehicle maintenance Money processing equipment Contractors/purchased services Global tenders ATM locks Global Travel Costs Next Focus Areas $5 to $10 Reduction Implemented global travel agent 1H14 ($ millions)

* IT Centralization ($ millions) Global IT Costs Data Centers Key Projects Global data center strategy Global alignment of IT organization & spend Global procurement/tender of IT equipment Global application map Network & telephone rationalization 60% Reduction $15 to $20 Reduction *

* Recent Organizational Change Result Four regions eliminated, two operating segments created $10 to $15 million savings in 2015 expected Country based functions report to global functional leaders Leaner and more focused Faster decision-making and execution U.S. France Mexico Brazil Canada EMEA Latin America Asia Legal IT HR Finance Procurement Security Payments Business

2016 Targets * 2016 Non-GAAP Targets (a) 8% segment margin $290 - $330 million segment profit $2.50 - $3.00 EPS How We Get There Fix U.S. and Mexico Rest of world margin +1.0% points Organic revenue growth ~5% Operational excellence Global procurement Centralization (a) See appendix for information regarding reconciling to GAAP *

* Appendix
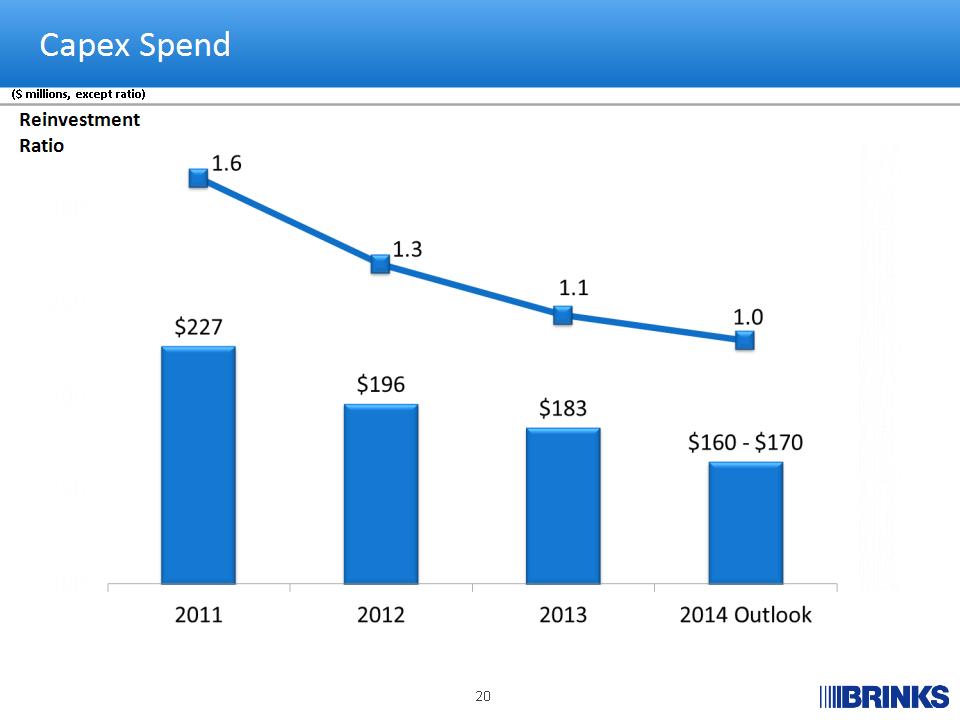
Reinvestment Ratio ($ millions, except ratio) * Capex Spend

* Estimated Cash Payments to Primary U.S. Pension & UMWA Prepaid 2015 and 2016 pension payments totaling $61 million in 3Q 14 Accelerates de-risking of invested asset allocation Reduces PBGC premiums (current borrowing costs are lower than PBGC premiums) Lump-sum pension payment offered to eligible former employees Non-cash GAAP charge expected in 4Q 14 based on number of participants and actuarial assumptions No cash payments to UMWA expected until 2033 Payments to Primary U.S. Pension Payments to UMWA through ($ millions)

* North America Segment Margin Outlook (Non-GAAP) (excluding Global Payments) Note: See appendix for reconciliation to GAAP
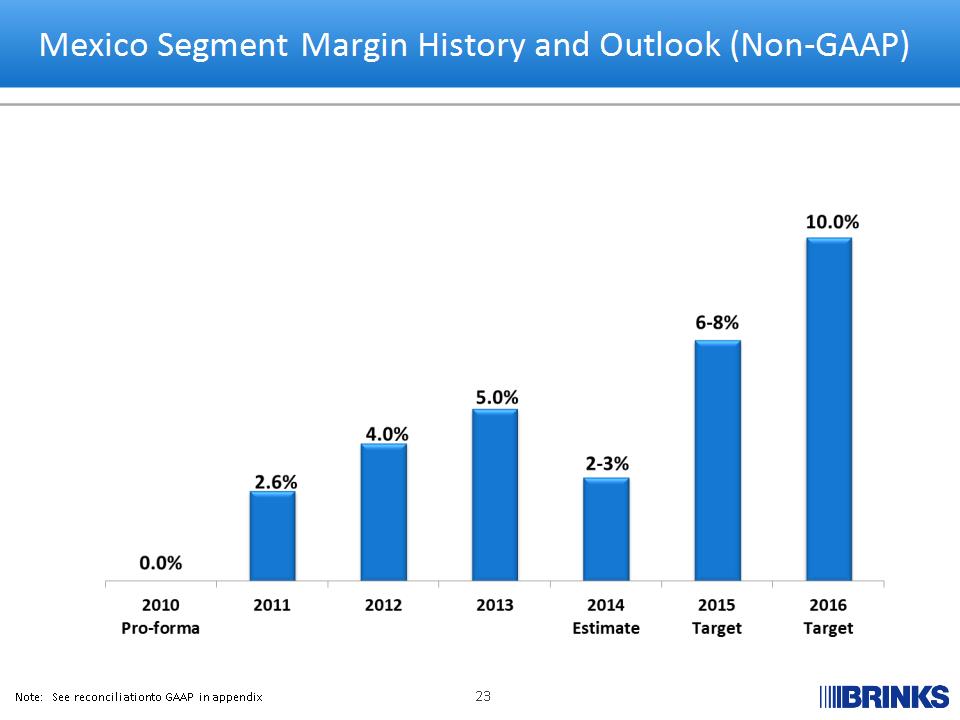
* Mexico Segment Margin History and Outlook (Non-GAAP) Note: See reconciliation to GAAP in appendix
* Recent Events Netherlands Restructuring – October 2014 Loss of major customer $16 million charge ($.24 per share) – 3Q14 Charge excluded from non-GAAP results Peru Divestiture – September 2014 36% equity stake sold for $60 million $44 million gain ($.45 per share) – 3Q14 Gain excluded from non-GAAP results

* Non-GAAP Reconciliations – Full Year 2013 Amounts may not add due to rounding. See page 26 for notes. GAAP Basis GAAP Basis Gains/ Losses on Acquisitions and Dispositions (a) Expenses Related to Currency Devaluation in Venezuela (b) Employee Benefit Settlement Losses (c) U.S. Retirement Plans (d) Adjust Income Tax Rate (e) Non-GAAP Basis Adjust Venezuela to 50 Bolivars to the U.S. Dollar (f) Adjusted Non-GAAP Basis (g) Full Year 2013 Full Year 2013 Full Year 2013 Full Year 2013 Full Year 2013 Full Year 2013 Full Year 2013 Full Year 2013 Full Year 2013 Full Year 2013 Full Year 2013 Full Year 2013 Full Year 2013 Full Year 2013 Full Year 2013 Full Year 2013 Full Year 2013 Full Year 2013 Full Year 2013 Revenues: Revenues: Revenues: Latin America Latin America $ $ 1,720.7 - - - - - 1,720.7 (391.5) 1,329.2 EMEA EMEA 1,178.3 - - - - - 1,178.3 - 1,178.3 North America North America 898.4 - - - - - 898.4 - 898.4 Asia Pacific Asia Pacific 144.8 - - - - - 144.8 - 144.8 Revenues $ $ 3,942.2 - - - - - 3,942.2 (391.5) 3,550.7 Operating profit: Operating profit: Operating profit: Latin America Latin America $ $ 149.9 (3.9) 14.6 2.5 - - 163.1 (68.9) 94.2 EMEA EMEA 81.5 - - - - - 81.5 - 81.5 North America North America 4.7 - - - 11.6 - 16.3 - 16.3 Asia Pacific Asia Pacific 16.7 0.9 - - - - 17.6 - 17.6 Segment operating profit 252.8 (3.0) 14.6 2.5 11.6 - 278.5 (68.9) 209.6 Non-segment Non-segment (81.1) (2.8) - - 41.3 - (42.6) - (42.6) Operating profit $ $ 171.7 (5.8) 14.6 2.5 52.9 - 235.9 (68.9) 167.0 Amounts attributable to Brink’s: Amounts attributable to Brink’s: Amounts attributable to Brink’s: Income from continuing operations Income from continuing operations Income from continuing operations $ $ 71.9 (4.1) 9.1 1.8 31.8 - 110.5 (36.1) 74.4 Diluted EPS – continuing operations Diluted EPS – continuing operations Diluted EPS – continuing operations 1.47 (0.08) 0.18 0.04 0.65 - 2.26 (0.74) 1.52

* Non-GAAP Reconciliations – 2013 Notes To eliminate $6.1 million in equity earnings ($1.6 million in the first quarter, $1.3 million in the second quarter, $1.5 million in the third quarter, and $1.7 million in the fourth quarter) from our former investment in a CIT business in Peru. a $1.1 million adjustment in the first quarter of 2013 to the amount of gain recognized on a 2010 business acquisition in Mexico as a result of a favorable adjustment to the purchase price received in the first quarter of 2013. $1.7 million of favorable adjustments in the third and fourth quarters of 2013 primarily related to the January 2013 acquisition of Rede Trel in Brazil. $3.1 million in adjustments in the fourth quarter of 2013 related to the increase in a loss contingency assumed in the 2010 Mexico acquisition and the impairment of an intangible asset acquired in the 2009 India acquisition. a $2.6 million unfavorable tax adjustment related to the Belgium disposition. To eliminate the effects of the February 2013 currency devaluation in Venezuela in which the official exchange rate in Venezuela declined 16% from 5.3 to 6.3 bolivars to the U.S. dollar. Expenses eliminated from Non-GAAP results include first quarter currency exchange losses totaling $13.4 million related to remeasured net monetary assets as well as expenses related to nonmonetary assets ($0.5 million in the first quarter, $0.2 million in the second quarter, $0.2 million in the third quarter and $0.3 million in the fourth quarter). Nonmonetary assets were not remeasured to a lower basis when the currency devalued. Instead, under highly inflationary accounting rules, these assets retained their higher historical bases, which excess is recognized in earnings as the asset is consumed. To eliminate employee benefit settlement losses in Mexico. To eliminate expenses related to U.S. retirement plans. To adjust effective income tax rate in the interim period to be equal to the full-year non-GAAP effective income tax rate. The full-year non-GAAP effective tax rate for 2013 was 34.1%. Effective March 24, 2014, Brink’s began remeasuring its Venezuelan operating results using currency exchange rates reported under a newly established currency exchange process in Venezuela (the “SICAD II process”). This adjustment reflects a hypothetical remeasurement of Brink’s Venezuela’s 2013 revenue and operating results using a rate of 50 bolivars to the U.S. dollar, which approximates the rate observed in the new SICAD II process in March 2014. Losses that would have been recognized in 2013 had Brink’s used a rate of 50 bolivars to the U.S. dollar to remeasure its net monetary assets have been excluded from this adjustment and the Adjusted Non-GAAP results. Adjusted Non-GAAP results are equal to Non-GAAP results further adjusted for Venezuelan results at 50 bolivars per U.S. dollar. Amounts may not add due to rounding.

* Non-GAAP Reconciliations – Projected Financial Information North America Segment Margin Outlook (excluding Global Payments) North America Segment Margin Outlook (excluding Global Payments) North America Segment Margin Outlook (excluding Global Payments) North America Segment Margin Outlook (excluding Global Payments) North America Segment Margin Outlook (excluding Global Payments) North America Segment Margin Outlook (excluding Global Payments) North America Segment Margin Outlook (excluding Global Payments) North America Segment Margin Outlook (excluding Global Payments) 2013 2014 2015 2016 Non-GAAP 1.9% 2.5 – 3.5% 4-5% 7% Pension expense (1.3)% 0% 0% 0% GAAP 0.6% 2.5 – 3.5% 4-5% 7% (a) U.S. GAAP margins for Mexico are not provided for 2010 and 2014 – 2016 because we are unable to quantify settlement losses during these periods without unreasonable effort. Consolidated Non-GAAP targets for 2016 (including segment margin, segment operating profit, and EPS target) are not reconciled to GAAP counterparts because we are unable to quantify certain amounts that would be required to be included in the GAAP measure without unreasonable effort. U.S. Profit Improvement Outlook U.S. Profit Improvement Outlook U.S. Profit Improvement Outlook U.S. Profit Improvement Outlook U.S. Profit Improvement Outlook U.S. Profit Improvement Outlook U.S. Profit Improvement Outlook U.S. Profit Improvement Outlook U.S. Profit Improvement Outlook Branch Margin Branch Margin Branch Margin SG&A SG&A SG&A Operating Profit Operating Profit Operating Profit 2013 2016 2013 2016 2013 2016 Non-GAAP $ 112 134 99 87 13 47 Pension expense (11) 1 1 0 (12) 1 GAAP $ 101 135 100 87 1 48 Mexico Segment Margin History and Outlook Mexico Segment Margin History and Outlook Mexico Segment Margin History and Outlook Mexico Segment Margin History and Outlook Mexico Segment Margin History and Outlook Mexico Segment Margin History and Outlook Mexico Segment Margin History and Outlook Mexico Segment Margin History and Outlook 2010 2011 2012 2013 2014 2015 2016 Non-GAAP 0.0% 2.6% 4.0% 5.0% 2% - 3% 6-8% 10.0% Settlement losses (a) (0.5)% (0.8)% (0.6)% (a) (a) (a) Acquisition adjustments n/a 0% 0.5% (0.5)% (a) n/a n/a GAAP (a)% 2.1% 3.7% 4.0% (a) (a) (a) Mexico Profit Improvement Outlook Mexico Profit Improvement Outlook Mexico Profit Improvement Outlook Mexico Profit Improvement Outlook Mexico Profit Improvement Outlook Mexico Profit Improvement Outlook Mexico Profit Improvement Outlook Mexico Profit Improvement Outlook Mexico Profit Improvement Outlook Branch Margin Branch Margin Branch Margin SG&A SG&A SG&A Operating Profit Operating Profit Operating Profit 2013 2016 2013 2016 2013 2016 Non-GAAP $ 65 86 42 38 23 48 Settlement losses (2) (a) 0 (a) (2) (a) Acquisition adjustment 0 n/a 2 n/a (2) n/a GAAP $ 63 (a) 44 (a) 18 (a) Amounts may not add due to rounding
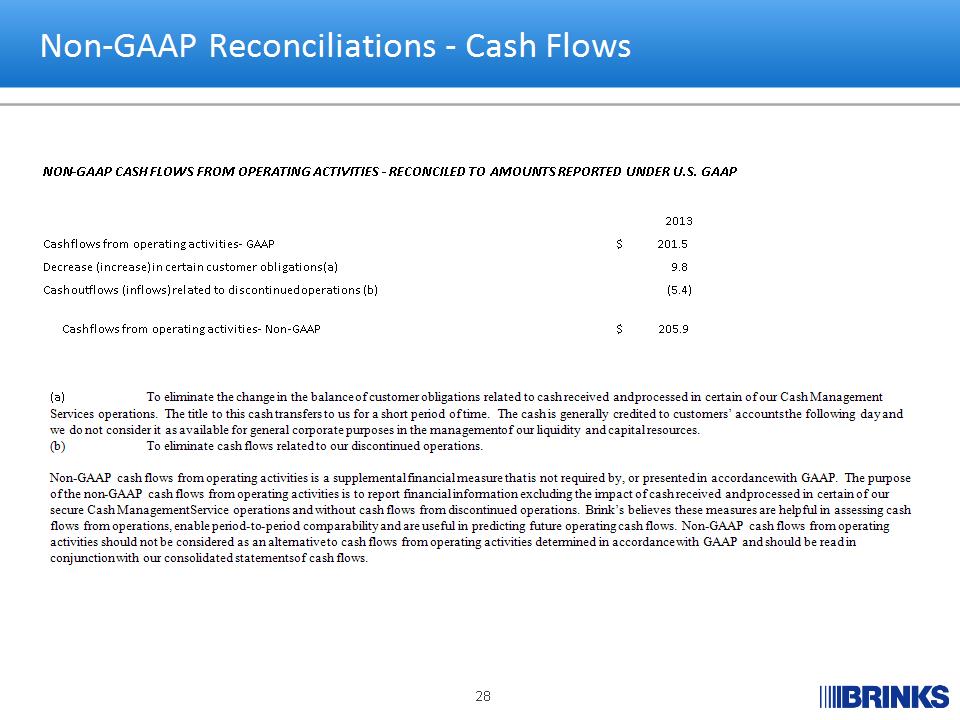
* (a) To eliminate the change in the balance of customer obligations related to cash received and processed in certain of our Cash Management Services operations. The title to this cash transfers to us for a short period of time. The cash is generally credited to customers’ accounts the following day and we do not consider it as available for general corporate purposes in the management of our liquidity and capital resources. (b) To eliminate cash flows related to our discontinued operations. Non-GAAP cash flows from operating activities is a supplemental financial measure that is not required by, or presented in accordance with GAAP. The purpose of the non-GAAP cash flows from operating activities is to report financial information excluding the impact of cash received and processed in certain of our secure Cash Management Service operations and without cash flows from discontinued operations. Brink’s believes these measures are helpful in assessing cash flows from operations, enable period-to-period comparability and are useful in predicting future operating cash flows. Non-GAAP cash flows from operating activities should not be considered as an alternative to cash flows from operating activities determined in accordance with GAAP and should be read in conjunction with our consolidated statements of cash flows. NON-GAAP CASH FLOWS FROM OPERATING ACTIVITIES – RECONCILED TO AMOUNTS REPORTED UNDER U.S. GAAP NON-GAAP CASH FLOWS FROM OPERATING ACTIVITIES – RECONCILED TO AMOUNTS REPORTED UNDER U.S. GAAP NON-GAAP CASH FLOWS FROM OPERATING ACTIVITIES – RECONCILED TO AMOUNTS REPORTED UNDER U.S. GAAP NON-GAAP CASH FLOWS FROM OPERATING ACTIVITIES – RECONCILED TO AMOUNTS REPORTED UNDER U.S. GAAP NON-GAAP CASH FLOWS FROM OPERATING ACTIVITIES – RECONCILED TO AMOUNTS REPORTED UNDER U.S. GAAP NON-GAAP CASH FLOWS FROM OPERATING ACTIVITIES – RECONCILED TO AMOUNTS REPORTED UNDER U.S. GAAP NON-GAAP CASH FLOWS FROM OPERATING ACTIVITIES – RECONCILED TO AMOUNTS REPORTED UNDER U.S. GAAP 2013 Cash flows from operating activities – GAAP Cash flows from operating activities – GAAP $ 201.5 Decrease (increase) in certain customer obligations (a) Decrease (increase) in certain customer obligations (a) 9.8 Cash outflows (inflows) related to discontinued operations (b) Cash outflows (inflows) related to discontinued operations (b) (5.4) Cash flows from operating activities – Non-GAAP $ 205.9 Non-GAAP Reconciliations – Cash Flows