Attached files
| file | filename |
|---|---|
| 8-K - 8-K - Southcross Energy Partners, L.P. | d834804d8k.htm |
 2014
Wells
Fargo
Energy
Symposium
December 9, 2014
Exhibit 99.1 |
 2014 Wells Fargo Energy Symposium
Cautionary Statements
1
This presentation contains forward-looking statements and information. Forward-looking
statements include, without limitation, any statement that may project, indicate or imply future
results, events, performance or achievements, and may contain the words “expect,”
“intend,” “plan,” “anticipate,” “estimate,” “believe,” “will be,” “will continue,” “will likely result” and
similar expressions, or future conditional verbs such as “may,” “will,”
“should,” “would” and “could.” In addition, any statement concerning future financial performance (including future
revenues, earnings or growth rates), ongoing business strategies or prospects, and possible actions
taken by us, our subsidiaries or our affiliates, are also forward-looking statements. These
forward-looking statements involve external risks and uncertainties, including, but not limited to, those described under the section entitled “Risk Factors” included in our 2013
Annual Report on Form 10-K (as updated by our Quarterly Reports on Form 10-Q).
Forward-looking statements are based on current expectations and projections about future
events and are inherently subject to a variety of risks and uncertainties, many of which are
beyond the control of our management team. All forward-looking statements in this presentation and
in any other written or oral forward-looking statements attributable to us, or to
persons acting on our behalf, are expressly qualified in their entirety by these risks and
uncertainties. These risks and uncertainties include, among others: the volatility of natural gas, crude oil and NGL prices and the price and demand of products derived
from these commodities; competitive conditions in our industry and the extent and success of producers increasing production
or replacing declining production and our success in obtaining new sources of supply; industry conditions and supply of pipelines, processing and fractionation capacity relative to
available natural gas from producers; our dependence upon a relatively limited number of customers for a significant portion of our
revenues; actions taken, inactions or non-performance by third parties, including suppliers, contractors,
operators, processors, transporters and customers; our ability to effectively recover NGLs at a rate equal to or greater than our contracted rates with
customers; our ability to produce and market NGLs at the anticipated differential to NGL index pricing;
our access to markets enabling us to match pricing indices for purchases and sales of natural gas and
NGLs; our ability to complete projects within budget and on schedule, including but not limited to, timely
receipt of necessary government approvals and permits, our ability to control the costs of
construction and other factors that may impact projects;
our ability to consummate acquisitions, successfully integrate the acquired businesses and realize
anticipated cost savings and other synergies from any acquisitions, including in respect of our
acquisition of the TexStar rich gas system assets;
our ability to manage over time changing exposure to commodity price risk;
the effectiveness of our hedging activities or our decisions not to undertake hedging
activities; our access to financing and ability to remain in compliance with our financing covenants;
our ability to generate sufficient operating cash flow to fund our quarterly distributions;
changes in general economic conditions;
the effects of downtime associated with our assets or the assets of third parties interconnected with
our systems; operating hazards, fires, natural disasters, weather-related delays, casualty losses and other
matters beyond our control; the failure of our processing and fractionation plants to perform as expected, including outages for
unscheduled maintenance or repair; the effects of laws and governmental regulations and policies;
the effects of existing and future litigation; and
other financial, operational and legal risks and uncertainties detailed from time to time in our
filings with the U.S. Securities and Exchange Commission. Developments in any of these areas
could cause actual results to differ materially from those anticipated or projected, affect our ability to maintain distribution levels and/or access
necessary financial markets, or cause a significant reduction in the market price of our common
units. The foregoing list of risks and uncertainties may not contain all of the
risks and uncertainties that could affect us. In addition, in light of these risks and uncertainties, the matters referred
to in the forward-looking statements contained in this presentation may not, in fact, occur.
Accordingly, undue reliance should not be placed on these statements. We undertake no obligation
to publicly update or revise any forward-looking statements as a result of new information, future events or otherwise, except as otherwise required by law. |
 2014 Wells Fargo Energy Symposium
Partnership Structure
Southcross Holdings LP
(“Holdings”)
Southcross Energy
Partners, L.P.
(NYSE: SXE)
Affiliate Assets
Public
43% LP Interest
2% GP Interest
57% LP Interest
Southcross Energy
Partners GP, LLC
Financial sponsor ownership through various holding companies
2
100% Interest |
 2014 Wells Fargo Energy Symposium
3
30+ Years’
Experience
•
President & COO
Southcross Energy
•
President
NiSource Midstream Services
•
Owner, President
Ranger Interests, Inc.
•
VP, Commercial (Western Region)
Enterprise Product Partners
•
Director, Commercial (Permian Basin)
GulfTerra Energy Partners
•
Director, Commercial
El Paso Field Services
•
Manager, Northeast Marketing
Delhi Gas Pipeline
•
VP, Business Development
Triumph Natural Gas
President & Chief Executive Officer
John E. Bonn
•
Bachelor of Science, Agricultural Engineering, Texas A&M
•
Officer, United States Army and Army Reserves
•
Board member, Texas Aggie Corps of Cadets Association
•
Past board member, Marcellus Shale Coalition
•
New Mexico Oil & Gas Association
•
Past president, Natural Gas Society of North Texas |
 2014 Wells Fargo Energy Symposium
The Southcross Advantage
4
Significant
scale
of
pipeline
and
processing
assets
Operating
stability
through
interconnected
system
Extensive
footprint
in
the
prolific
Eagle
Ford and Gulf Coast area
Blue
chip,
active
producer
customer
base
Full
spectrum
of
services
creates
competitive and economic advantages
Fractionation
assets
are
a
significant
differentiator
Premium
and
growing
markets
for
gas,
NGLs and condensate
Corpus
Christi
region
is
growing
rapidly
and serving new export markets
Fully utilize existing capacity
Develop organic growth
projects
Drop-downs
Acquisitions
Premier Strategic Platform
in the Eagle Ford
Fully Integrated
Midstream Platform
Four Drivers of
Growth |
 2014 Wells Fargo Energy Symposium
Premier Strategic Footprint with Scale to
Succeed in the Eagle Ford
Holdings
SXE
Sour Gas Treating Facility
Fractionator
Processing Plant
5
Corpus Christi
San Antonio
Houston
Conroe
Lone Star
Woodsboro
Bonnie View
Gregory
Robstown
South Texas Assets
Pipeline (miles)
Gas Processing Capacity (MMcf/d)
Fractionation Capacity (MBbls/d)
Holdings
655
-
63
SXE
3,030
685
27 |
 2014 Wells Fargo Energy Symposium
Eagle Ford Highlights
6
Source: EIA
The Eagle Ford is a major driver of U.S. oil and natural gas production growth
U.S. Oil Production per Day
U.S. Natural Gas Production per Day |
 2014 Wells Fargo Energy Symposium
Eagle Ford Has Attractive Producer
Economics
7
Eagle Ford
Permian Basin
Bakken
Marginal Economics
12-Month Strip
$/Bbl (WTI)
Source: RBC Capital Markets
U.S. Oil Play Break-Even Assessment at December 1, 2014 Forward Strip Prices |
 2014 Wells Fargo Energy Symposium
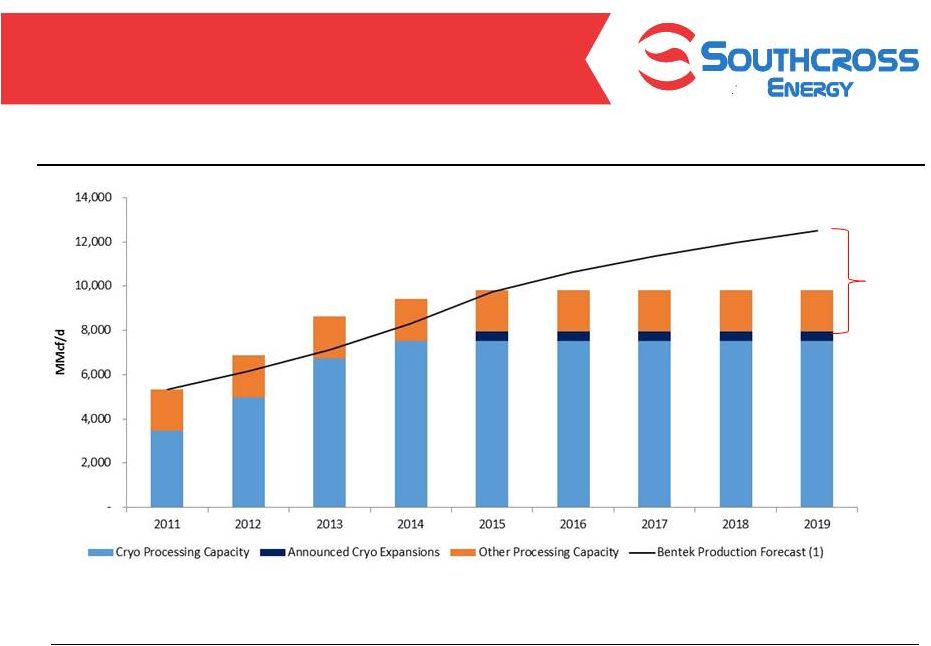
Request for Proposal Summary
Proposed Contract and Deal Terms
Texas Gulf Coast Production Expected to
Exceed Processing Capacity
8
(1) Bentek Eagle Ford and Texas Gulf Coast production estimates
Note: Excludes plant retirements.
Texas Gulf Coast Region is forecasted to need an additional 2.0 to 4.5 bcf/d of
processing capacity by 2019
Potential
4.5 Bcf/d
Shortfall
in Cryo
Capacity |
 2014 Wells Fargo Energy Symposium
Well Positioned for Current Eagle Ford
Activity
9
Permits 2012-2014 |
 2014 Wells Fargo Energy Symposium
Full Spectrum of Services Creates
Competitive and Economic Advantages
10
Wellhead
Gathering and Compression
Gas Processing Plants
Y-Grade
Fractionation Facilities
Natural Gas
End Users
Transportation Lines / Storage
NGL End Users
NGL & Residue Marketing
20%
30%
5%
35%
10%
Midstream
Margin Stream
Southcross participates in 100% of the midstream margin stream
~50% of Margin Stream from Fractionation
and NGL Marketing
Note: Treating fees, when applicable, further supplement the margin stream
|
 2014 Wells Fargo Energy Symposium
Refining Projects
•
Valero upgrading 325kb/d Corpus Christi refinery
•
Flint Hills plans to reconfigure 230kb/d Corpus Christi West Refinery
•
Martin Midstream, Magellan Midstream and Trafigura constructing condensate
splitters at facilities in Corpus Christi Lyondell / Equistar Ethylene
Capacity Expansion •
Lyondell to add 800 million lbs/year of ethylene capacity at Corpus Christi plant
by 2016 •
20,000 Bbl/d of estimated increase in ethane demand by 2016
Cheniere
–
April
7,
2014,
July
17,
2014
and
October
8,
2014
Press
Releases
•
Entered into 20 year LNG supply agreements with Endesa
•
Signed agreement to supply EDF with 380,000 tons / year of LNG from Train 3 as
early as 2019 •
Expect to complete steps to final investment decision and construction by early
2015 •
FERC issues final Environmental Impact Statement for project on October 8, 2014
Trafigura
–
November
14,
2013
and
September
11,
2014
Press
Release
•
Trafigura spending $500 million to expand dock facilities at Corpus Christi
•
Expansion to meet increasing demand for water access for Eagle Ford
production •
Buckeye
Partners
LP
completes
$860
million
acquisition
of
80%
of
Corpus
Christi
midstream
business
from
Trafigura
NET
Midstream
Pipeline
to
Mexico
–
November
17,
2014
Press
Release
•
120-mile, 42”
and 48”
natural gas pipeline with 2.3 Bcf/d of initial capacity (expandable to 3.0 Bcf/d)
was completed ahead of schedule and is now operational
•
Long-term firm gas transportation agreement with MexGas Supply Ltd., a
subsidiary of Pemex 11
Lower Gulf Coast Projects Fuel Growth
OxyChem Corpus Christi Development Projects
•
OxyChem 110,000 Bbl/d propane export facility at Ingleside expected to begin
operations in 2015 •
OxyChem and MexiChem to build 1.2 billion lbs/year ethylene cracker in 2017
(34,000 Bbl/d ethane demand) |
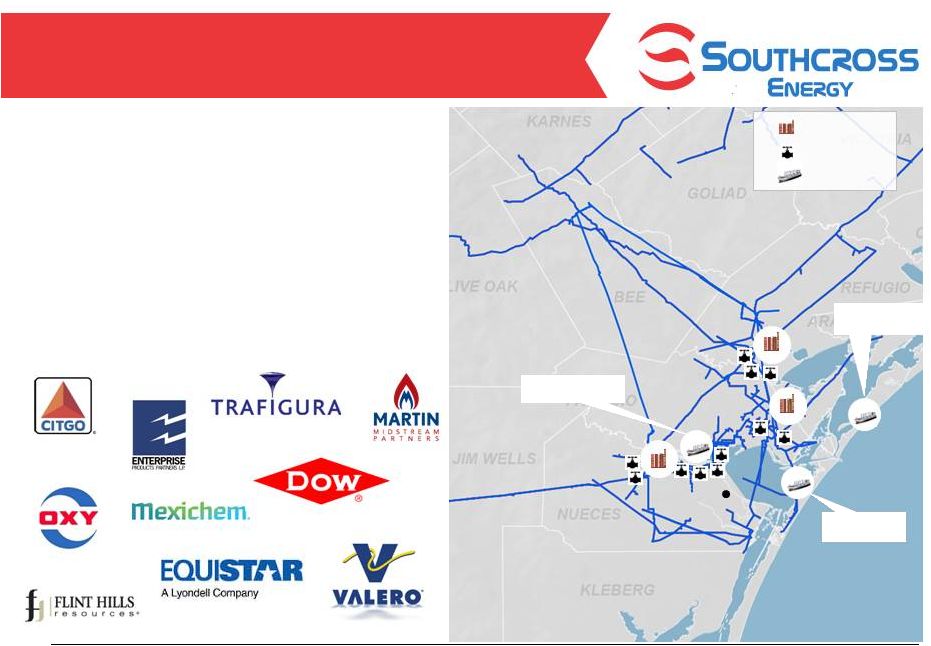
 2014 Wells Fargo Energy Symposium
•
System provides interconnects to every interstate pipeline in the region and
diverse market outlets; both are an advantage in attracting producer
contracts •
Local markets provide incremental downstream margins
•
Multiple gas sale outlets including direct connections to industrial and electric
generation markets Southcross Delivers Gas to Attractive
End-use Markets
12
YTD 2014 residue gas sales
Corpus Christi
Woodsboro
Gregory
NET Midstream
2.3 Bcf/d Mexico
Pipeline
Cheniere LNG
2.6 Bcf/d facility
Processing Plant
Markets
LNG Facility
82%
Direct End-use
Markets
18%
Pipelines |
 2014 Wells Fargo Energy Symposium
Multiple NGL Markets in Corpus Christi
Area
13
Corpus Christi
Fractionator
Markets
Export Terminal
Bonnie View
Gregory
Trafigura Export
Active
Oxy Export
Approved
Martin Export
Active
Robstown
•
Advantaged Southcross footprint in expanding Gulf Coast
petrochemical infrastructure and NGL markets
•
End-use NGL markets provide attractive pricing and
market outlets
•
New NGL export terminals near Corpus Christi
•
Most North American ethane cracking is on the Gulf
Coast and is expanding
•
Attractive NGL customer base in the Corpus Christi
market |
 2014 Wells Fargo Energy Symposium
14
Blue Chip Customer and Contract Base
Minimum
Volume
Commitments
44%
Acreage
Dedications
39%
Captive
Volumes
14%
Minimum volume commitments, acreage dedications and captive volumes should provide a
solid
and
growing
base
of
gas
supply
(1)
(1) Data from processed gas volumes for the Q4 guidance range.
Other
3% |
 2014 Wells Fargo Energy Symposium
Updates on Recent Key Projects
15
Corpus Christi
Houston
Conroe
Lone Star
Woodsboro
Bonnie View
Gregory
Robstown
45 mile pipeline extending from Webb County
to rich gas system
35 MMcf/d MVC started November 2014
Webb Pipeline
100 MMcf/d sour gas treating facility; treated gas
flows into SXE rich gas system
Dedicated acreage in Dimmit and La Salle
counties producing sour gas
Valley Wells System
4 mile gathering pipeline
McMullen Lateral
9 mile pipeline extending into Karnes County
27 MMcf/d MVC started December 2014
Karnes Gathering
Holdings
SXE
Sour Gas Treating Facility
Fractionator
Processing Plant |
 2014 Wells Fargo Energy Symposium
Rapid Growth of Southcross Processed
Gas Volumes
16
Average Processed Gas Volumes (MMBtu/d)
29% Organic
CAGR (excluding
acquisition)
38% compound annual growth rate in average daily processed gas volumes since
2011 2011
2012
2013
2014
-
50
100
150
200
250
300
350
400
450
500
Q1
Q2
Q3
Q4
Q1
Q2
Q3
Q4
Q1
Q2
Q3
Q4
Q1
Q2
Q3
Oct. |
 2014 Wells Fargo Energy Symposium
Significant Growth Achievable From
Existing Capacity
17
332
MMcf/d
381
MMcf/d
404
MMcf/d
440
MMcf/d
August
September
October
November
MTD
Southcross
Processing
Capacity
685
MMcf/d
1
As discussed on the November 7, 2014 SXE earnings call.
2
At margin of $0.50 to $0.75 per mcf/d.
Significant available processing capacity presents cash flow growth opportunity
Adding 200 MMcf/d of
gas represents $36
million to $55 million of
additional potential
annual margin
2014 Avg. Daily Processed Volumes
(MMcf/d) 0
50
100
150
200
250
300
350
400
450
500
550
600
650
2
1 |
 2014 Wells Fargo Energy Symposium
600 miles of sweet and sour gas gathering lines
28,000 hp of compression
100 MMcf/d sour gas treating facility; expandable to
300 MMcf/d
~300,000 acres dedicated from 18 producers
Lancaster System
NGL Pipeline System
100 MMcf/d sour gas
treating facility
25,000 hp of compression
Valley Wells System
Drop-Down Inventory
18
Sour Gas Treating Facilities
Robstown Fractionator
63,000 Bbls/d NGL
fractionation facility
Long-term purity product
off-take agreements with
blue chip customers and
exporters under long term
contracts
Robstown Fractionator
Corpus Christi
70,000 Bbls/d Y-grade
pipeline 60,000 Bbls/d
Y-grade pipeline and
20,000 Bbls/d propane pipeline from Woodsboro Plant
to Robstown Fractionator
(under construction) |
 2014 Wells Fargo Energy Symposium
•
Expected near-term path to 1.0x distribution coverage
–
Recent new minimum volume commitment contracts are expected to add
$7 million to $8 million in full quarter Adjusted EBITDA
–
Existing base of strong producer customers is expected to continue to
grow production at current commodity price levels
•
Existing commitment from Holdings to forgo subordinated unit distributions
while coverage is less than 1.0x provides support for common units
•
Expect to fill processing plant capacity within 12 to 18 months
–
Potential to start-up new processing plant in 2016
•
Supplement organic growth through expected drop-downs
Enable Consistent Distribution Growth
19
Expect to
achieve at
least 1.0x
coverage of
common units
in Q1 2015
Expect to grow
distributions
in 2015
Expect further
growth
through filling
asset capacity
& completing
drop-downs |
 2014 Wells Fargo Energy Symposium
20
NYSE Ticker
Total Units
Unit Price
Market Capitalization
SXE
50.9 million units
(1)
$14.30
(2)
$728 million
(2)
$458 million
Debt at Sept 30, 2014
Quarterly Distribution
$0.40 per unit ($1.60 per unit on an annualized basis)
Current Yield
11.2%
(2)
(1)
Includes 14.9 million Class B convertible units; excludes GP units
(2)
As of December 5, 2014
Southcross Fact Sheet |
 2014 Wells Fargo Energy Symposium
We
believe
that
Adjusted
EBITDA
is
a
widely
accepted
financial
indicator
of
our
operational
performance
and
our
ability
to
incur
and
service
debt,
fund
capital expenditures and make distributions.
We define Adjusted EBITDA as net income/loss, plus interest expense, income tax
expense, depreciation and amortization expense, equity in losses of joint
venture investments, certain non-cash charges (such as non-cash unit-based compensation, impairments, loss on extinguishment of debt and
unrealized losses on derivative contracts), major litigation costs net of
recoveries, transaction-related costs, revenue deferral adjustment, loss on sale of
assets and selected charges that are unusual or non-recurring; less interest
income, income tax benefit, unrealized gains on derivative contracts, equity
in
earnings
of
joint
venture
investments
and
selected
gains
that
are
unusual
or
non-recurring.
Adjusted EBITDA is used as a supplemental measure by our management and by external
users of our financial statements, such as investors, commercial banks,
research analysts and others, to assess: •
the financial performance of our assets without regard to financing methods,
capital structure or historical cost basis; •
the
ability
of
our
assets
to
generate
cash
sufficient
to
support
our
indebtedness
and
make
future
cash
distributions;
•
operating
performance
and
return
on
capital
as
compared
to
those
of
other
companies
in
the
midstream
energy
sector,
without
regard
to financing or capital structure; and
•
the attractiveness of capital projects and acquisitions and the overall rates of
return on investment opportunities. Adjusted EBITDA is not a financial
measure presented in accordance with GAAP. We believe that the presentation of this non-GAAP financial measure
provides useful information to investors in assessing our financial condition,
results of operations and cash flows from operations. Net income/loss is the
GAAP
measure
most
directly
comparable
to
Adjusted
EBITDA,
and
a
reconciliation
of
Adjusted
EBITDA
to
net
income/loss
is
included
in
this
presentation.
Adjusted
EBITDA
should
not
be
considered
an
alternative
to
net
income,
operating
cash
flow
or
any
other
measure
of
financial
performance presented in accordance with GAAP. Non-GAAP financial
measures have important limitations as an analytical tool because each
excludes some but not all items that affect the most directly comparable GAAP
financial measure. You should not consider Adjusted EBITDA in isolation
or
as
a
substitute
for
analysis
of
our
results
as
reported
under
GAAP.
Because
Adjusted
EBITDA
may
be
defined
differently
by
other
companies
in
our
industry,
our
definition
of
this
non-GAAP
financial
measure
may
not
be
comparable
to
similarly
titled
measures
of
other
companies,
thereby
diminishing
its utility.
Non-GAAP Financial Measures
21 |
 2014 Wells Fargo Energy Symposium
22
Reconciliation to Adjusted EBITDA
(Dollars in Thousands)
Three Months Ended,
9/30/2013
12/31/2013
3/31/2014
6/30/2014
9/30/2014
Reconciliation of net loss to Adjusted EBITDA:
Net (loss) income
$
(4,069)
$
674
$
(1,289)
$
(2,961)
$
(24,778)
Add (deduct):
Depreciation and amortization expense
9,447
8,590
8,528
8,978
11,629
Interest expense
3,587
3,855
2,973
1,771
4,596
Loss on extinguishment of debt
-
-
-
-
2,316
Unit-based compensation
552
542
529
1,082
609
Income tax (benefit) expense
125
(19)
8
56
69
Unrealized (gain) loss
-
(120)
(32)
175
207
Revenue deferral adjustment
-
-
1,182
444
444
Gain on sale of assets
-
(25)
-
(45)
-
Loss on asset disposal
-
-
4
-
334
Major litigation costs, net of recoveries
-
517
273
630
488
Transaction-related costs
-
-
303
4
10,506
Equity in losses of joint venture investments
-
-
-
-
3,308
Impairment of assets
-
-
-
-
1,556
Other, net
20
24
18
44
-
Adjusted EBITDA
$
9,662
$
14,038
$
12,497
$
10,178
$
11,284 |