Attached files
| file | filename |
|---|---|
| EX-32.2 - EXHIBIT - SIFCO INDUSTRIES INC | exhibit32210k2014.htm |
| EX-31.1 - EXHIBIT - SIFCO INDUSTRIES INC | exhibit31110k2014.htm |
| EX-31.2 - EXHIBIT - SIFCO INDUSTRIES INC | exhibit31210k2014.htm |
| EX-21.1 - EXHIBIT - SIFCO INDUSTRIES INC | exhibit21110k2014.htm |
| EX-32.1 - EXHIBIT - SIFCO INDUSTRIES INC | exhibit32110k2014.htm |
| EX-23.1 - EXHIBIT - SIFCO INDUSTRIES INC | exhibit23110k2014.htm |
| EXCEL - IDEA: XBRL DOCUMENT - SIFCO INDUSTRIES INC | Financial_Report.xls |
UNITED STATES
SECURITIES AND EXCHANGE COMMISSION
WASHINGTON, D.C. 20549
FORM 10-K
/X/ ANNUAL REPORT PURSUANT TO SECTION 13 OR 15(d) OF THE SECURITIES EXCHANGE ACT OF 1934 For the fiscal year ended September 30, 2014
or
/ / | TRANSITION REPORT PURSUANT TO SECTION 13 OR 15 (d) OF THE SECURITIES EXCHANGE ACT OF 1934 For the transition period from _________________ to _____________________ |
Commission file number 1-5978
SIFCO Industries, Inc.
(Exact name of registrant as specified in its charter)
Ohio | 34-0553950 | |||||
(State or other jurisdiction of incorporation or organization) | (I.R.S. Employer Identification No.) | |||||
970 East 64th Street, Cleveland Ohio | 44103 | |||||
(Address of principal executive offices) | (Zip Code) | |||||
(216) 881-8600 | ||||||
(Registrant’s telephone number, including area code) | ||||||
Securities Registered Pursuant to Section 12(b) of the Act: | ||||||
Common Shares, $1 Par Value | NYSE MKT | |||||
(Title of each class) | (Name of each exchange on which registered) | |||||
Securities registered pursuant to Section 12(g) of the Securities Exchange Act: None.
Indicate by check mark if the registrant is a well-known seasoned issuer, as defined in Rule 405 of the Securities Act.
Yes [ ] No [X]
Indicate by check mark if the registrant is not required to file reports pursuant to Section 13 or Section 15(d) of the Act.
Yes [ ] No [X]
Indicate by check mark whether the registrant (1) has filed all reports required to be filed by Section 13 or 15(d) of the Securities Exchange Act of 1934 during the preceding 12 months (or for such shorter period that the registrant was required to file such reports), and (2) has been subject to such filing requirements for the past 90 days. Yes [X] No [ ]
Indicate by check mark whether the registrant has submitted electronically and posted on its corporate Web site, if any, every Interactive Data File required to be submitted and posted pursuant to Rule 405 of Regulation S-T (Section 232.405 of this chapter) during the preceding 12 months (or for such shorter period that the registrant was required to submit and post such files).
Yes [X] No [ ]
Indicate by check mark if disclosure of delinquent filers pursuant to Item 405 of Regulation S-K (Section 229.405 of this chapter) is not contained herein, and will not be contained, to the best of registrant’s knowledge, in definitive proxy or information statements incorporated by reference in Part III of this Form 10-K or any amendment to this Form 10-K. [ ]
Indicate by check mark whether the registrant is a large accelerated filer, an accelerated filer, a non-accelerated filer, or a smaller reporting company (as defined in Rule 12b-2 of the Exchange Act).
large accelerated filer [ ] accelerated filer [X] non-accelerated filer [ ] smaller reporting company [ ]
Indicate by check mark whether the registrant is a shell company (as defined in Rule 12b-2 of the Act).
Yes [ ] No [X]
The aggregate market value of the voting and non-voting common equity held by non-affiliates computed by reference to the price at which the common equity was last sold, as of the last business day of the registrant’s most recently completed second fiscal quarter is $81,031,322.
The number of the Registrant’s Common Shares outstanding at October 31, 2014 was 5,413,129.
Documents incorporated by reference: Portions of the definitive Proxy Statement for the Annual Meeting of Shareholders to be held on January 28, 2015 (Part III).
PART I
Item 1. Business
A. | The Company |
SIFCO Industries, Inc., an Ohio corporation, was incorporated in 1916. The executive offices of the Company are located at 970 East 64th Street, Cleveland, Ohio 44103, and its telephone number is (216) 881-8600.
SIFCO Industries, Inc. is engaged in the production of forgings and machined components primarily for the Aerospace and Energy ("A&E") markets. The processes and services include forging, heat-treating and machining. SIFCO Industries, Inc.'s operations are conducted in a single business segment (“SIFCO,” "Company," "we" or “our”), previously referenced as SIFCO Forged Components, during fiscal 2014. Information relating to the Company's financial results is set forth in the consolidated financial statements included in Item 8. In fiscal 2013, the Company had two additional segments: Turbine Component Services and Repair, which was discontinued in fiscal 2013, and Applied Surface Concepts, which was divested in fiscal 2013. Financial information relating to the Company’s divestiture and discontinued operations is referenced in Note 13 of the consolidated financial statements included in Item 8.
B. | Principal Products and Services |
1. SIFCO
Operations
SIFCO is a manufacturer of forgings and machined components for the A&E markets that range in size from approximately 2 to 1,200 pounds (depending on configuration and alloy), primarily in steel, stainless steel, titanium and aluminum. SIFCO products include: original equipment manufacturer (“OEM”) and aftermarket components for aircraft and industrial gas turbine engines; structural airframe components; aircraft landing gear components; wheels and brakes; critical rotating components for helicopters; and commercial/industrial products. SIFCO also provides heat-treatment, surface-treatment, non-destructive testing and select machining of forged components.
SIFCO generally has multiple sources for its raw materials, which consist primarily of high quality metals essential to this business. Suppliers of such materials are located principally in North America, Taiwan and Europe. SIFCO generally does not depend on a single source for the supply of its materials. Due to the limited supply of certain raw materials, some material is provided by a small number of suppliers; however, SIFCO believes that its sources are adequate for its business. SIFCO's various operations are AS 9100C and/or ISO 9001:2000 certified.
Products
The Company’s strategic vision is to build a leading A&E company positioned for long-term, stable growth and profitability. In the past several years, SIFCO has actively diversified into the industrial gas turbine business, added more commercial aerospace business, reduced its dependence on the U.S. military business, and broadened the scope of its product and service offerings by adding machining and finishing to its forgings capabilities. The Company's success is not dependent on patents, trademarks, licenses or franchises.
SIFCO has multiple locations. SIFCO Forge ("Cleveland") is located in Cleveland, Ohio; T&W Forge (“Alliance”) is located in Alliance, Ohio; Quality Aluminum Forge (“Orange”) is located in Orange, California and Long Beach, California; and General Aluminum Forge (“Colorado Springs”) is located in Colorado Springs, Colorado. On July 23, 2013, the Company completed the purchase of the forging business and substantially all related operating assets from MW General, Inc. (DBA General Aluminium Forgings), which business is operated in General Aluminum Forge's Colorado Springs, Colorado facility. This portion of the Company’s business consists principally of the manufacture of aluminum forged components for applications primarily in the commercial aerospace market.
SIFCO’s continued migration toward more commercial business and decreased dependence on military business has further supported its strategic vision. In fiscal 2014, commercial and military revenues accounted for 55.9% and 44.1% of revenues, respectively, compared with 52.4% and 50.2% in commercial revenues and 47.6% and 49.8% military revenues in fiscal 2013 and 2012, respectively. The Company has expanded its capabilities to be a supplier of forged and machined components of aluminum, titanium, steel and other exotic metals.
2
Industry
The performance of the domestic and international air transport industry and the energy industry, as well as government defense spending, directly and significantly impact the performance of SIFCO.
• | SIFCO supplies new and spare components for commercial aircraft, principally for large aircraft produced by Boeing and Airbus. A continued increase in passenger travel demand will drive backlog for new aircraft. Demand for more fuel-efficient aircraft, particularly the Boeing 737Max and 787 and the Airbus A320neo and A350, remains strong despite oil prices moderating recently. |
• | SIFCO also supplies new and spare components to the U.S. military for aircraft, helicopters, vehicles, and ammunition. While the defense budget in the United States has shrunk due to the reduced armed conflict in Iraq and Afghanistan and concerns over product affordability, the demand for certain programs in which the Company participates has been more favorable. |
• | SIFCO supplies new and spare components to the energy industry, particularly the industrial gas turbine market. The industrial gas turbine market is projecting flat near-term growth and stable long-term OEM growth. The demand in the maintenance, repair and overhaul market should remain strong. The shale gas boom continues, which should benefit the market for gas turbines through continued investment in natural gas plants for power generation. |
Competition
SIFCO competes with numerous companies, approximately fifteen of which are known by SIFCO, and some of which are non-U.S. based companies. Many of these companies focus within the A&E markets. While there has been some consolidation in the forging industry, SIFCO believes there is limited opportunity to increase prices, other than for the pass-through of raw material price increases and valued added services. SIFCO believes that it has an advantage in the primary markets it serves due to: (i) demonstrated A&E expertise; (ii) focus on quality and customer service; (iii) operating initiatives such as SMART (Streamlined Manufacturing Activities to Reduce Time/Cost) and Six Sigma; and (iv) offering a broad range of capabilities. SIFCO competes with both U.S. and non-U.S. suppliers of forgings, some of which are significantly larger than SIFCO. As customers establish new facilities throughout the world, SIFCO will continue to encounter non-U.S. competition. SIFCO believes it can expand its markets by (i) acquiring additional forging operations; (ii) broadening its product lines through investment in equipment that expands its manufacturing capabilities; and (iii) developing new customers in markets where the participants require similar technical competence and service as those in the A&E industries and who are willing to pay a premium for quality and service.
Customers
During fiscal 2014, SIFCO had three customers, consisting of various business units of United Technologies Corporation, General Electric Corporation, and Textron, Inc., which accounted for 24%, 15% and 11%, respectively, of consolidated net sales. The net sales to these three customers, and to their direct subcontractors, accounted for 50% of consolidated net sales in fiscal 2014. SIFCO believes that the loss of sales to such customers would result in a materially adverse impact on the business and its income. However, SIFCO has maintained a business relationship with many of these customers for several years and is currently conducting business with some of them under multi-year agreements. Although there is no assurance that this will continue, historically, as one or more major customers have reduced their purchases, SIFCO has generally been successful in replacing such reduced purchases, thereby avoiding a material adverse impact on SIFCO. SIFCO attempts to rely on its ability to adapt its services and operations to changing requirements of the market in general and its customers in particular. No material part of SIFCO’s business is seasonal. For additional financial information about geographic areas refer to Note 10 of the consolidated financial statements included in Item 8.
Backlog of Orders
SIFCO’s backlog as of September 30, 2014 decreased to $86.7 million, of which $71.7 million is scheduled for delivery during fiscal 2015, compared with $99.9 million as of September 30, 2013, of which $83.4 million was scheduled for delivery during fiscal 2014. Orders may be subject to modification or cancellation by the customer with limited charges. The decrease in the backlog as of September 30, 2014 compared to September 30, 2013 is primarily attributed to fewer orders from an energy components customer. The backlog amount may not necessarily be indicative of expected future sales.
2. Other
In fiscal 2013, the Company discontinued its Turbine Component Services and Repair ("Repair Group") operations. The Repair Group had a single operation in Minneapolis, Minnesota, and this segment of the Company’s business consisted of the repair and remanufacture of small turbine engine components principally for aerospace applications. As a part of the repair and remanufacture
3
process, the business performed precision component machining and applied high temperature-resistant coatings to turbine engine components. In fiscal 2013, the Company also divested its Applied Surface Concepts ("ASC") business. ASC previously provided surface enhancement technologies principally related to selective plating and anodizing. Principal product offerings included (i) the development, production and sale of metal plating solutions and equipment required for selective plating and (ii) providing selective plating contract services. See Note 13 to the consolidated financial statements included in Item 8 for more details on discontinued operations.
C. | Environmental Regulations |
The Company is required to comply with various laws and regulations relating to the protection of the environment. The costs of such compliance have not had, and are not presently expected to have, a material effect on the capital expenditures, earnings or competitive position of the Company and its subsidiaries under existing regulations and interpretations.
D. | Employees |
The number of SIFCO employees decreased from approximately 538 at the beginning of fiscal 2014 to approximately 465 employees at the end of fiscal 2014. The Company is a party to collective bargaining agreements with certain employees located at the Cleveland (expires in May 2015) and Alliance (expires in July 2017) facilities.
E. | Non-U.S. Operations |
As of September 30, 2014, essentially all of the Company’s cash and cash equivalents are in the possession of its non-operating Irish subsidiary and relate to undistributed earnings of the Irish subsidiary. Distributions from the Company’s non-operating Irish subsidiary to the Company may be subject to statutory restrictions, adverse tax consequences or other limitations.
The Company previously operated service and distribution facilities in the United Kingdom, France and Sweden prior to the divestiture of these operations from the sale of the Applied Surface Concepts segment in fiscal 2013. Further discussion about the divestiture is set forth in Note 13 to the consolidated financial statements included in Item 8.
F.Available Information
The Company files annual, quarterly, and current reports, proxy statements, and other documents with the SEC under the Securities Exchange Act of 1934. The public may read and copy any materials filed with the SEC at the SEC’s Public Reference Room at 100 F Street, N.E., Washington, D.C. 20549. The public may obtain information on the operation of the Public Reference Room by calling the SEC at 1-800-SEC-0330. Also, the SEC maintains an Internet website that contains reports, proxy and information statements, and other information regarding issuers that file electronically with the SEC. The public can obtain any documents that are filed by the Company at http://www.sec.gov.
In addition, our annual reports on Form 10-K, as well as our quarterly reports on Form 10-Q, current reports on Form 8-K and any amendments to all of the foregoing reports, are made available free of charge on or through the “Investor Relations” section of our website at www.sifco.com as soon as reasonably practicable after such reports are electronically filed with or furnished to the SEC.
Information relating to our corporate governance at SIFCO, including the Audit Committee, Corporate Governance and Nominating Committee and Compensation Committee Charters, as well as the Corporate Governance Guidelines and Policies and the Code of Conduct & Ethics adopted by our Board of Directors, is available free of charge on or through the “Investor Relations” section of our website at www.sifco.com. References to our website or the SEC’s website do not constitute incorporation by reference of the information contained on such websites, and such information is not part of this Form 10-K.
Item 1A. Risk Factors
This Form 10-K, including Item 1A ("Risk Factors"), may contain various forward-looking statements and includes assumptions concerning the Company’s operations, future results and prospects. These forward-looking statements are based on current expectations and are subject to risk and uncertainties. In connection with the “safe harbor” provisions of the Private Securities Litigation Reform Act of 1995, the Company provides this cautionary statement identifying important economic, political and technological factors, among others, the absence or effect of which could cause the actual results or events to differ materially from those set forth in or implied by the forward-looking statements and related assumptions. Such factors include the following: (1) the impact on business conditions in general, and on the demand for product in the A&E industries in particular, of the global economic outlook, including the continuation of military spending at or near current levels and the availability of capital and
4
liquidity from banks and other providers of credit; (2) the future business environment, including capital and consumer spending; (3) competitive factors, including the ability to replace business that may be lost; (4) metals and commodities price increases and the Company’s ability to recover such price increases; (5) successful development and market introduction of new products and services; (6) continued reliance on consumer acceptance of regional and business aircraft powered by more fuel efficient turboprop engines; (7) continued reliance on military spending, in general, and/or several major customers, in particular, for revenues; (8) the impact on future contributions to the Company’s defined benefit pension plans due to changes in actuarial assumptions, government regulations and the market value of plan assets; (9) stable governments, business conditions, laws, regulations and taxes in economies where business is conducted; and (10) the ability to successfully integrate businesses that may be acquired into the Company’s operations.
In addition to the other information in this Form 10-K and our other filings with the SEC, the following risk factors should be carefully considered in evaluating us and our business before investing in our common stock. The risks and uncertainties described below are not the only ones facing us and are not listed in any order of magnitude or likelihood of occurrence. Additional risks and uncertainties, not presently known to us or otherwise, may also impair our business. If any of the risks actually occur, our business, financial condition or results of operations could be materially and adversely affected. In that case, the trading price of our common stock could decline, and investors may lose all or part of their investment. All written and verbal descriptions of our business, operations and assets and all forward-looking statements attributable to the Company or any person acting on the Company’s behalf are expressly qualified in their entirety by the risks, uncertainties, and cautionary statements contained herein.
Global economic conditions may adversely impact our business, operating results or financial condition.
Disruption and volatility in global financial markets may lead to increased rates of default and bankruptcy and may negatively impact consumer spending levels. These macroeconomic developments could adversely affect our business, operating results or financial condition. Current or potential customers may delay or decrease spending on our products and services as their business and/or budgets are impacted by economic conditions. The inability of current and potential customers to pay SIFCO for its products and services may adversely affect its earnings and cash flows.
Government spending priorities and terms may change in a manner adverse to our business.
At times, our military business has been adversely affected by significant changes in U.S. defense and national security budgets. Budget changes that result in a decline in overall spending, program delays, program cancellations or a slowing of new program starts on programs in which we participate could materially adversely affect our business, prospects, financial condition or results of operations. Future levels of expenditures and authorizations for defense-related programs by the U.S. government may decrease, remain constant or shift to programs in areas where we do not currently provide products, thereby reducing the chances that we will be awarded new contracts.
SIFCO has contracts for programs where the period of performance may exceed one year. Congress and certain foreign governments must usually approve funds for a given program each fiscal year and may significantly reduce funding of a program in a particular year. Significant reductions in these appropriations or the amount of new defense contracts awarded may affect our ability to complete contracts, obtain new work and grow our business. Congress does not always enact spending bills by the beginning of the new fiscal year. Such delays leave the affected agencies under-funded, which delay their ability to contract. Future delays and uncertainties in funding could impose additional business risks on us.
A deadlock in the U.S. Congress over budgets and spending could cause another partial shutdown of the U.S. government, which could result in a termination or suspension of some or all of our contracts with suppliers to the U.S. government.
Congress may fail to pass a budget or continuing resolution, which would result in a partial shutdown of the U.S. government and cause the termination or suspension of our contracts with suppliers to the U.S. government. SIFCO would be required to furlough affected employees for an indefinite time. It is uncertain in such a circumstance if we would be compensated or reimbursed for any loss of revenue during such a shutdown. If we were not compensated or reimbursed, it could result in significant adverse effects on our revenues, operating costs and cash flows.
Further consolidation in the aerospace industry could adversely affect our business and financial results.
The aerospace and defense industry is experiencing significant consolidation, including among its customers, competitors and suppliers. Consolidation among our customers in the industry may result in delays in the award of new contracts and losses of existing business for SIFCO. Consolidation among our competitors may result in larger competitors with greater resources and market share, which could adversely affect our ability to compete successfully. Consolidation among our suppliers may result in fewer sources of supply and increased cost to SIFCO.
5
Changes in future business or other market conditions could cause business investments and/or recorded goodwill or other long- term assets to become impaired, resulting in substantial losses and write-downs that would reduce our results of operations.
As part of our strategy, we will, from time to time, acquire a business. These investments are made upon careful analysis and due diligence procedures designed to achieve a desired return or strategic objective. These procedures often involve certain assumptions and judgment in determining acquisition price. After acquisition, unforeseen issues could arise that adversely affect the anticipated returns, or which are otherwise not recoverable as an adjustment to the purchase price. Even after diligent integration efforts, actual operating results may vary significantly from initial estimates. We evaluate the recorded goodwill balances for potential impairment annually as of July 31, or when circumstances indicate that the carrying value may not be recoverable. The goodwill impairment test is performed by comparing the fair value of each reporting unit to its carrying value, including recorded goodwill. Any future impairment could result in substantial losses and write-downs that would reduce our results of operations.
We are subject to the cyclical nature of the aerospace and energy industries and any future downturn in these industries could adversely impact the demand for our products.
Our business may be affected by certain characteristics and trends of the A&E market that affect its customers, such as fluctuations in the aerospace industry’s business cycle, varying fuel and labor costs, intense price competition and regulatory scrutiny, a possible decrease in aviation activity, a decrease in outsourcing by aircraft manufacturers or the failure of projected market growth to materialize or continue. In the event that these characteristics and trends adversely affect customers in the aerospace industry, they may reduce the overall demand for our products.
Failure to retain existing contracts or win new contracts under competitive bidding processes may adversely affect our sales.
SIFCO obtains most of its contracts through a competitive bidding process, and substantially all of the business that we expect to seek in the foreseeable future likely will be subject to a competitive bidding process. Competitive bidding presents a number of risks, including:
• | the need to compete against companies or teams of companies with more financial and marketing resources and more experience in bidding on and performing major contracts than we have; |
• | the need to compete against companies or teams of companies that may be long-term, entrenched incumbents for a particular contract for which we are competing and that have, as a result, greater domain expertise and better customer relations; |
• | the need to compete to retain existing contracts that have in the past been awarded to us on a sole-source basis or that have been incumbent for a long time; |
• | the award of contracts to providers offering solutions at the “lowest price technically acceptable,” which may lower the profit we may generate under a contract awarded using this pricing method or prevent us from submitting a bid for such work due to us deeming such work to be unprofitable; |
• | the reduction of margins achievable under any contracts awarded to us; |
• | the need to bid on some programs in advance of the completion of their specifications, which may result in unforeseen technological difficulties or increased costs that lower our profitability; |
• | the substantial cost and managerial time and effort, including design, development and marketing activities, necessary to prepare bids and proposals for contracts that may not be awarded to us; |
• | the need to develop, introduce and implement new and enhanced solutions to our customers’ needs; |
• | the need to locate and contract with teaming partners and subcontractors; and |
• | the need to accurately estimate the resources and cost structure that will be required to perform any contract that we are awarded. |
If SIFCO wins a contract, and upon expiration, the customer requires further services of the type provided by the contract, there is frequently a competitive rebidding process. There can be no assurance that we will win any particular bid, that we will win the contract at the same profit margin, or that we will be able to replace business lost upon expiration or completion of a contract.
If SIFCO is unable to consistently retain existing contracts or win new contract awards, our business, prospects, financial condition and results of operations may be adversely affected.
We may not receive the full amounts estimated under the contracts in our total backlog, which could reduce our sales in future periods below the levels anticipated, and which makes backlog an uncertain indicator of future operating results.
As of September 30, 2014, the total backlog was $86.7 million. Orders may be canceled and scope adjustments may occur, and we may not realize the full amounts of sales that we may anticipate in our backlog numbers. Additionally, the timing of receipt
6
of sales, if any, on contracts included in our backlog could change. The failure to realize amounts reflected in our backlog could materially adversely affect our business, financial condition and results of operations in future periods.
Our failure to identify, attract and retain qualified personnel could adversely affect our existing business, financial condition and results of operations.
SIFCO may not be able to identify, attract or retain qualified technical personnel, sales and customer service personnel, employees with expertise in forging, or management personnel to supervise such activities. We may also not attract and retain employees who share the Company's core values, can maintain and grow our existing business, and are suited to work in a public company environment, which could adversely affect our financial condition and results of operations.
Our business could be negatively affected by cyber or other security threats or other disruptions.
SIFCO faces cyber threats, threats to the physical security of our facilities and employees, including senior executives, and terrorist acts, as well as the potential for business disruptions associated with information technology failures, damaging weather or other acts of nature, and pandemics or other public health crises, which may adversely affect our business.
SIFCO experiences cyber security threats, threats to our information technology infrastructure and attempts to gain access to the Company's sensitive information, as do our customers, suppliers and subcontractors. SIFCO may experience similar security threats at customer sites that we operate and manage as a contractual requirement.
Prior cyber-attacks directed at us have not had a material impact on our financial results, and we believe our threat detection and mitigation processes and procedures are robust. Due to the evolving nature of these security threats, however, the impact of any future incident cannot be predicted.
Although SIFCO works cooperatively with our customers and our suppliers and subcontractors to seek to minimize the impacts of cyber threats, other security threats or business disruptions, in addition to our internal processes, procedures and systems, it must also rely on the safeguards put in place by those entities.
The costs related to cyber or other security threats or disruptions may not be fully mitigated by insurance or other means. The occurrence of any of these events could adversely affect our internal operations, the services we provide to customers, our competitive advantages, our future financial results, our reputation, our stock price, and lead to early obsolescence of our products and services. The occurrence of any of these events could also result in civil and/or criminal liabilities.
We rely on our suppliers to meet the quality or delivery expectations of our customers.
The ability to deliver SIFCO's products and services on schedule is dependent upon a variety of factors, including execution of internal performance plans, availability of raw materials, internal and supplier produced parts and structures, conversion of raw materials into parts and assemblies, and performance of suppliers and others. We rely on numerous third-party suppliers for raw materials and a large proportion of the components used in our production process. Certain of these raw materials and components are available only from single sources or a limited number of suppliers, or similarly, customers’ specifications may require SIFCO to obtain raw materials and/or components from a single source or certain suppliers. Many of our suppliers are small companies with limited financial resources and manufacturing capabilities. We do not currently have the ability to manufacture these components ourselves. Consequently, we risk disruptions in our supply of key products and components if our suppliers fail or are unable to perform because of shortages in raw materials, operational problems, strikes, natural disasters, financial condition or other factors. We may have disputes with our vendors arising from, among other things, the quality of products and services or customer concerns about the vendor. If any of our vendors fail to timely meet their contractual obligations or have regulatory compliance or other problems, our ability to fulfill our obligations may be jeopardized. Economic downturns can adversely affect a vendor’s ability to manufacture or deliver products. Further, vendors may also be enjoined from manufacturing and distributing products to us as a result of litigation filed by third parties, including intellectual property litigation. If SIFCO were to experience difficulty in obtaining certain products, there could be an adverse effect on its results of operations and on its customer relationships and our reputation. Additionally, our key vendors could also increase pricing of their products, which could negatively affect our ability to win contracts by offering competitive prices.
Any material supply disruptions could adversely affect our ability to perform our obligations under our contracts and could result in cancellation of contracts or purchase orders, penalties, delays in realizing revenues, and payment delays, as well as adversely affect our ongoing product cost structure.
7
Failure to perform by our subcontractors could materially and adversely affect our contract performance and our ability to obtain future business.
Our performance of contracts often involves subcontractors, upon which we rely to complete delivery of products to our customers. SIFCO may have disputes with subcontractors. A failure by a subcontractor to satisfactorily deliver products can adversely affect our ability to perform our obligations as a prime contractor. Any subcontractor performance deficiencies could result in the customer terminating our contract for default, which could expose us to liability for excess costs of re-procurement by the customer and have a material adverse effect on our ability to compete for other contracts.
Our future success will depend on our ability to meet the needs of our customer requirements in a timely manner.
We believe that the commercial A&E markets in which we operate are changing toward more sophisticated manufacturing and system-integration techniques and capabilities using composite and metallic materials. Our future success depends to a significant extent on our ability to acquire and/or develop and execute such sophisticated techniques and capabilities to meet the needs of our customers and to bring those products to market quickly and at cost-effective prices. Accordingly, our performance depends on a number of factors, including our ability to:
• | identify emerging trends in our current and target markets; |
• | develop and maintain competitive products and capabilities that meet our customers' requirements; and |
• | develop, manufacture and bring to market cost-effective offerings in the most efficient manner. |
If we are unable to acquire and/or develop and execute such techniques and capabilities, we may experience an adverse effect to our business, financial condition or results of operation.
The terms of our financing arrangements may restrict our financial and operational flexibility, including our ability to invest in new business opportunities.
The Company currently has a $30.0 million secured revolving credit agreement that expires in October 2016.
We also have a $10.0 million term loan, secured by substantially all the assets of the Company and its U.S. subsidiaries and a pledge of 65% of the stock of our non-U.S. subsidiary. The term loan is repayable in quarterly installments of $0.5 million, which began December 2011. As of September 30, 2014, the loan balance was $4.0 million.
The loans are subject to certain customary financial covenants, including, without limitation, covenants that require us to not exceed a maximum leverage ratio and to maintain a minimum fixed charge coverage ratio. In the event of a default, we would not be able to access our revolver, which could impact the ability to fund working capital needs, capital expenditures and invest in new business opportunities.
We face certain significant risk exposures and potential liabilities that may not be covered adequately by insurance or indemnity.
We are exposed to liabilities that are unique to the products we provide. While we maintain insurance for certain risks, the amount of insurance or indemnity may not be adequate to cover all claims or liabilities, and we may be forced to bear substantial costs from an accident or incident. It also is not possible for SIFCO to obtain insurance to protect against all operational risks and liabilities. Substantial claims resulting from an incident in excess of the indemnification we receive and our insurance coverage would harm our financial condition, results of operations and cash flows. Moreover, any accident or incident for which we are liable, even if fully insured, could negatively affect our standing with our customers and the public, thereby making it more difficult for us to compete effectively, and could significantly impact the cost and availability of adequate insurance in the future.
We may acquire other companies, which could increase our levels of debt, increase costs or liabilities, require alternative forms of capital, increase competition, or be disruptive to our business.
Part of our strategy involves the acquisition of other companies. For example, in July 2013, we completed the purchase of the forging business and substantially all related operating assets from MW General, Inc. We cannot ensure that we will be able to integrate acquired companies successfully without substantial expense, delay or operational or financial problems. Such expenses, delays or operational or financial problems may include the following:
• | we may need to divert management resources to integration, which may adversely affect our ability to pursue other more profitable activities; |
• | integration may be difficult as a result of the necessity of coordinating geographically separated organizations, |
8
integrating personnel with disparate business backgrounds and combining different corporate cultures;
• | we may not be able to eliminate redundant costs anticipated at the time we select acquisition candidates; and |
• | one or more of our acquisition candidates may have unexpected liabilities, fraud risk, or adverse operating issues that we fail to discover through our due diligence procedures prior to the acquisition. |
As a result, the integration of acquired businesses may be costly and may adversely impact our results of operations and financial condition.
The funding and costs associated with our pension plans and significant changes in key estimates and assumptions, such as discount rates and assumed long-term returns on assets, actual investment returns on our pension plan assets, and legislative and regulatory actions could affect our earnings, equity and contributions to our pension plans in future periods.
Certain of our employees are covered by its noncontributory defined benefit pension plans ("Plans"). The impact of these Plans on our GAAP earnings may be volatile in that the amount of expense we record for our pension plans may materially change from year to year because those calculations are sensitive to changes in several key economic assumptions, including discount rates, inflation, salary growth, expected return on plan assets, retirement rates and mortality rates. These pension costs are dependent on significant judgment in the use of various estimates and assumptions, particularly with respect to the discount rate and expected long-term rates of return on plan assets. Changes to these estimates and assumptions could have a material adverse effect on our financial position, results of operations or cash flows. Differences between actual investment returns and our assumed long-term returns on assets will result in changes in future pension expense and the funded status of our Plans, and could increase future funding of the Plans. Changes in these factors affect our plan funding, cash flows, earnings, and shareholders’ equity.
The price of our common stock may fluctuate significantly.
An active, liquid and orderly market for our common stock may not be sustained, which could depress the trading price of our common stock.
Volatility in the market price of our common stock may prevent you from being able to sell your shares at or above the price you paid for your shares or at all. The market price of our common stock could fluctuate significantly for various reasons, which include:
• | our quarterly or annual earnings or those of our competitors; |
• | the public’s reaction to our press releases, our other public announcements and our filings with the Securities and Exchange Commission; |
• | changes in earnings estimates or recommendations by research analysts who track the stocks of our competitors; |
• | new laws or regulations or new interpretations of laws or regulations applicable to our business; |
• | changes in accounting standards, policies, guidance, interpretations or principles; |
• | changes in general conditions in the domestic and global economies or financial markets, including those resulting from war, incidents of terrorism or responses to such events; |
• | litigation involving our company or investigations or audits by regulators into the operations of our company or our competitors; |
• | strategic action by our competitors; and |
• | sales of common stock by our directors, executive officers and significant shareholders. |
In addition, the stock market in general has experienced extreme price and volume fluctuations that have often been unrelated or disproportionate to the operating performance of those companies. Broad market and industry factors may seriously affect the market price of our common stock, regardless of actual operating performance. In addition, in the past, following periods of volatility in the overall market and the market price of a particular company’s securities, securities class action litigation has often been instituted against these companies. If litigation is instituted against us, it could result in substantial costs and a diversion of our management’s attention and resources.
If we are unable to pay annual dividends at the targeted level, our reputation and stock price may be harmed.
The dividend program requires the use of a portion of our cash flows. Our ability to continue to pay annual dividends will depend in large part on our ability to generate sufficient cash flows from operations in the future. This ability may be subject to certain economic, financial, competitive and other factors that are beyond our control. The board of directors may, at its discretion, decrease the targeted annual dividend amount or entirely discontinue the payment of dividends at any time. Any failure to pay dividends after we have announced the intention to do so may adversely affect our reputation and investor confidence in SIFCO and negatively impact our stock price.
9
If we fail to maintain an effective system of internal control over financial reporting, we may not be able to accurately report our financial results. As a result, current and potential shareholders could lose confidence in our financial reporting, which would harm our business and the trading price of our common stock.
In connection with our assessment of the effectiveness of our internal control over financial reporting as of September 30, 2014, we concluded there were two material weaknesses in internal controls over financial reporting related to identified control deficiencies with respect to the precision and sufficiency of reviews performed on reconciliations and calculations around inventory related items and certain segregation of duties issues surrounding information technology at one facility. Under standards established by the Public Company Accounting Oversight Board, a material weakness is a deficiency, or combination of deficiencies, in internal control over financial reporting, such that there is a reasonable possibility that a material misstatement of our annual or interim financial statements will not be prevented or detected or corrected on a timely basis.
We have taken steps and plan to take additional measures to remediate the underlying causes of the material weaknesses, primarily through the continued development and implementation of formal policies, improved processes and documented procedures, as well as changes in our software. The actions that we are taking are subject to ongoing senior management review, as well as audit committee oversight. Although we plan to complete this remediation as quickly as possible, we cannot at this time estimate how long it will take, and our initiatives may not prove to be successful in remediating this material weakness. As with any material weakness, our remedial measures are insufficient to address the material weaknesses, or if additional material weaknesses or significant deficiencies in our internal control over financial reporting are discovered or occur in the future, our consolidated financial statements may contain material misstatements and we could be required to restate our financial results.
Increased competition from low-cost providers and customer pricing pressures could reduce the demand and/or price for our products and services.
The aerospace and non-aerospace end-use markets SIFCO serves are highly competitive and price sensitive. In both of these markets, we compete worldwide with a number of domestic and international companies that have substantially greater manufacturing, purchasing, marketing and financial resources than we do. Many of SIFCO's customers have the in-house capability to fulfill their manufacturing requirements. SIFCO's larger competitors may be able to vie more effectively for very large-scale contracts than we can by providing different or greater capabilities or benefits such as technical qualifications, past performance on large-scale contracts, geographic presence, price and availability of key professional personnel. If SIFCO is unable to successfully compete for new business, our net sales growth and operating margins may decline. Several of SIFCO's major customers have completed extensive cost containment efforts and SIFCO expects continued pricing pressures in 2015 and beyond. Competitive pricing pressures may have an adverse effect on our financial condition and operating results. Further, there can be no assurance that competition from existing or potential competitors will not have a material adverse effect on our financial results. If SIFCO does not continue to compete effectively and win contracts, our future business, financial condition, results of operations and our ability to meet its financial obligations may be materially compromised.
The occurrence of litigation where we could be named as a defendant is unpredictable.
From time to time, we are involved in various legal and other proceedings that are incidental to the conduct of our business. While we believe no current proceedings, if adversely determined, could have a material adverse effect on our financial results, no assurances can be given. Any such claims may divert financial and management resources that would otherwise be used to benefit our operations and could have a material adverse effect on our financial results.
Damage or destruction of our facilities caused by storms, earthquakes or other causes could adversely affect our financial results and financial condition.
We have operations located in regions of the U.S. that may be exposed to damaging storms, earthquakes and other natural disasters. Although we maintain standard property casualty insurance covering our properties and may be able to recover costs associated with certain natural disasters through insurance, we do not carry any earthquake insurance based on our assessment of the potential risk to our equipment and facilities. Two of our properties are located in Southern California, an area subject to earthquake activity. Even if covered by insurance, any significant damage or destruction of our facilities due to storms, earthquakes or other natural disasters could result in its inability to meet customer delivery schedules and may result in the loss of customers and significant additional costs to SIFCO. Thus, any significant damage or destruction of our properties could have a material adverse effect on our business, financial condition or results of operations.
10
Labor disruptions by our employees could adversely affect our business.
As of September 30, 2014, we employed approximately 465 people. Two of our operating locations are parties to collective bargaining agreements, covering 115 full time hourly employees and 36 full time hourly employees, and will expire May 2015 and July 2017, respectively. Although we have not experienced any material labor-related work stoppage and consider our relations with our employees to be good, labor stoppages may occur in the future. If the unionized workers were to engage in a strike or other work stoppage, if SIFCO is unable to negotiate acceptable collective bargaining agreements with the unions or if other employees were to become unionized, we could experience a significant disruption of our operations, higher ongoing labor costs and possible loss of customer contracts, which could have an adverse effect on our business and results of operations.
Market volatility and adverse capital or credit market conditions may affect our ability to access cost-effective sources of funding and may expose SIFCO to risks associated with the financial viability of suppliers.
The financial markets can experience high levels of volatility and disruption, reducing the availability of credit for certain issuers. We sometimes access these markets to support certain business activities, including acquisitions and capital expansion projects, obtaining credit support for our workers' compensation self-insurance program and refinancing existing indebtedness. Depending on the condition of the capital or credit markets existing at the time, we may be unable in the future to obtain capital market financing or bank financing on favorable terms, or at all, which could have a material adverse effect on our financial position, results of operations or cash flows.
Tightening credit markets could also adversely affect our suppliers' ability to obtain financing. Delays in suppliers' ability to obtain financing, or the unavailability of financing, could negatively affect their ability to perform their contracts with SIFCO and cause our inability to meet our contract obligations. The inability of our suppliers to obtain financing could also result in the need for us to transition to alternate suppliers, which could result in significant incremental costs and delays.
Unanticipated changes in our tax provisions or exposure to additional income tax liabilities could affect our profitability and cash flow.
We are subject to income taxes in the United States. Significant judgment is required in determining our provision for income taxes. In the ordinary course of business, there are many transactions and calculations where the ultimate tax determination is uncertain. Changes in applicable income tax laws and regulations, or their interpretation, could result in higher or lower income tax rates or changes in the taxability of certain sales or the deductibility of certain expenses, thereby affecting our income tax expense and profitability. In addition, the final results of any tax audits or related litigation could be materially different from our related historical income tax provisions and accruals. Additionally, changes in our tax rate as a result of changes in our overall profitability, changes in tax legislation, changes in the valuation of deferred tax assets and liabilities, changes in differences between financial reporting income and taxable income, the examination of previously filed tax returns by taxing authorities and continuing assessments of our tax exposures can also impact our tax liabilities and affect our income tax expense, profitability and cash flow.
We use estimates when pricing contracts and any changes in such estimates could have an adverse effect on our profitability and our overall financial performance.
When agreeing to contractual terms, we make assumptions and projections about future conditions and events, many of which extend over long periods. These projections assess the productivity and availability of labor, complexity of the work to be performed, cost and availability of materials, impact of delayed performance and timing of product deliveries. Contract pricing requires judgment relative to assessing risks, estimating contract revenues and costs, and making assumptions for schedule and technical issues. Due to the size and nature of many of our contracts, the estimation of total revenues and costs at completion is complicated and subject to many variables. For example, assumptions are made regarding the length of time to complete a contract since costs also include expected increases in wages, prices for materials and allocated fixed costs. Similarly, assumptions are made regarding the future impact of our efficiency initiatives and cost reduction efforts. Incentives, awards or penalties related to performance on contracts are considered in estimating revenue and profit rates and are recorded when there is sufficient information to assess anticipated performance. Suppliers' assertions are also assessed and considered in estimating costs and profit rates.
Because of the significance of the judgment and estimation processes described above, it is possible that materially different amounts could be obtained if different assumptions were used or if the underlying circumstances were to change. Changes in underlying assumptions, circumstances or estimates may have a material adverse effect upon the profitability of one or more of the affected contracts, future period financial reporting and performance.
11
Our technologies could become obsolete, reducing our revenues and profitability.
The future of our business will depend in large part upon the continuing relevance of our forging capabilities. SIFCO could encounter competition from new or revised technologies that render its technologies and equipment less profitable or obsolete in our chosen markets and our operating results may suffer.
Item 1B. Unresolved Staff Comments
The Company has no unresolved comments.
Item 2. Properties
The Company’s property, plant and equipment include the facilities described below and a substantial quantity of machinery and equipment, most of which consists of industry specific machinery and equipment using special dies, jigs, tools and fixtures and in many instances having automatic control features and special adaptations. In general, the Company’s property, plant and equipment are in good operating condition, are well maintained, and substantially all of its facilities are in regular use. The Company considers its investment in property, plant and equipment as of September 30, 2014 suitable and adequate given the current product offerings for the respective business segments’ operations in the current business environment. The square footage numbers set forth in the following paragraphs are approximations:
• | SIFCO operates in multiple facilities—(i) an owned 240,000 square foot facility located in Cleveland, Ohio, which is also the site of the Company’s corporate headquarters, (ii) a leased 450,000 square foot facility located in Alliance, Ohio, (iii) leased facilities aggregating approximately 67,000 square feet located in Orange and Long Beach, California, and (iv) leased facilities aggregating approximately 18,000 square feet located in Colorado Springs, Colorado. |
• | The Company owns a building located in Cork, Ireland (59,000 square feet) that is subject to a long-term lease arrangement with the acquirer of the Repair Group’s industrial turbine engine component repair business that was sold in June 2007. |
• | The Repair Group owns a building located in Minneapolis, Minnesota with a total of 59,000 square feet that is currently for sale as the Company discontinued the operations at this facility during fiscal 2013. |
Item 3. Legal Proceedings
In the normal course of business, the Company may be involved in ordinary, routine legal actions. The Company cannot reasonably estimate future costs, if any, related to these matters and does not believe any such matters are material to its financial condition or results of operations. The Company maintains various liability insurance coverages to protect its assets from losses arising out of or involving activities associated with ongoing and normal business operations; however, it is possible that the Company’s future operating results could be affected by future costs of litigation.
12
Executive Officers of the Registrant
Set forth below is certain information concerning the executive officers of SIFCO as of September 30, 2014. The executive officers are appointed annually by the Board of Directors.
Name | Age | Title and Business Experience | ||
Michael S. Lipscomb | 68 | President and Chief Executive officer since August 2009 and a director of the Company since April 2010. Mr. Lipscomb previously served as a director of the Company from 2002 to 2006. Mr. Lipscomb is also currently the Chief Executive Officer of Aviation Component Solutions, a supplier of FAA-approved, second source replacement parts for commercial aircraft and engine components. Prior to joining the Company, Mr. Lipscomb was Chairman, President and Chief Executive Officer of Argo-Tech Corporation, which was acquired by Eaton Corporation in 2006, and was a leading maker of high-performance aerospace engine fuel pumps and systems, airframe fuel pumps and systems, and ground fueling for commercial and military aerospace markets, from 1994 to 2007, President from 1990 to 1994, Executive V.P. and Chief Operating Officer from 1988 to 1990, and Vice President of Operations from 1986, when Argo-Tech was formed, to 1988. In 1981, Mr. Lipscomb joined the corporate staff of TRW, a conglomerate manufacturer of industrial bearings in aerospace, automotive, energy and general industrial markets, currently a part of Northrop Grumman Corp., and was appointed Director of Operations for the Power Accessories Division of TRW in 1985. Mr. Lipscomb previously served as a director of Argo-Tech and AT Holdings Corporation from 1990 to 2007. He serves on the boards of Ruhlin Construction Company and Altra Holdings, Inc. He is a former board member of the Aerospace Industries Association and General Aviation Manufacturers Association, an organization that represents the U.S. aerospace and defense industry. | ||
James P. Woidke | 51 | Executive Vice-President and Chief Operating Officer since March 2010. Prior to the assumption of his current role, Mr. Woidke served as General Manager of SIFCO’s Forged Components Group since March, 2006. Prior to joining the Company, Mr. Woidke was the Director of Engineering and Quality as well as Business Unit Manager for Anchor Manufacturing Group, an automotive stamping and assembly manufacturer, from 2003 to 2006. From 1993 to 2003, Mr. Woidke held a number of different positions with Lake Erie Screw Corporation, a manufacturer of specialty fasteners, last serving as Director of Manufacturing Operations. | ||
Catherine M. Kramer | 40 | Vice President, Finance and Chief Financial Officer since January 2013. Prior to the assumption of her current role, Ms. Kramer served as Director of Financial Planning & Analysis of the Company. Prior to joining the Company, Ms. Kramer was Managing Director at Greenstar Capital, LLC, a private equity firm that invests in lower-middle market companies and provides management consulting services, from 2009 to 2012 and Vice President of Strategic Planning from 2007 to 2009. Ms. Kramer was Vice President of Corporate Strategic Planning from 2005 to 2007 and Manager of Finance from 2001 to 2005 at Argo-Tech Corporation, which was acquired by Eaton Corporation in 2006, and was a leading maker of high-performance aerospace engine fuel pumps and systems, airframe fuel pumps and systems, and ground fueling for commercial and military aerospace markets. | ||
Item 4. Mine Safety Disclosures
Not Applicable.
PART II
Item 5. Market for Registrant’s Common Equity, Related Stockholder Matters and Issuer Purchases of Equity Securities
The Company’s Common Shares are traded on the NYSE MKT exchange under the symbol “SIF”. The following table sets forth, for the periods indicated, the high and low closing sales price for the Company’s Common Shares.
Years Ended September 30, | |||||||||||||||
2014 | 2013 | ||||||||||||||
High | Low | High | Low | ||||||||||||
First Quarter | $ | 27.91 | $ | 18.08 | $ | 17.17 | $ | 14.15 | |||||||
Second Quarter | 35.26 | 25.87 | 19.20 | 14.47 | |||||||||||
Third Quarter | 35.61 | 30.22 | 18.25 | 15.16 | |||||||||||
Fourth Quarter | 32.13 | 26.28 | 20.00 | 16.08 | |||||||||||
13
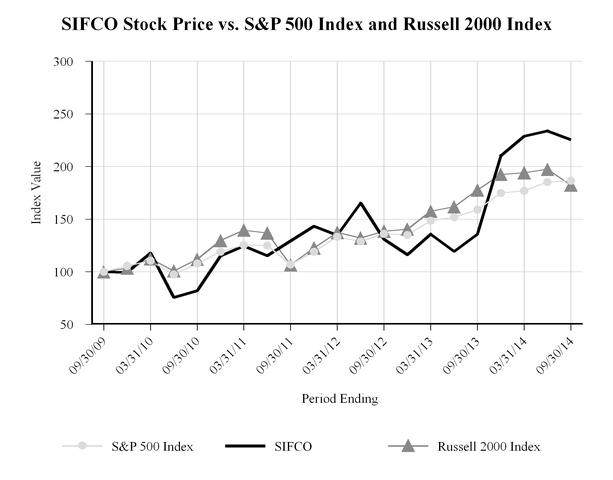
Performance Graph
The following graph compares the cumulative 5-Year total return to shareholders of the Company's Common Shares to the cumulative total returns to shareholders of the S&P Composite - 500 Stock Index and the Russell 2000 Index. The graph assumes that the value of the investment in the Common Shares and in each of the indexes (including the reinvestment of dividends) was $100 on September 30, 2009 and tracks it through September 30, 2014.
Dividends and Shares Outstanding
The Company declared a cash dividend of $0.20 per Common Share in both fiscal 2014 and fiscal 2013. The Company will continue to evaluate the payment of such dividends annually based on its relative profitability and available resources. The Company currently intends to retain a significant majority of its earnings for the operation and growth of its businesses. The Company’s ability to declare or pay cash dividends is limited by its credit agreement covenants and the fact that essentially all of the Company's cash and cash equivalents are in the possession of its non-operating Irish subsidiary and distribution of cash from such subsidiary to the Company may be subject to statutory restrictions, adverse consequences or other limitations. At October 31, 2014, there were approximately 520 shareholders of record of the Company’s Common Shares, as reported by Computershare, Inc., the Company’s Transfer Agent and Registrar, which maintains its U.S. corporate offices at 250 Royall Street, Canton, MA 02021.
Reference Part III, Item 12. “Security Ownership of Certain Beneficial Owners and Management and Related Stockholder Matters” for information related to the Company’s equity compensation plans.
14
Item 6. Selected Financial Data
The following table sets forth selected consolidated financial data of the Company. The data presented below should be read in conjunction with the audited Consolidated Financial Statements and Notes to the Consolidated Financial Statements included in Item 8.
For the Years Ended September 30, | ||||||||||||||||||||
2014 | 2013 (a) | 2012 (b) | 2011 (c) | 2010 | ||||||||||||||||
(Amounts in thousands, except per share data) | ||||||||||||||||||||
Statement of Operations Data: | ||||||||||||||||||||
Net sales | $ | 119,654 | $ | 116,001 | $ | 102,900 | $ | 107,357 | $ | 83,270 | ||||||||||
Income from continuing operations | 5,603 | 9,758 | 6,307 | 7,449 | 5,362 | |||||||||||||||
Per Share Data: | ||||||||||||||||||||
Income per share from continuing operations - basic | $ | 1.04 | $ | 1.82 | $ | 1.19 | $ | 1.41 | $ | 1.01 | ||||||||||
Income per share from continuing operations - diluted | $ | 1.03 | $ | 1.81 | $ | 1.18 | $ | 1.40 | $ | 1.00 | ||||||||||
Cash dividends per share | $ | 0.20 | $ | 0.20 | $ | 0.20 | $ | 0.20 | $ | 0.15 | ||||||||||
Balance Sheet Data: | ||||||||||||||||||||
Total assets | $ | 109,697 | $ | 105,765 | $ | 106,545 | $ | 80,011 | $ | 69,650 | ||||||||||
Long term debt, net of current maturities | 8,429 | 7,381 | 19,683 | 1,186 | 35 | |||||||||||||||
a. | In the fourth quarter of fiscal 2013, the Company decided to exit the Turbine Component Service and Repair business. On July 23, 2013, the Company completed the purchase of the forging business and substantially all related operating assets from MW General, Inc. On December 10, 2012, the Company completed the divestiture of its Applied Surface Concepts business. |
b. | On October 28, 2011, the Company completed the purchase of the forging business and substantially all related operating assets from GEL Industries, Inc. |
c. | On December 10, 2010, the Company completed the purchase of the forging business and substantially all related operating assets from T&W Forge, Inc. |
Item 7. Management’s Discussion and Analysis of Financial Condition and Results of Operations
SIFCO is engaged in the production of forgings and machined components primarily for the aerospace and energy markets. The processes and services include forging, heat-treating and machining. As of the end of fiscal 2014, the Company operates under one business segment: SIFCO.
The Company endeavors to plan and evaluate its business operations while taking into consideration certain factors including the following: (i) the projected build rate for commercial, business and military aircraft, as well as the engines that power such aircraft; (ii) the projected build rate for industrial gas turbine engines; and (iii) the projected maintenance, repair and overhaul schedules for commercial, business and military aircraft, as well as the engines that power such aircraft.
The Company operates within a cost structure that includes a significant fixed component. Therefore, higher net sales volumes are expected to result in greater operating income because such higher volumes allow the business operations to better leverage the fixed component of their respective cost structures. Conversely, the opposite effect is expected to occur at lower net sales and related production volumes.
A. Results of Operations
Non-GAAP Financial Measures
Presented below is certain financial information based on our EBITDA and Adjusted EBITDA. References to “EBITDA” mean earnings from continuing operations before interest, taxes, depreciation and amortization, and references to “Adjusted EBITDA” mean EBITDA plus, as applicable for each relevant period, certain adjustments as set forth in the reconciliations of net income to EBITDA and Adjusted EBITDA.
15
Neither EBITDA nor Adjusted EBITDA is a measurement of financial performance under generally accepted accounting principles in the United States of America (“GAAP”). The Company presents EBITDA and Adjusted EBITDA because it believes that they are useful indicators for evaluating operating performance and liquidity, including the Company’s ability to incur and service debt and it uses EBITDA to evaluate prospective acquisitions. Although the Company uses EBITDA and Adjusted EBITDA for the reasons noted above, the use of these non-GAAP financial measures as analytical tools has limitations. Therefore, reviewers of the Company’s financial information should not consider them in isolation, or as a substitute for analysis of the Company's results of operations as reported in accordance with GAAP. Some of these limitations include:
• | Neither EBITDA nor Adjusted EBITDA reflects the interest expense, or the cash requirements necessary to service interest payments, on indebtedness; |
• | Although depreciation and amortization are non-cash charges, the assets being depreciated and amortized will often have to be replaced in the future, and neither EBITDA nor Adjusted EBITDA reflects any cash requirements for such replacements; |
• | The omission of the substantial amortization expense associated with the Company’s intangible assets further limits the usefulness of EBITDA and Adjusted EBITDA; and |
• | Neither EBITDA nor Adjusted EBITDA includes the payment of taxes, which is a necessary element of operations. |
Because of these limitations, EBITDA and Adjusted EBITDA should not be considered as measures of discretionary cash available to the Company to invest in the growth of its businesses. Management compensates for these limitations by not viewing EBITDA or Adjusted EBITDA in isolation and specifically by using other GAAP measures, such as net income, net sales, and operating profit, to measure operating performance. The Company’s calculation of EBITDA and Adjusted EBITDA may not be comparable to the calculation of similarly titled measures reported by other companies.
The following table sets forth a reconciliation of net income to EBITDA and Adjusted EBITDA:
(Dollars in thousands) | |||||||||||
Years Ended September 30, | |||||||||||
2014 | 2013 | 2012 | |||||||||
Net income | $ | 5,023 | $ | 10,234 | $ | 6,548 | |||||
Less: Income (loss) from discontinued operations, net of tax | (580 | ) | 476 | 241 | |||||||
Income from continuing operations | 5,603 | 9,758 | 6,307 | ||||||||
Adjustments: | |||||||||||
Depreciation and amortization expense | 6,896 | 5,725 | 6,032 | ||||||||
Interest expense, net | 184 | 318 | 444 | ||||||||
Income tax provision | 2,753 | 4,088 | 2,861 | ||||||||
EBITDA | 15,436 | 19,889 | 15,644 | ||||||||
Adjustments: | |||||||||||
Foreign currency exchange (gain) loss, net (1) | (20 | ) | 23 | (16 | ) | ||||||
Other income, net (2) | (433 | ) | (421 | ) | (575 | ) | |||||
Loss (gain) on disposal of operating assets (3) | (3 | ) | (89 | ) | — | ||||||
Inventory purchase accounting adjustments (4) | — | 286 | 437 | ||||||||
Non-recurring severance expense (5) | — | 813 | — | ||||||||
Equity compensation expense (6) | 1,572 | 126 | 892 | ||||||||
Pension settlement expense (7) | — | 248 | 513 | ||||||||
Acquisition transaction-related expenses (8) | 920 | 197 | 407 | ||||||||
LIFO impact (9) | 140 | (1,560 | ) | 1,563 | |||||||
Adjusted EBITDA | $ | 17,612 | $ | 19,512 | $ | 18,865 | |||||
(1) | Represents the gain or loss from changes in the exchange rates between the functional currency and the foreign currency in which the transaction is denominated. |
(2) | Represents miscellaneous non-operating income or expense, primarily rental income from our Irish subsidiary. |
(3) | Represents the difference between the proceeds from the sale of operating equipment and the carrying value shown on the Company’s books. |
16
(4) | Represents accounting adjustments to value inventory at fair market value associated with the acquisition of a business that was charged to cost of goods sold when the inventory was sold. |
(5) | Represents severance expense related to the departure of an executive officer. Included in the $813 is $155 of equity-based compensation expense recognized by the Company under its 2007 Long-term Incentive Plan. |
(6) | Represents the equity-based compensation expense recognized by the Company under its 2007 Long-term Incentive Plan. |
(7) | Represents expense incurred by a defined benefit pension plan related to settlement of pension obligations. |
(8) | Represents transaction-related costs such as legal, financial, tax due diligence expenses, valuation services, costs, and executive travel that are required to be expenses as incurred. |
(9) | Represents the increase (decrease) in the reserve for inventories for which cost is determined using the last in, first out ("LIFO") method. Included in the $140 for fiscal 2014 is an increase in the E&O reserve related to LIFO of $238, partially offset by a decrease in the LIFO inventory reserve of $98. |
Overview
During fiscal 2014, SIFCO continued its strategic path to build a leading A&E company focused on long-term, stable growth and profitability. Since 2010, the Company has broadened its footprint in the industrial gas turbine industry, added more commercial aerospace business and expanded its product offerings through the acquisition of three businesses. Additionally, SIFCO discontinued its Repair Group business and divested its ASC business.
During 2014, SIFCO was added to the Russell Global Index, a reflection of the progress the Company has made. Setting a platform for further growth, the Company chose and is in process of implementing an Enterprise Resource Planning ("ERP") system at its Cleveland plant and Corporate headquarters and invested in cost saving infrastructure in Cleveland.
The Company is in the process of integrating and expanding its Western U.S. facilities to achieve synergies in its aluminum forging business and position itself to support its customers and its growth strategy.
Fiscal Year 2014 Compared with Fiscal Year 2013
Net Sales
The Company's results for fiscal 2014 include the results of Colorado Springs for the entire period versus from the date of its acquisition during fiscal 2013. Net sales in fiscal 2014 increased 3.2% to $119.7 million, compared with $116.0 million in fiscal 2013. The Company produces forged components for (i) turbine engines that power commercial, business and regional aircraft as well as military aircraft and armored military vehicles; (ii) airframe applications for a variety of aircraft; (iii) industrial gas turbine engines for power generation units; and (iv) other commercial applications. Net sales comparative information for fiscal 2014 and 2013, respectively, is as follows:
(Dollars in millions) | Years Ended September 30, | Increase (Decrease) | |||||||||
Net Sales | 2014 | 2013 | |||||||||
Aerospace components for: | |||||||||||
Fixed wing aircraft | $ | 61.2 | $ | 57.7 | $ | 3.5 | |||||
Rotorcraft | 31.9 | 32.5 | (0.6 | ) | |||||||
Energy components for power generation units | 18.6 | 19.4 | (0.8 | ) | |||||||
Commercial product and other revenue | 8.0 | 6.4 | 1.6 | ||||||||
Total | $ | 119.7 | $ | 116.0 | $ | 3.7 | |||||
Overall, net sales for the Company increased $3.7 million in fiscal 2014 compared with fiscal 2013. The increase in fixed wing aircraft sales, due primarily to the acquisition of Colorado Springs, was partially offset by lower rotorcraft sales, resulting from decreased demand in the Black Hawk and V-22 military rotorcraft programs. The Company's lower energy components sales were due to a major customer announcing the closing of a facility, which resulted in decreased demand. The Company's higher commercial products and other revenue sales were due to sales related to a new ordnance program.
Commercial net sales were 55.9% of total net sales and military net sales were 44.1% of total net sales in fiscal 2014, compared with 52.4% and 47.6%, respectively, in the comparable period in fiscal 2013. Although commercial net sales increased in fiscal 2014, it was partially offset by lower sales of the Company's energy components. Military net sales decreased $2.5 million to $52.8 million in fiscal 2014, compared to $55.2 million in fiscal 2013. This was primarily due to the decline in military rotorcraft sales, which was partially offset by an increase in sales due to the new ordnance program. The Company's aerospace components have both military and commercial applications.
17
Cost of Goods Sold
Cost of goods sold increased by $5.7 million, or 6.5%, to $93.7 million during fiscal 2014, compared to $88.0 million in the comparable period of fiscal 2013, primarily due to the additional business as a result of the acquisition of Colorado Springs and higher employee benefits expense.
Gross Profit
Gross profit decreased by $2.1 million, or 7.5%, to $25.9 million during fiscal 2014, compared with $28.0 million in fiscal 2013. Gross margin as a percentage of sales was 21.7% during fiscal 2014, compared with 24.2% in fiscal 2013. The decrease in gross margin as a percentage of sales in fiscal 2014 compared to fiscal 2013 was primarily due to a change in mix within the Company's energy components sales.
Selling, General and Administrative Expenses
Selling, general and administrative expenses increased by $3.4 million to $15.7 million, or 13.1% of net sales, during fiscal 2014, compared to $12.3 million, or 10.6% of net sales, in fiscal 2013. Fiscal 2013 included a $0.8 million non-recurring severance payment to a former executive. Excluding this charge, selling, general and administrative expenses increased by $4.2 million, primarily due to increases in legal and professional costs associated with the Company's Sarbanes-Oxley compliance readiness, higher long-term incentive compensation, an increase in depreciation expense due to accelerating depreciation on certain computer assets targeted to be replaced by an upcoming ERP system installation, the addition of Colorado Springs and increased compensation and benefit costs.
Amortization of Intangibles
Amortization of intangibles was $2.2 million during fiscal 2014, compared with $2.1 million in the comparable period of fiscal 2013.
Other/General
Interest expense decreased to $0.2 million during fiscal 2014, compared with $0.3 million in fiscal 2013.
The following table sets forth the weighted average interest rates and weighted average outstanding balances under the Company’s debt agreements in fiscal 2014 and 2013:
Weighted Average Interest Rate Years Ended September 30, | Weighted Average Outstanding Balance Years Ended September 30, | ||||||||
2014 | 2013 | 2014 | 2013 | ||||||
Revolving credit agreement | 1.0 | % | 1.1 | % | $ 2.5 million | $ 4.0 million | |||
Term note | 2.9 | % | 2.9 | % | $ 4.9 million | $ 7.2 million | |||
Promissory note | 2.0 | % | 2.0 | % | $ 0.4 million | $ 2.4 million | |||
Other income, net consists principally of $0.4 million of rental income earned from the lease of the Cork, Ireland facility for both fiscal 2014 and 2013.
The Company believes that inflation did not materially affect its results of operations in either fiscal 2014 or 2013 and does not expect inflation to be a significant factor in fiscal 2015.
Income Taxes
The Company’s effective tax rate in fiscal 2014 was 33%, compared with 30% in fiscal 2013, and differs from the U.S. federal statutory rate due primarily to (i) the application of foreign tax credits and other U.S. credits in both the current year and in prior year adjustments, (ii) the impact of U.S. state and local income taxes, (iii) a domestic production activities deduction, and (iv) a decrease in the reserve for uncertain tax positions.
Income from Continuing Operations
Income from continuing operations, net of tax decreased by $4.2 million, or 42.6%, to $5.6 million, or 4.7% of net sales, during fiscal 2014, compared with $9.8 million, or 8.4% of net sales, in fiscal 2013 due primarily to the factors noted above.
(Loss)/Income from Discontinued Operations
Loss from discontinued operations, net of tax, was $0.6 million during fiscal 2014, compared with income from discontinued operations of $0.5 million in fiscal 2013. This line item consists of income from discontinued operations related to ASC and the Repair Group. The loss in fiscal 2014 is due to certain minimal continued operating costs associated with the closure of the Repair
18
Group in the first quarter of fiscal 2014. Income in fiscal 2013 was primarily due to the after-tax gain of $2.5 million on the sale of ASC during the first quarter of fiscal 2013, which was partially offset by an after-tax loss of $2.0 million due to the exiting of the Repair Group as of September 30, 2013.
Net Income
Net income decreased by $5.2 million, or 50.9%, to $5.0 million, or 4.2% of net sales, during fiscal 2014, compared with $10.2 million, or 8.8% of net sales, in fiscal 2013. Net income decreased primarily due to higher selling, general and administrative expenses and lower gross margin as noted above.
Fiscal Year 2013 Compared with Fiscal Year 2012
Net Sales
The Company's results for fiscal 2013 include the results of Colorado Springs from the date of its acquisition and the Company's results for fiscal 2012 include the results of Orange from the date of its acquisition. Net sales in fiscal 2013 increased 12.8% to $116.0 million, compared to $102.9 million in fiscal 2012. Net sales comparative information for fiscal 2013 and 2012, respectively, is as follows:
(Dollars in millions) | Years Ended September 30, | Increase (Decrease) | |||||||||
Net Sales | 2013 | 2012 | |||||||||
Aerospace components for: | |||||||||||
Fixed wing aircraft | $ | 57.7 | $ | 52.9 | $ | 4.8 | |||||
Rotorcraft | 32.5 | 28.2 | 4.3 | ||||||||
Components for power generation units | 19.4 | 17.1 | 2.3 | ||||||||
Commercial product sales and other revenue | 6.4 | 4.7 | 1.7 | ||||||||
Total | $ | 116.0 | $ | 102.9 | $ | 13.1 | |||||
The increase in net sales of forged components for fixed wing aircraft and rotorcraft during fiscal 2013 compared to fiscal 2012 is principally due to additional sales volume from its base business, the impact of the acquisition of Colorado Springs during the fourth quarter of fiscal 2013, along with the full year impact in fiscal 2013 of the acquisition of QAF during the first quarter of fiscal 2012. The increase in net sales of components for power generation units is due to organic growth and acquisition related synergies.
Commercial net sales were 52.4% and military net sales were 47.6% in fiscal 2013 compared to 50.2% and 49.8% in fiscal 2012, respectively. The increase in commercial net sales is attributable to higher concentration of commercial sales and the acquisition of Orange. Despite the effect of sequestration, military net sales increased $3.7 million to $55.2 million in fiscal 2013, compared to $51.5 million in fiscal 2012, due to the continued demand of selective programs. The Company's aerospace components have both military and commercial applications.
Cost of Goods Sold
Cost of goods sold increased by $6.9 million, or 8.5%, to $88.0 million during fiscal 2013, compared to $81.1 million in fiscal 2012. The increase in the dollar amount of cost of goods sold in fiscal 2013 compared to fiscal 2012 was primarily due to organic sales growth and increased sales from acquisitions.
Gross Profit
Gross profit increased by $6.2 million, or 28.5%, to $28.0 million during fiscal 2013, compared to $21.8 million in fiscal 2012. Gross margin as a percentage of sales increased by 3.0 percentage points to 24.2% during fiscal 2013, compared to 21.2% in fiscal 2012. The improvement in gross margin as a percentage of sales in fiscal 2013 compared to fiscal 2012 was primarily due to enriched sales mix, lower material costs, and increased plant efficiencies.
Selling, General and Administrative Expenses
Selling, general and administrative expenses increased by $2.4 million, to $12.3 million, or 10.6% of net sales, during fiscal 2013, compared to $9.9 million, or 9.6% of sales, in fiscal 2012. The increase in the dollar amount of selling, general and administrative expenses in fiscal 2013 compared to fiscal 2012 was primarily due to a non-recurring severance payment to a former executive, as well as increases in salary, bonus, and benefit costs. These higher expenses were partially offset by a decrease in equity-based compensation costs.
19
Amortization of Intangibles
Amortization of intangibles decreased by $0.8 million to $2.1 million during fiscal 2013, compared to $2.9 million in fiscal 2012. This was primarily due to certain intangibles associated with prior acquisitions becoming fully amortized during the year. This decrease was partially offset by the start of amortization on the intangibles related to the Colorado Springs acquisition.
Other/General
Interest expense decreased $0.1 million to $0.4 million during fiscal 2013, compared to $0.5 million in fiscal 2012. As described more fully in Note 5 to the consolidated financial statements, the Company borrowed $12.4 million from its revolving credit facility, $10.0 million on a term note, and issued a $2.4 million promissory note to the seller in connection with the October, 2011 acquisition of the Orange business.
The following table sets forth the weighted average interest rates and weighted average outstanding balances under the Company’s debt agreements in fiscal 2013 and 2012:
Weighted Average Interest Rate Years Ended September 30, | Weighted Average Outstanding Balance Years Ended September 30, | ||||||||
2013 | 2012 | 2013 | 2012 | ||||||
Revolving credit agreement | 1.1 | % | 1.3 | % | $ 4.0 million | $ 11.9 million | |||
Term note | 2.9 | % | 2.9 | % | $ 7.2 million | $ 9.0 million | |||
Promissory note | 2.0 | % | 2.0 | % | $ 2.4 million | $ 2.3 million | |||
Other income, net consists principally of $0.4 million of rental income earned from the lease of the Cork, Ireland facility.
The Company believes that inflation did not materially affect its results of operations in either fiscal 2013 or 2012.
Income Taxes
The Company’s effective tax rate in fiscal 2013 was 30%, compared to 31% in fiscal 2012, and differs from the U.S. federal statutory rate due primarily to (i) the impact of U.S. state and local taxes, (ii) domestic production activities deduction, (iii) application of tax credits, and (iv) the recognition of federal income taxes on undistributed earnings of non-U.S. subsidiaries.
Income from Continuing Operations
Income from continuing operations increased by $3.5 million, or 55.5%, to $9.8 million, or 8.4% of net sales, during fiscal 2013, compared to $6.3 million, or 6.1% of net sales, in fiscal 2012 due primarily to the factors noted above.
Income from Discontinued Operations
Income from discontinued operations, net of tax, was $0.5 million during fiscal 2013, compared to income from discontinued operations of $0.2 million in fiscal 2012. This line item consists of income from discontinued operations related to ASC and the Repair Group. The change is primarily due to the after-tax gain of $2.5 million on the sale of ASC during the first quarter of fiscal 2013, which was offset by an after-tax loss of $2.0 million due to the exiting of the Repair Group as of September 30, 2013, as more fully discussed in Item 8, Note 12 to the consolidated financial statements.
Net Income
Net income increased by $3.7 million, or 56.3%, to $10.2 million, or 8.8% of net sales, during fiscal 2013, compared to $6.5 million, or 6.4% of net sales, in fiscal 2012. Net income increased primarily due to the factors noted above.
B. Liquidity and Capital Resources
Cash and cash equivalents increased to $4.6 million at September 30, 2014, compared with $4.5 million at September 30, 2013 and $7.2 million at September 30, 2012. At September 30, 2014, essentially all of the $4.6 million of the Company’s cash and cash equivalents is in the possession of its non-operating Irish subsidiary. In the future, if the Company determines that there is no longer a need to maintain such cash within its non-operating Irish subsidiary, it may elect to distribute such cash to its U.S. operations. Distributions from the Company’s non-operating Irish subsidiary to the Company may be subject to adverse tax consequences.
The Company’s operating activities of continuing operations provided $11.0 million of cash in fiscal 2014 compared with $7.8 million and $9.2 million in fiscal 2013 and 2012, respectively. The $11.0 million of cash provided by operating activities of continuing operations in fiscal 2014 was primarily due to net income of $5.0 million and $7.6 million from the net impact of such
20
non-cash items as depreciation and amortization expense, deferred taxes, equity compensation expense and LIFO effect, partially offset by $2.2 million decrease in operating assets and liabilities. These changes in the components of working capital were due primarily to factors resulting from normal business conditions of the Company, including (i) supporting growth in the business, (ii) the relative timing of sales and collections from customers and (iii) the relative timing of payments to suppliers and tax authorities.
Capital expenditures for the Company were $9.8 million in fiscal 2014 compared with $3.4 million and $2.9 million in fiscal 2013 and 2012, respectively. The increase is attributed to the Company's ERP installation and a large capital investment at the Cleveland plant, which we anticipate will reduce future operating costs. The Company anticipates that total fiscal 2015 capital expenditures will be within a range of $11.0 million to $12.0 million and will relate principally to the expansion of the Orange plant in order to better facilitate the integration of the Colorado Springs operations and administration and further enhancement of production and product offering capabilities. The Company anticipates using the current credit facility to fund future capital expenditures.
In the fourth quarter of fiscal 2014, the Company declared a special cash dividend of $0.20 per common share, which will result in a cash expenditure of $1.1 million during first quarter of fiscal 2015.
As described more fully in Note 12 to the consolidated financial statements included in Item 8, the Company acquired Colorado Springs, a forging business, in July 2013 for approximately $4.4 million at closing payable in cash by drawing on its revolving credit facility. In October 2011, the Company acquired Orange, a forging business, for approximately $24.8 million at closing. The acquisition was financed by borrowing approximately $22.4 million from its bank, which borrowing consisted of a new $10.0 million term loan and drawing approximately $12.4 million from its revolving credit facility. The balance of the acquisition was financed by the Company issuing a $2.4 million promissory note to the seller, which was paid by the Company in November 2013.
In October 2011, the Company entered into an amendment to its existing credit agreement with its bank increasing the maximum borrowing amount from $30.0 million to $40.0 million, of which $10.0 million is a five (5) year term loan and $30.0 million is a five (5) year revolving loan, secured by substantially all the assets of the Company and its U.S. subsidiaries and a pledge of 65% of the stock of its non-U.S. subsidiaries. The term loan is repayable in quarterly installments of $0.5 million starting December 1, 2011. In September 2014, the Company entered into an amendment to its existing credit agreement to revise the definition of the fixed charge coverage ratio.
The term loan has a variable interest rate based on LIBOR, which becomes an effective fixed rate of 2.9% after giving effect to an interest rate swap agreement. Borrowing under the revolving loan bears interest at a rate equal to LIBOR plus 0.75% to 1.75%, which percentage fluctuates based on the Company’s leverage ratio of outstanding indebtedness to EBITDA. The bank loans are subject to certain customary financial covenants including, without limitation, covenants that require the Company to not exceed a maximum leverage ratio and to maintain a minimum fixed charge coverage ratio. There is also a commitment fee ranging from 0.10% to 0.25% to be incurred on the unused balance.
Future cash flows from the Company’s U.S. operations will be used to pay down amounts outstanding under the Company’s credit agreement. The Company believes it has adequate cash/liquidity available to finance its U.S operations from the combination of (i) the Company’s expected cash flows from U.S. operations and (ii) funds available under its existing credit agreement.
As described more fully in Note 13 to the consolidated financial statements included in Item 8, the Company completed its divestiture of the ASC segment in December 2012. The Company received cash proceeds of approximately $8.1 million, net of transaction fees. These proceeds were used to pay down the Company's revolving credit facility. In conjunction with this divestiture, the ASC segment non-U.S. subsidiaries paid a $1.1 million cash dividend to the Company. Proceeds from the dividend were used to pay down the Company's revolving credit facility during the first quarter of fiscal 2013.
C. Off-Balance Sheet Arrangements
In the normal course of business, the Company is party to certain arrangements that are not reflected in the Statement of Consolidated Financial Position. These include an interest rate swap agreement that the Company entered into with its bank, as described more fully in Note 5 to the consolidated financial statements and operating leases as described more fully in Note 9 to the consolidated financial statements, which primarily relate to office space. The Company does not have any obligations that meet the definition of an off-balance sheet arrangement that have had, or are reasonably likely to have, a material effect on the Company’s financial condition or results of operations.
21
D. Contractual Obligations
Contractual Obligations | Payments due by period (in thousands) | ||||||||||||||
Total | Less than 1 year | 1-3 years | 3-5 years | More than 5 years | |||||||||||
Long-term debt obligations | $ | 10,429 | $ | 2,000 | $ | 8,429 | $ | — | $ | — | |||||
Operating lease obligations | 10,622 | 842 | 1,474 | 1,091 | 7,215 | ||||||||||
Other Long-term liabilities reflected on the Registrant's Balance Sheet under GAAP (1) | 1,125 | 1,125 | — | — | — | ||||||||||
Total | $ | 22,176 | $ | 3,967 | $ | 9,903 | $ | 1,091 | $ | 7,215 | |||||
(1) Primarily consists of accrued workers' compensation.
Total contractual obligations exclude pension obligations. In fiscal 2015, we have no minimum funding requirements. We are unable to determine minimum funding requirements beyond 2015.
E. Critical Accounting Policies and Estimates
Allowances for Doubtful Accounts
The Company maintains allowances for doubtful accounts for estimated losses resulting from the inability of certain customers to make required payments. The Company evaluates the adequacy of its allowances for doubtful accounts each quarter based on the customers’ credit-worthiness, current economic trends or market conditions, past collection history, aging of outstanding accounts receivable and specific identified risks. As these factors change, the Company’s allowances for doubtful accounts may change in subsequent periods. Historically, losses have been within management’s expectations and have not been significant.
Inventories
The Company maintains allowances for obsolete and excess inventory. The Company evaluates its allowances for obsolete and excess inventory each quarter. The Company maintains a formal policy, which requires at a minimum, that a reserve be established based on an analysis of the age of the inventory. In addition, if the Company learns of specific obsolescence, other than that identified by the aging criteria, an additional reserve will be recognized as well. Specific obsolescence may arise due to a technological or market change, or based on cancellation of an order. Management’s judgment is necessary in determining the realizable value of these products to arrive at the proper allowance for obsolete and excess inventory.
Impairment of Long-Lived Assets
The Company reviews the carrying value of its long-lived assets, including property, plant and equipment, at least annually or when events and circumstances warrant such a review. This review involves judgment and is performed using estimates of future undiscounted cash flows, which include proceeds from disposal of assets and which the Company considers a critical accounting estimate. If the carrying value of a long-lived asset is greater than the estimated undiscounted future cash flows, then the long-lived asset is considered impaired and an impairment charge is recorded for the amount by which the carrying value of the long-lived asset exceeds its fair value.
In projecting future undiscounted cash flows, the Company relies on internal budgets and forecasts, and projected proceeds upon disposal of long-lived assets. The Company’s budgets and forecasts are based on historical results and anticipated future market conditions, such as the general business climate and the effectiveness of competition. The Company believes that its estimates of future undiscounted cash flows and fair value are reasonable; however, changes in estimates of such undiscounted cash flows and fair value could change the Company’s estimates of fair value, which could result in future impairment charges.
Impairment of Goodwill
Goodwill is the excess of the purchase price paid over the fair value of the net assets of an acquired business. The determination of the fair value of assets and liabilities acquired typically involves obtaining independent appraisals of certain tangible and intangible assets and may require management to make certain assumptions and estimates regarding future events. Goodwill is not amortized, but is subject to an annual impairment test or more frequently if events or changes in circumstances indicate that goodwill may be impaired.
22
For the purposes of impairment testing, goodwill acquired in a business combination is allocated to the reporting entity expected to benefit from the business combination. Goodwill impairment testing involves the comparison of the fair value of a reporting unit, which is determined by its discounted cash flows, with its carrying value. The Company allocates the fair value of the reporting unit to all of its assets, other than goodwill, and liabilities. Any remaining unallocated fair value is then allocated to goodwill as its implied fair value. The amount of impairment loss is equal to the excess of the carrying value of goodwill over the implied fair value of goodwill.
Purchase Price Allocations
The costs of business acquisitions are allocated to the acquired assets and liabilities based on their respective fair value at the time of the acquisition. The determination of fair values typically involves obtaining independent appraisals of certain tangible and intangible assets and may require management to make certain assumptions and estimates regarding future events. In determining fair value, management may develop a number of possible future cash flow scenarios to which probabilities are judgmentally assigned and evaluated. This allocation process impacts the Company’s reported assets and liabilities and future net income.
Defined Benefit Pension Plan Expense
The Company maintains three defined benefit pension plans in accordance with the requirements of the Employee Retirement Income Security Act of 1974 (“ERISA”). The amounts recognized in the consolidated financial statements for pension benefits under these three defined benefit pension plans are determined on an actuarial basis utilizing various assumptions. The discussion that follows provides information on the significant assumptions/elements associated with these defined benefit pension plans.
One significant assumption in determining net pension expense is the expected return on plan assets. The Company determines the expected return on plan assets principally based on (i) the expected return for the various asset classes in the respective plans’ investment portfolios and (ii) the targeted allocation of the respective plans’ assets. The expected return on plan assets is developed using historical asset return performance as well as current and anticipated market conditions such as inflation, interest rates and market performance. Should the actual rate of return differ materially from the assumed/expected rate, the Company could experience a material adverse effect on the funded status of its plans and, accordingly, on its related future net pension expense.
Another significant assumption in determining the net pension expense is the discount rate. The discount rate for each plan is determined, as of the fiscal year end measurement date, using prevailing market spot-rates (from an appropriate yield curve) with maturities corresponding to the expected timing/date of the future defined benefit payment amounts for each of the respective plans. Such corresponding spot-rates are used to discount future years’ projected defined benefit payment amounts back to the fiscal year end measurement date as a present value. A composite discount rate is then developed for each plan by determining the single rate of discount that will produce the same present value as that obtained by applying the annual spot-rates. The discount rate may be further revised if the market environment indicates that the above methodology generates a discount rate that does not accurately reflect the prevailing interest rates as of the fiscal year end measurement date.
Deferred Tax Valuation Allowance
The Company accounts for deferred taxes in accordance with the provisions of the Accounting Standards Codification guidance related to accounting for income taxes, whereby the Company recognizes an income tax benefit related to income tax credits and other temporary differences between financial reporting basis and tax reporting basis. The Company considers both positive and negative evidence in its determination of the use of a valuation allowance to reduce the measurement of deferred tax assets not expected to be realized.
F. Impact of Newly Issued Accounting Standards
In March 2013, the Financial Accounting Standards Board ("FASB") issued Accounting Standards Update (“ASU”) 2013-05, “Foreign Currency Matters”, which provides guidance on a parent’s accounting for the cumulative translation adjustment upon derecognition of a subsidiary or group of assets within a foreign entity. This new guidance requires that the parent release any related cumulative translation adjustment into net income only if the sale or transfer results in the complete or substantially complete liquidation of the foreign entity in which the subsidiary or group of assets had resided. The new guidance will be effective for the Company beginning October 1, 2014. The adoption of this guidance is not expected to have a material impact on the Company’s consolidated financial statements.
In July 2013, the FASB issued ASU 2013-11, "Income Taxes (Topic 740): Presentation of an Unrecognized Tax Benefit When a Net Operating Loss Carry-forward, a Similar Tax Loss, or a Tax Credit Carry-forward Exists," which defines the presentation requirements of an unrecognized tax benefit, or a portion of an unrecognized tax benefit, in the financial statements. The new guidance will be effective for the Company beginning October 1, 2014. The Company is currently evaluating the impact of adopting this guidance.
23
In April 2014, the FASB issued ASU 2014-08, "Presentation of Financial Statements and Property, Plant, and Equipment — Reporting Discontinued Operations and Disclosures of Disposals of Components of an Entity,'' which revises what qualifies as a discontinued operation, changes the criteria for determining which disposals can be presented as discontinued operations and modifies related disclosure requirements. This ASU will be effective for the Company for applicable transactions occurring after October 1, 2015. The Company will prospectively apply the guidance to applicable transactions.
In May 2014, the FASB issued ASU 2014-09, "Revenue from Contracts with Customers," which clarifies existing accounting literature relating to how and when a company recognizes revenue. Under ASU 2014-09, a company will recognize revenue when it transfers promised goods or services to customers in an amount that reflects the consideration to which the company expects to be entitled in exchange for those goods and services. ASU 2014-09 will be effective for the Company October 1, 2017. The Company is in the process of determining what impact, if any, the adoption of this ASU will have on its financial position, results of operations and cash flows.
In June 2014, the FASB issued ASU 2014-12, "Compensation – Stock Compensation," which requires that a performance target that affects vesting and that could be achieved after the requisite service period is treated as a performance condition. Compensation cost should be recognized in the period in which it becomes probable that the performance target will be achieved and should represent the compensation cost attributable to the period(s) for which the requisite service has already been rendered. If the performance target becomes probable of being achieved before the end of the requisite service period, the remaining unrecognized compensation cost should be recognized prospectively over the remaining requisite service period. The total amount of compensation cost recognized during and after the requisite service period should reflect the number of awards that are expected to vest and should be adjusted to reflect those awards that ultimately vest. The requisite service period ends when the employee is able to cease rendering service and still be eligible to vest in the award if the performance target is achieved. The ASU will be effective for the Company October 1, 2016. The Company will prospectively apply the guidance to applicable transactions.
In August 2014, the FASB issued ASU 2014-15, "Presentation of Financial Statements—Going Concern (Subtopic 205-40): Disclosure of Uncertainties about an Entity’s Ability to Continue as a Going Concern," which the intent is to define the Company's responsibility to evaluate whether there is substantial doubt about an organization’s ability to continue as a going concern and to provide related footnote disclosures. This ASU will be effective for the Company October 1, 2017. The Company will prospectively apply the guidance to applicable transactions.
Item 7A. Quantitative and Qualitative Disclosures about Market Risk
Interest Rate Risk
Interest payable on our term loan is at a variable rate based upon LIBOR, which becomes an effective fixed rate after giving effect to an interest rate swap. Interest payable under our revolving credit facility is at a variable rate based upon the LIBOR rate plus a margin depending on a leverage ratio. As of September 30, 2014, we had $6.4 million drawn on the revolving credit facility.
If interest rates were to increase or decrease 100 basis points (1%) from the September 30, 2014 rate, and assuming no change in the amount outstanding under the revolving credit facility, interest expense would result in a change of $0.1 million per annum.
24
Item 8. Financial Statements and Supplementary Data
Report of Independent Registered Public Accounting Firm
To the Board of Directors and Shareholders of SIFCO Industries, Inc. and Subsidiaries
We have audited the accompanying consolidated balance sheets of SIFCO Industries, Inc. (an Ohio corporation) and Subsidiaries (the “Company”) as of September 30, 2014 and 2013, and the related consolidated statements of operations, comprehensive income, shareholders’ equity, and cash flows for each of the three years in the period ended September 30, 2014. Our audits of the basic consolidated financial statements included the financial statement schedule appearing under Schedule II. These financial statements and financial statement schedule are the responsibility of the Company’s management. Our responsibility is to express an opinion on these financial statements and financial statement schedule based on our audits.
We conducted our audits in accordance with the standards of the Public Company Accounting Oversight Board (United States). Those standards require that we plan and perform the audit to obtain reasonable assurance about whether the financial statements are free of material misstatement. An audit includes examining, on a test basis, evidence supporting the amounts and disclosures in the financial statements. An audit also includes assessing the accounting principles used and significant estimates made by management, as well as evaluating the overall financial statement presentation. We believe that our audits provide a reasonable basis for our opinion.
In our opinion, the consolidated financial statements referred to above present fairly, in all material respects, the financial position of SIFCO Industries, Inc. and Subsidiaries as of September 30, 2014 and 2013, and the results of their operations and their cash flows for each of the three years in the period ended September 30, 2014 in conformity with accounting principles generally accepted in the United States of America. Also in our opinion, the related financial statement schedule, when considered in relation to the basic consolidated financial statements taken as a whole, presents fairly, in all material respects, the information set forth therein.
We also have audited, in accordance with the standards of the Public Company Accounting Oversight Board (United States), the Company’s internal control over financial reporting as of September 30, 2014, based on criteria established in the 2013 Internal Control-Integrated Framework issued by the Committee of Sponsoring Organizations of the Treadway Commission (COSO), and our report dated December 2, 2014 expressed an adverse opinion thereon.
/s/ GRANT THORNTON LLP
Cleveland, Ohio
December 2, 2014
25
SIFCO Industries, Inc. and Subsidiaries
Consolidated Statements of Operations
(Amounts in thousands, except per share data)
Years Ended September 30, | ||||||||||||
2014 | 2013 | 2012 | ||||||||||
Net sales | $ | 119,654 | $ | 116,001 | $ | 102,900 | ||||||
Cost of goods sold | 93,729 | 87,986 | 81,094 | |||||||||
Gross margin | 25,925 | 28,015 | 21,806 | |||||||||
Selling, general and administrative expenses | 15,680 | 12,262 | 9,906 | |||||||||
Amortization of intangible assets | 2,161 | 2,076 | 2,879 | |||||||||
(Gain) on disposal or impairment of operating assets | (3 | ) | (89 | ) | — | |||||||
Operating income | 8,087 | 13,766 | 9,021 | |||||||||
Interest income | (17 | ) | (24 | ) | (27 | ) | ||||||
Interest expense | 201 | 342 | 471 | |||||||||
Foreign currency exchange (gain) loss, net | (20 | ) | 23 | (16 | ) | |||||||
Other income, net | (433 | ) | (421 | ) | (575 | ) | ||||||
Income from continuing operations before income tax provision | 8,356 | 13,846 | 9,168 | |||||||||
Income tax provision | 2,753 | 4,088 | 2,861 | |||||||||
Income from continuing operations | 5,603 | 9,758 | 6,307 | |||||||||
Income (loss) from discontinued operations, net of tax | (580 | ) | 476 | 241 | ||||||||
Net income | $ | 5,023 | $ | 10,234 | $ | 6,548 | ||||||
Income per share from continuing operations | ||||||||||||
Basic | $ | 1.04 | $ | 1.82 | $ | 1.19 | ||||||
Diluted | $ | 1.03 | $ | 1.81 | $ | 1.18 | ||||||
Income (loss) per share from discontinued operations, net of tax | ||||||||||||
Basic | $ | (0.11 | ) | $ | 0.09 | $ | 0.04 | |||||
Diluted | $ | (0.11 | ) | $ | 0.09 | $ | 0.04 | |||||
Net income per share | ||||||||||||
Basic | $ | 0.93 | $ | 1.91 | $ | 1.23 | ||||||
Diluted | $ | 0.92 | $ | 1.90 | $ | 1.22 | ||||||
Weighted-average number of common shares (basic) | 5,402 | 5,363 | 5,317 | |||||||||
Weighted-average number of common shares (diluted) | 5,424 | 5,401 | 5,380 | |||||||||
See notes to consolidated financial statements.
26
SIFCO Industries, Inc. and Subsidiaries
Consolidated Statements of Comprehensive Income
(Amounts in thousands, except per share data)
Years Ended September 30, | ||||||||||||
2014 | 2013 | 2012 | ||||||||||
Net income | $ | 5,023 | $ | 10,234 | $ | 6,548 | ||||||
Other comprehensive income (loss), net of tax: | ||||||||||||
Foreign currency translation adjustment | — | (284 | ) | 204 | ||||||||
Retirement plan liability adjustment | (891 | ) | 2,854 | 212 | ||||||||
Interest rate swap agreement adjustment | 21 | 31 | (58 | ) | ||||||||
Comprehensive income | $ | 4,153 | $ | 12,835 | $ | 6,906 | ||||||
See notes to the consolidated financial statements.
27
SIFCO Industries, Inc. and Subsidiaries
Consolidated Balance Sheets
(Amounts in thousands, except per share data)
September 30, | ||||||||
2014 | 2013 | |||||||
ASSETS | ||||||||
Current assets: | ||||||||
Cash and cash equivalents | $ | 4,596 | $ | 4,508 | ||||
Receivables, net of allowance for doubtful accounts of $333 and $481, respectively | 25,915 | 24,811 | ||||||
Inventories, net | 18,919 | 18,340 | ||||||
Refundable income taxes | 410 | — | ||||||
Deferred income taxes | 791 | 987 | ||||||
Prepaid expenses and other current assets | 1,878 | 1,767 | ||||||
Current assets of business held for sale | 264 | 278 | ||||||
Current assets of business from discontinued operations | 128 | 2,059 | ||||||
Total current assets | 52,901 | 52,750 | ||||||
Property, plant and equipment, net | 37,148 | 29,632 | ||||||
Intangible assets, net | 11,490 | 13,651 | ||||||
Goodwill | 7,658 | 7,620 | ||||||
Other assets | 500 | 1,240 | ||||||
Noncurrent assets of business from discontinued operations | — | 872 | ||||||
Total assets | $ | 109,697 | $ | 105,765 | ||||
LIABILITIES AND SHAREHOLDERS’ EQUITY | ||||||||
Current liabilities: | ||||||||
Current maturities of long-term debt | $ | 2,000 | $ | 4,392 | ||||
Accounts payable | 10,526 | 6,773 | ||||||
Accrued liabilities | 6,432 | 7,670 | ||||||
Current liabilities of business from discontinued operations | 196 | 1,086 | ||||||
Total current liabilities | 19,154 | 19,921 | ||||||
Long-term debt, net of current maturities | 8,429 | 7,381 | ||||||
Deferred income taxes | 774 | 1,733 | ||||||
Pension liability | 4,331 | 4,200 | ||||||
Other long-term liabilities | 389 | 517 | ||||||
Shareholders’ equity: | ||||||||
Serial preferred shares, no par value, authorized 1,000 shares | — | — | ||||||
Common shares, par value $1 per share, authorized 10,000 shares; issued and outstanding shares – 5,448 at September 30, 2014 and 5,407 at September 30, 2013 | 5,448 | 5,407 | ||||||
Additional paid-in capital | 9,102 | 7,599 | ||||||
Retained earnings | 72,683 | 68,750 | ||||||
Accumulated other comprehensive loss | (10,613 | ) | (9,743 | ) | ||||
Total shareholders’ equity | 76,620 | 72,013 | ||||||
Total liabilities and shareholders’ equity | $ | 109,697 | $ | 105,765 | ||||
See notes to consolidated financial statements.
28
SIFCO Industries, Inc. and Subsidiaries
Consolidated Statements of Cash Flows
(Amounts in thousands)
See notes to consolidated financial statements.
Years Ended September 30, | ||||||||||||
2014 | 2013 | 2012 | ||||||||||
Cash flows from operating activities: | ||||||||||||
Net income | $ | 5,023 | $ | 10,234 | $ | 6,548 | ||||||
(Income) loss from discontinued operations, net of tax | 580 | (476 | ) | (241 | ) | |||||||
Adjustments to reconcile net income to net cash provided by operating activities: | ||||||||||||
Depreciation and Amortization | 6,896 | 5,725 | 6,032 | |||||||||
Gain on disposal of operating assets | (3 | ) | (89 | ) | — | |||||||
LIFO expense (income) | (98 | ) | (1,560 | ) | 1,563 | |||||||
Share transactions under employee stock plan | 1,540 | 117 | 900 | |||||||||
Deferred income taxes | (762 | ) | 1,165 | (883 | ) | |||||||
Asset impairment charges | — | (72 | ) | — | ||||||||
Changes in operating assets and liabilities, net of acquisitions: | ||||||||||||
Receivables | (1,104 | ) | (4,752 | ) | 1,456 | |||||||
Inventories | (481 | ) | 980 | (6,385 | ) | |||||||
Refundable income taxes | (410 | ) | — | 281 | ||||||||
Prepaid expenses and other current assets | (111 | ) | (636 | ) | (674 | ) | ||||||
Other assets | 740 | (532 | ) | 406 | ||||||||
Accounts payable | 1,305 | (2,475 | ) | (454 | ) | |||||||
Accrued liabilities | (1,246 | ) | 969 | 729 | ||||||||
Other long-term liabilities | (865 | ) | (799 | ) | (126 | ) | ||||||
Net cash provided by operating activities of continuing operations | 11,004 | 7,799 | 9,152 | |||||||||
Net cash provided by (used for) operating activities of discontinued operations | 393 | (438 | ) | 1,121 | ||||||||
Cash flows from investing activities: | ||||||||||||
Acquisition of businesses | — | (4,387 | ) | (24,886 | ) | |||||||
Proceeds from disposal of property, plant and equipment | — | 164 | — | |||||||||
Capital expenditures | (9,838 | ) | (3,418 | ) | (2,932 | ) | ||||||
Net cash used for investing activities of continuing operations | (9,838 | ) | (7,641 | ) | (27,818 | ) | ||||||
Net cash provided by investing activities of discontinued operations | 950 | 8,642 | — | |||||||||
Cash flows from financing activities: | ||||||||||||
Proceeds from term note | — | — | 10,000 | |||||||||
Repayments of term note | (4,392 | ) | (2,000 | ) | (2,000 | ) | ||||||
Proceeds from revolving credit agreement | 40,992 | 52,386 | 59,671 | |||||||||
Repayments of revolving credit agreement | (37,944 | ) | (60,343 | ) | (49,517 | ) | ||||||
Proceeds from other debt | — | — | 2,302 | |||||||||
Proceeds from exercise of stock options | 4 | — | — | |||||||||
Dividends paid | (1,081 | ) | (1,073 | ) | (1,060 | ) | ||||||
Net cash used for financing activities of continuing operations | (2,421 | ) | (11,030 | ) | 19,396 | |||||||
Increase (decrease) in cash and cash equivalents | 88 | (2,668 | ) | 1,851 | ||||||||
Cash and cash equivalents at beginning of year | 4,508 | 7,176 | 5,096 | |||||||||
Effects of exchange rate changes on cash and cash equivalents | — | — | 229 | |||||||||
Cash and cash equivalents at end of year | $ | 4,596 | $ | 4,508 | $ | 7,176 | ||||||
Supplemental disclosure of cash flow information: | ||||||||||||
Cash paid for interest | $ | (205 | ) | $ | (301 | ) | $ | (393 | ) | |||
Cash paid for income taxes, net | $ | (3,283 | ) | $ | (4,906 | ) | $ | (2,996 | ) | |||
Non-cash investing and financing transactions: | ||||||||||||
Dividends declared but not paid | $ | (1,090 | ) | $ | (1,081 | ) | $ | (1,073 | ) | |||
Additions to property, plant & equipment - incurred but not yet paid | $ | 2,410 | $ | — | $ | — | ||||||
29
SIFCO Industries, Inc. and Subsidiaries
Consolidated Statements of Shareholders’ Equity
(Amounts in thousands)
Common Shares | Additional Paid-In Capital | Retained Earnings | Accumulated Other Comprehensive Loss | Common Shares Held in Treasury | Total Shareholders’ Equity | |||||||||||||||||||
Balance - September 30, 2011 | $ | 5,335 | $ | 7,032 | $ | 54,122 | $ | (12,702 | ) | $ | (378 | ) | $ | 53,409 | ||||||||||
Net income | — | — | 6,548 | — | — | 6,548 | ||||||||||||||||||
Foreign currency translation adjustment | — | — | — | 204 | — | 204 | ||||||||||||||||||
Retirement liability adjustment, net of tax | — | — | — | 212 | — | 212 | ||||||||||||||||||
Interest rate swap agreement adjustment, net of tax | — | — | — | (58 | ) | — | (58 | ) | ||||||||||||||||
Dividend declared | — | — | (1,073 | ) | — | — | (1,073 | ) | ||||||||||||||||
Performance and restricted share expense | — | 936 | — | — | — | 936 | ||||||||||||||||||
Share transactions under employee stock plans | 31 | (445 | ) | — | — | 378 | (36 | ) | ||||||||||||||||
Balance - September 30, 2012 | $ | 5,366 | $ | 7,523 | $ | 59,597 | $ | (12,344 | ) | $ | — | $ | 60,142 | |||||||||||
Net income | — | — | 10,234 | — | — | 10,234 | ||||||||||||||||||
Foreign currency translation adjustment | — | — | — | (284 | ) | — | (284 | ) | ||||||||||||||||
Retirement liability adjustment, net of tax | — | — | — | 2,854 | — | 2,854 | ||||||||||||||||||
Interest rate swap agreement adjustment, net of tax | — | — | — | 31 | — | 31 | ||||||||||||||||||
Dividend declared | — | — | (1,081 | ) | — | — | (1,081 | ) | ||||||||||||||||
Performance and restricted share expense | — | 298 | — | — | — | 298 | ||||||||||||||||||
Share transactions under employee stock plans | 41 | (222 | ) | — | — | — | (181 | ) | ||||||||||||||||
Balance - September 30, 2013 | $ | 5,407 | $ | 7,599 | $ | 68,750 | $ | (9,743 | ) | $ | — | $ | 72,013 | |||||||||||
Net income | — | 5,023 | — | — | 5,023 | |||||||||||||||||||
Retirement liability adjustment, net of tax | — | — | — | (891 | ) | — | (891 | ) | ||||||||||||||||
Interest rate swap agreement adjustment, net of tax | — | — | — | 21 | — | 21 | ||||||||||||||||||
Dividend declared | — | — | (1,090 | ) | — | — | (1,090 | ) | ||||||||||||||||
Performance and restricted share expense | — | 1,801 | — | — | — | 1,801 | ||||||||||||||||||
Share transactions under employee stock plans | 41 | (298 | ) | — | — | — | (257 | ) | ||||||||||||||||
Balance - September 30, 2014 | $ | 5,448 | $ | 9,102 | $ | 72,683 | $ | (10,613 | ) | $ | — | $ | 76,620 | |||||||||||
See notes to consolidated financial statements.
30
SIFCO Industries, Inc. and Subsidiaries
Notes to Consolidated Financial Statements
(Amounts in thousands, except per share data)
1. Summary of Significant Accounting Policies
A. DESCRIPTION OF BUSINESS
SIFCO Industries, Inc. and Subsidiaries is engaged in the production of forgings and machined components primarily in the Aerospace and Energy ("A&E") market. The Company’s operations are conducted in a single business segment, "SIFCO" or "Company," previously referenced as SIFCO Forged Components, during fiscal 2014. In fiscal 2013, the Company had two additional segments: Turbine Component Services and Repair ("Repair Group"), which was discontinued in fiscal 2013, as discussed more fully in Note 13, and Applied Surface Concepts ("ASC"), which was divested in fiscal 2013, as discussed more fully in Note 13.
B. PRINCIPLES OF CONSOLIDATION
The accompanying consolidated financial statements include the accounts of the Company and its wholly-owned subsidiaries. All significant intercompany accounts and transactions have been eliminated. The U.S. dollar is the functional currency for all the Company’s U.S. operations and its Irish subsidiary. For these operations, all gains and losses from completed currency transactions are included in income currently. Foreign currency translation adjustments are reported as a component of accumulated other comprehensive loss in the consolidated statements of shareholders’ equity.
C. CASH EQUIVALENTS
The Company considers all highly liquid short-term investments with original maturities of three months or less to be cash equivalents. A substantial majority of the Company’s cash and cash equivalent bank balances exceed federally insured limits at September 30, 2014 and 2013.
D. CONCENTRATIONS OF CREDIT RISK
Receivables are presented net of allowance for doubtful accounts of $333 and $481 at September 30, 2014 and 2013, respectively. Accounts receivable outstanding longer than the contractual payment terms are considered past due. The Company writes off accounts receivable when they become uncollectible. During fiscal 2014 and 2013, $158 and $147, respectively, of accounts receivable were written off against the allowance for doubtful accounts. Bad debt expense totaled $9, $81 and $107 in fiscal 2014, 2013 and 2012, respectively.
Most of the Company’s receivables represent trade receivables due from manufacturers of turbine engines and aircraft components as well as turbine engine overhaul companies located throughout the world, including a significant concentration of U.S. based companies. In fiscal 2014, 37% of the Company’s consolidated net sales were from three of its largest customers who individually accounted for 14%, 12%, and 11% of consolidated net sales; and 50% of the Company's consolidated net sales were from the three largest customers and their direct subcontractors who individually accounted for 24%, 15%, and 11%. In fiscal 2013, 39% of the Company’s consolidated net sales were from three of its largest customers who individually accounted for 16%, 13%, and 10% of consolidated net sales; and 60% of the Company's consolidated net sales were from four of the largest customers and their direct subcontractors who individually accounted for 21%, 16%, 13%, and 10%. In fiscal 2012, 44% of the Company’s consolidated net sales were from three major customers who individually accounted for 17%, 16%, and 11% of consolidated net sales; and 70% of the Company's consolidated net sales were from four of the largest customers and their direct subcontractors who individually accounted for 23%, 17%, 16%, and 14%. No other single customer or group represented greater than 10% of total net sales in fiscal 2014, 2013 and 2012. At September 30, 2014, two of the Company’s largest customers had outstanding net accounts receivable who individually accounted for 13% and 10%; and two of the largest customers and direct subcontractors had outstanding net accounts receivable who individually accounted for 27% and 14%. At September 30, 2013 two of the Company’s largest customers had outstanding net accounts receivable who individually accounted for 23% and 13%; and three of the largest customers and direct subcontractors had outstanding net accounts receivable who individually accounted for 24%, 14% and 11%. The Company performs ongoing credit evaluations of its customers’ financial conditions. The Company believes its allowance for doubtful accounts is sufficient based on the credit exposures outstanding at September 30, 2014.
E. INVENTORY VALUATION
Inventories are stated at the lower of cost or market. For a portion of the Company's inventory, cost is determined using the last-in, first-out (“LIFO”) method. For approximately 40% and 36% of the Company’s inventories at September 30, 2014 and 2013, respectively, the LIFO method is used to value the Company’s inventories. The first-in, first-out (“FIFO”) method is used to value the remainder of the Company’s inventories.
31
SIFCO Industries, Inc. and Subsidiaries
Notes to Consolidated Financial Statements – (Continued)
The Company maintains allowances for obsolete and excess inventory. The Company evaluates its allowances for obsolete and excess inventory each quarter, and requires at a minimum that reserves be established based on an analysis of the age of the inventory. In addition, if the Company identifies specific obsolescence, other than that identified by the aging criteria, an additional reserve will be recognized. Specific obsolescence and excess reserve requirements may arise due to technological or market changes, or based on cancellation of an order. The Company’s reserves for obsolete and excess inventory were $1,407 and $1,394 at September 30, 2014 and 2013, respectively.
F. PROPERTY, PLANT AND EQUIPMENT
Property, plant and equipment are stated at cost. Depreciation is generally computed using the straight-line method. Depreciation is provided in amounts sufficient to amortize the cost of the assets over their estimated useful lives. Depreciation provisions are based on estimated useful lives: (i) buildings, including building improvements - 5 to 40 years; (ii) machinery and equipment, including office and computer equipment - 3 to 20 years; (iii) software - 3 to 7 years (included in machinery and equipment); and (iv) leasehold improvements - remaining life or length of the lease (included in buildings).
The Company's property, plant and equipment assets by major asset class at September 30 consist of:
2014 | 2013 | |||||||
Property, plant and equipment : | ||||||||
Land | $ | 469 | $ | 469 | ||||
Buildings | 11,546 | 10,910 | ||||||
Machinery and equipment | 61,587 | 50,581 | ||||||
Total property, plant and equipment | 73,602 | 61,960 | ||||||
Accumulated depreciation | 36,454 | 32,328 | ||||||
Property, plant and equipment, net | $ | 37,148 | $ | 29,632 | ||||
The Company reviews the carrying value of its long-lived assets, including property, plant and equipment, at least annually or when events and circumstances warrant such a review. This review is performed using estimates of future undiscounted cash flows, which include proceeds from disposal of assets. If the carrying value of a long-lived asset is greater than the estimated undiscounted future cash flows, then the long-lived asset is considered impaired and an impairment charge is recorded for the amount by which the carrying value of the long-lived asset exceeds its fair value. Asset impairment charges of $72 were recorded in fiscal 2013 related to certain machinery and equipment. The impairment is recorded in (gain) on disposal or impairment of operating assets in the accompanying statements of operations. The machinery and equipment was determined to be impaired, therefore, the carrying value of such assets was reduced to its net realizable value. Depreciation expense was $4,735, $3,649 and $3,153 in fiscal 2014, 2013 and 2012, respectively.
The Company’s Irish subsidiary sold its operating business in June 2007, but retained ownership of its Cork, Ireland facility. This property is subject to a lease arrangement with the acquirer of the business that expires in June 2027. Rental income is earned in quarterly installments of $103. At September 30, 2014 and 2013, the carrying value of the property is $1,643 and $1,716, respectively. Rental income of $413, $413 and $433 was recognized in fiscal 2014, 2013 and 2012, respectively, and is recorded in other income on the consolidated statements of operations.
G. GOODWILL AND INTANGIBLE ASSETS
Goodwill represents the excess of the purchase price paid over the fair value of the net assets of an acquired business. Goodwill is subject to annual impairment testing and the Company has selected July 31 as the annual impairment testing date. The Company first assesses qualitative factors to determine whether it is more likely than not that the fair value of a reporting unit is less than its carrying value, including goodwill. If so, then a two-step impairment test is used to identify potential goodwill impairment. The first step of the goodwill impairment test compares the fair value of a reporting unit (as defined) with its carrying amount, including goodwill. If the fair value of the reporting unit exceeds its carrying amount, goodwill is not considered impaired, and the second step of the goodwill impairment test is not required. The second step measures the amount of impairment, if any, by comparing the carrying value of the goodwill associated with a reporting unit to the implied fair value of the goodwill derived from the estimated overall fair value of the reporting unit and the individual fair values of the other assets and liabilities of the reporting unit.
Intangible assets consist of identifiable intangibles acquired or recognized in the accounting for the acquisition of a business and include such items as a trade name, a non-compete agreement, below market lease, customer relationships and order backlog. Intangible assets are amortized over their useful lives ranging from one year to ten years.
32
SIFCO Industries, Inc. and Subsidiaries
Notes to Consolidated Financial Statements – (Continued)
H. NET INCOME PER SHARE
The Company’s net income per basic share has been computed based on the weighted-average number of common shares outstanding. Net income per diluted share reflects the effect of the Company’s outstanding stock options, restricted shares and performance shares under the treasury stock method.
The dilutive effect of the Company’s stock options, restricted shares and performance shares were as follows:
September 30, | ||||||||||||
2014 | 2013 | 2012 | ||||||||||
Income from continuing operations | $ | 5,603 | $ | 9,758 | $ | 6,307 | ||||||
Income (loss) from discontinued operations, net of tax | (580 | ) | 476 | 241 | ||||||||
Net income | $ | 5,023 | $ | 10,234 | $ | 6,548 | ||||||
Weighted-average common shares outstanding (basic) | 5,402 | 5,363 | 5,317 | |||||||||
Effect of dilutive securities: | ||||||||||||
Stock options | — | 1 | 15 | |||||||||
Restricted shares | 18 | 12 | 6 | |||||||||
Performance shares | 4 | 25 | 42 | |||||||||
Weighted-average common shares outstanding (diluted) | 5,424 | 5,401 | 5,380 | |||||||||
Net income per share – basic | ||||||||||||
Continuing operations | $ | 1.04 | $ | 1.82 | $ | 1.19 | ||||||
Discontinued operations | (0.11 | ) | 0.09 | 0.04 | ||||||||
Net income | $ | 0.93 | $ | 1.91 | $ | 1.23 | ||||||
Net income per share – diluted: | ||||||||||||
Continuing operations | $ | 1.03 | $ | 1.81 | $ | 1.18 | ||||||
Discontinued operations | (0.11 | ) | 0.09 | 0.04 | ||||||||
Net income | $ | 0.92 | $ | 1.90 | $ | 1.22 | ||||||
Anti-dilutive weighted-average common shares excluded from calculation of diluted earnings per share | 18 | 47 | 144 | |||||||||
I. REVENUE RECOGNITION
Revenue is generally recognized when products are shipped or services are provided to customers.
J. IMPACT OF RECENTLY ADOPTED ACCOUNTING STANDARDS
In February 2013, the FASB issued ASU 2013-02, “Comprehensive Income”, which provides guidance on disclosure requirements for items reclassified out of Accumulated Other Comprehensive Income (“AOCI”). This new guidance requires entities to present (either on the face of the income statement or in the notes to the financial statements) the effects on the income statement of amounts reclassified out of AOCI. The Company adopted this new standard and it did not have a material impact on the consolidated financial statements.
K. IMPACT OF NEWLY ISSUED ACCOUNTING STANDARDS
In March 2013, the FASB issued ASU 2013-05, “Foreign Currency Matters”, which provides guidance on a parent’s accounting for the cumulative translation adjustment upon de-recognition of a subsidiary or group of assets within a foreign entity. This new guidance requires that the parent release any related cumulative translation adjustment into net income only if the sale or transfer results in the complete or substantially complete liquidation of the foreign entity in which the subsidiary or group of assets had resided. The new guidance will be effective for the Company beginning October 1, 2014. The adoption of this guidance is not expected to have a material impact on the Company’s consolidated financial statements.
In July 2013, the FASB issued ASU 2013-11, "Income Taxes (Topic 740): Presentation of an Unrecognized Tax Benefit When a Net Operating Loss Carry-forward, a Similar Tax Loss, or a Tax Credit Carry-forward Exists," which defines the presentation requirements of an unrecognized tax benefit, or a portion of an unrecognized tax benefit, in the financial statements. The new guidance will be effective for the Company beginning October 1, 2014. The Company is currently evaluating the impact of adopting this guidance.
33
SIFCO Industries, Inc. and Subsidiaries
Notes to Consolidated Financial Statements – (Continued)
In April 2014, the FASB issued ASU 2014-08, "Presentation of Financial Statements and Property, Plant, and Equipment — Reporting Discontinued Operations and Disclosures of Disposals of Components of an Entity,'' which revises what qualifies as a discontinued operation, changes the criteria for determining which disposals can be presented as discontinued operations and modifies related disclosure requirements. This ASU will be effective for the Company for applicable transactions occurring after October 1, 2015. The Company will prospectively apply the guidance to applicable transactions.
In May 2014, the FASB issued ASU 2014-09, "Revenue from Contracts with Customers," which clarifies existing accounting literature relating to how and when a company recognizes revenue. Under ASU 2014-09, a company will recognize revenue when it transfers promised goods or services to customers in an amount that reflects the consideration to which the company expects to be entitled in exchange for those goods and services. ASU 2014-09 will be effective for the Company October 1, 2017. The Company is in the process of determining what impact, if any; the adoption of this ASU will have on its financial position, results of operations and cash flows.
In June 2014, the FASB issued ASU 2014-12, "Compensation – Stock Compensation," which requires that a performance target that affects vesting and that could be achieved after the requisite service period is treated as a performance condition. Compensation cost should be recognized in the period in which it becomes probable that the performance target will be achieved and should represent the compensation cost attributable to the period(s) for which the requisite service has already been rendered. If the performance target becomes probable of being achieved before the end of the requisite service period, the remaining unrecognized compensation cost should be recognized prospectively over the remaining requisite service period. The total amount of compensation cost recognized during and after the requisite service period should reflect the number of awards that are expected to vest and should be adjusted to reflect those awards that ultimately vest. The requisite service period ends when the employee is able to cease rendering service and still be eligible to vest in the award if the performance target is achieved. The ASU will be effective for the Company October 1, 2016. The Company will prospectively apply the guidance to applicable transactions.
In August 2014, the FASB issued ASU 2014-15, "Presentation of Financial Statements—Going Concern (Subtopic 205-40): Disclosure of Uncertainties about an Entity’s Ability to Continue as a Going Concern," which the intent is to define the Company's responsibility to evaluate whether there is substantial doubt about an organization’s ability to continue as a going concern and to provide related footnote disclosures. This ASU will be effective for the Company October 1, 2017. The Company will prospectively apply the guidance to applicable transactions.
L. USE OF ESTIMATES
Accounting principles generally accepted in the U.S. (“GAAP”) require management to make a number of estimates and assumptions relating to the reported amounts of assets and liabilities and the disclosure of contingent liabilities, at the date of the consolidated financial statements, and the reported amounts of revenues and expenses during the period in preparing these financial statements. Actual results could differ from those estimates.
M. DERIVATIVE FINANCIAL INSTRUMENTS
The Company uses an interest rate swap agreement to reduce risk related to variable-rate debt, which is subject to changes in market rates of interest. The interest rate swap is designated as a cash flow hedge. At September 30, 2014 and 2013, the Company held an interest rate swap agreement with a notional amount of $4,000 and $6,000, respectively. Cash flows related to the interest rate swap agreement are included in interest expense. The Company’s interest rate swap agreement and its variable-rate term debt are based upon LIBOR. During fiscal 2014, 2013, and 2012 the Company’s interest rate swap agreement qualified as a fully effective cash flow hedge against the Company’s variable-rate term note interest risk.
Historically, the Company has been able to mitigate the impact of foreign currency risk, to the extent it existed, by means of hedging such risk through the use of foreign currency exchange contracts, which typically expired within one year. However, such risk was mitigated only for the periods for which the Company had foreign currency exchange contracts in effect, and only to the extent of the U.S. dollar amounts of such contracts. At September 30, 2014 and 2013, the Company had no foreign currency exchange contracts outstanding.
N. RESEARCH AND DEVELOPMENT
Research and development costs are expensed as they are incurred. Research and development expense was nominal in fiscal 2014, 2013 and 2012.
34
SIFCO Industries, Inc. and Subsidiaries
Notes to Consolidated Financial Statements – (Continued)
O. ACCUMULATED OTHER COMPREHENSIVE LOSS
The components of accumulated other comprehensive loss as shown on the consolidated balance sheets at September 30 are as follows:
2014 | 2013 | 2012 | |||||||||
Foreign currency translation adjustment, net of income tax benefit of $0, $0 and $200, respectively | $ | (5,851 | ) | $ | (5,851 | ) | $ | (5,566 | ) | ||
Net retirement plan liability adjustment, net of income tax benefit of ($2,909), ($2,409) and ($4,090), respectively | (4,757 | ) | (3,866 | ) | (6,720 | ) | |||||
Interest rate swap agreement, net of income tax benefit of $1, $16 and $35, respectively | (5 | ) | (26 | ) | (58 | ) | |||||
Total accumulated other comprehensive loss | $ | (10,613 | ) | $ | (9,743 | ) | $ | (12,344 | ) | ||
The following table provides additional details of the amounts recognized into net earnings from accumulated other comprehensive loss, net of tax:
Foreign Currency Translation Adjustment | Retirement Plan Liability adjustment | Interest rates swap adjustment | Accumulated Other Comprehensive Loss | ||||||||||||
Balance at September 30, 2013 | $ | (5,851 | ) | $ | (3,866 | ) | $ | (26 | ) | $ | (9,743 | ) | |||
Other comprehensive income (loss) before reclassifications | — | (1,179 | ) | 21 | (1,158 | ) | |||||||||
Amounts reclassified from accumulated other comprehensive income | — | 288 | — | 288 | |||||||||||
Net current-period other comprehensive income | — | (891 | ) | 21 | (870 | ) | |||||||||
Balance at September 30, 2014 | $ | (5,851 | ) | $ | (4,757 | ) | $ | (5 | ) | $ | (10,613 | ) | |||
The following table reflects the changes in accumulated other comprehensive loss related to the Company for September 30, 2014:
Amount reclassified from accumulated other comprehensive loss | ||||||
Details about accumulated other comprehensive loss components | 2014 | Affected line item in the Consolidated Statement of Operations | ||||
Amortization of Retirement plan liability: | ||||||
Prior service costs | $ | — | (1) | |||
Net actuarial loss | 450 | (1) | ||||
Settlements/curtailments | — | (1) | ||||
450 | Total before taxes | |||||
(162 | ) | Income tax benefit (expense) | ||||
$ | 288 | Net of taxes | ||||
(1) These accumulated other comprehensive income components are included in the computation of net periodic benefit cost. See Note 7 - Retirement benefit plans for further information.
P. INCOME TAXES
The Company files a consolidated U.S. federal income tax return and tax returns in various state and local jurisdictions. The Company’s Irish subsidiary also files a tax return in Ireland. The Company has provided U.S. deferred income taxes on all cumulative earnings of its non-U.S. subsidiary.
35
SIFCO Industries, Inc. and Subsidiaries
Notes to Consolidated Financial Statements – (Continued)
The Company provides deferred income taxes for the temporary difference between the financial reporting basis and tax basis of the Company’s assets and liabilities. Such taxes are measured using the enacted tax rates that are assumed to be in effect when the differences reverse. Deferred tax assets result principally from recording certain expenses in the financial statements in excess of amounts currently deductible for tax purposes. Deferred tax liabilities result principally from tax depreciation in excess of book depreciation and unremitted foreign earnings.
The Company evaluates at each balance sheet date for uncertain tax positions taken. The Company recognizes the financial statement benefit of a tax position only after determining that the relevant tax authority would more likely than not sustain the position. For tax positions meeting the more-likely-than-not threshold, the amount recognized in the financial statements is the largest benefit that has a greater than 50% likelihood of being realized upon ultimate settlement with the relevant tax authority. The Company's policy for interest and/or penalties related to underpayments of income taxes is to include interest and penalties in tax expenses.
The Company maintains a valuation allowance against its deferred tax assets when management believes it is more likely than not that all or a portion of a deferred tax asset may not be realized. Changes in valuation allowances are included in the income tax provision in the period of change. In determining whether a valuation allowance is warranted, the Company evaluates factors such as prior earnings history, expected future earnings, carry-back and carry-forward periods and tax strategies that could potentially enhance the likelihood of the realization of a deferred tax asset.
In September 2013, the Internal Revenue Service issued final regulations governing the income tax treatment of acquisitions, dispositions, and repairs of tangible property. Taxpayers are required to follow the new regulations in taxable years beginning on or after January 1, 2014. Management is currently assessing the impact of the regulations and does not expect they will have a material impact on the Company’s consolidated financial statements.
Q. RECLASSIFICATIONS
Certain amounts in prior years may have been reclassified to conform to the 2014 consolidated financial statement presentation.
2.Inventories
Inventories at September 30 consist of:
2014 | 2013 | ||||||
Raw materials and supplies | $ | 5,957 | $ | 5,906 | |||
Work-in-process | 6,232 | 7,049 | |||||
Finished goods | 6,730 | 5,385 | |||||
Total inventories | $ | 18,919 | $ | 18,340 | |||
If the FIFO method had been used for the entire Company, inventories would have been $7,879 and $7,977 higher than reported at September 30, 2014 and 2013, respectively. LIFO income was $98 and $1,560 in fiscal 2014 and fiscal 2013, and LIFO expense was $1,563 in fiscal 2012.
During fiscal 2013, a reduction in total inventory resulted in a liquidation of LIFO inventory quantities valued at the lower costs of prior years. The LIFO liquidation decreased cost of goods sold in fiscal 2013 by approximately $1,300.
36
SIFCO Industries, Inc. and Subsidiaries
Notes to Consolidated Financial Statements – (Continued)
3. Goodwill and Intangible Assets
The Company’s intangible assets by major asset class subject to amortization as of:
September 30, 2014 | Estimated Useful Life | Original Cost | Accumulated Amortization | Net Book Value | |||||||||
Intangible assets: | |||||||||||||
Trade name | 10 years | $ | 2,000 | $ | 646 | $ | 1,354 | ||||||
Non-compete agreement | 5 years | 1,600 | 988 | 612 | |||||||||
Below market lease | 5 years | 900 | 685 | 215 | |||||||||
Customer relationships | 10 years | 13,800 | 4,491 | 9,309 | |||||||||
Order backlog | 1 year | 2,200 | 2,200 | — | |||||||||
Transition services agreement | < 1 year | 23 | 23 | — | |||||||||
Total intangible assets | $ | 20,523 | $ | 9,033 | $ | 11,490 | |||||||
September 30, 2013 | |||||||||||||
Intangible assets: | |||||||||||||
Trade name | 10 years | $ | 2,000 | $ | 446 | $ | 1,554 | ||||||
Non-compete agreement | 5 years | 1,600 | 668 | 932 | |||||||||
Below market lease | 5 years | 900 | 505 | 395 | |||||||||
Customer relationships | 10 years | 13,800 | 3,111 | 10,689 | |||||||||
Order backlog | 1 year | 2,200 | 2,119 | 81 | |||||||||
Transition services agreement | < 1 year | 23 | 23 | — | |||||||||
Total intangible assets | $ | 20,523 | $ | 6,872 | $ | 13,651 | |||||||
Included in the intangible assets at September 30, 2013 are assets acquired in connection with the purchase of substantially all related operating assets from MW General, Inc. (DBA General Aluminium Forgings) on July 23, 2013, as discussed more fully in Note 12. These acquired intangible assets consist of:
Estimated Useful Life | Original Cost | ||||
Intangible assets: | |||||
Trade name | 10 years | $ | 100 | ||
Non-compete agreement | 5 years | 100 | |||
Customer relationships | 10 years | 800 | |||
Order backlog | 1 year | 100 | |||
Total intangible assets | $ | 1,100 | |||
The amortization expense on identifiable intangible assets for fiscal 2014, 2013 and 2012 was $2,161, $2,076 and $2,879 respectively. Amortization expense associated with the identified intangible assets is expected to be as follows:
Amortization Expense | |||
Fiscal year 2015 | $ | 2,080 | |
Fiscal year 2016 | 1,854 | ||
Fiscal year 2017 | 1,617 | ||
Fiscal year 2018 | 1,596 | ||
Fiscal year 2019 | 1,580 | ||
Goodwill is not amortized, but is subject to an annual impairment test. The Company tests its goodwill for impairment in the fourth fiscal quarter, and in interim periods if certain events occur indicating that the carrying amount of goodwill may be impaired. During fiscal 2014 and 2013, the Company performed a quantitative assessment of goodwill for impairment. The impairment test consisted of a comparison between the fair value of the indefinite lived intangible assets, as determined by projected discounted
37
SIFCO Industries, Inc. and Subsidiaries
Notes to Consolidated Financial Statements – (Continued)
cash flows from future operations, and the carrying values. The Company concluded that no impairment exists as of September 30, 2014 and 2013. All of the goodwill is expected to be deductible for tax purposes. Changes in the net carrying amount of goodwill were as follows:
Balance at September 30, 2012 | $ | 7,015 | |
Goodwill acquired during the year | 605 | ||
Balance at September 30, 2013 | $ | 7,620 | |
Balance at September 30, 2013 | $ | 7,620 | |
Goodwill purchase price adjustment | 38 | ||
Balance at September 30, 2014 | $ | 7,658 | |
4. Accrued Liabilities
Accrued liabilities at September 30 consist of:
2014 | 2013 | ||||||
Accrued employee compensation and benefits | $ | 2,918 | $ | 3,156 | |||
Accrued workers’ compensation | 937 | 753 | |||||
Accrued dividends | 1,090 | 1,081 | |||||
Deferred Revenues | 191 | 1,296 | |||||
Other accrued liabilities | 1,296 | 1,384 | |||||
Total accrued liabilities | $ | 6,432 | $ | 7,670 | |||
5. Long-Term Debt
Long-term debt at September 30 consists of:
2014 | 2013 | ||||||
Revolving credit agreement | $ | 6,429 | $ | 3,381 | |||
Term loan | 4,000 | 6,000 | |||||
Promissory Note | — | 2,392 | |||||
10,429 | 11,773 | ||||||
Less – current maturities | 2,000 | 4,392 | |||||
Total long-term debt | $ | 8,429 | $ | 7,381 | |||
In October 2011, the Company entered into an amendment to its existing credit agreement with its bank to increase the maximum borrowing amount from $30,000 to $40,000, of which $10,000 is a five (5) year term loan and $30,000 is a five (5) year revolving loan, secured by substantially all the assets of the Company and its U.S. subsidiaries and a pledge of 65% of the stock of its non-U.S. subsidiaries. The term loan is repayable in quarterly installments of $500 starting December 1, 2011.
The term loan has a LIBOR-based variable interest rate that was 2.2% at September 30, 2014 and which becomes an effective fixed rate of 2.9% after giving effect to an interest rate swap agreement. Borrowing under the revolving loan bears interest at a rate equal to LIBOR plus 0.75% to 1.75%, which percentage fluctuates based on the Company’s leverage ratio of outstanding indebtedness to EBITDA. At September 30, 2014 the interest rate was 1.00%. The loans are subject to certain customary financial covenants including, without limitation, covenants that require the Company to not exceed a maximum leverage ratio and to maintain a minimum fixed charge coverage ratio. In September 2014, the Company entered into an amendment to its existing credit agreement to revise the definition of the fixed charge coverage ratio. There is also a commitment fee ranging from 0.10% to 0.25% to be incurred on the unused balance. The Company was in compliance with all applicable loan covenants as of September 30, 2014 and 2013.
In connection with the purchase of the forging business and substantially all related operating assets from GEL Industries, Inc. (DBA Quality Aluminum Forge) ("Orange"), as discussed more fully in Note 12, the Company issued a $2,400 non-interest bearing promissory note to the seller, which note was paid by the Company in November 2013. The imputed interest rate used to discount the note was 2% per annum.
38
SIFCO Industries, Inc. and Subsidiaries
Notes to Consolidated Financial Statements – (Continued)
6. Income Taxes
The components of income from continuing operations before income tax provision are as follows:
Years Ended September 30, | |||||||||||
2014 | 2013 | 2012 | |||||||||
U.S | $ | 7,984 | $ | 13,671 | $ | 8,855 | |||||
Non-U.S | 372 | 175 | 313 | ||||||||
Income before income tax provision | $ | 8,356 | $ | 13,846 | $ | 9,168 | |||||
Income taxes from continuing operations before income tax provision consist of the following:
Years Ended September 30, | |||||||||||
2014 | 2013 | 2012 | |||||||||
Current income tax provision: | |||||||||||
U.S. federal | $ | 2,847 | $ | 4,055 | $ | 2,617 | |||||
U.S. state and local | 101 | 489 | 514 | ||||||||
Non-U.S | 77 | 111 | 70 | ||||||||
Total current tax provision | 3,025 | 4,655 | 3,201 | ||||||||
Deferred income tax provision (benefit): | |||||||||||
U.S. federal | (329 | ) | (540 | ) | (324 | ) | |||||
U.S. state and local | 57 | (27 | ) | (16 | ) | ||||||
Total deferred tax provision (benefit) | (272 | ) | (567 | ) | (340 | ) | |||||
Income tax provision | $ | 2,753 | $ | 4,088 | $ | 2,861 | |||||
The income tax provision differs from amounts currently payable or refundable due to certain items reported for financial statement purposes in periods that differ from those in which they are reported for tax purposes. The income tax provision from continuing operations in the accompanying consolidated statements of operations differs from amounts determined by using the statutory rate as follows:
Years Ended September 30, | |||||||||||
2014 | 2013 | 2012 | |||||||||
Income before income tax provision | $ | 8,356 | $ | 13,846 | $ | 9,168 | |||||
Less-U.S. state and local income tax provision | 101 | 489 | 514 | ||||||||
Income before U.S. and non-U.S. federal income tax provision | $ | 8,255 | $ | 13,357 | $ | 8,654 | |||||
Income tax provision at U.S. federal statutory rates | $ | 2,889 | $ | 4,675 | $ | 2,942 | |||||
Tax effect of: | |||||||||||
Permanent items | (94 | ) | (255 | ) | (213 | ) | |||||
Undistributed earnings of non-U.S. subsidiaries | (13 | ) | (60 | ) | (185 | ) | |||||
Prior year tax adjustments | 41 | (181 | ) | — | |||||||
State and local income taxes | 161 | 453 | 498 | ||||||||
Federal tax credits | (178 | ) | (766 | ) | (272 | ) | |||||
Change in valuation allowance | 105 | 139 | 127 | ||||||||
Changes in uncertain tax positions | (108 | ) | 57 | — | |||||||
Other | (50 | ) | 26 | (36 | ) | ||||||
Income tax provision | $ | 2,753 | $ | 4,088 | $ | 2,861 | |||||
39
SIFCO Industries, Inc. and Subsidiaries
Notes to Consolidated Financial Statements – (Continued)
Deferred tax assets and liabilities at September 30 consist of the following:
2014 | 2013 | ||||||
Deferred tax assets: | |||||||
Net non-U.S. operating loss carryforwards | $ | 592 | $ | 592 | |||
Employee benefits | 2,581 | 1,884 | |||||
Inventory reserves | 495 | 521 | |||||
Asset impairment reserve | — | 27 | |||||
Allowance for doubtful accounts | 84 | 143 | |||||
Foreign tax credits to undistributed earnings | 1,940 | 1,932 | |||||
Foreign tax credits | 492 | 464 | |||||
Other | 87 | 105 | |||||
Total deferred tax assets | 6,271 | 5,668 | |||||
Deferred tax liabilities: | |||||||
Depreciation | (1,854 | ) | (2,524 | ) | |||
Unremitted foreign earnings | (2,997 | ) | (3,002 | ) | |||
Prepaid expenses | (580 | ) | (170 | ) | |||
Total deferred tax liabilities | (5,431 | ) | (5,696 | ) | |||
Net deferred tax assets (liabilities) | 840 | (28 | ) | ||||
Valuation allowance | (823 | ) | (718 | ) | |||
Net deferred tax assets (liabilities) | $ | 17 | $ | (746 | ) | ||
At September 30, 2014, the Company has a non-U.S. tax loss carryforward of approximately $5,458, which relates to the Company’s Irish subsidiary that ceased operations in 2007. A valuation allowance has been recorded against the deferred tax asset related to this non-U.S. tax loss carryforward because it is unlikely that such operating loss can be utilized unless the Irish subsidiary resumed operations. The non-U.S. tax loss carryforward does not expire. The Company has $492 of foreign tax credit carryforwards that are subject to expiration in fiscal 2023.
The Company recognized a $105 increase in the valuation allowance against deferred tax assets in fiscal 2014 and a $139 increase in the valuation allowance against deferred tax assets in fiscal 2013.
The Company reported liabilities for uncertain tax positions, excluding any related interest and penalties, in fiscal 2014 and 2013 of $56 and $164, respectively. If recognized, $56 of the fiscal 2014 uncertain tax positions would impact the effective tax rate. As of September 30, 2014, the Company had accrued interest of$11 and recognized a nominal amount for interest and no amount for penalties. The Company classifies interest and penalties on uncertain tax positions as income tax expense. A summary of activity related to the Company’s uncertain tax position is as follows:
2014 | 2013 | ||||||
Balance at beginning of year | $ | 164 | $ | 110 | |||
Increase due to tax positions taken in current year | — | 54 | |||||
Decrease due to tax positions taken in prior years | (108 | ) | — | ||||
Balance at end of year | $ | 56 | $ | 164 | |||
The Company is subject to income taxes in the U.S. federal jurisdiction, Ireland and various states and local jurisdictions. The Company believes it has appropriate support for its federal income tax returns. The Company is no longer subject to U.S. federal income tax examinations by tax authorities for fiscal years prior to 2012, state and local income tax examinations for fiscal years prior to 2008, or non-U.S. income tax examinations by tax authorities for fiscal years prior to 2007.
40
SIFCO Industries, Inc. and Subsidiaries
Notes to Consolidated Financial Statements – (Continued)
7. Retirement Benefit Plans
Defined Benefit Plans
The Company and certain of its subsidiaries sponsor defined benefit pension plans covering most of its employees. The Company’s funding policy for its defined benefit pension plans is based on an actuarially determined cost method allowable under Internal Revenue Service regulations. One of the defined benefit pension plans covers substantially all non-union employees of the Company’s U.S. operations who were hired prior to March 1, 2003, and this plan was frozen in 2003. Another plan covered the Repair Group's union employees and no longer has active participants due to the business being discontinued at September 30, 2013. Consequently, although both plans continue, the non-union plan ceased the accrual of additional pension benefits for service subsequent to March 1, 2003, and due to the discontinued operations of the Repair Group, the related union plan will have no participants accrue any additional benefits subsequent to December 31, 2013.
The Company uses a September 30 measurement date for its U.S. defined benefit pension plans. Net pension expense, benefit obligations and plan assets for the Company-sponsored defined benefit pension plans consists of the following:
Years Ended September 30, | |||||||||||
2014 | 2013 | 2012 | |||||||||
Service cost | $ | 126 | $ | 288 | $ | 266 | |||||
Interest cost | 987 | 851 | 988 | ||||||||
Expected return on plan assets | (1,573 | ) | (1,485 | ) | (1,413 | ) | |||||
Amortization of prior service cost | — | 8 | 47 | ||||||||
Amortization of net loss | 450 | 917 | 861 | ||||||||
Settlement cost | — | 299 | 513 | ||||||||
Curtailment cost | — | 252 | — | ||||||||
Net pension (benefit) expense for defined benefit plan | $ | (10 | ) | $ | 1,130 | $ | 1,262 | ||||
As more fully discussed in Note 13, the Company exited the Repair Group in fiscal 2013. During fiscal 2013, the Repair Group incurred $252 of curtailment cost due to the discontinuation of the Repair Group.
The status of all defined benefit pension plans at September 30 is as follows:
2014 | 2013 | ||||||
Benefit obligations: | |||||||
Benefit obligations at beginning of year | $ | 23,596 | $ | 26,306 | |||
Service cost | 126 | 288 | |||||
Interest cost | 987 | 851 | |||||
Actuarial loss (gain) | 2,737 | (2,624 | ) | ||||
Benefits paid | (1,306 | ) | (1,454 | ) | |||
Curtailment expense | — | $ | 229 | ||||
Benefit obligations at end of year | $ | 26,140 | $ | 23,596 | |||
Plan assets: | |||||||
Plan assets at beginning of year | $ | 20,435 | $ | 18,949 | |||
Actual return on plan assets | 2,465 | 2,154 | |||||
Employer contributions | 516 | 786 | |||||
Benefits paid | (1,306 | ) | (1,454 | ) | |||
Plan assets at end of year | $ | 22,110 | $ | 20,435 | |||
41
SIFCO Industries, Inc. and Subsidiaries
Notes to Consolidated Financial Statements – (Continued)
Plans in which Assets Exceed Benefit Obligations at September 30, | Plans in which Benefit Obligations Exceed Assets at September 30, | ||||||||||||||
2014 | 2013 | 2014 | 2013 | ||||||||||||
Reconciliation of funded status: | |||||||||||||||
Plan assets in excess of (less than) projected benefit obligations | $ | 347 | $ | 1,086 | $ | (4,377 | ) | $ | (4,246 | ) | |||||
Amounts recognized in accumulated other comprehensive loss: | |||||||||||||||
Net loss | 1,090 | 297 | 6,576 | 5,972 | |||||||||||
Prior service cost | — | — | — | — | |||||||||||
Net amount recognized in the consolidated balance sheets | $ | 1,437 | $ | 1,383 | $ | 2,199 | $ | 1,726 | |||||||
Amounts recognized in the consolidated balance sheets are: | |||||||||||||||
Other assets | $ | 347 | $ | 1,086 | $ | — | $ | — | |||||||
Accrued liabilities | — | — | (46 | ) | (46 | ) | |||||||||
Pension liability | — | — | (4,331 | ) | (4,200 | ) | |||||||||
Accumulated other comprehensive loss – pretax | 1,090 | 297 | 6,576 | 5,972 | |||||||||||
Net amount recognized in the consolidated balance sheets | $ | 1,437 | $ | 1,383 | $ | 2,199 | $ | 1,726 | |||||||
The amounts in accumulated other comprehensive loss that are expected to be recognized as components of net periodic benefit costs during fiscal 2015 are as follows:
Plans in which Assets Exceed Benefit Obligations | Plans in which Benefit Obligations Exceed Assets | ||||||
Net loss | $ | 495 | $ | 595 | |||
Where applicable, the following weighted-average assumptions were used in developing the benefit obligation and the net pension expense for defined benefit pension plans:
Years Ended September 30, | |||||
2014 | 2013 | ||||
Discount rate for liabilities | 3.9 | % | 4.4 | % | |
Discount rate for expenses | 4.4 | % | 3.4 | % | |
Expected return on assets | 8.1 | % | 8.1 | % | |
The Company classifies and discloses pension plan assets in one of the following three categories: (i) Level 1 - quoted market prices in active markets for identical assets; (ii) Level 2 - observable market based inputs or unobservable inputs that are corroborated by market data; or (iii) Level 3 - unobservable inputs that are not corroborated by market data. Level 1 and Level 2 assets are valued using market based inputs. Level 3 asset values are determined by the trustees using a discounted cash flow model.
42
SIFCO Industries, Inc. and Subsidiaries
Notes to Consolidated Financial Statements – (Continued)
The following tables set forth the asset allocation of the Company’s defined benefit pension plan assets and summarize the fair values and levels within the fair value hierarchy for such plan assets as of September 30, 2014 and 2013:
September 30, 2014 | Asset Amount | Level 1 | Level 2 | Level 3 | |||||||||||
U.S. equity securities: | |||||||||||||||
Large value | $ | 629 | $ | — | $ | 629 | $ | — | |||||||
Large blend | 10,626 | — | 10,626 | — | |||||||||||
Large growth | 631 | — | 631 | — | |||||||||||
Mid blend | 64 | — | 64 | — | |||||||||||
Small blend | 55 | — | 55 | — | |||||||||||
Non-U.S equity securities: | |||||||||||||||
Foreign large blend | 1,679 | — | 1,679 | — | |||||||||||
Diversified emerging markets | 83 | — | 83 | — | |||||||||||
U.S. debt securities: | |||||||||||||||
Inflation protected bond | 562 | — | 562 | — | |||||||||||
Intermediate term bond | 7,001 | — | 4,899 | 2,102 | |||||||||||
High inflation bond | 233 | — | 233 | — | |||||||||||
Non-U.S. debt securities: | |||||||||||||||
Emerging markets bonds | 226 | — | 226 | — | |||||||||||
Stable value: | |||||||||||||||
Short-term bonds | 321 | — | 321 | — | |||||||||||
Total plan assets at fair value | $ | 22,110 | $ | — | $ | 20,008 | $ | 2,102 | |||||||
September 30, 2013 | Asset Amount | Level 1 | Level 2 | Level 3 | |||||||||||
U.S. equity securities: | |||||||||||||||
Large value | $ | 518 | $ | — | $ | 518 | $ | — | |||||||
Large blend | 9,632 | — | 9,632 | — | |||||||||||
Large growth | 496 | — | 496 | — | |||||||||||
Mid blend | 233 | — | 233 | — | |||||||||||
Small blend | 245 | — | 245 | — | |||||||||||
Non-U.S equity securities: | |||||||||||||||
Foreign large blend | 1,617 | — | 1,617 | — | |||||||||||
Diversified emerging markets | 31 | — | 31 | — | |||||||||||
U.S. debt securities: | |||||||||||||||
Inflation protected bond | 521 | — | 521 | — | |||||||||||
Intermediate term bond | 6,231 | — | 4,232 | 1,999 | |||||||||||
High inflation bond | 310 | — | 310 | — | |||||||||||
Non-U.S. debt securities: | |||||||||||||||
Emerging markets bonds | 102 | — | 102 | — | |||||||||||
Stable value: | |||||||||||||||
Short-term bonds | 499 | 499 | — | ||||||||||||
Total plan assets at fair value | $ | 20,435 | $ | — | $ | 18,436 | $ | 1,999 | |||||||
43
SIFCO Industries, Inc. and Subsidiaries
Notes to Consolidated Financial Statements – (Continued)
Changes in the fair value of the Company’s Level 3 investments during the years ending September 30, 2014 and 2013 were as follows:
2014 | 2013 | ||||||
Balance at beginning of year | $ | 1,999 | $ | 2,093 | |||
Actual return on plan assets | 96 | 2 | |||||
Purchases and sales of plan assets, net | 7 | (96 | ) | ||||
Balance at end of year | $ | 2,102 | $ | 1,999 | |||
Investment objectives relative to the assets of the Company’s defined benefit pension plans are to (i) optimize the long-term return on the plans’ assets while assuming an acceptable level of investment risk; (ii) maintain an appropriate diversification across asset categories and among investment managers; and (iii) maintain a careful monitoring of the risk level within each asset category. Asset allocation objectives are established to promote optimal expected returns and volatility characteristics given the long-term time horizon for fulfilling the obligations of the Company’s defined benefit pension plans. Selection of the appropriate asset allocation for the plans’ assets was based upon a review of the expected return and risk characteristics of each asset category in relation to the anticipated timing of future plan benefit payment obligations. The Company has a long-term objective for the allocation of plan assets. However, the Company realizes that actual allocations at any point in time will likely vary from this objective due principally to (i) the impact of market conditions on plan asset values and (ii) required cash contributions to and distribution from the plans. The “Asset Allocation Range” listed below anticipates these potential scenarios and provides flexibility for the Plan’s investments to vary around the objective without triggering a reallocation of the assets, as noted by the following:
Percent of Plan Assets at September 30, | Asset Allocation Range | ||||||
2014 | 2013 | ||||||
U.S. equities | 54 | % | 54 | % | 30% to 70% | ||
Non-U.S. equities | 8 | % | 8 | % | 0% to 20% | ||
U.S. debt securities | 35 | % | 35 | % | 20% to 70% | ||
Non-U.S. debt securities | 1 | % | 1 | % | 0% to 10% | ||
Other securities | 2 | % | 2 | % | 0% to 60% | ||
Total | 100 | % | 100 | % | |||
External consultants assist the Company with monitoring the appropriateness of the above investment strategy and the related asset mix and performance. To develop the expected long-term rate of return assumptions on plan assets, generally the Company uses long-term historical information for the target asset mix selected. Adjustments are made to the expected long-term rate of return assumptions when deemed necessary based upon revised expectations of future investment performance of the overall investments markets.
The Company does not anticipate making any contributions to its defined benefit pension plans during fiscal 2015. The Company has carryover balances from previous periods that may be available for use as a credit to reduce the amount of contributions that the Company is required to make to certain of its defined benefit pension plans in fiscal 2015. The Company’s ability to elect to use such carryover balances will be determined based on the actual funded status of each defined benefit pension plan relative to the plan’s minimum regulatory funding requirements. The following defined benefit payment amounts are expected to be made in the future:
Years Ending September 30, | Projected Benefit Payments | ||
2015 | $ | 1,457 | |
2016 | 1,359 | ||
2017 | 1,802 | ||
2018 | 1,930 | ||
2019 | 1,635 | ||
2020-2024 | 8,652 | ||
44
SIFCO Industries, Inc. and Subsidiaries
Notes to Consolidated Financial Statements – (Continued)
Multi-Employer Plans
The Company contributes to one (1) U.S. multi-employer retirement plan for certain union employees, as follow:
Pension Fund | Pension Protection Act Zone Status | FIP/RP Status Pending/ Implemented | Contributions by the Company | Surcharge Imposed | Expiration of Collective Bargaining Agreement | |||||||||||||||||
2014 | 2013 | 2014 | 2013 | 2012 | ||||||||||||||||||
Fund ¹ | Green | Green | No | $ | 54 | $ | 50 | $ | 52 | No | 5/31/2015 | |||||||||||
¹ The fund is the IAM National Pension Fund – EIN 51-6031295 / Plan number 2. The IAM National Pension Fund utilized the special 30-year amortization provided by Public law 111-192, section 211 to amortize its losses from 2008.
The plan's year-end to which the zone status relates is December 31, 2013 and 2012.
At December 31, 2013, the Company exited the Boilermaker-Blacksmith National Pension Trust. The Company incurred a withdrawal liability in the amount of $54. Prior to exiting the multi-employer retirement plan, the Company incurred expense of $52, $213 and $205 in fiscal 2014, 2013 and 2012, respectively.
The risks of participating in the multi-employer retirement plan are different from a single-employer plan in that (i) assets contributed to the multi-employer plan by one employer may be used to provide benefits to employees of other participating employers; (ii) if a participating employer stops contributing to the plan, the unfunded obligations of the plan may be borne by the remaining participating employers; and (iii) if the Company chooses to stop participating in the multi-employer retirement plan, the Company may be required to pay the plan an amount based on the unfunded status of the plan, referred to as a withdrawal liability.
Defined Contribution Plans
Substantially all non-union U.S. employees of the Company and its U.S. subsidiaries are eligible to participate in the Company’s U.S. defined contribution plan. The Company makes non-discretionary, regular matching contributions to this plan equal to an amount that represents one hundred percent (100%) of a participant’s deferral contribution up to one percent (1%) of eligible compensation plus eighty percent (80%) of a participant’s deferral contribution between one percent (1%) and six percent (6%)of eligible compensation. The Company’s regular matching contribution expense for its U.S. defined contribution plan in fiscal 2014, 2013 and 2012 was $696, $504 and $429, respectively. This defined contribution plan provides that the Company may also make an additional discretionary matching contribution during those periods in which the Company achieves certain performance levels. The Company’s additional discretionary matching contribution expense in fiscal 2014, 2013 and 2012 was $294, $253 and $54, respectively.
8. Stock-Based Compensation
In previous periods, the Company awarded stock options under two shareholder approved plans. No further options may be granted under either of the two plans. The option exercise price is not less than fair market value on date of grant and options are exercisable no later than ten years from date of grant. All options awarded under both plans are fully vested as of September 30, 2014 and 2013.
As of September 30, 2014, 2013 and 2012, there was no unrecognized compensation cost related to the stock options granted under the Company’s stock option plans. There was no compensation expense related to stock options recognized in fiscal years 2014, 2013 and 2012. As of September 30, 2014, all options have been exercised.
The Company has awarded performance and restricted shares under its shareholder approved 2007 Long-Term Incentive Plan (“2007 Plan”). The aggregate number of shares that may be awarded under the 2007 Plan is 600 less any shares previously awarded and subject to an adjustment for the forfeiture of any unissued shares. In addition, shares that may be awarded are subject to individual recipient award limitations. The shares awarded under the 2007 Plan may be made in multiple forms including stock options, stock appreciation rights, restricted or unrestricted stock, and performance related shares. Any such awards are exercisable no later than ten years from date of grant.
The performance shares that have been awarded under the 2007 Plan generally provide for the issuance of the Company’s common shares upon the Company achieving certain defined financial performance objectives during a period up to three years following the making of such award. The ultimate number of common shares of the Company that may be earned pursuant to an award ranges from a minimum of no shares to a maximum of 150% of the initial target number of performance shares awarded, depending on the level of the Company’s achievement of its financial performance objectives.
45
SIFCO Industries, Inc. and Subsidiaries
Notes to Consolidated Financial Statements – (Continued)
With respect to such performance shares, compensation expense is being accrued. During each future reporting period, such expense may be subject to adjustment based upon the Company’s financial performance, which impacts the number of common shares that it expects to issue upon the completion of the performance period. The performance shares were valued at the closing market price of the Company’s common shares on the date of grant. The vesting of such shares is determined at the end of the performance period.
The Company has awarded restricted shares to certain of its directors, officers and other employees of the Company. The restricted shares were valued at the closing market price of the Company’s common shares on the date of grant, and such value was recorded as unearned compensation. The unearned compensation is being amortized ratably over the restricted stock vesting period of one (1) year.
If all outstanding share awards are ultimately earned and issued at the target number of shares, then at September 30, 2014 there are approximately 290 shares that remain available for award. If any of the outstanding share awards are ultimately earned and issued at greater than the target number of shares, up to a maximum of 150% of such target, then a fewer number of shares would be available for award.
Stock-based compensation expense under the 2007 Plan was $1,572, $280 and $892 during fiscal 2014, 2013 and 2012, respectively. The Company recorded income tax benefits in Additional Paid-in Capital of $228, $18 and $59 in fiscal 2014, 2013 and 2012, respectively, related to stock options and common shares that were earned under the 2007 Plan. As of September 30, 2014, there was $1,992 of total unrecognized compensation cost related to the performance and restricted shares awarded under the 2007 Plan. The Company expects to recognize this cost over the next two (2) years.
The following is a summary of activity related to performance shares:
2014 | 2013 | 2012 | ||||||||||||||||||
Number of Shares | Weighted Average Fair Value at Date of Grant | Number of Shares | Weighted Average Fair Value at Date of Grant | Number of Shares | Weighted Average Fair Value at Date of Grant | |||||||||||||||
Outstanding at beginning of year | 154 | $ | 17.85 | 158 | $ | 18.30 | 135 | $ | 13.25 | |||||||||||
Restricted shares awarded | 26 | 25.34 | 12 | 15.50 | 27 | 22.08 | ||||||||||||||
Restricted shares earned | (25 | ) | 18.94 | (5 | ) | 22.00 | (11 | ) | 16.30 | |||||||||||
Performance shares awarded | 112 | 26.50 | 60 | 15.98 | 59 | 19.53 | ||||||||||||||
Performance shares earned | (21 | ) | 16.42 | (33 | ) | 16.05 | (9 | ) | 5.99 | |||||||||||
Awards forfeited | (72 | ) | 17.12 | (38 | ) | 17.00 | (43 | ) | 9.73 | |||||||||||
Outstanding at end of year | 174 | $ | 24.86 | 154 | $ | 17.85 | 158 | $ | 18.30 | |||||||||||
46
9. Commitments and Contingencies
In the normal course of business, the Company may be involved in ordinary, routine legal actions. The Company cannot reasonably estimate future costs, if any, related to these matters; however, it does not believe any such matters are material to its financial condition or results of operations. The Company maintains various liability insurance coverages to protect its assets from losses arising out of or involving activities associated with ongoing and normal business operations; however, it is possible that the Company’s future operating results could be affected by future costs of litigation.
The Company leases various facilities and equipment under operating leases expiring through 2034. The Company recorded rent expense of $675, $752 and $537 in fiscal 2014, 2013, and 2012, respectively. At September 30, 2014, minimum rental commitments under non-cancelable leases are as follows:
Year ending September 30, | Operating Leases | ||
2015 | $ | 842 | |
2016 | 743 | ||
2017 | 731 | ||
2018 | 587 | ||
2019 | 504 | ||
Thereafter | 7,215 | ||
Total minimum lease payments | $ | 10,622 | |
10. Business Information
As discussed more fully in Note 13, on December 10, 2012, the Company divested ASC, a provider of specialized selective plating processes and services used to apply metal coatings to a selective area of a component, and the Company discontinued operations of the Repair Group, a repairer and remanufacturer of small aerospace and industrial turbine engine components as of September 30, 2013. The Company identifies itself as one reportable segment, SIFCO, which is a manufacturer of forgings and machined components for the Aerospace & Energy ("A&E) markets.
Geographic net sales are based on location of customer. The United States of America is the single largest country for unaffiliated customer sales, accounting for 80%, 79% and 81% of consolidated net sales in fiscal 2014, 2013 and 2012, respectively. No other single country represents greater than 10% of consolidated net sales in fiscal 2014, 2013 and 2012. Net sales to unaffiliated customers located in various European countries accounted for 6%, 4% and 9% of consolidated net sales in fiscal 2014, 2013 and 2012, respectively. Net sales to unaffiliated customers located in various Asian countries accounted for 7%, 7% and 6% of consolidated net sales in fiscal 2014, 2013 and 2012, respectively.
Substantially all of the Company's operations and identifiable assets are located within the United States. Identifiable assets for the Company's non-operating Irish subsidiary consist of cash and the Company's Cork, Ireland facility.
47
SIFCO Industries, Inc. and Subsidiaries
Notes to Consolidated Financial Statements – (Continued)
11. Summarized Quarterly Results (unaudited)
Fiscal 2014 Quarter Ended | |||||||||||||||
Dec. 31 | March 31 | June 30 | Sept. 30 | ||||||||||||
Net sales | $ | 26,652 | $ | 29,044 | $ | 30,999 | $ | 32,959 | |||||||
Gross profit | 5,570 | 6,304 | 7,157 | 6,894 | |||||||||||
Income from continuing operations | 1,154 | 1,511 | 1,983 | 955 | |||||||||||
Income (loss) from discontinued operations, net of tax | (207 | ) | (85 | ) | (76 | ) | (212 | ) | |||||||
Net income | 947 | 1,426 | 1,907 | 743 | |||||||||||
Income per share from continuing operations | |||||||||||||||
Basic | 0.22 | 0.28 | 0.37 | 0.17 | |||||||||||
Diluted | 0.21 | 0.28 | 0.37 | 0.17 | |||||||||||
Income (loss) per share from discontinued operations, net of tax | |||||||||||||||
Basic | (0.04 | ) | (0.02 | ) | (0.01 | ) | (0.04 | ) | |||||||
Diluted | (0.04 | ) | (0.02 | ) | (0.01 | ) | (0.04 | ) | |||||||
Net Income (loss) per share | |||||||||||||||
Basic | 0.18 | 0.26 | 0.36 | 0.13 | |||||||||||
Diluted | 0.17 | 0.26 | 0.36 | 0.13 | |||||||||||
Fiscal 2013 Quarter Ended | |||||||||||||||
Dec. 31 | March 31 | June 30 | Sept. 30 | ||||||||||||
Net sales | $ | 27,445 | $ | 28,004 | $ | 28,672 | $ | 31,880 | |||||||
Gross profit | 5,862 | 5,906 | 7,713 | 8,534 | |||||||||||
Income from continuing operations | 1,177 | 1,769 | 2,865 | 3,947 | |||||||||||
Income (loss) from discontinued operations, net of tax | 2,238 | (334 | ) | (387 | ) | (1,041 | ) | ||||||||
Net income | 3,415 | 1,435 | 2,478 | 2,906 | |||||||||||
Income per share from continuing operations: | |||||||||||||||
Basic | $ | 0.22 | $ | 0.33 | $ | 0.53 | $ | 0.74 | |||||||
Diluted | $ | 0.22 | $ | 0.33 | $ | 0.53 | $ | 0.73 | |||||||
Income (loss) per share from discontinued operations, net of tax: | |||||||||||||||
Basic | $ | 0.42 | $ | (0.06 | ) | $ | (0.07 | ) | $ | (0.20 | ) | ||||
Diluted | $ | 0.41 | $ | (0.06 | ) | $ | (0.07 | ) | $ | (0.19 | ) | ||||
Net Income (loss) per share: | |||||||||||||||
Basic | $ | 0.64 | $ | 0.27 | $ | 0.46 | $ | 0.54 | |||||||
Diluted | $ | 0.63 | $ | 0.27 | $ | 0.46 | $ | 0.54 | |||||||
48
SIFCO Industries, Inc. and Subsidiaries
Notes to Consolidated Financial Statements – (Continued)
12. Business Acquisition
On July 23, 2013, SIFCO Industries, Inc. completed the purchase of the forging business and substantially all related operating assets from MW General, Inc. (DBA General Aluminium Forgings). The forging business is operated in General Aluminum Forgings, LLC's ("Colorado Springs") Colorado Springs, Colorado facility, which is leased. The purchase price for the forging business and related operating assets and liabilities was approximately $4,400 payable in cash, which includes a purchase price adjustment of $123 received in the fourth quarter of fiscal 2013 related to certain adjustments principally to the final working capital level and/or indemnification holdback provisions under the purchase agreement. The Company recorded net sales of $1,100 and net operating loss of $216 from the date of acquisition through September 30, 2013.
The Colorado Springs purchase transaction is accounted for under the purchase method of accounting. The Company has completed the purchase accounting related to the Colorado Springs acquisition. The fair values of assets acquired and liabilities assumed, were based upon appraisals, other studies and additional information available at the time of the acquisition of Colorado Springs. The Company believes that such information provided a reasonable basis for determining the fair values of the assets acquired and liabilities assumed. To the extent the purchase price exceeded the estimated fair value of the net identifiable tangible and intangible assets acquired and assumed, such excess was allocated to goodwill. The following table summarizes the Company's purchase price allocation of the estimated fair values of the assets acquired and liabilities assumed:
July 23, 2013 | |||
Assets acquired: | |||
Accounts receivable | $ | 645 | |
Inventory | 1,173 | ||
Property and equipment | 1,369 | ||
Intangible assets | 1,100 | ||
Goodwill | 643 | ||
Other | 27 | ||
4,957 | |||
Liabilities assumed: | |||
Accounts payable and accrued liabilities | 570 | ||
Total purchase price | $ | 4,387 | |
On October 28, 2011, through its wholly-owned subsidiary, Forge Acquisition, LLC – now known as Quality Aluminum Forgings, LLC and referred to herein as "Orange." The Company completed the purchase of the forging business and substantially all related operating assets from GEL Industries, Inc. (DBA Quality Aluminum Forge, Inc.). The forging business is operated in Orange’s Orange and Long Beach, California facilities, all of which are leased. The purchase price for the forging business and related operating assets was approximately $24,900 payable in cash, which includes a purchase price adjustment of $165 paid in the third quarter of fiscal 2012 for certain adjustments related principally to the final working capital level and/or indemnification holdback provisions under the purchase agreement. In addition, the Company has assumed certain current operating liabilities of the forging business. The Company recorded net sales of $19,200 and net operating income of $1,427 from the date of acquisition through September 30, 2012. The Orange purchase transaction was accounted for under the purchase method of accounting.
The results of operations of Colorado Springs and Orange from their respective dates of acquisition are included in the Company’s consolidated statements of operations. The following unaudited pro forma information presents a summary of the results of operations for the Company including Colorado Springs and Orange as if the acquisitions had occurred on October 1, 2012 and 2011, respectively:
Years Ended September 30, | |||||||
2013 | 2012 | ||||||
Net sales | $ | 120,439 | $ | 109,560 | |||
Net income | 10,349 | 6,528 | |||||
Net income per share (basic) | 1.93 | 1.23 | |||||
Net income per share (diluted) | 1.92 | 1.21 | |||||
49
SIFCO Industries, Inc. and Subsidiaries
Notes to Consolidated Financial Statements – (Continued)
13. Discontinued Operations, Assets Held for Sale, and Business Divestiture
As part of the Company's strategy to focus on the A&E market, the Company decided in the fourth quarter of fiscal 2013 to exit the Repair Group. The results of operations and cash flows from the Repair Group have been classified as discontinued operations for all periods presented. The Repair Group has terminated operations in the first quarter of fiscal 2014. As of September 30, 2014 the Company retained the net working capital and the building. The Company expects to sell the building in first quarter of fiscal 2015.
As a result of the decision to exit the Repair Group, the assets and liabilities of the Repair Group have been classified as assets and liabilities from discontinued operations at September 30, 2014 and 2013.
The assets and liabilities were comprised of the following:
September 30, | |||||||
2014 | 2013 | ||||||
Assets: | |||||||
Receivables, net | $ | 91 | $ | 1,067 | |||
Inventories, net | — | 660 | |||||
Deferred income taxes | 15 | 317 | |||||
Prepaid expenses and other current assets | 22 | 15 | |||||
Total current assets of business from discontinued operations | $ | 128 | $ | 2,059 | |||
Current assets held for sale | $ | 264 | $ | 278 | |||
Property, plant and equipment, net | — | 840 | |||||
Other assets | — | 32 | |||||
Total noncurrent assets of business from discontinued operations | $ | — | $ | 872 | |||
Liabilities: | |||||||
Accounts payable | $ | 23 | $ | 278 | |||
Accrued liabilities | 173 | 808 | |||||
Total current liabilities of business from discontinued operations | $ | 196 | $ | 1,086 | |||
As of September 30, 2013, certain assets are recorded at the lower of carrying value or fair value. The Company recognized within the Repair Group an impairment charge of $354 in fiscal 2013 to write-down assets to their estimated fair value.
The financial results of Repair Group included in discontinued operations were as follows:
Years Ended September 30, | |||||||||||
2014 | 2013 | 2012 | |||||||||
Net sales | $ | 1,339 | $ | 5,964 | $ | 7,184 | |||||
Loss before income tax provision | (808 | ) | (3,104 | ) | (1,142 | ) | |||||
Income tax provision (benefit) | (228 | ) | (1,061 | ) | (435 | ) | |||||
Income (loss) from discontinued operations, net of tax | $ | (580 | ) | $ | (2,043 | ) | $ | (707 | ) | ||
As the Company exited the Repair Group, the Company recognized $959 in workforce reduction costs of which $685 was incurred in fiscal 2013 and $6 was paid in fiscal 2013 and the remaining $274 was recognized and was paid in fiscal 2014.
On December 10, 2012, the Company completed the divestiture of its ASC business segment. The Company received cash proceeds, net of certain transaction fees, of approximately $8,100 for this business and $980 was placed in escrow, pending expiration in June 2014 of indemnification holdback provisions under the sale agreement. The ASC business included its U.S. operations, headquartered in Cleveland, Ohio, and three European operations located in France, Sweden and the United Kingdom. ASC business developed, manufactured and sold selective plating products and provided contract services for low volume repair, refurbishment and OEM applications. The transaction resulted in a pre-tax gain of $3,980 in fiscal 2013. The results of operations and cash flows from ASC have been classified as discontinued operations for all periods presented.
50
SIFCO Industries, Inc. and Subsidiaries
Notes to Consolidated Financial Statements – (Continued)
The financial results of ASC Group included in discontinued operations were as follows:
Years Ended September 30, | |||||||
2013 | 2012 | ||||||
Net sales | $ | 2,727 | $ | 15,022 | |||
Income before income tax provision | 180 | 1,375 | |||||
Income tax provision (benefit) | (11 | ) | 427 | ||||
Income (loss) from operations, net of tax | 191 | 948 | |||||
Gain (loss) on sale of discontinued operations, net of tax | 2,328 | — | |||||
Income (loss) from discontinued operations, net of tax | $ | 2,519 | $ | 948 | |||
51
Schedule II
SIFCO Industries, Inc. and Subsidiaries
Valuation and Qualifying Accounts
Years Ended September 30, 2014, 2013 and 2012
(Amounts in thousands)
Balance at Beginning of Period | Additions (Reductions) Charged to Expense | Additions (Reductions) Charged to Other Accounts | Deductions | Balance at End of Period | ||||||||||||||||
Year Ended September 30, 2014 | ||||||||||||||||||||
Deducted from asset accounts | ||||||||||||||||||||
Allowance for doubtful accounts | $ | 481 | 9 | 1 | (158 | ) | (a) | $ | 333 | |||||||||||
Inventory obsolescence reserve | 1,394 | 131 | (118 | ) | — | (b) | $ | 1,407 | ||||||||||||
Inventory LIFO reserve | 7,977 | (98 | ) | — | — | $ | 7,879 | |||||||||||||
Asset impairment reserve | 72 | — | (72 | ) | — | (c) | $ | — | ||||||||||||
Deferred tax valuation allowance | 718 | 104 | — | — | $ | 822 | ||||||||||||||
Accrual for estimated liability | ||||||||||||||||||||
Workers’ compensation reserve | 744 | 515 | — | (322 | ) | (d) | $ | 937 | ||||||||||||
Year Ended September 30, 2013 | ||||||||||||||||||||
Deducted from asset accounts | ||||||||||||||||||||
Allowance for doubtful accounts | $ | 500 | $ | 81 | $ | 47 | $ | (147 | ) | (a) | $ | 481 | ||||||||
Inventory obsolescence reserve | 1,192 | 520 | (318 | ) | — | (b) | 1,394 | |||||||||||||
Inventory LIFO reserve | 9,537 | (1,560 | ) | — | — | 7,977 | ||||||||||||||
Asset impairment reserve | 757 | 72 | — | (757 | ) | (c) | 72 | |||||||||||||
Deferred tax valuation allowance | 579 | 139 | — | — | 718 | |||||||||||||||
Accrual for estimated liability | ||||||||||||||||||||
Workers’ compensation reserve | 663 | 82 | — | (1 | ) | (d) | 744 | |||||||||||||
Year Ended September 30, 2012 | ||||||||||||||||||||
Deducted from asset accounts | ||||||||||||||||||||
Allowance for doubtful accounts | $ | 502 | $ | 107 | $ | 107 | $ | (216 | ) | (a) | $ | 500 | ||||||||
Inventory obsolescence reserve | 968 | (136 | ) | 365 | (5 | ) | (b) | 1,192 | ||||||||||||
Inventory LIFO reserve | 7,974 | 1,563 | — | — | 9,537 | |||||||||||||||
Asset impairment reserve | 757 | — | — | — | (c) | 757 | ||||||||||||||
Deferred tax valuation allowance | 452 | 127 | — | — | 579 | |||||||||||||||
Accrual for estimated liability | ||||||||||||||||||||
Workers’ compensation reserve | 655 | 173 | (6 | ) | (159 | ) | (d) | 663 | ||||||||||||
(a) | Accounts determined to be uncollectible, net of recoveries |
(b) | Inventory sold or otherwise disposed |
(c) | Equipment sold or otherwise disposed |
(d) | Payment of workers’ compensation claims |
52
Item 9. Changes in and Disagreements with Accountants on Accounting and Financial Disclosure
None.
Item 9A. Controls and Procedures
Evaluation of Disclosure Controls and Procedures
As required by Rule 13a-15(b) of the Securities Exchange Act of 1934 (the “Exchange Act”), management, with the participation of our Chief Executive Officer and Chief Financial Officer, evaluated, as of the end of the period covered by this report, the effectiveness of our disclosure controls and procedures as defined in Exchange Act Rule 13a-15(e). Based upon that evaluation, our Chief Executive Officer and Chief Financial Officer concluded that due to the material weaknesses in our internal control over financial reporting that are described below in Management’s Report on Internal Control over Financial Reporting, our disclosure controls and procedures were not effective as of September 30, 2014.
Notwithstanding the identified material weaknesses described below, our management does not believe that these deficiencies had an adverse effect on our reported operating results or financial condition and management has determined that the financial statements and other information included in this report and other periodic filings present fairly in all material respects our financial condition, results of operations and cash flows at and for the periods presented in accordance with accounting principles generally accepted in the United States (“GAAP”).
Management’s Report on Internal Control over Financial Reporting
Management is responsible for establishing and maintaining adequate internal control over financial reporting (as defined in Rule 13a-15(f) under the Exchange Act). Our internal control over financial reporting is a process designed to provide reasonable assurance regarding the reliability of financial reporting and the preparation of financial statements for external purposes in accordance with GAAP. Because of its inherent limitations, internal control over financial reporting may not prevent or detect misstatements. Also, projections of any evaluation of effectiveness to future periods are subject to the risk that controls may become inadequate because of changes in conditions, or that the degree of compliance with the policies or procedures may deteriorate.
Management, including our Chief Executive Officer and Chief Financial Officer, assessed the effectiveness of our internal control over financial reporting as of September 30, 2014. In making this assessment, our management used the criteria for effective internal control over financial reporting described in the 2013 “Internal Control-Integrated Framework” issued by the Committee of Sponsoring Organizations of the Treadway Commission. Based on this assessment, management has determined that due to the material weaknesses described below, our internal control over financial reporting was not effective as of September 30, 2014.
A material weakness is a deficiency, or a combination of deficiencies, in internal control over financial reporting, such that there is a reasonable possibility that a material misstatement of the Company’s annual or interim financial statements will not be prevented or detected on a timely basis. Material weaknesses in internal controls were identified in the following areas: segregation of duties within the information technology environment at one facility; and the precision and sufficiency of reviews performed on reconciliations and calculations around inventory related items.
Remediation Plan for Material Weakness in Internal Control over Financial Reporting
With the oversight of senior management and our audit committee, we took steps and plan to take additional measures to remediate the underlying causes of the material weaknesses. With respect to segregation of duties, we are in the process of implementing an ERP system across the Company that we anticipate will remediate this issue. Due to uncertainty around the timing of the ERP implementation at the facility with the segregation of duties issue, management is actively investigating other information technology tools and additional detective and monitoring controls to either eliminate or mitigate potential segregation of duties concerns.
With respect to the precision of reviews, management is designing procedures to enhance the precision of reviews and is adding controls to validate the accuracy of reconciliations.
While senior management and our audit committee are closely monitoring the implementation of these remediation plans, there is no assurance that the aforementioned plans will be sufficient and that additional steps may not be necessary.
The Company’s internal control over financial reporting as of September 30, 2014 has been audited by Grant Thornton LLP, as stated in their report which is included herein.
Changes in Internal Control over Financial Reporting and other Remediation
53
There have been no changes in the Company’s internal controls over financial reporting during the Company’s most recent fiscal quarter that have materially affected, or are reasonably likely to materially affect, the Company’s internal controls over financial reporting.
54
Report of Independent Registered Public Accounting Firm
To the Board of Directors and Shareholders of SIFCO Industries, Inc. and Subsidiaries
We have audited the internal control over financial reporting of SIFCO Industries, Inc. (an Ohio Corporation) and Subsidiaries (the “Company”) as of September 30, 2014, based on criteria established in the 2013 Internal Control-Integrated Framework issued by the Committee of Sponsoring Organizations of the Treadway Commission (COSO). The Company’s management is responsible for maintaining effective internal control over financial reporting and for its assessment of the effectiveness of internal control over financial reporting, included in the accompanying Management’s Report on Internal Control over Financial Reporting (“Management’s Report”). Our responsibility is to express an opinion on the Company’s internal control over financial reporting based on our audit.
We conducted our audit in accordance with the standards of the Public Company Accounting Oversight Board (United States). Those standards require that we plan and perform the audit to obtain reasonable assurance about whether effective internal control over financial reporting was maintained in all material respects. Our audit included obtaining an understanding of internal control over financial reporting, assessing the risk that a material weakness exists, testing and evaluating the design and operating effectiveness of internal control based on the assessed risk, and performing such other procedures as we considered necessary in the circumstances. We believe that our audit provides a reasonable basis for our opinion.
A company’s internal control over financial reporting is a process designed to provide reasonable assurance regarding the reliability of financial reporting and the preparation of financial statements for external purposes in accordance with generally accepted accounting principles. A company’s internal control over financial reporting includes those policies and procedures that (1) pertain to the maintenance of records that, in reasonable detail, accurately and fairly reflect the transactions and dispositions of the assets of the company; (2) provide reasonable assurance that transactions are recorded as necessary to permit preparation of financial statements in accordance with generally accepted accounting principles, and that receipts and expenditures of the company are being made only in accordance with authorizations of management and directors of the company; and (3) provide reasonable assurance regarding prevention or timely detection of unauthorized acquisition, use, or disposition of the company’s assets that could have a material effect on the financial statements.
Because of its inherent limitations, internal control over financial reporting may not prevent or detect misstatements. Also, projections of any evaluation of effectiveness to future periods are subject to the risk that controls may become inadequate because of changes in conditions, or that the degree of compliance with the policies or procedures may deteriorate.
A material weakness is a deficiency, or combination of control deficiencies, in internal control over financial reporting, such that there is a reasonable possibility that a material misstatement of the company’s annual or interim financial statements will not be prevented or detected on a timely basis. The following material weaknesses have been identified and included in management’s assessment: Segregation of duties within the information technology environment at one facility; and the precision and sufficiency of reviews performed on reconciliations and calculations around inventory related items.
In our opinion, because of the effect of the material weaknesses described above on the achievement of the objectives of the control criteria, the Company has not maintained effective internal control over financial reporting as of September 30, 2014, based on criteria established in the 2013 Internal Control-Integrated Framework issued by COSO.
We also have audited, in accordance with the standards of the Public Company Accounting Oversight Board (United States), the consolidated financial statements of the Company as of and for the year ended September 30, 2014. The material weaknesses identified above were considered in determining the nature, timing, and extent of audit tests applied in our audit of the 2014 consolidated financial statements, and this report does not affect our report dated December 2, 2014, which expressed an unqualified opinion on those financial statements.
/s/ GRANT THORNTON LLP
Cleveland, Ohio
December 2, 2014
55
Item 9B. Other Information
None.
PART III
Item 10. Directors, Executive Officers and Corporate Governance
Information about the Executive Officers of the Company appears in Part I of this Report.
The Company incorporates herein by reference the information required by this Item as to the Directors, procedures for recommending Director nominees and the Audit Committee appearing under the captions “Proposal to Elect Eight (8) Directors”, “Section 16(a) Beneficial Ownership Reporting Compliance” and “Corporate Governance and Board of Director Matters” of the Company’s definitive Proxy Statement to be filed with the SEC on or about December 5, 2014.
The Directors of the Company are elected annually to serve for one-year terms or until their successors are elected and qualified.
The Company has adopted a Code of Ethics within the meaning of Item 406(b) of Regulation S-K under the Securities Exchange Act of 1934, as amended. The Code of Ethics is applicable to, among other people, the Company’s Chief Executive Officer, Chief Operating Officer, Chief Financial Officer, who is the Company’s Principal Financial Officer, and to the Corporate Controller, who is the Company’s Principal Accounting Officer. The Company’s Code of Ethics is available on its website: www.sifco.com
Item 11. Executive Compensation
The Company incorporates herein by reference the information appearing under the captions “Compensation Discussion and Analysis”, “Executive Compensation”, “Compensation Committee Report”, “Compensation Committee Interlocks and Insider Participation” and “Director Compensation” of the Company’s definitive Proxy Statement to be filed with the SEC on or about December 5, 2014.
Item 12. Security Ownership of Certain Beneficial Owners and Management and Related Stockholder Matters
The following table sets forth information regarding Common Shares to be issued under the Company’s equity compensation plans as of September 30, 2014.
Plan category | Number of securities to be issued upon Exercise of outstanding options, warrants and rights | Weighted- average exercise price of outstanding options, warrants and rights | Number of securities remaining available for future issuance under equity compensation plans | ||||
Equity compensation plans approved by security holders: | |||||||
2007 Long-term Incentive Plan (1) | 173,727 | N/A | 289,562 | ||||
(1) | Under the 2007 Long-term Incentive Plan, the aggregate number of common shares that are available to be granted is 600,000 shares, with a further limit of no more than 50,000 shares to any one person in any twelve-month period. For additional information concerning the Company’s equity compensation plans, refer to the discussion in Note 8 to the Consolidated Financial Statements. These securities are issued upon meeting performance objectives. |
The Company incorporates herein by reference the beneficial ownership information appearing under the captions “Stock Ownership of Certain Beneficial Owners” and “Stock Ownership of Executive Officers, Director and Nominees” of the Company’s definitive Proxy Statement to be filed with the SEC on or about December 5, 2014.
Item 13. Certain Relationships and Related Transactions, and Director Independence
The Company incorporates herein by reference the information required by this item appearing under the captions “Corporate Governance and Board of Director Matters” of the Company’s definitive Proxy Statement to be filed with the SEC on or about December 5, 2014.
56
Item 14. Principal Accounting Fees and Services
The Company incorporates herein by reference the information required by this item appearing under the caption “Principal Accounting Fees and Services” of the Company’s definitive Proxy Statement to be filed with the SEC on or about December 5, 2014.
Part IV
Item 15. Exhibits, Financial Statement Schedules
(a) (1) Financial Statements:
The following Consolidated Financial Statements; Notes to the Consolidated Financial Statements and the Report of Independent Registered Public Accounting Firm are included in Item 8.
Report of Independent Registered Public Accounting Firm
Consolidated Statements of Operations for the Years Ended September 30, 2014, 2013 and 2012
Consolidated Statements of Comprehensive Income for the Years Ended September 30, 2014, 2013 and 2012
Consolidated Balance Sheets—September 30, 2014 and 2013
Consolidated Statements of Cash Flows for the Years Ended September 30, 2014, 2013 and 2012
Consolidated Statements of Shareholders’ Equity for the Years Ended September 30, 2014, 2013 and 2012
Notes to Consolidated Financial Statements
(a) (2) Financial Statement Schedules:
The following financial statement schedule is included in Item 8:
Schedule II – Valuation and Qualifying Accounts
All other schedules for which provision is made in the applicable accounting regulations of the Securities and Exchange Commission are not required under the related regulations, are inapplicable, or the information has been included in the Notes to the Consolidated Financial Statements.
(a) (3) Exhibits:
The following exhibits are filed with this report or are incorporated herein by reference to a prior filing in accordance with Rule 12b-32 under the Securities and Exchange Act of 1934. (Asterisk denotes exhibits filed with this report)
Exhibit No. | Description | |
3.1 | Third Amended Articles of Incorporation of SIFCO Industries, Inc., filed as Exhibit 3(a) of the Company’s Form 10-Q dated March 31, 2002, and incorporated herein by reference | |
3.2 | SIFCO Industries, Inc. Amended and Restated Code of Regulations dated January 28, 2014, filed as Exhibit 3.2 of the Company’s Form 10-Q dated March 31, 2014, and incorporated herein by reference | |
4.1 | Credit and Security Agreement among Fifth Third Bank and SIFCO Industries, Inc. (and subsidiaries) dated December 10, 2010 filed as Exhibit 4.23 to the Company’s Form 8-K dated December 10, 2010 and incorporated herein by reference | |
4.2 | First Amendment and Joinder to Credit and Security Agreement among Fifth Third Bank and SIFCO Industries, Inc. (and subsidiaries) dated October 28, 2011 filed as Exhibit 4.2 to the Company’s Form 8-K dated October 28, 2011 and incorporated herein by reference | |
4.3 | Second Amendment and Joinder to Credit and Security Agreement among Fifth Third Bank and SIFCO Industries, Inc. (and subsidiaries) dated July 23, 2013, filed as Exhibit 4.3 to the Company's Form 8-K dated July 23, 2013 and incorporated herein by reference | |
57
Exhibit No. | Description | |
4.4 | Third Amendment and Joinder to Credit and Security Agreement among Fifth Third Bank and SIFCO Industries, Inc. (and subsidiaries) dated September 25, 2014, filed as Exhibit 99.1 to the Company's Form 8-K dated September 29, 2014 and incorporated herein by reference | |
9.1 | Voting Trust Agreement dated January 31, 2013, filed as Exhibit 9.1 to the Company’s Form 10-Q dated December 31, 2012 and incorporated herein by reference | |
10.1 | SIFCO Industries, Inc. 1995 Stock Option Plan, filed as Exhibit 10(d) of the Company’s Form 10-Q dated March 31, 2002, and incorporated herein by reference | |
10.2 | SIFCO Industries, Inc. 2007 Long-Term Incentive Plan, filed as Exhibit A of the Company’s Proxy and Notice of 2008 Annual Meeting to Shareholders dated December 14, 2007, and incorporated herein by reference | |
10.3 | Letter Agreement between the Company and Jeffrey P. Gotschall, dated August 12, 2009 filed as Exhibit 10.1 of the Company’s Form 8-K dated August 12, 2009 and incorporated herein by reference | |
10.4 | Amended and Restated Change in Control and Severance Agreement, between James P. Woidke and SIFCO Industries, Inc., dated April 27, 2010 filed as Exhibit 10.15 of the Company’s Form 8-K dated April 30, 2010, and incorporated herein by reference | |
10.5 | Asset Purchase Agreement between T&W Forge, Inc. and TWF Acquisition, LLC (a wholly-owned subsidiary of SIFCO Industries Inc.) dated December 10, 2010 filed as Exhibit 10.14 to the Company’s Form 8-K dated December 10, 2010, and incorporated herein by reference | |
10.6 | Amendment No. 1 to the SIFCO Industries, Inc. 2007 Long-Term Incentive Plan, filed as Exhibit A of the Company’s Proxy and Notice of 2011 Annual Meeting to Shareholders dated December 15, 2010, and incorporated herein by reference | |
10.7 | Asset Purchase Agreement between GEL Industries, Inc. (DBA Quality Aluminum Forge) and Forge Acquisition, LLC (a wholly-owned subsidiary of SIFCO Industries Inc.) dated October 28, 2011 filed as Exhibit 10.16 to the Company’s Form 8-K dated October 28, 2011, and incorporated herein by reference | |
10.8 | Separation Agreement between the Company and Frank Cappello, dated December 31, 2012, filed as Exhibit 10.1 to the Company's From 8-K dated January 3, 2013, and incorporated herein by reference | |
10.9 | Change in Control Agreement between the Company and Catherine M. Kramer, dated November 1, 2013, filed as Exhibit 10.1 to the Company's Form 8-K dated November 1, 2013, and incorporated herein by reference | |
14.1 | Code of Ethics, filed as Exhibit 14.1 of the Company’s Form 10-K dated September 30, 2003, and incorporated herein by reference | |
*21.1 | Subsidiaries of Company | |
*23.1 | Consent of Independent Registered Public Accounting Firm | |
*31.1 | Certification of Chief Executive Officer pursuant to Rule 13a-14(a) / 15d-14(a) | |
*31.2 | Certification of Chief Financial Officer pursuant to Rule 13a-14(a) / 15d-14(a) | |
*32.1 | Certification of Chief Executive Officer pursuant to 18 U.S.C. Section 1350 | |
*32.2 | Certification of Chief Financial Officer pursuant to 18 U.S.C. Section 1350 | |
*101 | The following financial information from SIFCO Industries, Inc. Report on Form 10-K for the year ended September 30, 2014 filed with the SEC on December 2, 2014, formatted in XBRL includes: (i) Consolidated Statements of Operations for the years ended September 30, 2014, 2013 and 2012, (ii) Consolidated Statements of Comprehensive Income for the years ended September 30, 2014, 2013 and 2012, (iii) Consolidated Balance Sheets at September 30, 2014 and 2013, (iv) Consolidated Statements of Cash Flow for the years ended September 30, 2014, 2013 and 2012, (vi) Consolidated Statements of Shareholders’ Equity for the years ended September 30, 2014, 2013 and 2012 and (v) the Notes to the Consolidated Financial Statements. | |
58
SIGNATURES
Pursuant to the requirements of Section 13 or 15(d) of the Securities Exchange Act of 1934, the Registrant has duly caused this report to be signed on its behalf by the undersigned, thereunto duly authorized.
SIFCO Industries, Inc. | ||
By: /s/ Catherine M. Kramer | ||
Catherine M. Kramer | ||
Vice President-Finance and | ||
Chief Financial Officer | ||
(Principal Financial Officer) | ||
Date: December 2, 2014 | ||
Pursuant to the requirements of the Securities Exchange Act of 1934, this report has been signed below on December 2, 2014 by the following persons on behalf of the Registrant in the capacities indicated.
/s/ Jeffrey P. Gotschall | /s/ Michael S. Lipscomb | ||
Jeffrey P. Gotschall | Michael S. Lipscomb | ||
Chairman of the Board | President and Chief Executive Officer | ||
(Principal Executive Officer) | |||
Director | |||
/s/ Alayne L. Reitman | /s/ John G. Chapman, Sr. | ||
Alayne L. Reitman | John G. Chapman, Sr. | ||
Director | Director | ||
/s/ Hudson D. Smith | /s/ Donald C. Molten, Jr. | ||
Hudson D. Smith | Donald C. Molten, Jr. | ||
Director | Director | ||
/s/ Norman E. Wells, Jr. | /s/ Mark J. Silk | ||
Norman E. Wells, Jr. | Mark J. Silk | ||
Director | Director | ||
/s/ Catherine M. Kramer | /s/ Thomas R. Kubera | ||
Catherine M. Kramer | Thomas R. Kubera | ||
Vice President-Finance | Corporate Controller | ||
and Chief Financial Officer | (Principal Accounting Officer) | ||
(Principal Financial Officer) | |||