Attached files
| file | filename |
|---|---|
| 8-K - 8-K - Cambridge Capital Acquisition Corp | d829273d8k.htm |
| EX-99.1 - EX-99.1 - Cambridge Capital Acquisition Corp | d829273dex991.htm |
| EX-10.4 - EX-10.4 - Cambridge Capital Acquisition Corp | d829273dex104.htm |
| EX-10.1 - EX-10.1 - Cambridge Capital Acquisition Corp | d829273dex101.htm |
| EX-10.2 - EX-10.2 - Cambridge Capital Acquisition Corp | d829273dex102.htm |
| EX-2.1 - EX-2.1 - Cambridge Capital Acquisition Corp | d829273dex21.htm |
| EX-10.3 - EX-10.3 - Cambridge Capital Acquisition Corp | d829273dex103.htm |
 Merger of
Cambridge Capital Acquisition Corporation
(NASDAQ: CAMB)
&
Parakou Tankers, Inc.
PARAKOU TANKERS, INC.
Investor Presentation
December 2014
Exhibit 99.2 |
 Parakou Tankers,
Inc. Preliminary Matters
Additional
Information
and
Where
to
Find
It.
The
proposed
mergers
described
in
this
presentation
(the
"Mergers”)
will
be
submitted
to
the
stockholders
of
Cambridge
Capital
Acquisition
Corporation
("Cambridge").
In
connection
with
the
proposed
Mergers,
Cambridge
and
Cambridge
Holdco,
Inc.
("Holdco"),
Cambridge’s
wholly
owned
subsidiary,
will
file
with
the
Security
and
Exchange
Commission
(the
"SEC")
a
registration
statement
on
Form
S-4
that
will
include
a
proxy statement/prospectus for the stockholders of Cambridge that will be mailed to the
stockholders of Cambridge. Cambridge urges investors, stockholders and other
interested
persons
to
read,
when
available,
the
proxy
statement/prospectus,
as
well
as
other
documents
filed
with
the
SEC,
because
these
documents
will
contain
important
information
and
a
more
complete
description
of
the
transaction
summarized
briefly
in
this
presentation.
Such
persons
can
also
read
Cambridge’s final prospectus, dated December 17, 2013, and Cambridge’s Annual Report
on Form 10-K for the fiscal year ended December 31, 2013, for a description
of
the
security
holdings
of
the
Cambridge
officers
and
directors
and
of
EarlyBirdCapital,
Inc.
("EBC")
and
their
respective
interests
as
security
holders
in
the successful consummation of the transactions described herein. Cambridge’s definitive
proxy statement/prospectus included in Holdco’s registration statement will be
mailed to stockholders of Cambridge as of a record date to be established for voting on the transactions described in this presentation.
Stockholders will also be able to obtain a copy of such documents, without charge, by
directing a request to: Cambridge Capital Acquisition Corporation, 525 South Flagler
Drive, Suite 201, West Palm Beach, Florida 33701. These documents, once available, and Cambridge’s IPO final prospectus and Annual Report on
Form 10-K can also be obtained, without charge, at the Securities and Exchange
Commission’s web site (http://www.sec.gov). Participants
in
Solicitation.
EBC,
the
managing
underwriter
of
Cambridge’s
initial
public
offering
consummated
in
December
2013,
is
acting
as
Cambridge’s
investment
banker
in
these
efforts,
for
which
it
will
receive
a
fee.
Additionally,
Cowen
and
Company,
LLC
(“Cowen”)
is
also
assisting
Cambridge
in
connection
with
the
proposed
Mergers,
for
which
it
will
receive
a
fee.
Cambridge
and
its
directors
and
executive
officers,
EBC
and
Cowen
may
be
deemed
to
be
participants
in
the
solicitation of proxies for the special meeting of Cambridge stockholders to be held to
approve the Mergers. Information regarding the persons who may, under the
rules
of
the
SEC,
be
deemed
participants
in
the
solicitation
of
the
stockholders
of
Cambridge
in
connection
with
the
proposed
Mergers
will
be
set
forth
in
the
proxy
statement/prospectus
when
it
is
filed
with
the
SEC
on
Form
S-4.
You
can
find
information
about
Cambridge’s
executive
officers
and
directors
in
its
Annual
Report on Form 10-K, which was filed with the SEC on March 28, 2014. You can obtain free
copies of these documents from Cambridge using the contact information above.
Non-Solicitation.
This
presentation
and
the
oral
statements
made
in
connection
with
this
presentation
are
not
proxy
statements
or
solicitations
of
a
proxy,
consent or authorization with respect to any securities or in respect of the proposed Mergers
and shall not constitute an offer to sell or a solicitation of an offer to buy
the
securities
of
Cambridge,
Holdco
or
Parakou
Tankers,
Inc.
("Parakou"),
nor
shall
there
be
any
sale
of
any
such
securities
in
any
state
or
jurisdiction
in
which
such offer, solicitation, or sale would be unlawful prior to registration or qualification
under the securities laws of such state or jurisdiction. No offer of securities shall
be made except by means of a prospectus meeting the requirements of Section 10 of the Securities Act of 1933, as amended.
2 |
 Parakou Tankers,
Inc. Preliminary Matters
Forward-Looking
Statements.
This
presentation,
and
oral
statements
made
in
connection
with
this
presentation,
include
"forward-looking
statements"
within
the
meaning of U.S. federal securities laws. Words such as "expect,"
"estimate," "project," "budget," "forecast,"
"anticipate," "intend," "plan," "may," "will," "could,"
"should," "believes," "predicts," "potential,"
"continue" and similar expressions are intended to identify such forward-looking statements. These forward-looking
statements involve significant risks and uncertainties that could cause the actual results to
differ materially from the expected results and, consequently, you should not rely on
these forward-looking statements as predictions of future events. These forward-looking statements and factors that may cause such differences
include, without limitation, Cambridge’s and Parakou’s expectations with respect to
future performance, growth and anticipated acquisitions; the anticipated financial
impact of the Mergers; ability to recognize the anticipated benefits of the Mergers; costs related to the proposed Mergers; the satisfaction of the closing
conditions to the Mergers; the timing of the completion of the Mergers; volatility in charter
rates and profitability; demand for shipping of refined petroleum products; global
economic conditions; changes in fuel prices; geopolitical events and regulatory changes; damages to vessels; acts of piracy, political instability,
terrorist or other attacks, war or international hostilities; loss of key personnel; delays in
deliveries of any newbuild product tankers; difficulty managing planned growth
properly;
seasonal
and
exchange
rate
fluctuations;
access
to
additional
financing;
changes
in
tax
laws;
weather
and
natural
disasters;
changing
interpretations of generally accepted accounting principles; inquiries and investigations and
related litigation; continued compliance with government regulations; and
other
risks
and
uncertainties
indicated
from
time
to
time
in
filings
with
the
SEC
by
Cambridge
or
Holdco.
The
foregoing
list
of
factors
is
not
exclusive. Additional
information
concerning
these
and
other
risk
factors
is
contained
in
Cambridge’s
most
recent
filings
with
the
SEC
and
will
be
contained
in
the
proxy
statement/prospectus to be filed by Holdco. All subsequent written and oral
forward-looking statements concerning Cambridge, Holdco and Parakou, the
transactions described herein or other matters and attributable to Cambridge, Holdco and
Parakou or any person acting on their behalf are expressly qualified in their entirety
by the cautionary statements above. Readers are cautioned not to place undue reliance upon any forward-looking statements, which speak only as of
the date made. Neither Cambridge, Holdco nor Parakou undertake or accept any obligation or
undertaking to release publicly any updates or revisions to any
forward-looking
statement
to
reflect
any
change
in
their
expectations
or
any
change
in
events,
conditions
or
circumstances
on
which
any
such
statement
is
based.
Market
&
Industry
Data.
The
market
and
industry
data
contained
in
this
presentation
are
based
on
the
parties
own
estimates,
internal
research,
surveys
and
studies conducted by third parties and industry and general publications and, in each case,
are believed by management to be reasonable estimates. This data is subject
to
change
and
cannot
always
be
verified
with
complete
certainty
due
to
limits
on
the
availability
and
reliability
of
raw
data,
the
voluntary
nature
of
the data
gathering process and other limitations and uncertainties inherent in any statistical survey
of market or industry data. 3 |
 Parakou Tankers,
Inc. 4
Transaction Overview
Acquirer
Cambridge Capital Acquisition Corporation (NASDAQ: CAMB)
Target
Parakou Tankers, Inc.
Amount Held in Trust
$81.3 million¹
Use of Proceeds
Vessel Acquisitions²
Closing Consideration to be Received by Target Shareholder
5.8 million shares of CAMB stock
Pro Forma Ownership¹
At Closing:
Assuming Earnout Targets are Achieved³:
CAMB Public Shareholders –
43.9%; CAMB Initial
Parakou Board
Transaction Approvals
CAMB Shareholder Approval; Charterer Consent
Parakou Place of Incorporation
Marshall Islands
4
Transaction Advisors
EarlyBird Capital/Cowen & Company
1.
Assumes that no public Cambridge stockholders exercise their conversion rights.
2.
Sources
and
uses
of
funds
for
the
acquisition
of
vessels
described
under
“Fleet
Acquisition
Strategy”
on
page
10
of
this
presentation
will
be
based
on
a
variety
of
sources
of
cash,
debt
and/or
equity.
3.
Earnout targets include EBITDA targets and share price targets over a three year period.
4.
Upon consummation of the transaction, Cambridge will be renamed to Parakou Tankers, Inc. and
incorporated in the Marshall Islands. CAMB Public Shareholders –
52.5%; CAMB Initial
Shareholders –
9.6%; Target Shareholder –
37.9%
Shareholders –
13.6%; Target Shareholder –
42.5%
7 members; Majority Independent Directors |
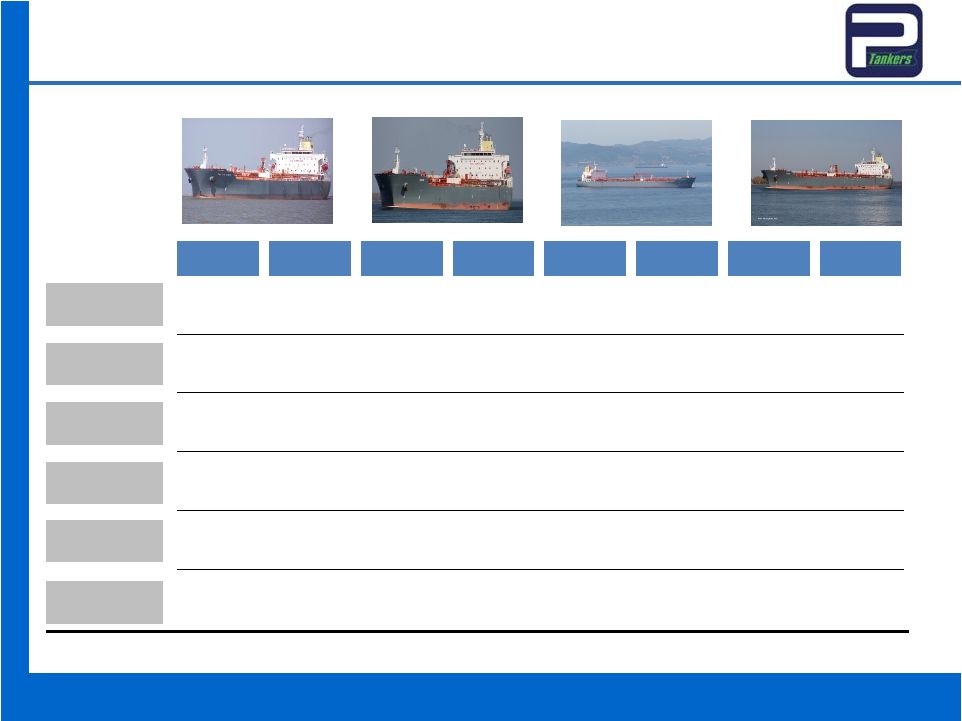
 Parakou Tankers,
Inc. Parakou
Owns
and
Operates
MR
Product
Tankers
5 |
 Parakou Tankers,
Inc. Company Overview
Market Backdrop
Investment Highlights
Historical Financial Statements
6 |
 Parakou Tankers,
Inc. 7
The Merger of Cambridge and Parakou Tankers:
Creating a Publicly Traded Industrial Shipping Company
•
Cambridge and Parakou Tankers intend to merge on a share for share basis
•
Parakou is a fully integrated, high growth, product tanker company that provides marine
transportation of petroleum and other liquid products globally
–
8 Medium Range product tankers in current fleet
–
Parakou has letters of intent or is actively negotiating agreements to acquire an additional
20 Medium Range product tankers by the fourth quarter of 2017, as described in this
presentation •
Balanced commercial strategy provides predictable revenue streams, access to improving spot
market fundamentals and the ability to optimize trading performance
•
High quality and cost efficient in-house technical management provides competitive
advantage •
Compelling industry dynamics:
–
Expected structural shifts in global refining capacity driving positive product tanker trade
developments and ton-mile expansion in 2014-2016
–
Global demand for product tankers forecast to grow 6.5% annually
versus MR tanker supply growth of 4.5%
•
Long-standing relationships provide meaningful access to rapidly expanding Asian
markets •
Closely aligned shareholder, management, and owner interest with
100% equity rollover by founder
•
Transparent and accessible Singapore and New York management team with proven track record
|
 Parakou Tankers,
Inc. Parakou
Tankers, Inc..
.
Parakou International
Ltd.
Parakou Tankers, Inc
•
PIL founded in 1985 in Hong Kong
•
Built over 170 vessels with total value of
approximately $4.5 billion
•
Focus on predictable long-term charters
Introduction: Background and Formation of Parakou Tankers, Inc.
Key Events & Operational History
Parakou International Ltd. (“PIL")
•
Building high growth industrial shipping company
•
8 MR tanker fleet, currently
•
100% technical and commercial management performed
in-house
•
Strategy of operating pool to diversify revenue streams
•
Attractive market dynamics
•
Plan to pursue acquisition of an additional 20 MR product
tankers (newbuilding resales, newbuilding bareboat
charters and purchase of existing vessels)
Parakou Tankers
Through newbuilding resales, secondhand resales, and bareboat dropdowns with
purchase options, Parakou is seeking to achieve significant fleet and earnings growth
8 |
 Parakou Tankers,
Inc. 9
Operating Fleet Overview
Current Charter Coverage Provides Stable Cash Flows
DWT
Year Built
Charterer
Charter
Expiration
Registry
Shipyard
Pretty World
Sextans
Cygnus
St. Petri
Pretty Scene
Pretty Jewelry
Orion
Hercules
51,000
51,000
51,000
51,000
51,000
51,000
51,000
51,000
2007
2007
2007
2007
2006
2006
2006
2006
STX
STX
STX
STX
STX
STX
STX
STX
Torm
OSG
OSG
Oetker
Morgan Stanley
Torm
OSG
OSG
Feb-16
Apr-16
Apr-16
Mar-17
Feb-15
Feb-16
Apr-16
Apr-16
Hong Kong
Hong Kong
Hong Kong
Hong Kong
Hong Kong
Hong Kong
Hong Kong
Hong Kong |
 Parakou
Tankers, Inc. 10
Fleet Acquisition Strategy
DWT
Year
Built
Shipyard
Eco
•
The
addition
of
modern
tonnage
to
Parakou's
fleet
would
increase
fuel
efficiency
and
trading
flexibility
while simultaneously decreasing capital expenditures and charterer dependency
•
Successful execution of our vessel acquisition strategy would expand our operating fleet to 28
MR product tankers by the fourth quarter of 2017
1.
Parakou has letters of intent or is actively negotiating agreements to acquire an additional
20 Medium Range product tankers by the fourth quarter of 2017. We cannot assure you
that Parakou will be successful in completing these negotiations or the acquisition of these vessels on the time frame anticipated or at all.
NB
#S5158
NB
#S5159
NB
#S5160
NB
#S5161
2013
Built TBD
2013
Built TBD
NB # 1
NB # 2
NB # 3
NB
NB # 5
NB
NB # 6
NB
NB # 7
NB
NB # 8
NB
NB # 9
NB
NB # 10
NB
NB # 11
NB
NB # 12
51,300
51,300
51,300
51,300
51,000
51,000
51,300
51,300
51,300
51,300
51,000
51,000
51,300
51,300
51,300
51,300
51,000
51,000
2015
2015
2016
2016
2013
2013
2016
2016
2016
2016
2017
2017
2017
2017
2017
2017
2017
2017
SPP
SPP
SPP
SPP
SPP
SPP
SPP
SPP
SPP
SPP
SPP
SPP
SPP
SPP
SPP
SPP
SPP
SPP
Yes
Yes
Yes
Yes
Yes
Yes
Yes
Yes
Yes
Yes
Yes
Yes
Yes
Yes
Yes
Yes
Yes
Yes
51,000
51,000
2007
2007
STX
STX
No
St.
Johannis ¹
St.
Marien ¹
No
Status
Under
Neg.
Under
Neg.
LOI
LOI
LOI
Under
Neg.
Under
Neg.
Under
Neg.
Under
Neg.
Under
Neg.
Under
Neg.
Under
Neg.
Under
Neg.
Under
Neg.
Under
Neg.
Under
Neg.
Under
Neg.
LOI
LOI
LOI
Bareboat
Bareboat
Bareboat
Bareboat
NB # 4
1 |
 Parakou
Tankers, Inc. Company Overview
Market Backdrop
Investment Highlights
Historical Financial Statements
11 |
 Parakou
Tankers, Inc. •
In 2014 oil demand growth is forecasted to expand 1,540 KB/d with global economic activity
increasing 3.6% •
Seaborne product trade flows are forecasted to expand to 79,30 KB/d, a 4.1% increase from
2013 levels •
Ton-mile demand expansion of 6.5% annually due to increasing seaborne trade flows and
voyages distances Now Is An Attractive Time to Enter the MR Market
Steady Oil Demand,
Product Tradeflow
and Ton-Mile
Demand Growth
Shifting Trade
Patterns Resulting in
Ton-mile Expansion
Moderate Fleet
Growth in MR Sector
Increasing Scrap
Incentives for Aging
Non-Eco Tonnage
•
The MR fleet (35k DWT-59.9k DWT) grew by 4.5% YoY in 2013
•
2014 MR fleet growth is projected at approximately 4.6%
•
The US continues to lead product trade pattern expansion with exports growing 95 KB/d to 495
KB/d, +24% growth in 2013 from 2012 levels
•
Australian refinery closures, Russian refinery upgrades, and Mideast export refinery
completions are expected to add further momentum to positive product tanker trade
developments and ton-mile expansion in 2015-2016
•
The product tanker orderbook is shrinking as a percentage of the
fleet with an increasing proportion of the
MR segment approaching the key 15+ year age profile
•
Ballast Water Treatment System and ECA fuel regulation implementations in 2016, are expected
to add significantly to dry docking and trading costs in environmentally sensitive
areas MR ton-mile demand growth of 6.5% annually is forecasted to outpace supply
growth of 4.5% in the medium term resulting in tightening MR utilization and positive
earnings development 12
Sources: PIRA Energy Group, Clarksons SIN, Fearnleys AS. |
 Parakou
Tankers, Inc. Robust Long Term Fundamentals
MR Charter Rates Continue to Increase Along with Ton-mile Demand
Key takeaways
MR Fleet Development
Seaborne Product Trade Flows (MMB/d)
Asset Values Near Cyclical Low
•
The US continues to lead product trade pattern
expansion with exports growing 95 KB/d to 495 KB/d,
+24% growth in 2013 from 2012 levels
•
Ton-mile demand forecast to expand 5-8% in 2014
with supply forecast to increase 4-5%
•
MR newbuilding resale values currently 68% of peak
2008 levels providing attractive entry point
Vessel deliveries projected to
remain well below peak 2004-2009 levels
13
Sources: PIRA Energy Group, Clarksons SIN, Fearnleys AS.
-4
-2
0
2
4
6
8
10
12
1970
1974
1978
1982
1986
1990
1994
1998
2002
2006
2010
2014
Deliveries
Removals
Est. Deliveries
Scrap Forecast
Net Change
44 Year Fleet Growth Avg
Nominal values
Inflation adjusted values
10 year avg -
nominal
10 year avg -
inflation adjusted
20
25
30
35
40
45
50
55
60
USDm
2002
2003
2004
2005
2006
2007
2008
2009
2010
2011
2012
2013
2014
MM Dwt |
 Parakou
Tankers, Inc. Company Overview
Market Backdrop
Investment Highlights
Historical Financial Statements
14 |
 Parakou
Tankers, Inc. A Differentiated Industrial Shipping Company
Key Investment Highlights
Strategy to Own and Operate
a Fleet of Modern Efficient
MR Product Tankers
Highly Experienced
Management Team With
Proven Track Record
7
High Quality, Cost Efficient
Operator
Fully Integrated Shipping
Platform Supports Customer
Requirements and Adds to
Shareholder Value
Capitalize On Positive
Industry Dynamics
2
Access to Strategically
Important, High Growth
Asia/Pacific Markets
4
15
5
1
3
Differentiated Trading
Strategy Achieves Higher
Returns
6 |
 16
Fully Integrated Shipping Platform Supports Customer
Requirements and Adds to Shareholder Value
1
Creates shareholder value: Adjustable commercial strategy capable of taking advantage of market
opportunities, no fees paid to third parties, and asset values acquired at the right
time in cycle Typical Blue Chip End User Base
Customers
16
Parakou Tankers, Inc.
•
•
•
•
•
•
•
Fleet
8 ships currently in operation
All high specification Korean built MR Product
Tankers
Assets acquired at right time in cycle
Commercial
Provides management team flexibility to adjust
commercial strategy based on client requirements,
new opportunities and shifts in the market
Technical
All technical management is performed in-house
PSM has shown clear competitive advantage in
providing cost efficient technical management
services
Finance
Provides financial security for customers
Multi-cycle relationships with commercial
lenders
Moderate leverage leads to stability
•
• |
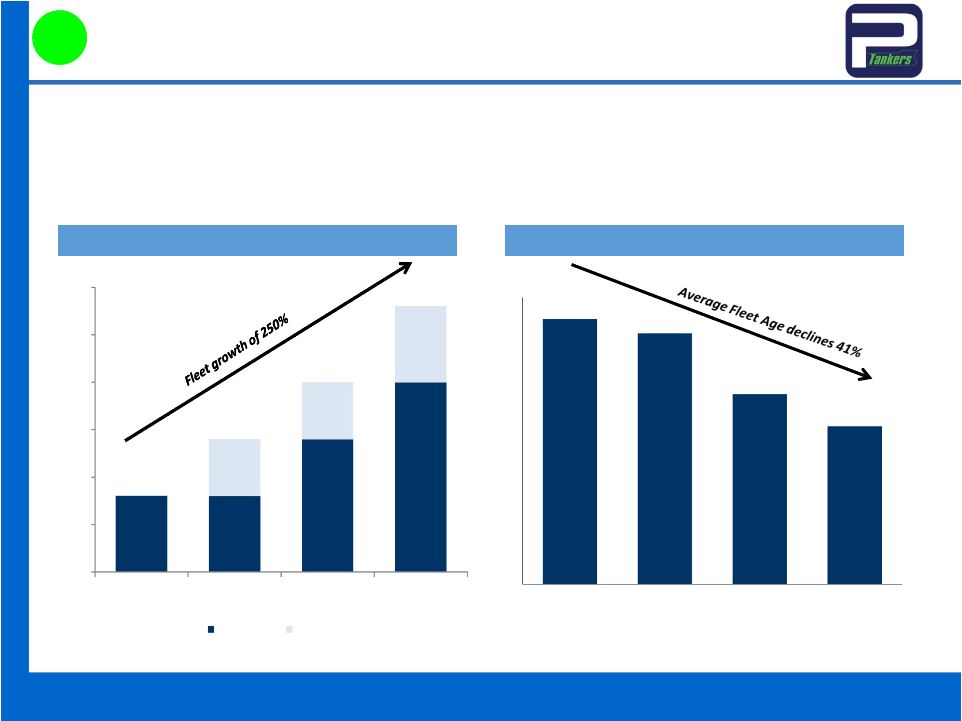 Strategy to Own and
Operate a Fleet of Modern Efficient MR Product Tankers
17
2
Parakou Tankers Fleet
Average Fleet Age
•
Disciplined and strategic acquisition strategy leads to scale and operational
efficiencies –
Successful execution of our vessel acquisition strategy would result in 28 MR product tankers
by the fourth quarter of 2017 –
Addition of modern tonnage to fleet would increase fuel efficiency and trading flexibility
while simultaneously decreasing average age and capital expenditures
–
Financial structure and infrastructure provide platform for stable growth
1.
Parakou has letters of intent or is actively negotiating agreements to acquire an additional
20 Medium Range product tankers by the fourth quarter of 2017. We cannot assure you
that Parakou will be successful in completing these negotiations or the acquisition of these vessels on the time frame anticipated or at all.
7.4
7.0
5.3
4.4
0
1
2
3
4
5
6
7
8
2014
2015
2016
2017
Parakou Tankers, Inc.
8
8
14
20
6
6
8
8
14
20
28
0
5
10
15
20
25
30
2014
2015
2016
2017
Additions
Existing Fleet
1 |
 Parakou
Tankers, Inc. 18
•
Expanding US exports, Russian refinery upgrades, Mideast export refinery completions,
Japanese/Australian refinery shutdowns, and European refinery closures provide a robust
backdrop for expected increasing product tanker demand
•
According
to
leading
industry
analysts,
MR
Earnings
are
forecast
to
increase
to
$17,900/day
and
$18,300/day in 2015 and 2016, respectively
3
MR Spot Market Earnings and Analyst Earnings Forecast ($/day)
5,000
10,000
15,000
20,000
25,000
30,000
2004
2005
2006
2007
2008
2009
2010
2011
2012
2013
Proj. 2014
Proj. 2015
Proj. 2016
Capitalize On Positive Industry Dynamics
Spot Market MR Rates and Term Charter Rates Continue to Rise
Note: Actual Earnings based on Clarkons’ SIN; 2014-2016 consists of average of
Clarksons YTD Earnings and Analyst Projections (ICAP, Stifel, RS Platou, Pareto, Clarksons, Jefferies, and DNB
2015 and 2016 Earnings are weighted average of analyst projections. |
 Parakou
Tankers, Inc. •
Parakou has strong ties to Asian charterers, owners,
shipyards and financial institutions
•
This is represented by relationships with:
–
Respected customer at 15+ top tier Asia/Pacific
shipyards in South Korea, China and Japan
forged through 170+ newbuilding projects by
legacy companies (provides opportunities as
newbuild slots become available)
–
Relationships with Asia/Pacific financial
institutions provide potential attractive
alternative long-term financing
–
Chinese state owned oil companies provides
increased cargo potential
–
China and South Asia GDP forecasted to grow
at 7.3% and 5.2% in 2014, respectively
–
Relationships at shipyards and with customers
in areas
19
Access to Strategically Important, High Growth Asia/Pacific Markets
Parakou Tankers, Inc. Asia Presence
Established Asian Market Presence
4
Enhances Earnings and Financing Opportunities |
 High Quality, Cost
Efficient Operator Lower Cost Structure Relative to Peer Group
2013 Reported MR Peer Group OPEX ($/day)
•
Parakou Ship Management has shown a competitive advantage in providing technical management
leading to dramatically lower cost. Services include:
–
OPEX
of
$5,700/day
for
existing
tankers
and
estimated
$5,000/day
for
newbuildings
results
in
14%
cost
advantage
relative to peer group
•
Lower crewing costs by negotiation of more favorable contracts
•
In house management of drydock expenses leads to favorable pricing with shipyards
•
More efficient use of shore-side employees is reflected in lower repair and
maintenance –
Economies of scale lead to benefits remaining within the company
–
Total transparency –
No fees paid to management or third party technical providers
20
Source: Company filings.
1. Includes both MR and Chemical Tanker operating expense per day.
5
$4,000
$4,500
$5,000
$5,500
$6,000
$6,500
$7,000
$7,500
$8,000
Torm
Ardmore
Scorpio
Parakou
$7,155
$6,531
$6,069
$5,687
1
Parakou Tankers, Inc. |
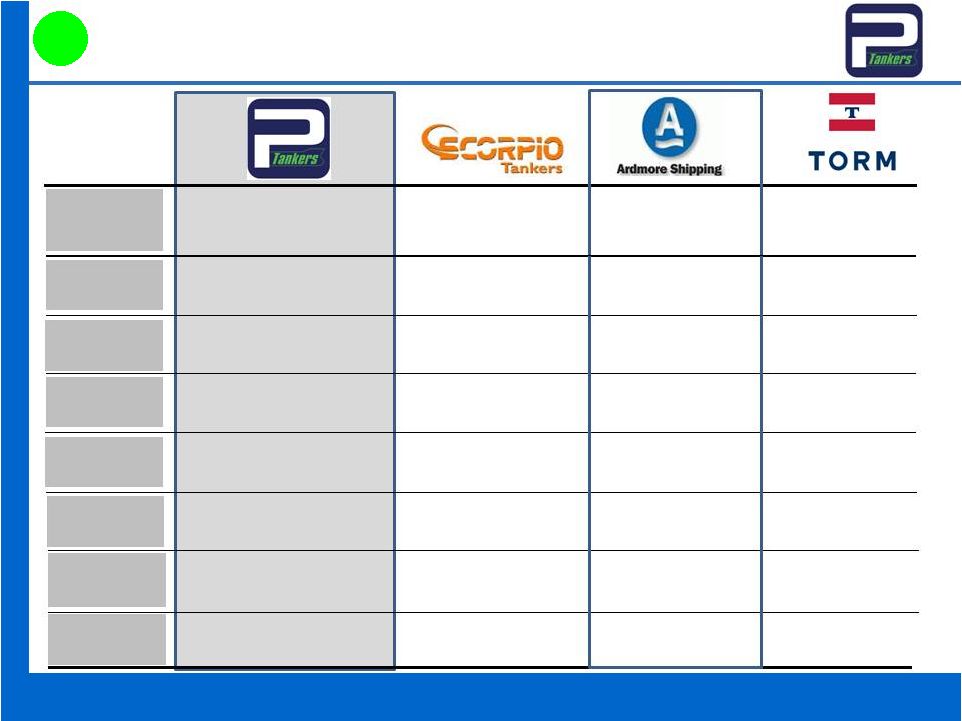 Parakou
Tankers, Inc. # of Ships on Order
Commercial
Strategy
Fleet Composition
Operating
Expense/day
1
Corporate
Overhead per
Ship/day
Technical
Management
13 MR Product Tankers
5 Handysize Product Tankers
8 LR2 Product Tankers
20 MR Product
Tankers
4 MR Product Tankers
6 Chemical Tankers
North Atlantic Basin
Global IMO II/III
Time Chartered
Related Third Party
In House
Independent Third Party
64% MR Product Tankers
36% Other Product Tankers
100% MR Product Tankers
79% MR Product Tankers
21% Chemical Tankers
$ 6,100/day
$ 5,700/day
$ 6,500/day
2
High Quality, Cost Efficient Operator
Parakou Compares Favorably to our Competitors
5
Current Fleet
8 MR Product Tankers
11 MR Product Tankers
3 Chemical Tankers
10 Handysize Product Tankers
32 MR Product Tankers
$ 1,820/day
$ 1,040/day
$ 2,450/day
Commercial
Management
Related Third Party
In House
Tonnage Provider
N/A
Mixed Strategy
In House
N/A
$ 7,200/day
11 Handysize Tankers
44 MR Product Tankers
7 LR1 Product Tankers
10 LR2 Product Tankers
N/A
In House
Source: Company Filings
21
6
LR2 Product Tankers
2
LR1 Product Tankers
2.
Includes both MR and Chemical Tanker operating expense per day.
1.
2013 reported operating expense / day. |
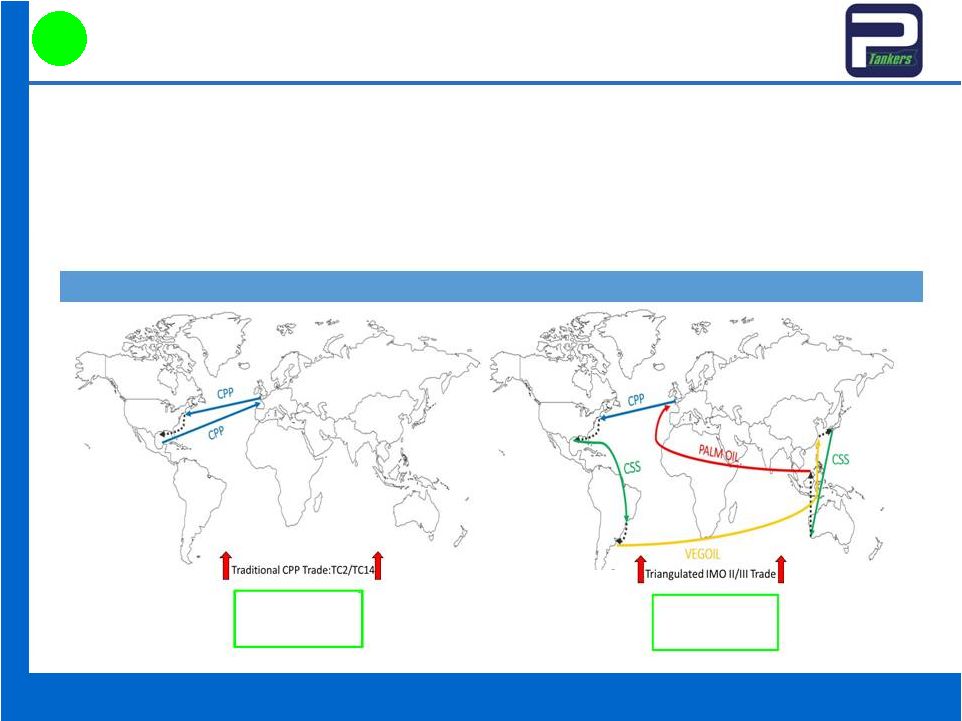 Parakou
Tankers, Inc. •
Strategic access to Asian Markets (with Singapore as trading hub) enhances ability to enter
Easy Chemicals, Palm oil, Veg-oil, and Biofuel trades (IMO II/III trades)
•
Tankers designed to carry a range of liquid cargoes to achieve greater operational efficiency
and earnings –
We
believe
a
premium
up
to
$1,000
–
$2,000/day
achieved
through
improved
utilization,
lower
port
time/charges, decreased ballast time, easier rerouting for repair/special survey/drydock
maintenance, and the flexibility to switch back into clean petroleum product
(“CPP”) trades to capitalize on earnings spikes Differentiated Trading Strategy
Achieves Higher Returns Trading Strategy Leads to Significant Premiums Over Peers
Source: Internal Parakou estimates, Fearnleys AS
6
Earnings Premium of Triangulated Trade Patterns
Total Voyage:
24 Days Laden
7 Days Ballast
(Clean Petroleum
Products)
(Caustic Soda)
(Caustic Soda)
Total Voyage:
140 Days Laden
21 Days Ballast
90%
Efficiency
80%
Efficiency
22 |
 Parakou
Tankers, Inc. Mr. Por Liu
Chairman & CEO
23
Highly Experienced Management Team With
Proven Track Record
Mr. Gregory
McGrath
CFO
Mr. Peter S. Bell
CCO
Mr. Yang Jian Gou
COO, President PSM,
& Director
•
Mr.
Gregory
McGrath,
has
30+
years
of
industry
experience
with
a
major
oil
company
and
both
public
and private shipping companies
•
Most recently was Chief Financial Officer of a publicly held shipping company
•
Formerly Vice President of Finance and Administration of American Eagle Tankers, Inc., a
foreign flag tanker owner
•
Began his career with ExxonMobil, working for 16 years in various financial, shipping and
supply functions
•
Mr.
Por
Liu,
Chairman
and
CEO
of
Parakou
Tankers,
also
serves
as
Managing
Director
of
PSM,
our
in-
house technical management company based in Singapore
•
Mr. Liu has worked for Parakou and affiliated companies in different roles and capacities for
his entire career
•
For the past seven years Mr. Liu has been instrumental in building and managing PSM’s
ship management company’s activities
•
Mr. Peter S. Bell brings 30+ years of experience in international tanker chartering, business
development, sale and purchase, new construction contracting, and M&A
•
Experienced in development and implementation of corporate strategic plans and has held
senior management roles in three of the industry’s largest publically listed
shipping firms •
Extensive relationships with cargo interests, shipyards and the finance community and was
most recently responsible for the commercial development of a fleet of twenty-two
tankers •
Mr. Yang Jian Guo, has served as President of PSM since 2006
•
Mr. Yang has spent 40+ years in various capacities in the shipping industry
•
Prior
to
joining
PSM,
Mr.
Yang
served
as
President
of
Sinotrans
Holdings
HK,
overseeing
the
business
activities of
a dozen shipping related businesses including tanker, container line, bulk cargo, and
logistics units •
Prior to this role, Mr. Yang served as Vice President of Sinotrans
•
Additionally, Mr. Yang served as the Vice Chairman of China Shipowners Association and a
member of the arbitration committee of CCPIT
7
23 |
 Parakou
Tankers, Inc. 24
Investing in an Industrial Shipping Company With Strong
Potential for Growth
Fully Integrated Shipping Platform Supports Customer Requirements and
Adds to Shareholder Value
1
Strategy to Own and Operate a Fleet of Modern Efficient MR Product Tankers
2
Capitalize On Positive Industry Dynamics
3
Access to Strategically Important, High Growth Asia/Pacific Markets
4
High Quality, Cost Efficient Operator
5
Highly Experienced Management Team With Proven Track Record
7
Differentiated Trading Strategy Achieves Higher Returns
6 |
 Parakou
Tankers, Inc. Company Overview
Market Backdrop
Investment Highlights
Historical Financial Statements
25 |
 Parakou
Tankers, Inc. 26
Key Financial Highlights
Selected Income Statement Highlights: ($ in Millions)
Fiscal Year Ended
6 Months Ended
Income Statement
December 31, 2012
December 31, 2013
June 30, 2013
June 30, 2014
Revenue
$57.0
$48.9
$23.5
$23.5
Operating Expenses
Vessel Operating Expense
($31.8)
($25.7)
($12.6)
($11.4)
Depreciation
(11.6)
(11.5)
(5.8)
(5.8)
G&A
(3.0)
(2.9)
(1.4)
(1.7)
All Other
(1.2)
(6.5)
(0.9)
(1.1)
Operating Profit
$9.4
$2.2
$2.9
$3.5
Net Interest Expense
(10.8)
(9.3)
(4.8)
(4.1)
Unrealized Gain on Derivative
3.6
8.4
4.8
1.8
Comp. from Charter Termination
–
14.5
–
–
Other Income
0.1
0.9
0.6
0.2
Net Income
$2.3
$16.7
$3.4
$1.4 |
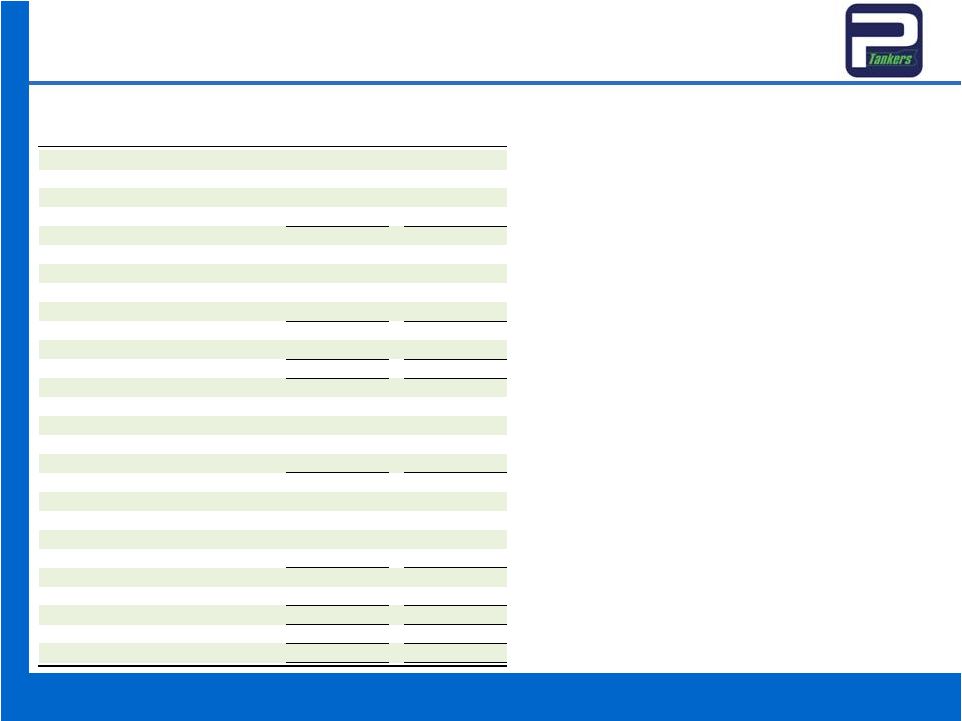 Parakou
Tankers, Inc. 27
Key Financial Highlights
Selected Financial Highlights: ($ in Millions)
As of
As of
Balance Sheet Data
December 31, 2013
June 30, 2014
Current Assets
Cash and Cash Equivalents
$11.8
$10.2
Receivables
7.2
4.3
Other
2.3
3.5
Total Current Assets
$21.3
$18.1
Non-current Assets
Vessels
$222.5
$217.4
Other
0.2
0.3
Total Non-current Assets
$222.7
$217.7
Total Assets
$244.0
$235.8
Current Liabilities
Payables
$9.1
$9.6
Bank Loans
19.8
20.1
Other
2.4
3.7
Total Current Liabilities
$31.3
$33.4
Non-current Liabilities
Derivative Financial Instruments
$13.0
$11.4
Bank Loans
96.9
86.8
Total Non-current Liabilities
$109.9
$98.2
Total Shareholder's Equity
$102.8
$104.2
Total Liabilities and Equity
$244.0
$235.8 |
 Parakou
Tankers, Inc. 28
Key Operating Highlights
Note: Analyst Estimates based on weighted average of analyst projections (ICAP, Stifel,
RS Platou, Pareto, Clarksons, Jefferies, and DNB);. TCE and OPEX Assumptions:
Full Year 2012
Full Year 2013
Analyst Estimate 2014
Analyst Estimate 2015
Analyst Estimate 2016
TCE – $/Day
$15,551
$12,962
$15,108
$17,943
$18,300
Vessel Opex – $/Day
$5,781
$5,733
$6,500
$6,500
$6,500
Current Debt Profile (Existing Fleet, $ in millions):
Loan Amount
$136.0
Margin
Libor + 275
Quarterly Amortization
$0.4
per vessel |