Attached files
| file | filename |
|---|---|
| 8-K - 8-K - Silver Bay Realty Trust Corp. | sby8kq32014investorpresent.htm |
SILVER BAY REALTY TRUST CORP. T h i r d Q u a r t e r 2 0 1 4 I n v e s t o r P r e s e n t a t i o n
2 S A F E H A R B O R S T A T E M E N T F O R W A R D - L O O K I N G S T A T E M E N T S This presentation includes “forward-looking statements” within the meaning of the safe harbor provisions of the United States Private Securities Litigation Reform Act of 1995. Actual results may differ from expectations, estimates and projections and, consequently, readers should not rely on these forward-looking statements as predictions of future events. Words such as “expect,” “target,” “assume,” “estimate,” “project,” “budget,” “forecast,” “anticipate,” “intend,” “plan,” “may,” “will,” “could,” “should,” “believe,” “predicts,” “potential,” “continue,” and similar expressions are intended to identify such forward-looking statements. These forward-looking statements involve significant risks and uncertainties that could cause actual results to differ materially from expected results. Factors that could cause actual results to differ include: adverse economic or real estate developments in Silver Bay’s markets; defaults on, early terminations of or non-renewal of leases by residents; difficulties in identifying properties to acquire and completing acquisitions; increased time and/or expense to gain possession and renovate properties; increased vacancy, resident turnover, or turnover costs; Silver Bay’s ability to control or reduce operating expenses, including repairs and maintenance expense and other costs such as real estate taxes, homeowners’ association fees, insurance and other costs outside the Company’s control; Silver Bay’s failure to successfully operate its properties; Silver Bay’s ability to obtain financing arrangements; Silver Bay’s failure to meet the conditions to draw under the credit facility; failure to successfully manage integration of the Manager into the Company; the Company’s ability to hire and retain skilled managerial, investment, financial and operational personnel; the Company’s ability to perform under the covenants of its revolving credit facility and securitization loan; general volatility of the markets in which it participates; interest rates and the market value of Silver Bay’s assets; the impact of changes in governmental regulations, tax law and rates, and similar matters. Readers are cautioned not to place undue reliance upon any forward-looking statements, which speak only as of the date made. Silver Bay does not undertake or accept any obligation to release publicly any updates or revisions to any forward-looking statement to reflect any change in its expectations or any change in events, conditions or circumstances on which any such statement is based. Additional information concerning these and other risk factors is contained in Silver Bay’s most recent filings with the Securities and Exchange Commission. All subsequent written and oral forward looking statements concerning Silver Bay or matters attributable to Silver Bay or any person acting on its behalf are expressly qualified in their entirety by the cautionary statements above.
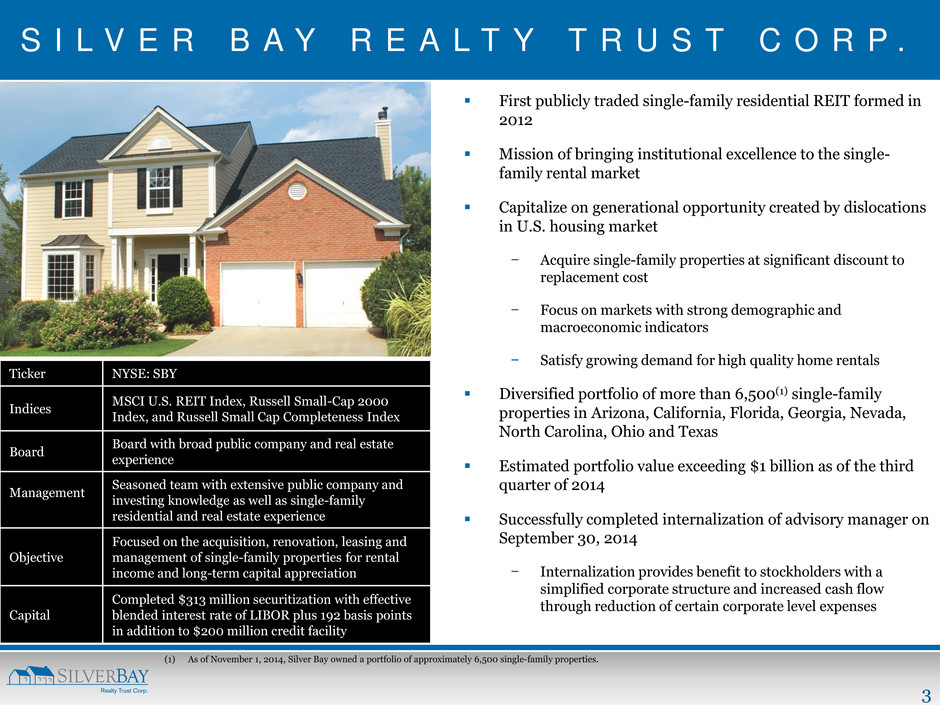
3 S I L V E R B A Y R E A L T Y T R U S T C O R P . First publicly traded single-family residential REIT formed in 2012 Mission of bringing institutional excellence to the single- family rental market Capitalize on generational opportunity created by dislocations in U.S. housing market − Acquire single-family properties at significant discount to replacement cost − Focus on markets with strong demographic and macroeconomic indicators − Satisfy growing demand for high quality home rentals Diversified portfolio of more than 6,500(1) single-family properties in Arizona, California, Florida, Georgia, Nevada, North Carolina, Ohio and Texas Estimated portfolio value exceeding $1 billion as of the third quarter of 2014 Successfully completed internalization of advisory manager on September 30, 2014 − Internalization provides benefit to stockholders with a simplified corporate structure and increased cash flow through reduction of certain corporate level expenses (1) As of November 1, 2014, Silver Bay owned a portfolio of approximately 6,500 single-family properties. Ticker NYSE: SBY Indices MSCI U.S. REIT Index, Russell Small-Cap 2000 Index, and Russell Small Cap Completeness Index Board Board with broad public company and real estate experience Management Seasoned team with extensive public company and investing knowledge as well as single-family residential and real estate experience Objective Focused on the acquisition, renovation, leasing and management of single-family properties for rental income and long-term capital appreciation Capital Completed $313 million securitization with effective blended interest rate of LIBOR plus 192 basis points in addition to $200 million credit facility
4 S I N G L E - F A M I L Y R E N T A L I N V E S T M E N T O P P O R T U N I T Y
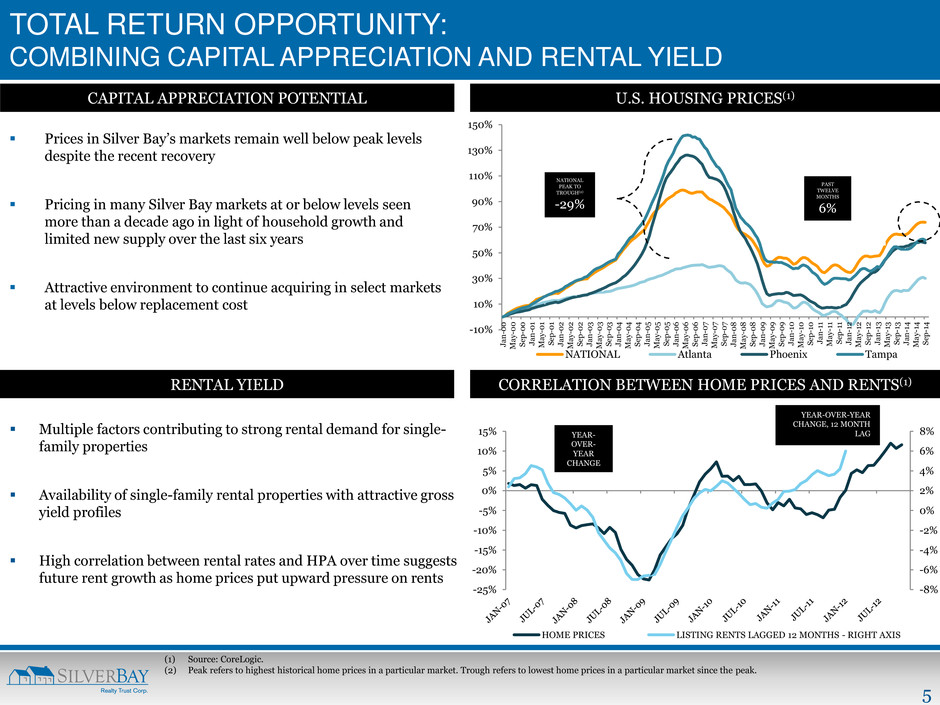
5 -8% -6% -4% -2% 0% 2% 4% 6% 8% -25% -20% -15% -10% -5% 0% 5% 10% 15% HOME PRICES LISTING RENTS LAGGED 12 MONTHS - RIGHT AXIS -10% 10% 30% 50% 70% 90% 110% 130% 150% Ja n -0 0 M a y- 0 0 S ep -0 0 Ja n -0 1 M a y- 0 1 S ep -0 1 Ja n -0 2 M a y- 0 2 S ep -0 2 Ja n -0 3 M a y- 0 3 S ep -0 3 Ja n -0 4 M a y- 0 4 S ep -0 4 Ja n -0 5 M a y- 0 5 S ep -0 5 Ja n -0 6 M a y- 0 6 S ep -0 6 Ja n -0 7 M a y- 0 7 S ep -0 7 Ja n -0 8 M a y- 0 8 S ep -0 8 Ja n -0 9 M a y- 0 9 S ep -0 9 Ja n -1 0 M a y- 10 S ep -1 0 Ja n -1 1 M a y- 11 S ep -1 1 Ja n -1 2 M a y- 12 S ep -1 2 Ja n -1 3 M a y- 13 S ep -1 3 Ja n -1 4 M a y- 14 S ep -1 4 NATIONAL Atlanta Phoenix Tampa TOTAL RETURN OPPORTUNITY: COMBINING CAPITAL APPRECIATION AND RENTAL YIELD Prices in Silver Bay’s markets remain well below peak levels despite the recent recovery Pricing in many Silver Bay markets at or below levels seen more than a decade ago in light of household growth and limited new supply over the last six years Attractive environment to continue acquiring in select markets at levels below replacement cost CAPITAL APPRECIATION POTENTIAL NATIONAL PEAK TO TROUGH(2) -29% PAST TWELVE MONTHS 6% (1) Source: CoreLogic. (2) Peak refers to highest historical home prices in a particular market. Trough refers to lowest home prices in a particular market since the peak. U.S. HOUSING PRICES(1) YEAR- OVER- YEAR CHANGE YEAR-OVER-YEAR CHANGE, 12 MONTH LAG CORRELATION BETWEEN HOME PRICES AND RENTS(1) Multiple factors contributing to strong rental demand for single- family properties Availability of single-family rental properties with attractive gross yield profiles High correlation between rental rates and HPA over time suggests future rent growth as home prices put upward pressure on rents RENTAL YIELD
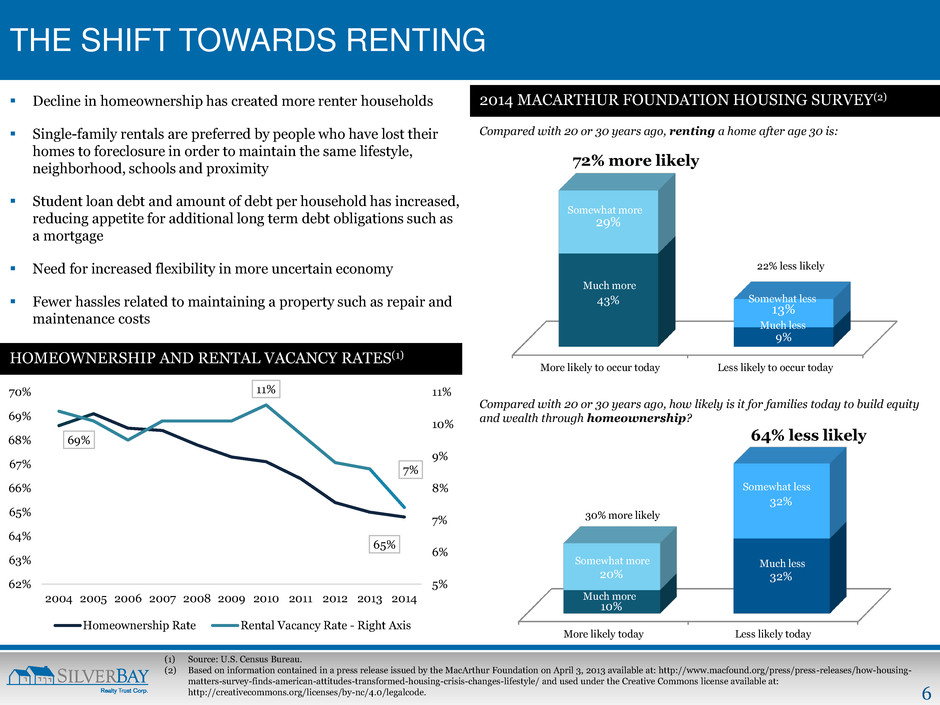
6 More likely today Less likely today 10% 32% 20% 32% More likely to occur today Less likely to occur today 43% 9% 29% 13% THE SHIFT TOWARDS RENTING 2014 MACARTHUR FOUNDATION HOUSING SURVEY(2) Compared with 20 or 30 years ago, renting a home after age 30 is: Compared with 20 or 30 years ago, how likely is it for families today to build equity and wealth through homeownership? Decline in homeownership has created more renter households Single-family rentals are preferred by people who have lost their homes to foreclosure in order to maintain the same lifestyle, neighborhood, schools and proximity Student loan debt and amount of debt per household has increased, reducing appetite for additional long term debt obligations such as a mortgage Need for increased flexibility in more uncertain economy Fewer hassles related to maintaining a property such as repair and maintenance costs HOMEOWNERSHIP AND RENTAL VACANCY RATES(1) (1) Source: U.S. Census Bureau. (2) Based on information contained in a press release issued by the MacArthur Foundation on April 3, 2013 available at: http://www.macfound.org/press/press-releases/how-housing- matters-survey-finds-american-attitudes-transformed-housing-crisis-changes-lifestyle/ and used under the Creative Commons license available at: http://creativecommons.org/licenses/by-nc/4.0/legalcode. Somewhat more Much more Much less Somewhat less Much more Much less 72% more likely 22% less likely 30% more likely 64% less likely 69% 65% 11% 7% 5% 6% 7% 8% 9% 10% 11% 62% 63% 64% 65% 66% 67% 68% 69% 70% 2004 2005 2006 2007 2008 2009 2010 2011 2012 2013 2014 Homeownership Rate Rental Vacancy Rate - Right Axis Somewhat more Somewhat less
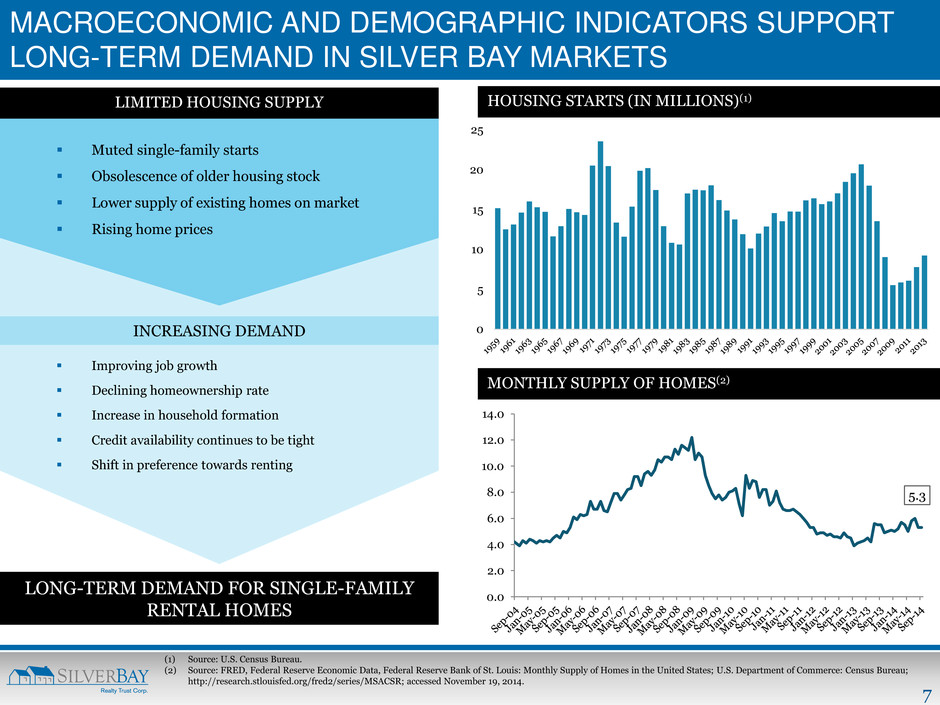
7 0 5 10 15 20 25 MACROECONOMIC AND DEMOGRAPHIC INDICATORS SUPPORT LONG-TERM DEMAND IN SILVER BAY MARKETS Muted single-family starts Obsolescence of older housing stock Lower supply of existing homes on market Rising home prices Improving job growth Declining homeownership rate Increase in household formation Credit availability continues to be tight Shift in preference towards renting LONG-TERM DEMAND FOR SINGLE-FAMILY RENTAL HOMES HOUSING STARTS (IN MILLIONS)(1) MONTHLY SUPPLY OF HOMES(2) (1) Source: U.S. Census Bureau. (2) Source: FRED, Federal Reserve Economic Data, Federal Reserve Bank of St. Louis: Monthly Supply of Homes in the United States; U.S. Department of Commerce: Census Bureau; http://research.stlouisfed.org/fred2/series/MSACSR; accessed November 19, 2014. LIMITED HOUSING SUPPLY INCREASING DEMAND 5.3 0.0 2.0 4.0 6.0 8.0 10.0 12.0 14.0
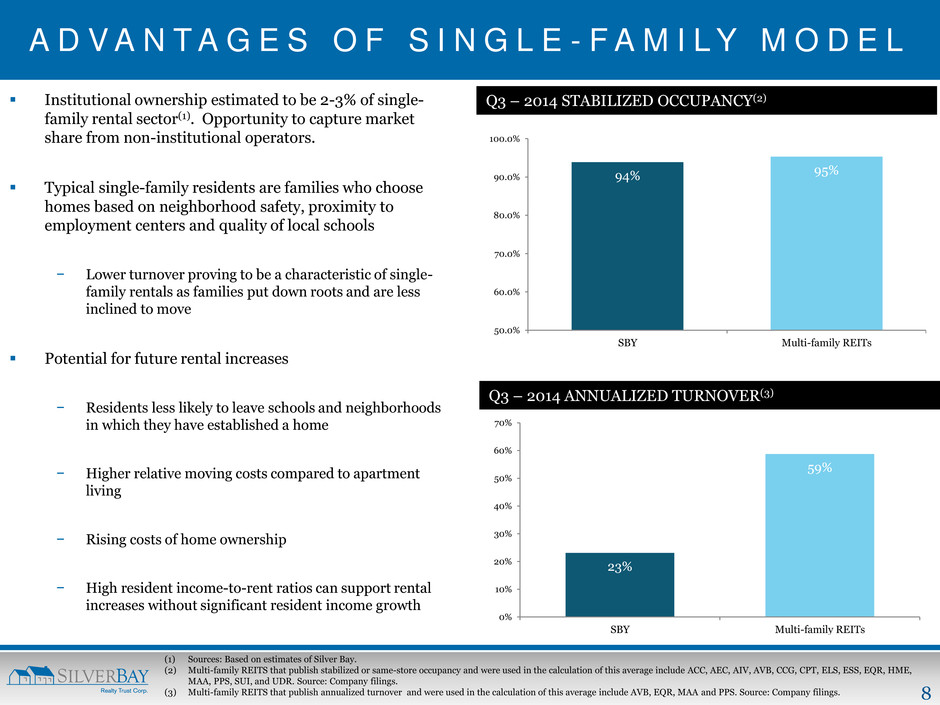
8 A D V A N T A G E S O F S I N G L E - F A M I L Y M O D E L Institutional ownership estimated to be 2-3% of single- family rental sector(1). Opportunity to capture market share from non-institutional operators. Typical single-family residents are families who choose homes based on neighborhood safety, proximity to employment centers and quality of local schools − Lower turnover proving to be a characteristic of single- family rentals as families put down roots and are less inclined to move Potential for future rental increases − Residents less likely to leave schools and neighborhoods in which they have established a home − Higher relative moving costs compared to apartment living − Rising costs of home ownership − High resident income-to-rent ratios can support rental increases without significant resident income growth Q3 – 2014 ANNUALIZED TURNOVER(3) 23% 59% 0% 10% 20% 30% 40% 50% 60% 70% SBY Multi-family REITs Q3 – 2014 STABILIZED OCCUPANCY(2) 94% 95% 50.0% 60.0% 70.0% 80.0% 90.0% 100.0% SBY Multi-family REITs (1) Sources: Based on estimates of Silver Bay. (2) Multi-family REITS that publish stabilized or same-store occupancy and were used in the calculation of this average include ACC, AEC, AIV, AVB, CCG, CPT, ELS, ESS, EQR, HME, MAA, PPS, SUI, and UDR. Source: Company filings. (3) Multi-family REITS that publish annualized turnover and were used in the calculation of this average include AVB, EQR, MAA and PPS. Source: Company filings.
9 WHY SILVER BAY?
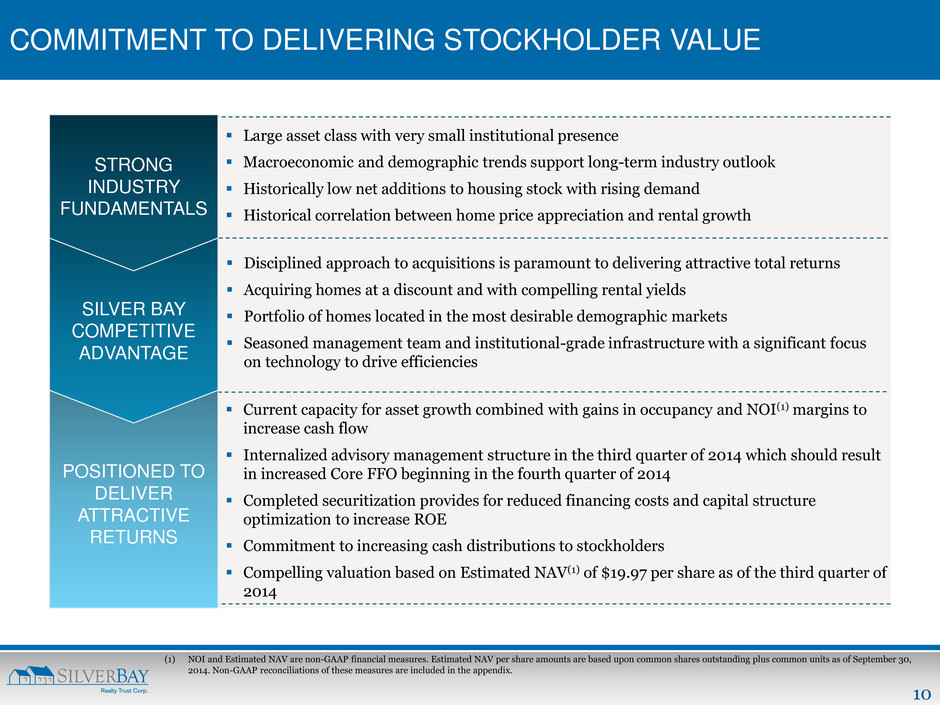
10 COMMITMENT TO DELIVERING STOCKHOLDER VALUE (1) NOI and Estimated NAV are non-GAAP financial measures. Estimated NAV per share amounts are based upon common shares outstanding plus common units as of September 30, 2014. Non-GAAP reconciliations of these measures are included in the appendix. Disciplined approach to acquisitions is paramount to delivering attractive total returns Acquiring homes at a discount and with compelling rental yields Portfolio of homes located in the most desirable demographic markets Seasoned management team and institutional-grade infrastructure with a significant focus on technology to drive efficiencies STRONG INDUSTRY FUNDAMENTALS POSITIONED TO DELIVER ATTRACTIVE RETURNS Large asset class with very small institutional presence Macroeconomic and demographic trends support long-term industry outlook Historically low net additions to housing stock with rising demand Historical correlation between home price appreciation and rental growth Current capacity for asset growth combined with gains in occupancy and NOI(1) margins to increase cash flow Internalized advisory management structure in the third quarter of 2014 which should result in increased Core FFO beginning in the fourth quarter of 2014 Completed securitization provides for reduced financing costs and capital structure optimization to increase ROE Commitment to increasing cash distributions to stockholders Compelling valuation based on Estimated NAV(1) of $19.97 per share as of the third quarter of 2014 SILVER BAY COMPETITIVE ADVANTAGE
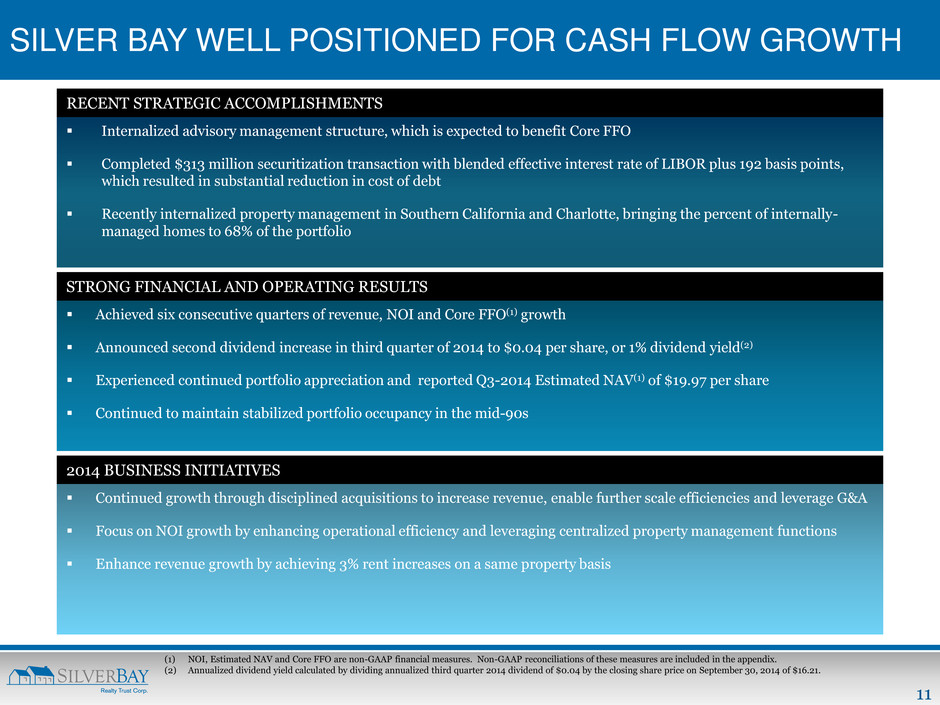
11 Internalized advisory management structure, which is expected to benefit Core FFO Completed $313 million securitization transaction with blended effective interest rate of LIBOR plus 192 basis points, which resulted in substantial reduction in cost of debt Recently internalized property management in Southern California and Charlotte, bringing the percent of internally- managed homes to 68% of the portfolio SILVER BAY WELL POSITIONED FOR CASH FLOW GROWTH (1) NOI, Estimated NAV and Core FFO are non-GAAP financial measures. Non-GAAP reconciliations of these measures are included in the appendix. (2) Annualized dividend yield calculated by dividing annualized third quarter 2014 dividend of $0.04 by the closing share price on September 30, 2014 of $16.21. RECENT STRATEGIC ACCOMPLISHMENTS Achieved six consecutive quarters of revenue, NOI and Core FFO(1) growth Announced second dividend increase in third quarter of 2014 to $0.04 per share, or 1% dividend yield(2) Experienced continued portfolio appreciation and reported Q3-2014 Estimated NAV(1) of $19.97 per share Continued to maintain stabilized portfolio occupancy in the mid-90s STRONG FINANCIAL AND OPERATING RESULTS 2014 BUSINESS INITIATIVES Continued growth through disciplined acquisitions to increase revenue, enable further scale efficiencies and leverage G&A Focus on NOI growth by enhancing operational efficiency and leveraging centralized property management functions Enhance revenue growth by achieving 3% rent increases on a same property basis
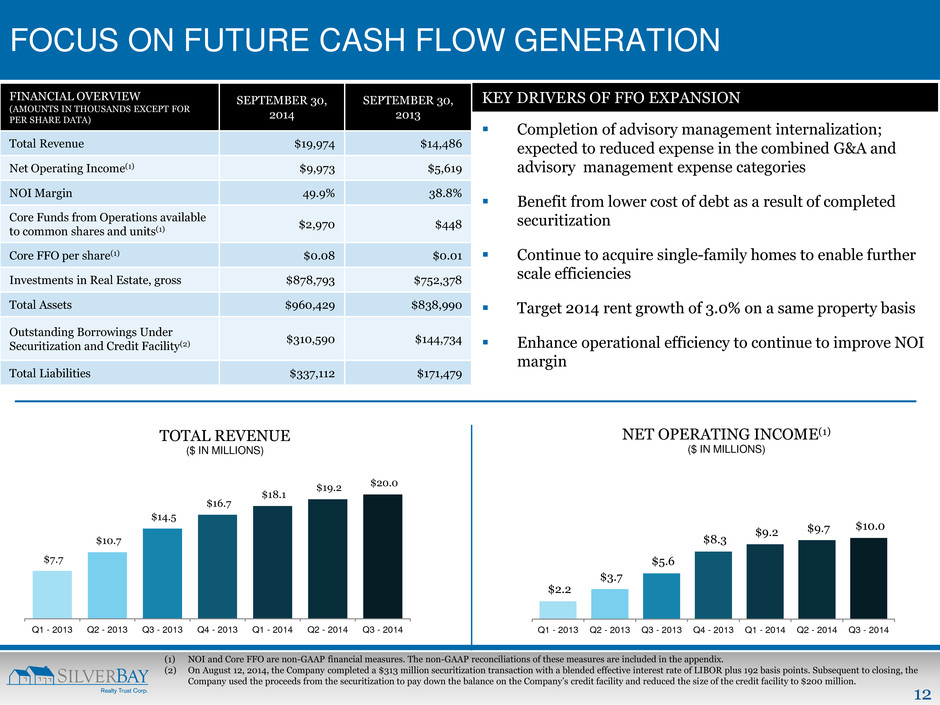
12 $7.7 $10.7 $14.5 $16.7 $18.1 $19.2 $20.0 Q1 - 2013 Q2 - 2013 Q3 - 2013 Q4 - 2013 Q1 - 2014 Q2 - 2014 Q3 - 2014 TOTAL REVENUE ($ IN MILLIONS) FOCUS ON FUTURE CASH FLOW GENERATION $2.2 $3.7 $5.6 $8.3 $9.2 $9.7 $10.0 Q1 - 2013 Q2 - 2013 Q3 - 2013 Q4 - 2013 Q1 - 2014 Q2 - 2014 Q3 - 2014 NET OPERATING INCOME(1) ($ IN MILLIONS) (1) NOI and Core FFO are non-GAAP financial measures. The non-GAAP reconciliations of these measures are included in the appendix. (2) On August 12, 2014, the Company completed a $313 million securitization transaction with a blended effective interest rate of LIBOR plus 192 basis points. Subsequent to closing, the Company used the proceeds from the securitization to pay down the balance on the Company’s credit facility and reduced the size of the credit facility to $200 million. Completion of advisory management internalization; expected to reduced expense in the combined G&A and advisory management expense categories Benefit from lower cost of debt as a result of completed securitization Continue to acquire single-family homes to enable further scale efficiencies Target 2014 rent growth of 3.0% on a same property basis Enhance operational efficiency to continue to improve NOI margin FINANCIAL OVERVIEW (AMOUNTS IN THOUSANDS EXCEPT FOR PER SHARE DATA) SEPTEMBER 30, 2014 SEPTEMBER 30, 2013 Total Revenue $19,974 $14,486 Net Operating Income(1) $9,973 $5,619 NOI Margin 49.9% 38.8% Core Funds from Operations available to common shares and units(1) $2,970 $448 Core FFO per share(1) $0.08 $0.01 Investments in Real Estate, gross $878,793 $752,378 Total Assets $960,429 $838,990 Outstanding Borrowings Under Securitization and Credit Facility(2) $310,590 $144,734 Total Liabilities $337,112 $171,479 KEY DRIVERS OF FFO EXPANSION
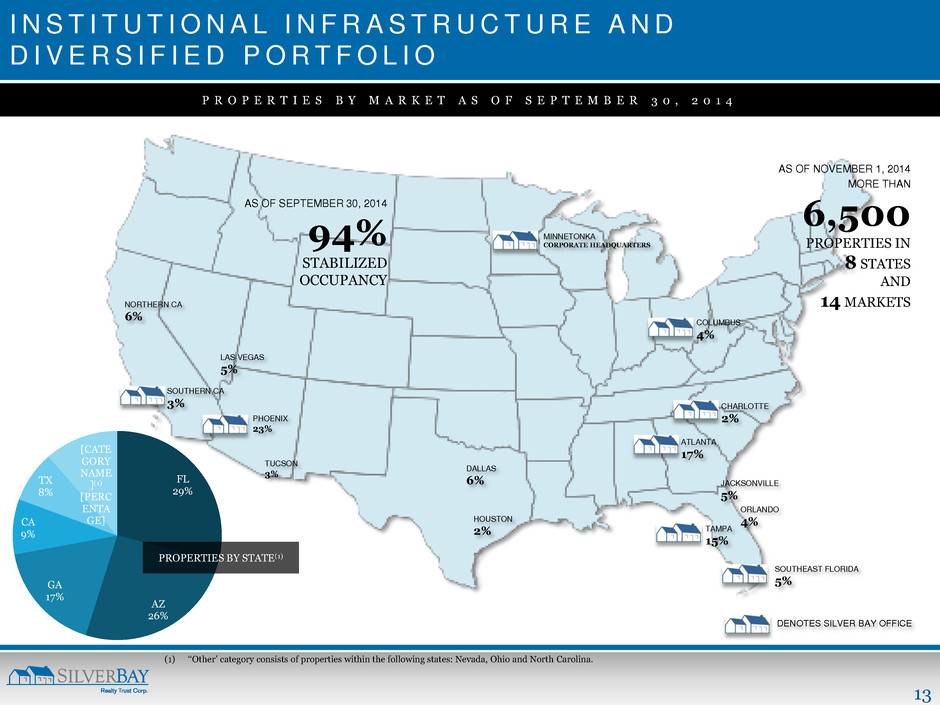
13 FL 29% AZ 26% GA 17% CA 9% TX 8% [CATE GORY NAME ](1) [PERC ENTA GE] I N S T I T U T I O N A L I N F R A S T R U C T U R E A N D D I V E R S I F I E D P O R T F O L I O AS OF SEPTEMBER 30, 2014 94% STABILIZED OCCUPANCY DENOTES SILVER BAY OFFICE NORTHERN CA 6% SOUTHERN CA 3% LAS VEGAS 5% PHOENIX 23% TUCSON 3% DALLAS 6% HOUSTON 2% SOUTHEAST FLORIDA 5% TAMPA 15% ORLANDO 4% JACKSONVILLE 5% ATLANTA 17% CHARLOTTE 2% COLUMBUS 4% MINNETONKA CORPORATE HEADQUARTERS PROPERTIES BY STATE(1) P R O P E R T I E S B Y M A R K E T A S O F S E P T E M B E R 3 0 , 2 0 1 4 (1) ‘‘Other’ category consists of properties within the following states: Nevada, Ohio and North Carolina. AS OF NOVEMBER 1, 2014 MORE THAN 6,500 PROPERTIES IN 8 STATES AND 14 MARKETS
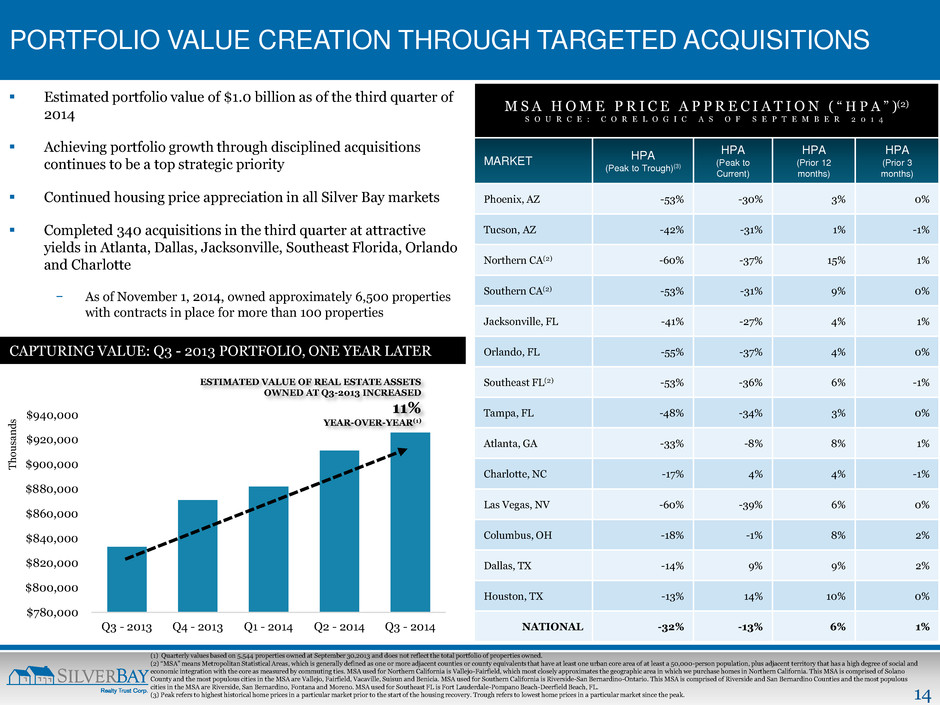
14 $780,000 $800,000 $820,000 $840,000 $860,000 $880,000 $900,000 $920,000 $940,000 Q3 - 2013 Q4 - 2013 Q1 - 2014 Q2 - 2014 Q3 - 2014 T ho u sa n d s PORTFOLIO VALUE CREATION THROUGH TARGETED ACQUISITIONS CAPTURING VALUE: Q3 - 2013 PORTFOLIO, ONE YEAR LATER ESTIMATED VALUE OF REAL ESTATE ASSETS OWNED AT Q3-2013 INCREASED 11% YEAR-OVER-YEAR(1) Estimated portfolio value of $1.0 billion as of the third quarter of 2014 Achieving portfolio growth through disciplined acquisitions continues to be a top strategic priority Continued housing price appreciation in all Silver Bay markets Completed 340 acquisitions in the third quarter at attractive yields in Atlanta, Dallas, Jacksonville, Southeast Florida, Orlando and Charlotte − As of November 1, 2014, owned approximately 6,500 properties with contracts in place for more than 100 properties M S A H O M E P R I C E A P P R E C I A T I O N ( “ H P A ” )(2) S O U R C E : C O R E L O G I C A S O F S E P T E M B E R 2 0 1 4 MARKET HPA (Peak to Trough)(3) HPA (Peak to Current) HPA (Prior 12 months) HPA (Prior 3 months) Phoenix, AZ -53% -30% 3% 0% Tucson, AZ -42% -31% 1% -1% Northern CA(2) -60% -37% 15% 1% Southern CA(2) -53% -31% 9% 0% Jacksonville, FL -41% -27% 4% 1% Orlando, FL -55% -37% 4% 0% Southeast FL(2) -53% -36% 6% -1% Tampa, FL -48% -34% 3% 0% Atlanta, GA -33% -8% 8% 1% Charlotte, NC -17% 4% 4% -1% Las Vegas, NV -60% -39% 6% 0% Columbus, OH -18% -1% 8% 2% Dallas, TX -14% 9% 9% 2% Houston, TX -13% 14% 10% 0% NATIONAL -32% -13% 6% 1% (1) Quarterly values based on 5,544 properties owned at September 30,2013 and does not reflect the total portfolio of properties owned. (2) “MSA” means Metropolitan Statistical Areas, which is generally defined as one or more adjacent counties or county equivalents that have at least one urban core area of at least a 50,000-person population, plus adjacent territory that has a high degree of social and economic integration with the core as measured by commuting ties. MSA used for Northern California is Vallejo-Fairfield, which most closely approximates the geographic area in which we purchase homes in Northern California. This MSA is comprised of Solano County and the most populous cities in the MSA are Vallejo, Fairfield, Vacaville, Suisun and Benicia. MSA used for Southern California is Riverside-San Bernardino-Ontario. This MSA is comprised of Riverside and San Bernardino Counties and the most populous cities in the MSA are Riverside, San Bernardino, Fontana and Moreno. MSA used for Southeast FL is Fort Lauderdale-Pompano Beach-Deerfield Beach, FL. (3) Peak refers to highest historical home prices in a particular market prior to the start of the housing recovery. Trough refers to lowest home prices in a particular market since the peak.
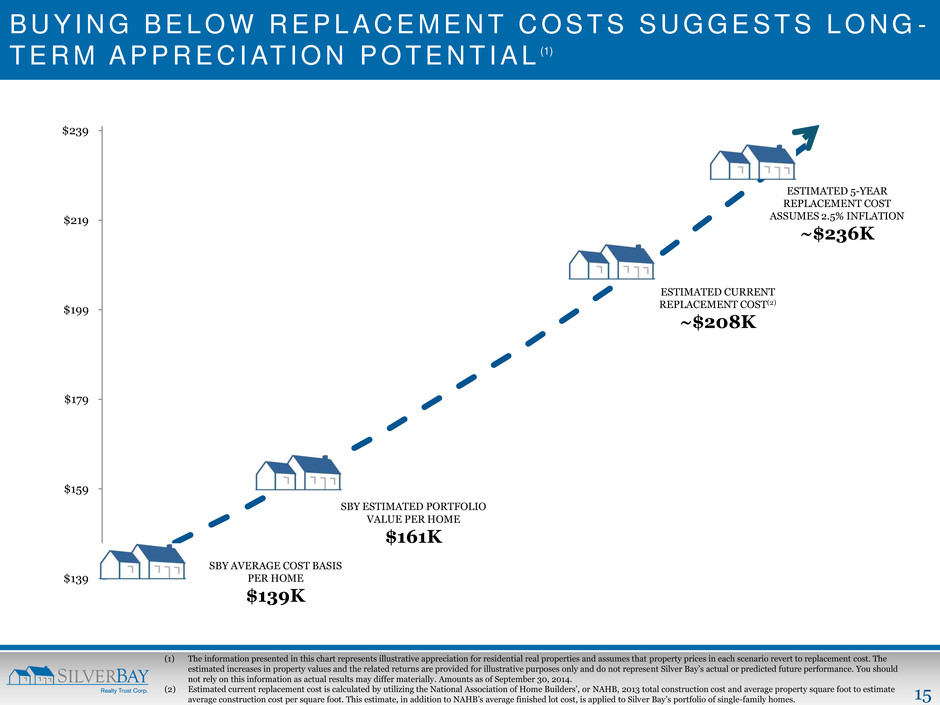
15 $139 $159 $179 $199 $219 $239 B U Y I N G B E L O W R E P L A C E M E N T C O S T S S U G G E S T S L O N G - T E R M A P P R E C I AT I O N P O T E N T I A L (1) (1) The information presented in this chart represents illustrative appreciation for residential real properties and assumes that property prices in each scenario revert to replacement cost. The estimated increases in property values and the related returns are provided for illustrative purposes only and do not represent Silver Bay’s actual or predicted future performance. You should not rely on this information as actual results may differ materially. Amounts as of September 30, 2014. (2) Estimated current replacement cost is calculated by utilizing the National Association of Home Builders’, or NAHB, 2013 total construction cost and average property square foot to estimate average construction cost per square foot. This estimate, in addition to NAHB’s average finished lot cost, is applied to Silver Bay’s portfolio of single-family homes. SBY AVERAGE COST BASIS PER HOME $139K SBY ESTIMATED PORTFOLIO VALUE PER HOME $161K ESTIMATED CURRENT REPLACEMENT COST(2) ~$208K ESTIMATED 5-YEAR REPLACEMENT COST ASSUMES 2.5% INFLATION ~$236K
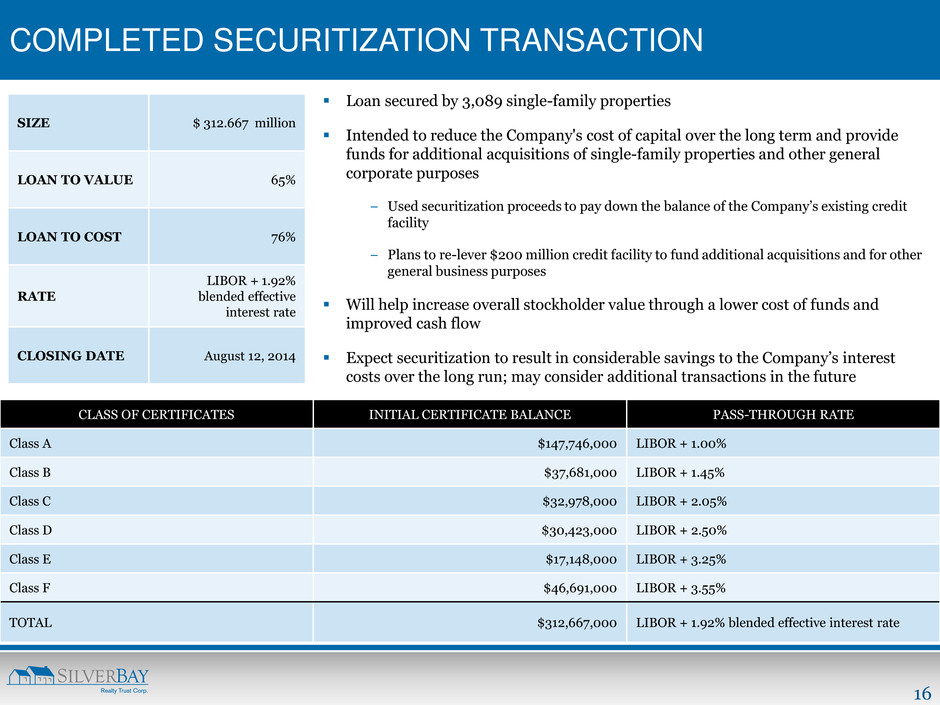
16 COMPLETED SECURITIZATION TRANSACTION CLASS OF CERTIFICATES INITIAL CERTIFICATE BALANCE PASS-THROUGH RATE Class A $147,746,000 LIBOR + 1.00% Class B $37,681,000 LIBOR + 1.45% Class C $32,978,000 LIBOR + 2.05% Class D $30,423,000 LIBOR + 2.50% Class E $17,148,000 LIBOR + 3.25% Class F $46,691,000 LIBOR + 3.55% TOTAL $312,667,000 LIBOR + 1.92% blended effective interest rate SIZE $ 312.667 million LOAN TO VALUE 65% LOAN TO COST 76% RATE LIBOR + 1.92% blended effective interest rate CLOSING DATE August 12, 2014 Loan secured by 3,089 single-family properties Intended to reduce the Company's cost of capital over the long term and provide funds for additional acquisitions of single-family properties and other general corporate purposes − Used securitization proceeds to pay down the balance of the Company’s existing credit facility − Plans to re-lever $200 million credit facility to fund additional acquisitions and for other general business purposes Will help increase overall stockholder value through a lower cost of funds and improved cash flow Expect securitization to result in considerable savings to the Company’s interest costs over the long run; may consider additional transactions in the future
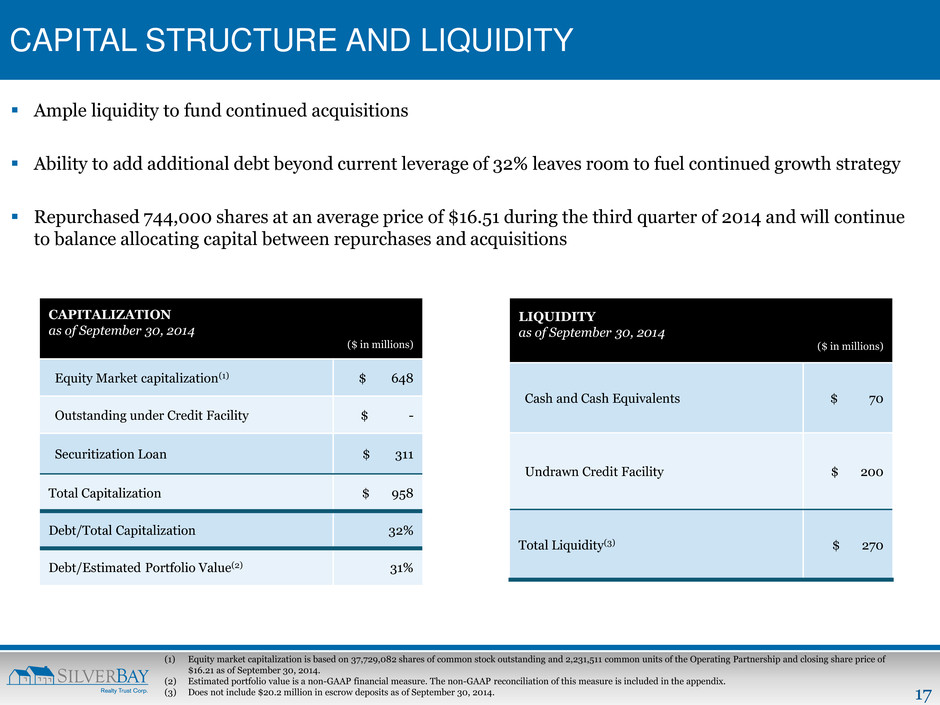
17 CAPITAL STRUCTURE AND LIQUIDITY CAPITALIZATION as of September 30, 2014 ($ in millions) Equity Market capitalization(1) $ 648 Outstanding under Credit Facility $ - Securitization Loan $ 311 Total Capitalization $ 958 Debt/Total Capitalization 32% Debt/Estimated Portfolio Value(2) 31% LIQUIDITY as of September 30, 2014 ($ in millions) Cash and Cash Equivalents $ 70 Undrawn Credit Facility $ 200 Total Liquidity(3) $ 270 Ample liquidity to fund continued acquisitions Ability to add additional debt beyond current leverage of 32% leaves room to fuel continued growth strategy Repurchased 744,000 shares at an average price of $16.51 during the third quarter of 2014 and will continue to balance allocating capital between repurchases and acquisitions (1) Equity market capitalization is based on 37,729,082 shares of common stock outstanding and 2,231,511 common units of the Operating Partnership and closing share price of $16.21 as of September 30, 2014. (2) Estimated portfolio value is a non-GAAP financial measure. The non-GAAP reconciliation of this measure is included in the appendix. (3) Does not include $20.2 million in escrow deposits as of September 30, 2014.
18 O P E R AT I O N S O V E R V I E W

19 B U S I N E S S O B J E C T I V E S O B J E C T I V E S : Provide high quality rental homes with best-in-class customer service to create a long-term sustainable business Achieve attractive total return combining capital appreciation with rental cash flow yields ACQUISITIONS RENOVATIONS P R O P E R T Y MANAGEMENT A C H I E V E EFFICIENCIES Disciplined growth through rigorous asset selection Dedicated focus on properties exhibiting attractive total return profile Selection of high- quality homes in resident preferred locations High-quality up-front initial renovations to minimize future ongoing maintenance expenses Standardized fit and finish maximizes longevity and cost savings as well as resident satisfaction Rigorous resident screening process ensures quality residents with increased likelihood of long term tenancy Excellence in customer service to provide resident satisfaction and establish lasting relationships Expand operating platform and capture efficiencies of scale Establish brand as preferred manager within single-family rental community Leverage G&A, reduce per unit operating expenses and lower cost of capital
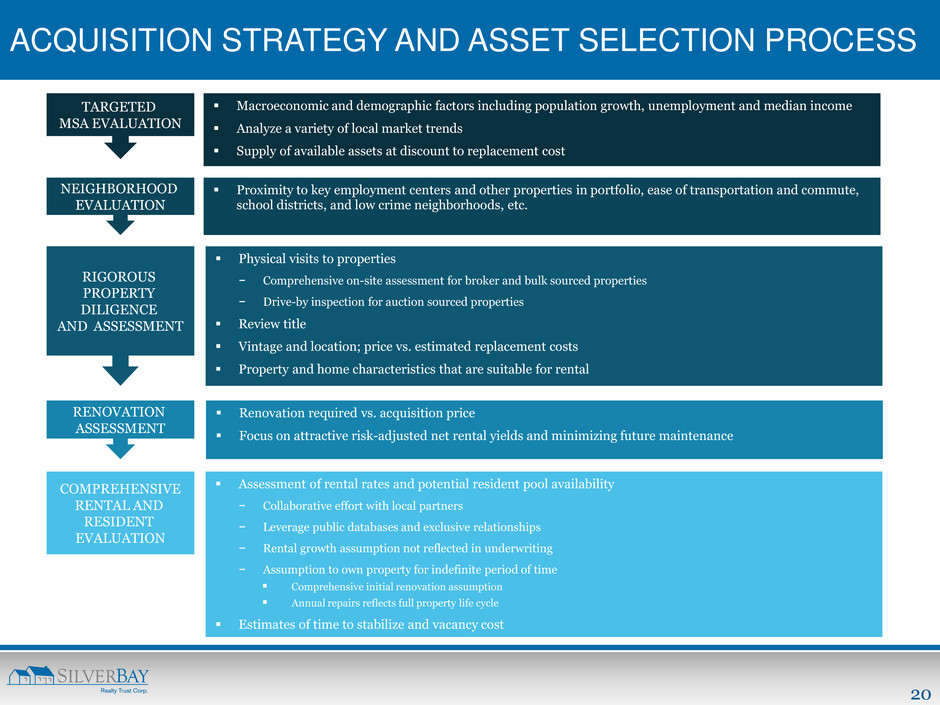
20 ACQUISITION STRATEGY AND ASSET SELECTION PROCESS TARGETED MSA EVALUATION NEIGHBORHOOD EVALUATION RIGOROUS PROPERTY DILIGENCE AND ASSESSMENT RENOVATION ASSESSMENT COMPREHENSIVE RENTAL AND RESIDENT EVALUATION Macroeconomic and demographic factors including population growth, unemployment and median income Analyze a variety of local market trends Supply of available assets at discount to replacement cost Physical visits to properties − Comprehensive on-site assessment for broker and bulk sourced properties − Drive-by inspection for auction sourced properties Review title Vintage and location; price vs. estimated replacement costs Property and home characteristics that are suitable for rental Proximity to key employment centers and other properties in portfolio, ease of transportation and commute, school districts, and low crime neighborhoods, etc. Renovation required vs. acquisition price Focus on attractive risk-adjusted net rental yields and minimizing future maintenance Assessment of rental rates and potential resident pool availability − Collaborative effort with local partners − Leverage public databases and exclusive relationships − Rental growth assumption not reflected in underwriting − Assumption to own property for indefinite period of time Comprehensive initial renovation assumption Annual repairs reflects full property life cycle Estimates of time to stabilize and vacancy cost
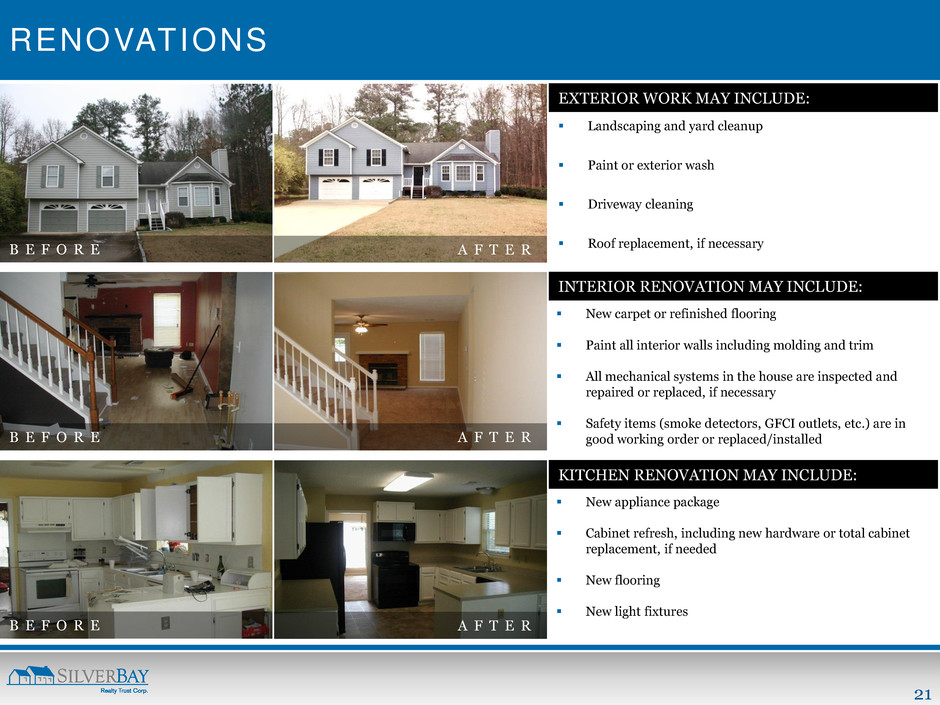
21 New appliance package Cabinet refresh, including new hardware or total cabinet replacement, if needed New flooring New light fixtures RENOVATIONS B E F O R E A F T E R Landscaping and yard cleanup Paint or exterior wash Driveway cleaning Roof replacement, if necessary New carpet or refinished flooring Paint all interior walls including molding and trim All mechanical systems in the house are inspected and repaired or replaced, if necessary Safety items (smoke detectors, GFCI outlets, etc.) are in good working order or replaced/installed B E F O R E A F T E R B E F O R E A F T E R KITCHEN RENOVATION MAY INCLUDE: INTERIOR RENOVATION MAY INCLUDE: EXTERIOR WORK MAY INCLUDE:
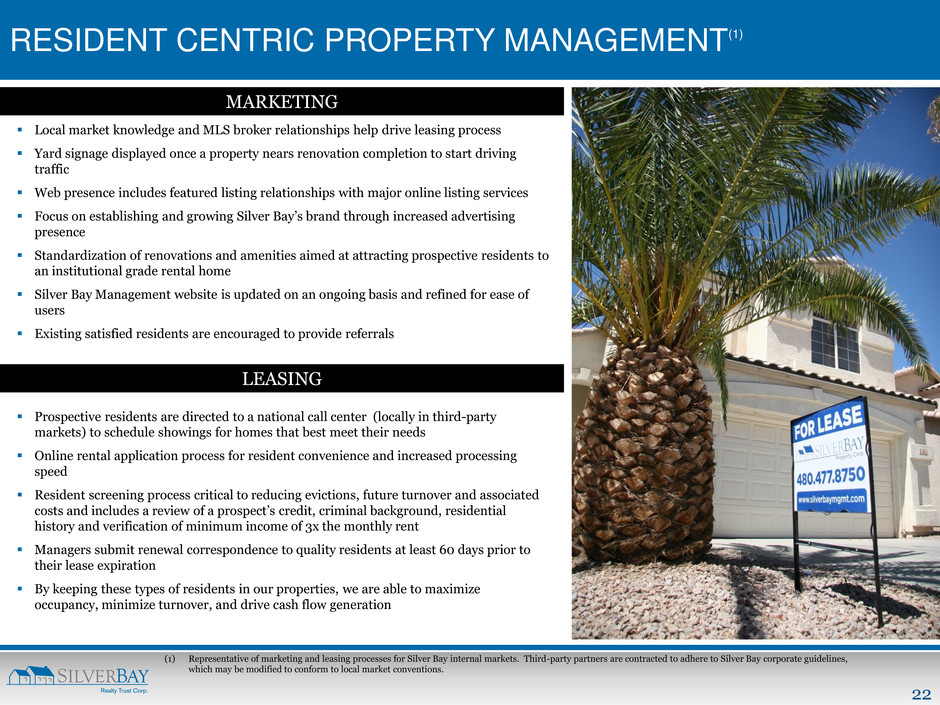
22 Local market knowledge and MLS broker relationships help drive leasing process Yard signage displayed once a property nears renovation completion to start driving traffic Web presence includes featured listing relationships with major online listing services Focus on establishing and growing Silver Bay’s brand through increased advertising presence Standardization of renovations and amenities aimed at attracting prospective residents to an institutional grade rental home Silver Bay Management website is updated on an ongoing basis and refined for ease of users Existing satisfied residents are encouraged to provide referrals RESIDENT CENTRIC PROPERTY MANAGEMENT(1) MARKETING LEASING Prospective residents are directed to a national call center (locally in third-party markets) to schedule showings for homes that best meet their needs Online rental application process for resident convenience and increased processing speed Resident screening process critical to reducing evictions, future turnover and associated costs and includes a review of a prospect’s credit, criminal background, residential history and verification of minimum income of 3x the monthly rent Managers submit renewal correspondence to quality residents at least 60 days prior to their lease expiration By keeping these types of residents in our properties, we are able to maximize occupancy, minimize turnover, and drive cash flow generation (1) Representative of marketing and leasing processes for Silver Bay internal markets. Third-party partners are contracted to adhere to Silver Bay corporate guidelines, which may be modified to conform to local market conventions.
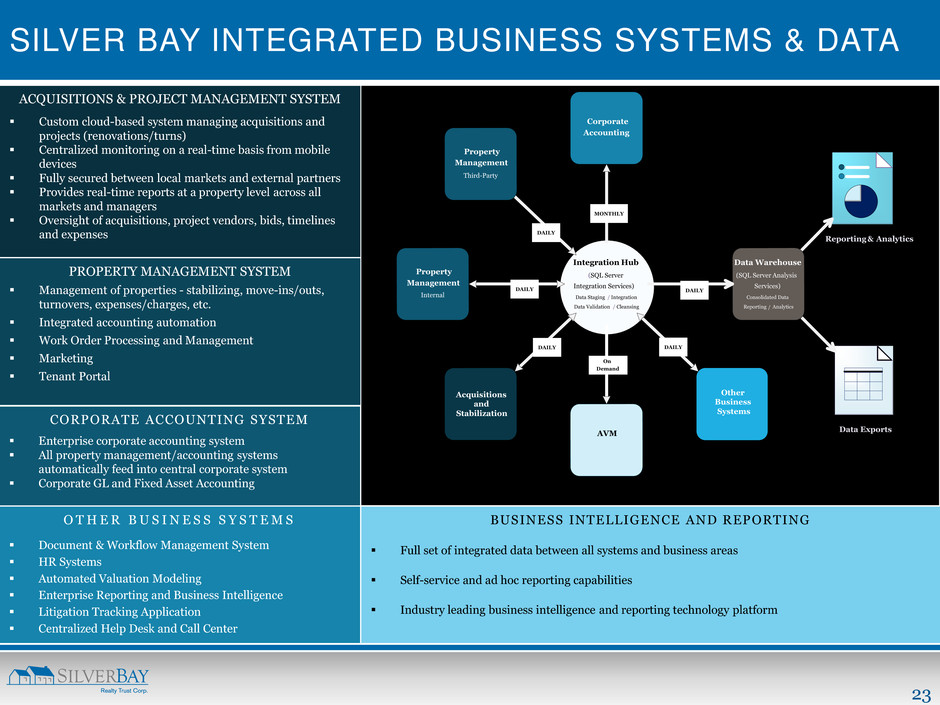
23 SILVER BAY INTEGRATED BUSINESS SYSTEMS & DATA ACQUISITIONS & PROJECT MANAGEMENT SYSTEM Custom cloud-based system managing acquisitions and projects (renovations/turns) Centralized monitoring on a real-time basis from mobile devices Fully secured between local markets and external partners Provides real-time reports at a property level across all markets and managers Oversight of acquisitions, project vendors, bids, timelines and expenses PROPERTY MANAGEMENT SYSTEM Management of properties - stabilizing, move-ins/outs, turnovers, expenses/charges, etc. Integrated accounting automation Work Order Processing and Management Marketing Tenant Portal O T H E R B U S I N E S S S Y S T E M S Document & Workflow Management System HR Systems Automated Valuation Modeling Enterprise Reporting and Business Intelligence Litigation Tracking Application Centralized Help Desk and Call Center CORPORATE ACCOUNTING SYSTEM Enterprise corporate accounting system All property management/accounting systems automatically feed into central corporate system Corporate GL and Fixed Asset Accounting BUSINESS INTELLIGENCE AND REPORTING Full set of integrated data between all systems and business areas Self-service and ad hoc reporting capabilities Industry leading business intelligence and reporting technology platform Yardi Acquisitions and Stabilization Other Business Systems Property Management Internal Corporate Accounting Integration Hub ( SQL Server Integration Services) Data Staging / Integration Data Validation / Cleansing Reporting & Analytics Data Exports Data Warehouse ( SQL Server Analysis Services) Consolidated Data Reporting / Analytics DAILY MONTHLY DAILY DAILY DAILY DAILY Yardi Property Management Third-Party AVM On Demand
24 A P P E N D I X
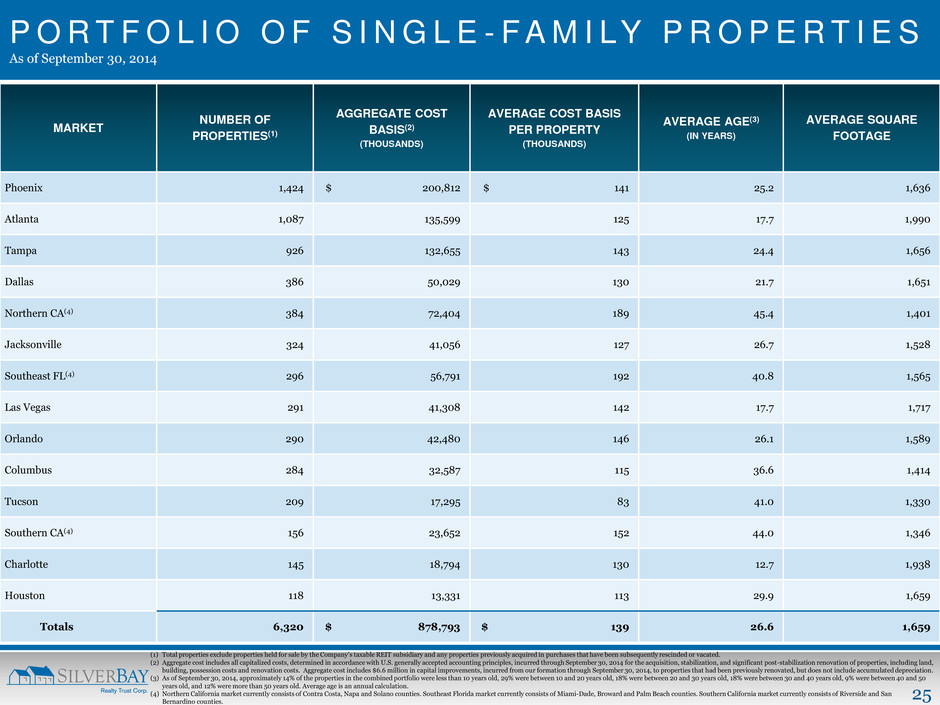
25 P O R T F O L I O O F S I N G L E - F A M I LY P R O P E R T I E S As of September 30, 2014 MARKET NUMBER OF PROPERTIES(1) AGGREGATE COST BASIS(2) (THOUSANDS) AVERAGE COST BASIS PER PROPERTY (THOUSANDS) AVERAGE AGE(3) (IN YEARS) AVERAGE SQUARE FOOTAGE Phoenix 1,424 $ 200,812 $ 141 25.2 1,636 Atlanta 1,087 135,599 125 17.7 1,990 Tampa 926 132,655 143 24.4 1,656 Dallas 386 50,029 130 21.7 1,651 Northern CA(4) 384 72,404 189 45.4 1,401 Jacksonville 324 41,056 127 26.7 1,528 Southeast FL(4) 296 56,791 192 40.8 1,565 Las Vegas 291 41,308 142 17.7 1,717 Orlando 290 42,480 146 26.1 1,589 Columbus 284 32,587 115 36.6 1,414 Tucson 209 17,295 83 41.0 1,330 Southern CA(4) 156 23,652 152 44.0 1,346 Charlotte 145 18,794 130 12.7 1,938 Houston 118 13,331 113 29.9 1,659 Totals 6,320 $ 878,793 $ 139 26.6 1,659 (1) Total properties exclude properties held for sale by the Company’s taxable REIT subsidiary and any properties previously acquired in purchases that have been subsequently rescinded or vacated. (2) Aggregate cost includes all capitalized costs, determined in accordance with U.S. generally accepted accounting principles, incurred through September 30, 2014 for the acquisition, stabilization, and significant post-stabilization renovation of properties, including land, building, possession costs and renovation costs. Aggregate cost includes $6.6 million in capital improvements, incurred from our formation through September 30, 2014, to properties that had been previously renovated, but does not include accumulated depreciation. (3) As of September 30, 2014, approximately 14% of the properties in the combined portfolio were less than 10 years old, 29% were between 10 and 20 years old, 18% were between 20 and 30 years old, 18% were between 30 and 40 years old, 9% were between 40 and 50 years old, and 12% were more than 50 years old. Average age is an annual calculation. (4) Northern California market currently consists of Contra Costa, Napa and Solano counties. Southeast Florida market currently consists of Miami-Dade, Broward and Palm Beach counties. Southern California market currently consists of Riverside and San Bernardino counties.
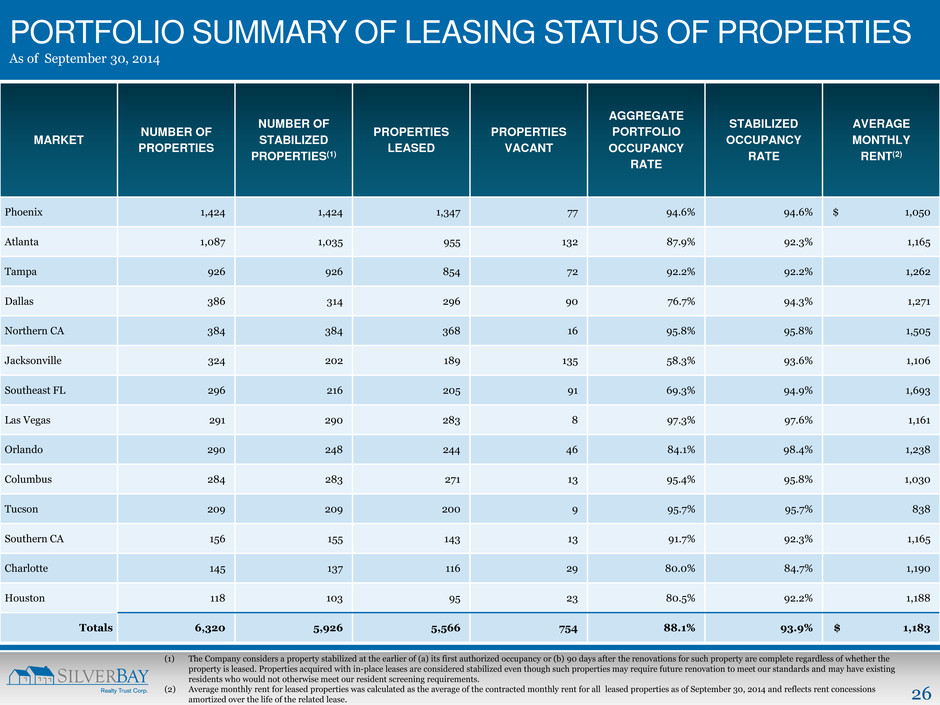
26 MARKET NUMBER OF PROPERTIES NUMBER OF STABILIZED PROPERTIES(1) PROPERTIES LEASED PROPERTIES VACANT AGGREGATE PORTFOLIO OCCUPANCY RATE STABILIZED OCCUPANCY RATE AVERAGE MONTHLY RENT(2) Phoenix 1,424 1,424 1,347 77 94.6% 94.6% $ 1,050 Atlanta 1,087 1,035 955 132 87.9% 92.3% 1,165 Tampa 926 926 854 72 92.2% 92.2% 1,262 Dallas 386 314 296 90 76.7% 94.3% 1,271 Northern CA 384 384 368 16 95.8% 95.8% 1,505 Jacksonville 324 202 189 135 58.3% 93.6% 1,106 Southeast FL 296 216 205 91 69.3% 94.9% 1,693 Las Vegas 291 290 283 8 97.3% 97.6% 1,161 Orlando 290 248 244 46 84.1% 98.4% 1,238 Columbus 284 283 271 13 95.4% 95.8% 1,030 Tucson 209 209 200 9 95.7% 95.7% 838 Southern CA 156 155 143 13 91.7% 92.3% 1,165 Charlotte 145 137 116 29 80.0% 84.7% 1,190 Houston 118 103 95 23 80.5% 92.2% 1,188 Totals 6,320 5,926 5,566 754 88.1% 93.9% $ 1,183 PORTFOLIO SUMMARY OF LEASING STATUS OF PROPERTIES As of September 30, 2014 (1) The Company considers a property stabilized at the earlier of (a) its first authorized occupancy or (b) 90 days after the renovations for such property are complete regardless of whether the property is leased. Properties acquired with in-place leases are considered stabilized even though such properties may require future renovation to meet our standards and may have existing residents who would not otherwise meet our resident screening requirements. (2) Average monthly rent for leased properties was calculated as the average of the contracted monthly rent for all leased properties as of September 30, 2014 and reflects rent concessions amortized over the life of the related lease.
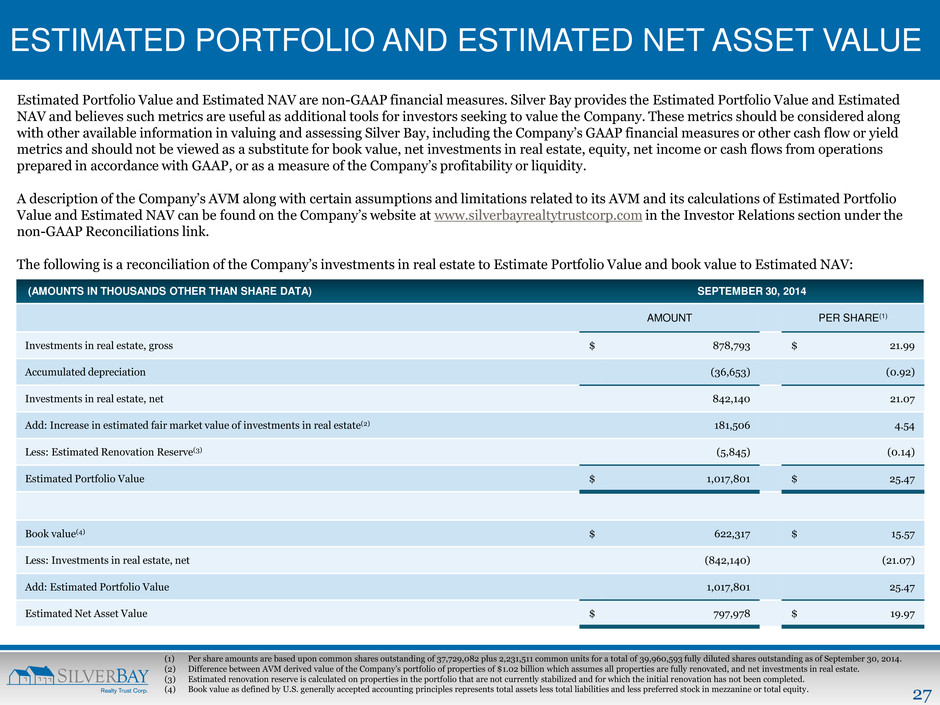
27 ESTIMATED PORTFOLIO AND ESTIMATED NET ASSET VALUE Estimated Portfolio Value and Estimated NAV are non-GAAP financial measures. Silver Bay provides the Estimated Portfolio Value and Estimated NAV and believes such metrics are useful as additional tools for investors seeking to value the Company. These metrics should be considered along with other available information in valuing and assessing Silver Bay, including the Company’s GAAP financial measures or other cash flow or yield metrics and should not be viewed as a substitute for book value, net investments in real estate, equity, net income or cash flows from operations prepared in accordance with GAAP, or as a measure of the Company’s profitability or liquidity. A description of the Company’s AVM along with certain assumptions and limitations related to its AVM and its calculations of Estimated Portfolio Value and Estimated NAV can be found on the Company’s website at www.silverbayrealtytrustcorp.com in the Investor Relations section under the non-GAAP Reconciliations link. The following is a reconciliation of the Company’s investments in real estate to Estimate Portfolio Value and book value to Estimated NAV: (1) Per share amounts are based upon common shares outstanding of 37,729,082 plus 2,231,511 common units for a total of 39,960,593 fully diluted shares outstanding as of September 30, 2014. (2) Difference between AVM derived value of the Company’s portfolio of properties of $1.02 billion which assumes all properties are fully renovated, and net investments in real estate. (3) Estimated renovation reserve is calculated on properties in the portfolio that are not currently stabilized and for which the initial renovation has not been completed. (4) Book value as defined by U.S. generally accepted accounting principles represents total assets less total liabilities and less preferred stock in mezzanine or total equity. (AMOUNTS IN THOUSANDS OTHER THAN SHARE DATA) SEPTEMBER 30, 2014 AMOUNT PER SHARE(1) Investments in real estate, gross $ 878,793 $ 21.99 Accumulated depreciation (36,653) (0.92) Investments in real estate, net 842,140 21.07 Add: Increase in estimated fair market value of investments in real estate(2) 181,506 4.54 Less: Estimated Renovation Reserve(3) (5,845) (0.14) Estimated Portfolio Value $ 1,017,801 $ 25.47 Book value(4) $ 622,317 $ 15.57 Less: Investments in real estate, net (842,140) (21.07) Add: Estimated Portfolio Value 1,017,801 25.47 Estimated Net Asset Value $ 797,978 $ 19.97
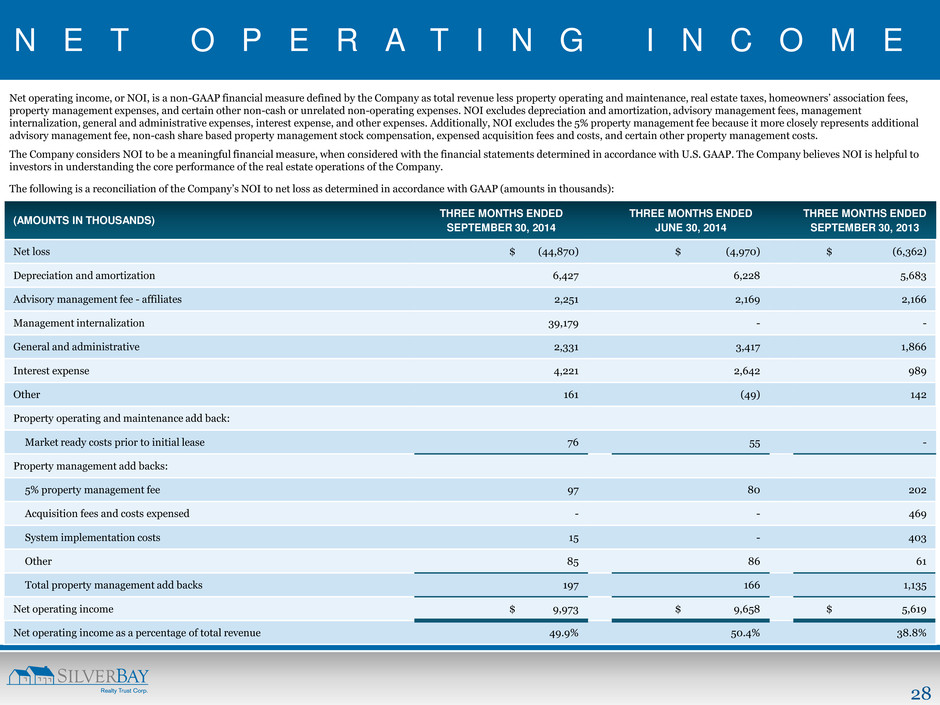
28 N E T O P E R A T I N G I N C O M E Net operating income, or NOI, is a non-GAAP financial measure defined by the Company as total revenue less property operating and maintenance, real estate taxes, homeowners’ association fees, property management expenses, and certain other non-cash or unrelated non-operating expenses. NOI excludes depreciation and amortization, advisory management fees, management internalization, general and administrative expenses, interest expense, and other expenses. Additionally, NOI excludes the 5% property management fee because it more closely represents additional advisory management fee, non-cash share based property management stock compensation, expensed acquisition fees and costs, and certain other property management costs. The Company considers NOI to be a meaningful financial measure, when considered with the financial statements determined in accordance with U.S. GAAP. The Company believes NOI is helpful to investors in understanding the core performance of the real estate operations of the Company. The following is a reconciliation of the Company’s NOI to net loss as determined in accordance with GAAP (amounts in thousands): (AMOUNTS IN THOUSANDS) THREE MONTHS ENDED SEPTEMBER 30, 2014 THREE MONTHS ENDED JUNE 30, 2014 THREE MONTHS ENDED SEPTEMBER 30, 2013 Net loss $ (44,870) $ (4,970) $ (6,362) Depreciation and amortization 6,427 6,228 5,683 Advisory management fee - affiliates 2,251 2,169 2,166 Management internalization 39,179 - - General and administrative 2,331 3,417 1,866 Interest expense 4,221 2,642 989 Other 161 (49) 142 Property operating and maintenance add back: Market ready costs prior to initial lease 76 55 - Property management add backs: 5% property management fee 97 80 202 Acquisition fees and costs expensed - - 469 System implementation costs 15 - 403 Other 85 86 61 Total property management add backs 197 166 1,135 Net operating income $ 9,973 $ 9,658 $ 5,619 Net operating income as a percentage of total revenue 49.9% 50.4% 38.8%
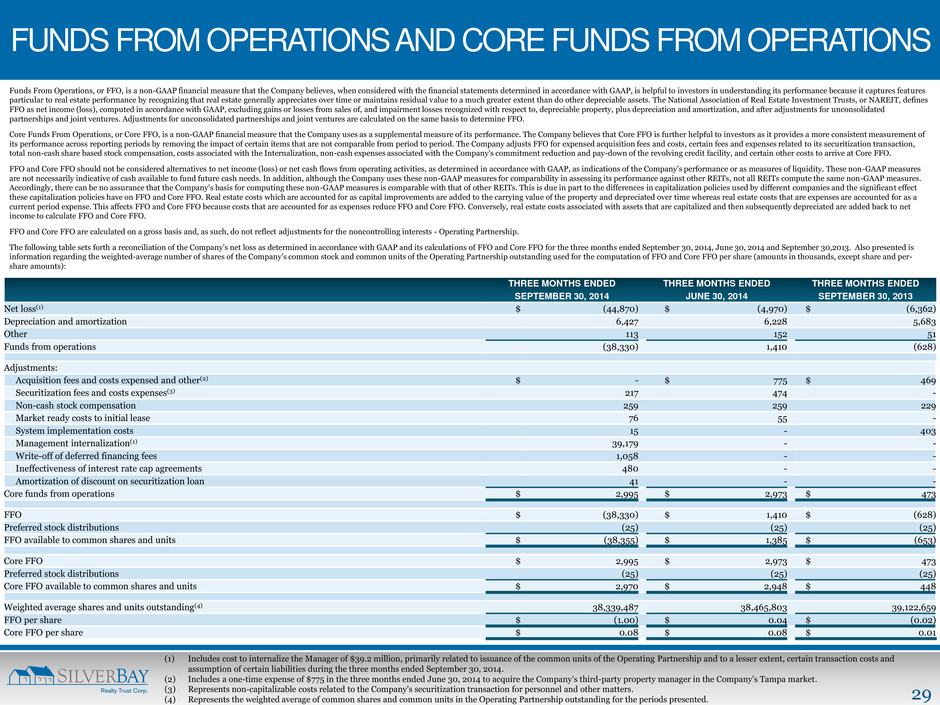
29 FUNDS FROM OPERATIONS AND CORE FUNDS FROM OPERATIONS Funds From Operations, or FFO, is a non-GAAP financial measure that the Company believes, when considered with the financial statements determined in accordance with GAAP, is helpful to investors in understanding its performance because it captures features particular to real estate performance by recognizing that real estate generally appreciates over time or maintains residual value to a much greater extent than do other depreciable assets. The National Association of Real Estate Investment Trusts, or NAREIT, defines FFO as net income (loss), computed in accordance with GAAP, excluding gains or losses from sales of, and impairment losses recognized with respect to, depreciable property, plus depreciation and amortization, and after adjustments for unconsolidated partnerships and joint ventures. Adjustments for unconsolidated partnerships and joint ventures are calculated on the same basis to determine FFO. Core Funds From Operations, or Core FFO, is a non-GAAP financial measure that the Company uses as a supplemental measure of its performance. The Company believes that Core FFO is further helpful to investors as it provides a more consistent measurement of its performance across reporting periods by removing the impact of certain items that are not comparable from period to period. The Company adjusts FFO for expensed acquisition fees and costs, certain fees and expenses related to its securitization transaction, total non-cash share based stock compensation, costs associated with the Internalization, non-cash expenses associated with the Company's commitment reduction and pay-down of the revolving credit facility, and certain other costs to arrive at Core FFO. FFO and Core FFO should not be considered alternatives to net income (loss) or net cash flows from operating activities, as determined in accordance with GAAP, as indications of the Company's performance or as measures of liquidity. These non-GAAP measures are not necessarily indicative of cash available to fund future cash needs. In addition, although the Company uses these non-GAAP measures for comparability in assessing its performance against other REITs, not all REITs compute the same non-GAAP measures. Accordingly, there can be no assurance that the Company's basis for computing these non-GAAP measures is comparable with that of other REITs. This is due in part to the differences in capitalization policies used by different companies and the significant effect these capitalization policies have on FFO and Core FFO. Real estate costs which are accounted for as capital improvements are added to the carrying value of the property and depreciated over time whereas real estate costs that are expenses are accounted for as a current period expense. This affects FFO and Core FFO because costs that are accounted for as expenses reduce FFO and Core FFO. Conversely, real estate costs associated with assets that are capitalized and then subsequently depreciated are added back to net income to calculate FFO and Core FFO. FFO and Core FFO are calculated on a gross basis and, as such, do not reflect adjustments for the noncontrolling interests - Operating Partnership. The following table sets forth a reconciliation of the Company’s net loss as determined in accordance with GAAP and its calculations of FFO and Core FFO for the three months ended September 30, 2014, June 30, 2014 and September 30,2013. Also presented is information regarding the weighted-average number of shares of the Company's common stock and common units of the Operating Partnership outstanding used for the computation of FFO and Core FFO per share (amounts in thousands, except share and per- share amounts): THREE MONTHS ENDED SEPTEMBER 30, 2014 THREE MONTHS ENDED JUNE 30, 2014 THREE MONTHS ENDED SEPTEMBER 30, 2013 Net loss(1) $ (44,870) $ (4,970) $ (6,362) Depreciation and amortization 6,427 6,228 5,683 Other 113 152 51 Funds from operations (38,330) 1,410 (628) Adjustments: Acquisition fees and costs expensed and other(2) $ - $ 775 $ 469 Securitization fees and costs expenses(3) 217 474 - Non-cash stock compensation 259 259 229 Market ready costs to initial lease 76 55 - System implementation costs 15 - 403 Management internalization(1) 39,179 - - Write-off of deferred financing fees 1,058 - - Ineffectiveness of interest rate cap agreements 480 - - Amortization of discount on securitization loan 41 - - Core funds from operations $ 2,995 $ 2,973 $ 473 FFO $ (38,330) $ 1,410 $ (628) Preferred stock distributions (25) (25) (25) FFO available to common shares and units $ (38,355) $ 1,385 $ (653) Core FFO $ 2,995 $ 2,973 $ 473 Preferred stock distributions (25) (25) (25) Core FFO available to common shares and units $ 2,970 $ 2,948 $ 448 Weighted average shares and units outstanding(4) 38,339,487 38,465,803 39,122,659 FFO per share $ (1.00) $ 0.04 $ (0.02) Core FFO per share $ 0.08 $ 0.08 $ 0.01 (1) Includes cost to internalize the Manager of $39.2 million, primarily related to issuance of the common units of the Operating Partnership and to a lesser extent, certain transaction costs and assumption of certain liabilities during the three months ended September 30, 2014. (2) Includes a one-time expense of $775 in the three months ended June 30, 2014 to acquire the Company's third-party property manager in the Company's Tampa market. (3) Represents non-capitalizable costs related to the Company's securitization transaction for personnel and other matters. (4) Represents the weighted average of common shares and common units in the Operating Partnership outstanding for the periods presented.
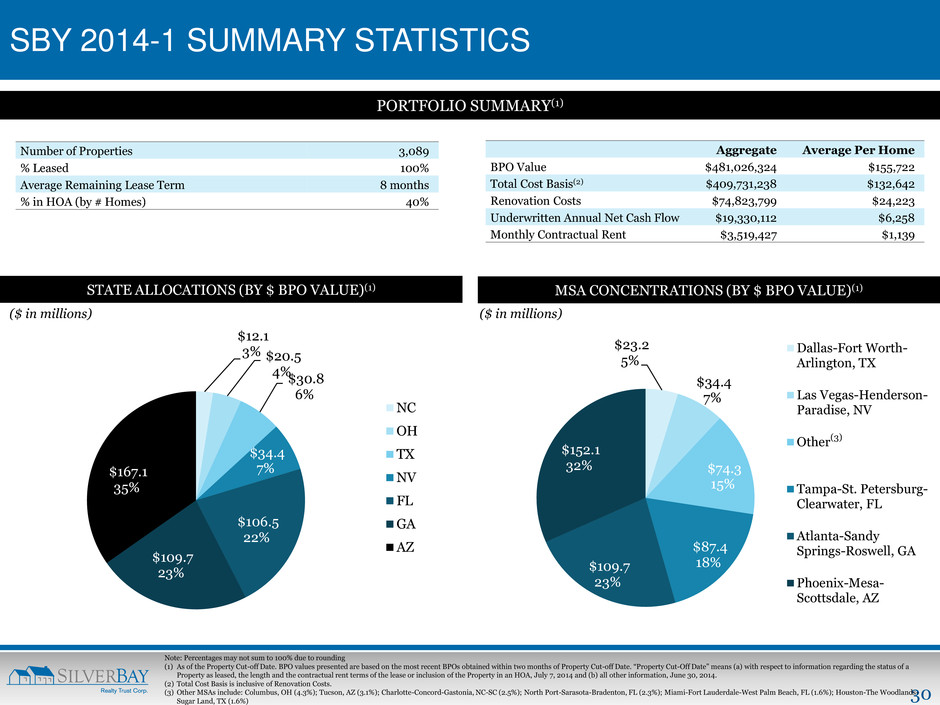
30 SBY 2014-1 SUMMARY STATISTICS STATE ALLOCATIONS (BY $ BPO VALUE)(1) $12.1 3% $20.5 4% $30.8 6% $34.4 7% $106.5 22% $109.7 23% $167.1 35% NC OH TX NV FL GA AZ PORTFOLIO SUMMARY(1) MSA CONCENTRATIONS (BY $ BPO VALUE)(1) ($ in millions) Note: Percentages may not sum to 100% due to rounding (1) As of the Property Cut-off Date. BPO values presented are based on the most recent BPOs obtained within two months of Property Cut-off Date. “Property Cut-Off Date” means (a) with respect to information regarding the status of a Property as leased, the length and the contractual rent terms of the lease or inclusion of the Property in an HOA, July 7, 2014 and (b) all other information, June 30, 2014. (2) Total Cost Basis is inclusive of Renovation Costs. (3) Other MSAs include: Columbus, OH (4.3%); Tucson, AZ (3.1%); Charlotte-Concord-Gastonia, NC-SC (2.5%); North Port-Sarasota-Bradenton, FL (2.3%); Miami-Fort Lauderdale-West Palm Beach, FL (1.6%); Houston-The Woodlands- Sugar Land, TX (1.6%) $23.2 5% $34.4 7% $74.3 15% $87.4 18% $109.7 23% $152.1 32% Dallas-Fort Worth- Arlington, TX Las Vegas-Henderson- Paradise, NV Other (3) Tampa-St. Petersburg- Clearwater, FL Atlanta-Sandy Springs-Roswell, GA Phoenix-Mesa- Scottsdale, AZ (3) Number of Properties 3,089 % Leased 100% Average Remaining Lease Term 8 months % in HOA (by # Homes) 40% Aggregate Average Per Home BPO Value $481,026,324 $155,722 Total Cost Basis(2) $409,731,238 $132,642 Renovation Costs $74,823,799 $24,223 Underwritten Annual Net Cash Flow $19,330,112 $6,258 Monthly Contractual Rent $3,519,427 $1,139 ($ in millions)
31 3300 FERNBROOK LANE NORTH | SUITE 210 | PLYMOUTH | MN | 55447 P: 952.358.4400 | E: INVES TO RS@ SILVERBAYMGMT .C OM
