Attached files
| file | filename |
|---|---|
| EX-99.1 - EXHIBIT 99.1 PRESS RELEASE - Spectrum Brands Holdings, Inc. | hrg-9302014x10xksep30quart.htm |
| 8-K - 8-K - Spectrum Brands Holdings, Inc. | hrg-9302014x10xkpressrelea.htm |
4th Quarter Conference Call November 21st, 2014
Agenda Quarterly Overview Philip Falcone, Chairman and Chief Executive Officer Operating Highlights Omar Asali, President and Director Financial Highlights Tom Williams, Executive Vice President and CFO (NYSE: HRG) 2
Safe Harbor Disclaimer 3 Limitations on the Use of Information. This company overview has been prepared by Harbinger Group Inc. (the “Company” or “HGI”) solely for informational purposes, and not for the purpose of updating any information or forecast with respect to the Company or any of its affiliates or any other purpose. This information is subject to change without notice and should not be relied upon for any purpose. Neither the Company nor any of its affiliates makes any representation or warranty, express or implied, as to the accuracy or completeness of the information contained herein and no such party shall have any liability for such information. In furnishing this information and making any oral statements, neither the Company nor any of its affiliates undertakes any obligation to provide the recipient with access to any additional information or to update or correct such information. The information herein or in any oral statements (if any) are prepared as of the date hereof or as of such earlier dates as presented herein; neither the delivery of this document nor any other oral statements regarding the affairs of Company or its affiliates shall create any implication that the information contained herein or the affairs of the Company or its affiliates have not changed since the date hereof or after the dates presented herein (as applicable); that such information is correct as of any time subsequent to its date; or that such information is an indication regarding the performance of the Company or any of its affiliates since the time of the Company’s or such affiliates latest public filings or disclosure. These materials and any related oral statements are not all- inclusive and shall not be construed as legal, tax, investment or any other advice. You should consult your own counsel, accountant or business advisors. Special Note Regarding Forward-Looking Statements. This document contains, and oral statements made by our representatives from time to time may contain, forward-looking statements. Such statements are subject to risks and uncertainties that could cause actual results, events and developments to differ materially from those set forth in or implied by such statements. These statements are based on the beliefs and assumptions of HGI’s management and the management of HGI’s subsidiaries (including target businesses). Generally, forward-looking statements include information concerning possible or assumed future distributions from subsidiaries, future actions, events, results, strategies and expectations and are generally identifiable by use of the words “believes,” “expects,” “intends,” “anticipates,” “plans,” “seeks,” “estimates,” “projects,” “may,” “will” “could,” “might,” or “continues” or similar expressions. Factors that could cause actual results, events and developments to differ include, without limitation: the ability of HGI’s subsidiaries (including, target businesses following their acquisition) to generate sufficient net income and cash flows to make upstream cash distributions, capital market conditions, HGI’s and its subsidiaries’ ability to identify any suitable future acquisition opportunities, efficiencies/cost avoidance, cost savings, income and margins, growth, economies of scale, combined operations, future economic performance, conditions to, and the timetable for, completing the integration of financial reporting of acquired or target businesses with HGI or HGI subsidiaries, completing future acquisitions and dispositions, litigation, potential and contingent liabilities, management’s plans, changes in regulations, taxes and those factors included under the caption “Risk Factors” in HGI’s 2014 Annual Report on Form 10-K and subsequent Quarterly Reports on Form 10-Q. All forward-looking statements described herein are qualified by these cautionary statements and there can be no assurance that the actual results, events or developments referenced herein will occur or be realized. Neither the Company nor any its affiliates undertakes any duty or responsibility to update any of these forward looking statements to reflect events or circumstances after such dates or to reflect actual outcomes. Non-U.S. GAAP Measures. Management believes that certain non-U.S. GAAP financial measures may be useful in certain instances to provide additional meaningful comparisons between current results and results in prior operating periods. Spectrum Brands uses the non-U.S. GAAP financial measures of pro forma net sales, free cash flow and adjusted earnings before interest, taxes, depreciation and amortization (“EBITDA”). Management believes pro forma net sales provides investors useful information regarding the underlying performance of the post-acquisition business operations when compared to the pre- acquisition results of Spectrum Brands and any significant acquired company. Management believes that adjusted EBITDA is significant to gaining an understanding of Spectrum Brands’ results as it is frequently used by the financial community to provide insight into an organization’s operating trends and facilitates comparisons between peer companies, since interest, taxes, depreciation and amortization can differ greatly between organizations as a result of differing capital structures and tax strategies. Adjusted EBITDA can also be a useful measure of a company’s ability to service debt and is one of the measures used for determining Spectrum Brands’ debt covenant compliance. Adjusted EBITDA excludes certain items that are unusual in nature or not comparable from period to period. Management believes that free cash flow is useful to both management and investors in their analysis of the Company’s ability to service and repay its debt and meet its working capital requirements. Free cash flow should not be considered in isolation or as a substitute for pretax income (loss), net income (loss), cash provided by (used in) operating activities or other statement of operations or cash flow statement data prepared in accordance with GAAP or as a measure of profitability or liquidity. In addition, the calculation of free cash flow does not reflect cash used to service debt and therefore, does not reflect funds available for investment or discretionary uses. Insurance AOI is a non-US GAAP financial measure frequently used throughout the insurance industry and an economic measure the Insurance Segment uses to evaluate financial performance for each period. Insurance AOI eliminates (i) the impact of net investment gains, excluding gains and losses on derivatives and including net of other-than-temporary impairment losses recognized in operations, (ii) the net effect of changes in the rates used to discount the FIA embedded derivative liability and (iii) the impact of certain litigation reserves. Insurance AOI should not be used as a substitute for reported net income. However, management believes the adjustments made to net income in order to derive AOI are significant to gaining an understanding of the Insurance Segment’s overall results of operations. Adjusted EBITDA-Energy is a non-US GAAP measure that is widely used by investors, analysts and rating agencies for valuations, peer comparisons and investment recommendations. In addition, these measures are used in covenant calculations required under the Compass Production credit agreement. EBITDA energy represents net income adjusted to exclude interest expense, income taxes and depreciation, depletion and amortization. Adjusted EBITDA-Energy represents EBITDA energy adjusted to exclude non-recurring other operating items, accretion of discount on asset retirement obligations, non-cash changes in the fair value of derivatives, non-cash write downs of assets, and stock based compensation. Management provides the aforementioned information to investors to assist in comparisons of past, present and future operating results and to assist in highlighting the results of on-going operations. While management believes that non-U.S. GAAP measurements are useful supplemental information, such adjusted results are not intended to replace U.S. GAAP financial results and should be read in conjunction with those U.S. GAAP results. By accepting this document, each recipient agrees to and acknowledges the foregoing terms and conditions.
Quarterly Overview Philip Falcone
4th Quarter and Fiscal Year 2014 Summary Another strong quarter and fiscal year for Harbinger Group Inc. Record 4th quarter and full year consolidated revenues —Growth in all segments of the business in 2014 as compared to Fiscal 2013 Completed a number of actions in support of our long-term growth strategy We remain well-positioned to continue delivering growth in free cash flow and book value for the foreseeable future Strong 4th quarter financial performance accompanied by various actions to strengthen the capital structure at Harbinger Group Inc. 5
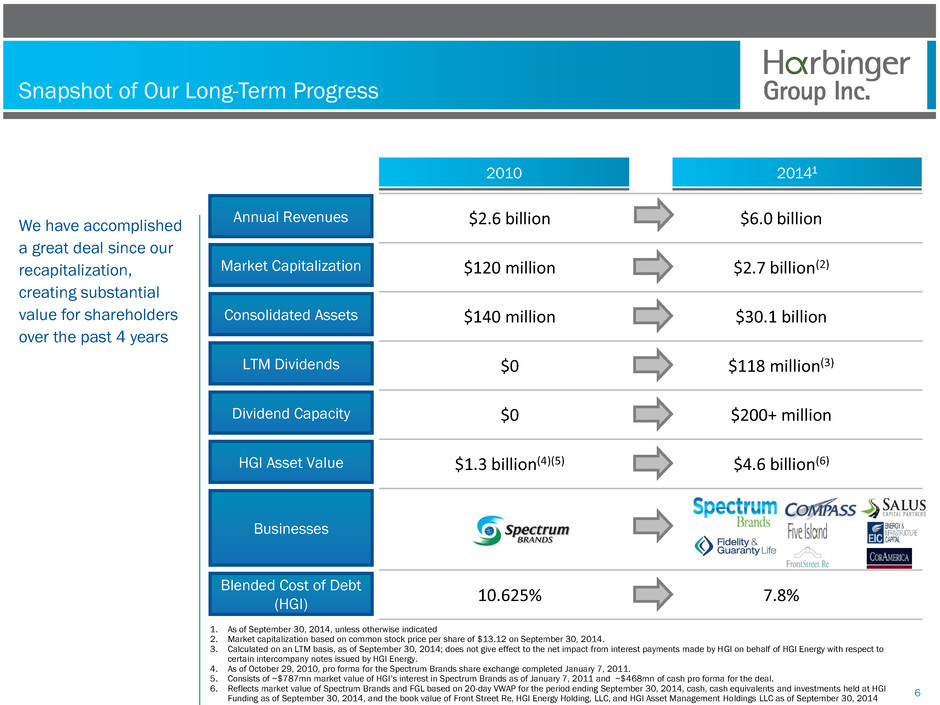
Snapshot of Our Long-Term Progress We have accomplished a great deal since our recapitalization, creating substantial value for shareholders over the past 4 years 6 $2.6 billion $6.0 billion $120 million $2.7 billion(2) $140 million $30.1 billion $0 $118 million(3) $0 $200+ million $1.3 billion(4)(5) $4.6 billion(6) 10.625% 7.8% 2010 20141 Market Capitalization Consolidated Assets LTM Dividends Dividend Capacity HGI Asset Value Blended Cost of Debt (HGI) Businesses 1. As of September 30, 2014, unless otherwise indicated 2. Market capitalization based on common stock price per share of $13.12 on September 30, 2014. 3. Calculated on an LTM basis, as of September 30, 2014; does not give effect to the net impact from interest payments made by HGI on behalf of HGI Energy with respect to certain intercompany notes issued by HGI Energy. 4. As of October 29, 2010, pro forma for the Spectrum Brands share exchange completed January 7, 2011. 5. Consists of ~$787mn market value of HGI’s interest in Spectrum Brands as of January 7, 2011 and ~$468mn of cash pro forma for the deal. 6. Reflects market value of Spectrum Brands and FGL based on 20-day VWAP for the period ending September 30, 2014, cash, cash equivalents and investments held at HGI Funding as of September 30, 2014, and the book value of Front Street Re, HGI Energy Holding, LLC, and HGI Asset Management Holdings LLC as of September 30, 2014 Annual Revenues
Stock Buyback Program We believe HGI’s shares provide an attractive return opportunity — Currently trade at a discount to the sum-of-the-parts valuation We seek to deploy our cash to the highest and best available returns The buyback program is providing incremental value to shareholders beyond the strong appreciation in the price of HRG shares in Fiscal 2014 We have sufficient flexibility under the program to opportunistically support the stock In May, we initiated a $100 million Common Stock buyback program, subject to the discretion of management 7
M&A Multiples continue to be high, mitigating value creation opportunities We will maintain our discipline in this environment and not transact at an uneconomic price Have seen select opportunities to transact; optimistic for more in Fiscal 2015 Recently increased our ownership interest in Compass to 100% Consumer Products tuck-ins, tack-ons HGI is an acquisitive company, pursuing businesses that are either fairly valued or where opportunities for value creation exist 8
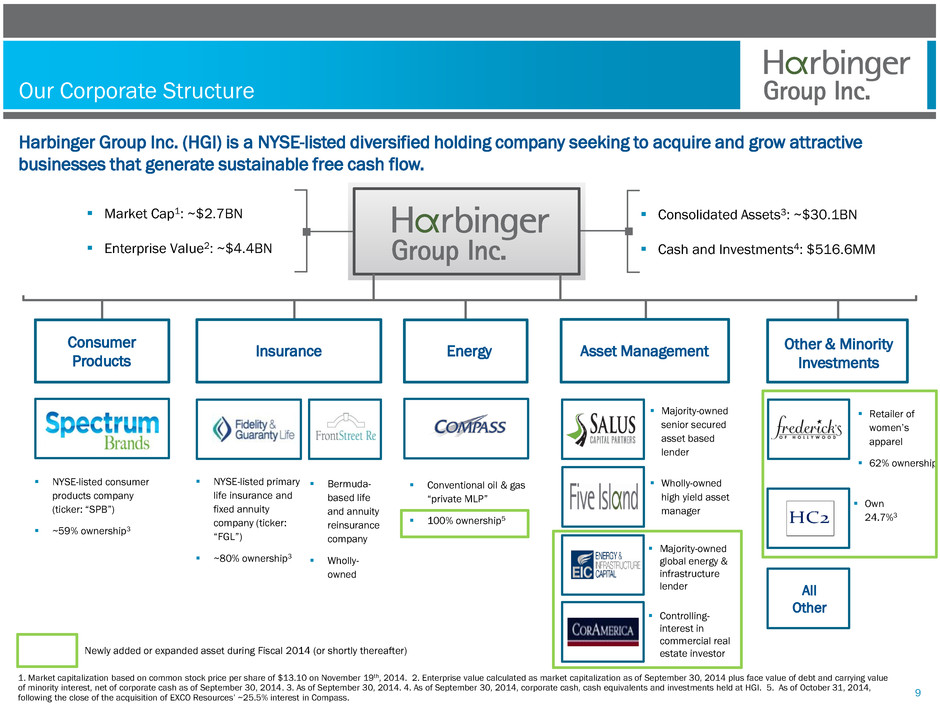
Our Corporate Structure 9 Majority-owned senior secured asset based lender Consumer Products Asset Management Energy Other & Minority Investments Own 24.7%3 Majority-owned global energy & infrastructure lender Insurance All Other Harbinger Group Inc. (HGI) is a NYSE-listed diversified holding company seeking to acquire and grow attractive businesses that generate sustainable free cash flow. NYSE-listed consumer products company (ticker: “SPB”) ~59% ownership3 NYSE-listed primary life insurance and fixed annuity company (ticker: “FGL”) ~80% ownership3 1. Market capitalization based on common stock price per share of $13.10 on November 19th, 2014. 2. Enterprise value calculated as market capitalization as of September 30, 2014 plus face value of debt and carrying value of minority interest, net of corporate cash as of September 30, 2014. 3. As of September 30, 2014. 4. As of September 30, 2014, corporate cash, cash equivalents and investments held at HGI. 5. As of October 31, 2014, following the close of the acquisition of EXCO Resources’ ~25.5% interest in Compass. Bermuda- based life and annuity reinsurance company Wholly- owned Conventional oil & gas “private MLP” 100% ownership5 Controlling- interest in commercial real estate investor Wholly-owned high yield asset manager Retailer of women’s apparel 62% ownership Newly added or expanded asset during Fiscal 2014 (or shortly thereafter) Consolidated Assets3: ~$30.1BN Cash and Investments4: $516.6MM Market Cap1: ~$2.7BN Enterprise Value2: ~$4.4BN
Operational Highlights Omar Asali
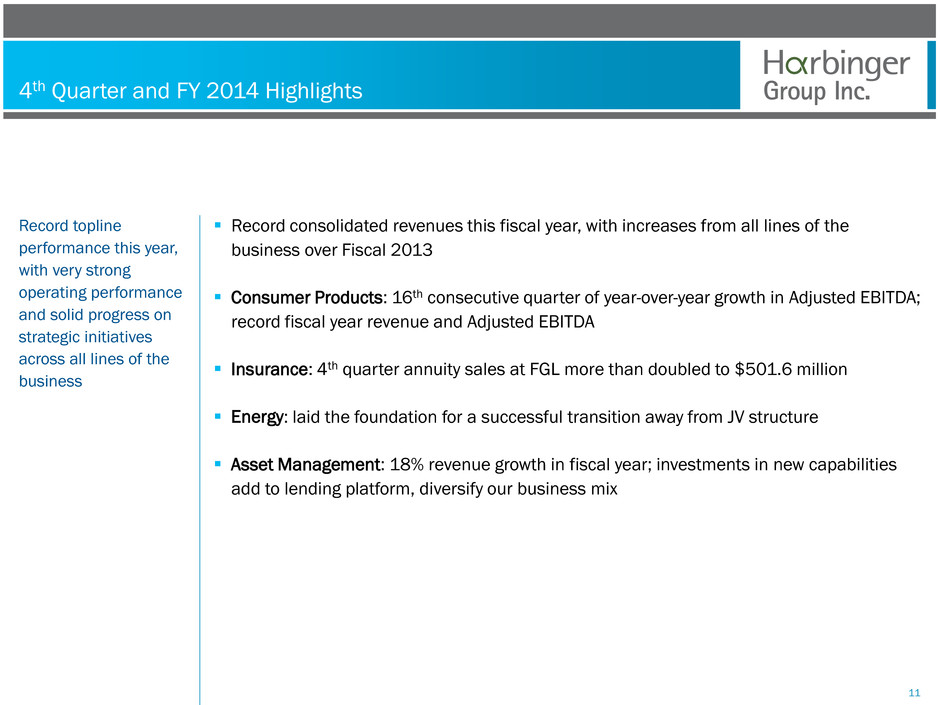
4th Quarter and FY 2014 Highlights Record consolidated revenues this fiscal year, with increases from all lines of the business over Fiscal 2013 Consumer Products: 16th consecutive quarter of year-over-year growth in Adjusted EBITDA; record fiscal year revenue and Adjusted EBITDA Insurance: 4th quarter annuity sales at FGL more than doubled to $501.6 million Energy: laid the foundation for a successful transition away from JV structure Asset Management: 18% revenue growth in fiscal year; investments in new capabilities add to lending platform, diversify our business mix Record topline performance this year, with very strong operating performance and solid progress on strategic initiatives across all lines of the business 11
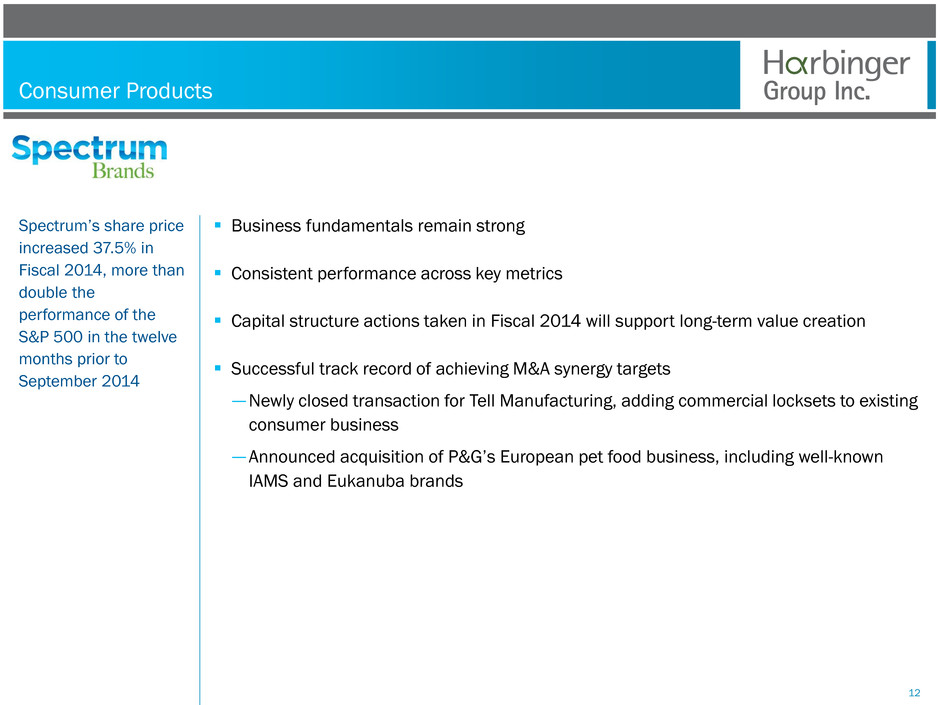
Consumer Products Business fundamentals remain strong Consistent performance across key metrics Capital structure actions taken in Fiscal 2014 will support long-term value creation Successful track record of achieving M&A synergy targets —Newly closed transaction for Tell Manufacturing, adding commercial locksets to existing consumer business —Announced acquisition of P&G’s European pet food business, including well-known IAMS and Eukanuba brands Spectrum’s share price increased 37.5% in Fiscal 2014, more than double the performance of the S&P 500 in the twelve months prior to September 2014 12
Consumer Products Record fiscal year results, with across-the-board increases in: —Revenue —Adjusted EBITDA —Free Cash Flow —EPS 16th consecutive quarter of year-over-year growth in Adjusted EBITDA Continuous cost improvement initiatives will continue to enhance competitiveness, fuel future value Expect another record fiscal year for revenue, Adjusted EBITDA, free cash flow and EPS in 2015 as well 4th Quarter and Fiscal 2014 results for Consumer Products Segment were exceptional and the business is poised to continue building book value for the foreseeable future 13
Insurance Products Fixed annuity sales at FGL increased 91% vs. 4Q14 and 20% vs. 3Q14 —Sales of products launched this past year contributed approximately 35% to total fixed indexed annuity sales this quarter GAAP book value (for FGL) up 46% to $1.7 billion Book value excluding AOCI (for FGL) up 28% to $1.3 billion FGL’s investment portfolio continues to perform very well: —Average yield on assets purchased: 4.92% —Average yield on portfolio: 4.78%, up 20 bps from 4Q13 Key fundamentals in the Insurance Segment remain very healthy and well-positioned for future growth 14
Energy Products Increases in revenue and Adjusted EBITDA compared to Fiscal 2013 4th quarter production levels consistent with last quarter Orienting investments toward higher return re-completions is yielding production benefits Increasing appetite for targeted acquisitions on a cash-flow accretive basis —Valuations may become more attractive as commodity pricing remains low —Certain operators may be looking exit non-core properties or lines of business Operating efficiencies continue under strong leadership Simplified governance and improvements made to operations have set the stage for a strong performance in 2015 Our Energy Segment is comprised of long- lived, lower-decline rate and lower geologic-risk conventional oil and gas assets 15
Asset Management Diversified lending platform that is synergistic with our FGL and FSR operations Limited contributions from the businesses in “start-up” mode in Fiscal 2014: —EIC and CorAmerica have closed on their initial investments —Our initial funding of these businesses completes the 3rd and 4th legs of the stool and will enhance long-term value Salus has originated and serviced more than $800 million in loans to date — Increasing opportunities to provide liquidity to middle-market operators in retail, other attractive verticals —Continues expansion with minimum impairments / full preservation of capital Five Island focused on capital preservation and diversification —Remains well-positioned to capitalize on market opportunities and volatility Revenue in the Asset Management segment increased 18% in Fiscal 2014 as compared to Fiscal 2013 16
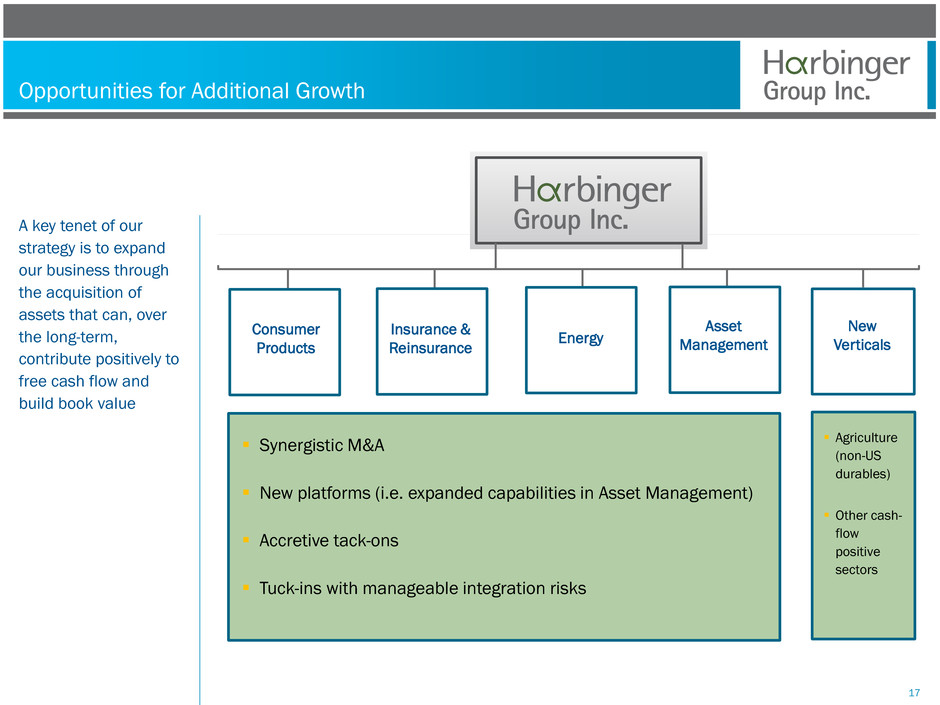
Opportunities for Additional Growth A key tenet of our strategy is to expand our business through the acquisition of assets that can, over the long-term, contribute positively to free cash flow and build book value 17 Consumer Products Asset Management Energy New Verticals Insurance & Reinsurance Synergistic M&A New platforms (i.e. expanded capabilities in Asset Management) Accretive tack-ons Tuck-ins with manageable integration risks Agriculture (non-US durables) Other cash- flow positive sectors
Financial Highlights Tom Williams
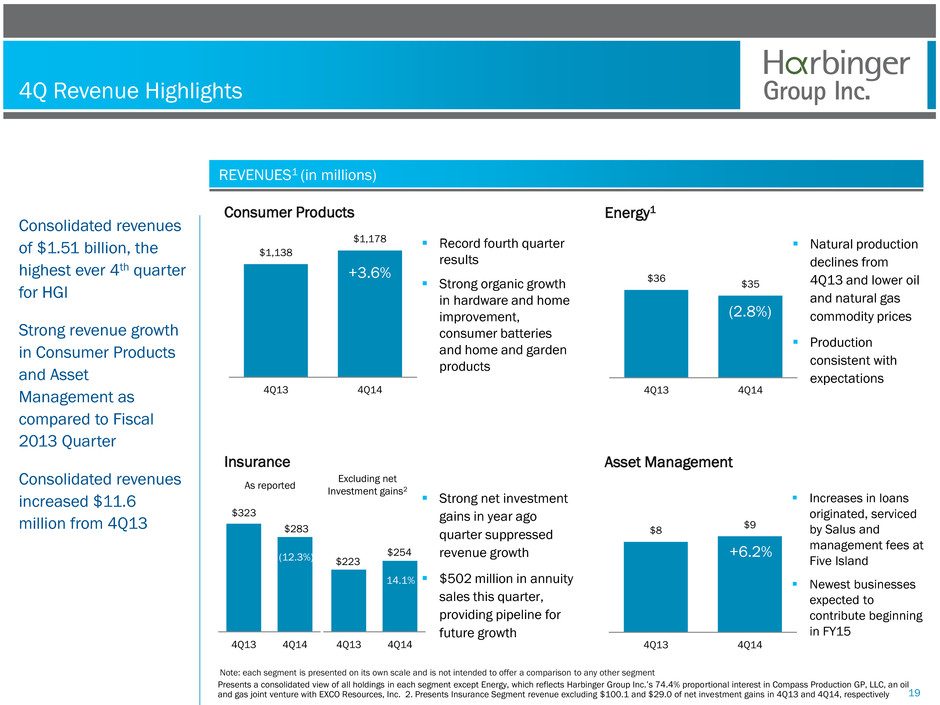
4Q Revenue Highlights Consolidated revenues of $1.51 billion, the highest ever 4th quarter for HGI Strong revenue growth in Consumer Products and Asset Management as compared to Fiscal 2013 Quarter Consolidated revenues increased $11.6 million from 4Q13 19 REVENUES1 (in millions) $1,138 $1,178 4Q13 4Q14 +3.6% 4Q13 4Q14 +3.4% Note: each segment is presented on its own scale and is not intended to offer a comparison to any other segment Consumer Products Insurance (12.3%) $36 $35 4Q13 4Q14 (2.8%) $8 $9 4Q13 4Q14 Energy1 Asset Management +6.2% Record fourth quarter results Strong organic growth in hardware and home improvement, consumer batteries and home and garden products Strong net investment gains in year ago quarter suppressed revenue growth $502 million in annuity sales this quarter, providing pipeline for future growth Natural production declines from 4Q13 and lower oil and natural gas commodity prices Production consistent with expectations Increases in loans originated, serviced by Salus and management fees at Five Island Newest businesses expected to contribute beginning in FY15 Presents a consolidated view of all holdings in each segment except Energy, which reflects Harbinger Group Inc.’s 74.4% proportional interest in Compass Production GP, LLC, an oil and gas joint venture with EXCO Resources, Inc. 2. Presents Insurance Segment revenue excluding $100.1 and $29.0 of net investment gains in 4Q13 and 4Q14, respectively 4Q13 4Q14 As reported Excluding net Investment gains2 $223 $254 14.1% $323 $283
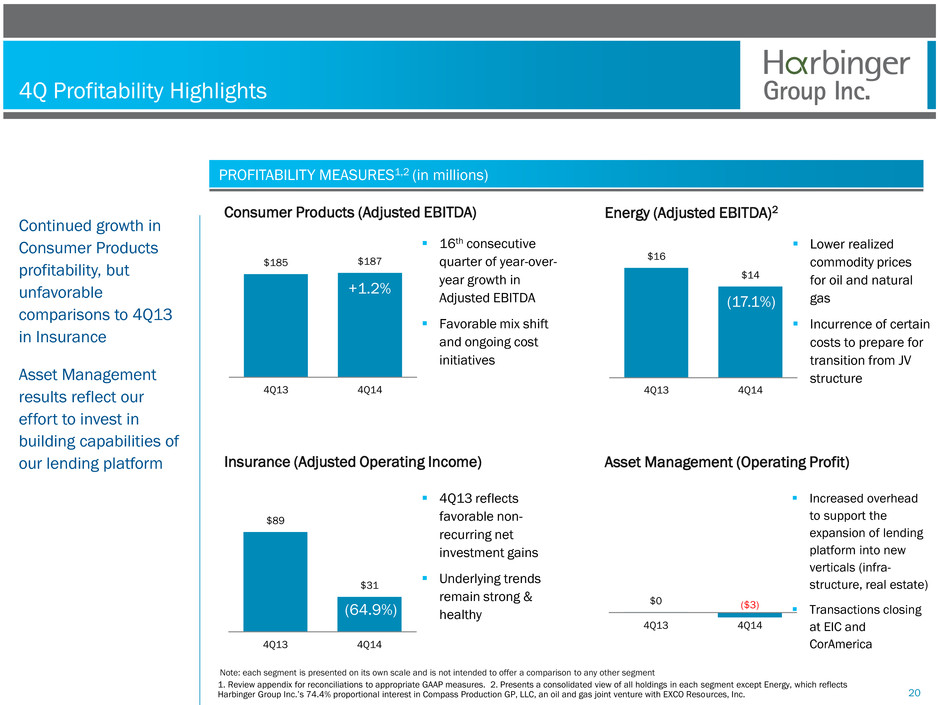
4Q Profitability Highlights Continued growth in Consumer Products profitability, but unfavorable comparisons to 4Q13 in Insurance Asset Management results reflect our effort to invest in building capabilities of our lending platform 20 PROFITABILITY MEASURES1,2 (in millions) $185 $187 4Q13 4Q14 $89 $31 4Q13 4Q14 Consumer Products (Adjusted EBITDA) Insurance (Adjusted Operating Income) $16 $14 4Q13 4Q14 $0 ($3) 4Q13 4Q14 Energy (Adjusted EBITDA)2 Asset Management (Operating Profit) 16th consecutive quarter of year-over- year growth in Adjusted EBITDA Favorable mix shift and ongoing cost initiatives 4Q13 reflects favorable non- recurring net investment gains Underlying trends remain strong & healthy Lower realized commodity prices for oil and natural gas Incurrence of certain costs to prepare for transition from JV structure Note: each segment is presented on its own scale and is not intended to offer a comparison to any other segment 1. Review appendix for reconciliations to appropriate GAAP measures. 2. Presents a consolidated view of all holdings in each segment except Energy, which reflects Harbinger Group Inc.’s 74.4% proportional interest in Compass Production GP, LLC, an oil and gas joint venture with EXCO Resources, Inc. +1.2% (17.1%) (64.9%) Increased overhead to support the expansion of lending platform into new verticals (infra- structure, real estate) Transactions closing at EIC and CorAmerica
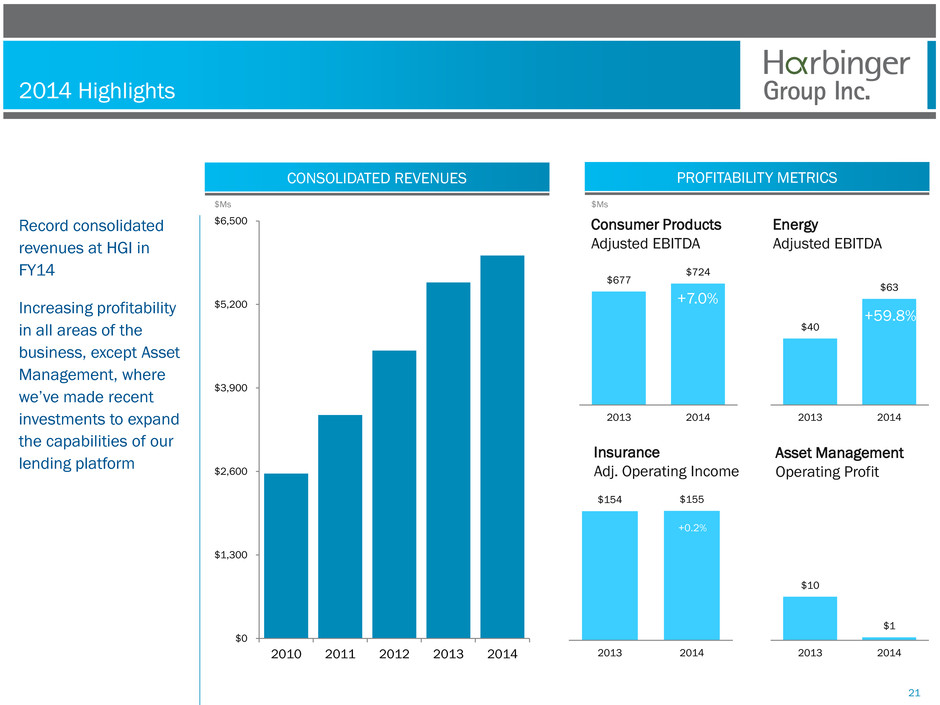
PROFITABILITY METRICS 2014 Highlights Record consolidated revenues at HGI in FY14 Increasing profitability in all areas of the business, except Asset Management, where we’ve made recent investments to expand the capabilities of our lending platform 21 CONSOLIDATED REVENUES $0 $1,300 $2,600 $3,900 $5,200 $6,500 2010 2011 2012 2013 2014 $Ms Consumer Products Adjusted EBITDA Energy Adjusted EBITDA $677 $724 2013 2014 +7.0% $40 $63 2013 2014 +59.8% $154 $155 2013 2014 +0.2% $10 $1 2013 2014 $Ms Insurance Adj. Operating Income Asset Management Operating Profit
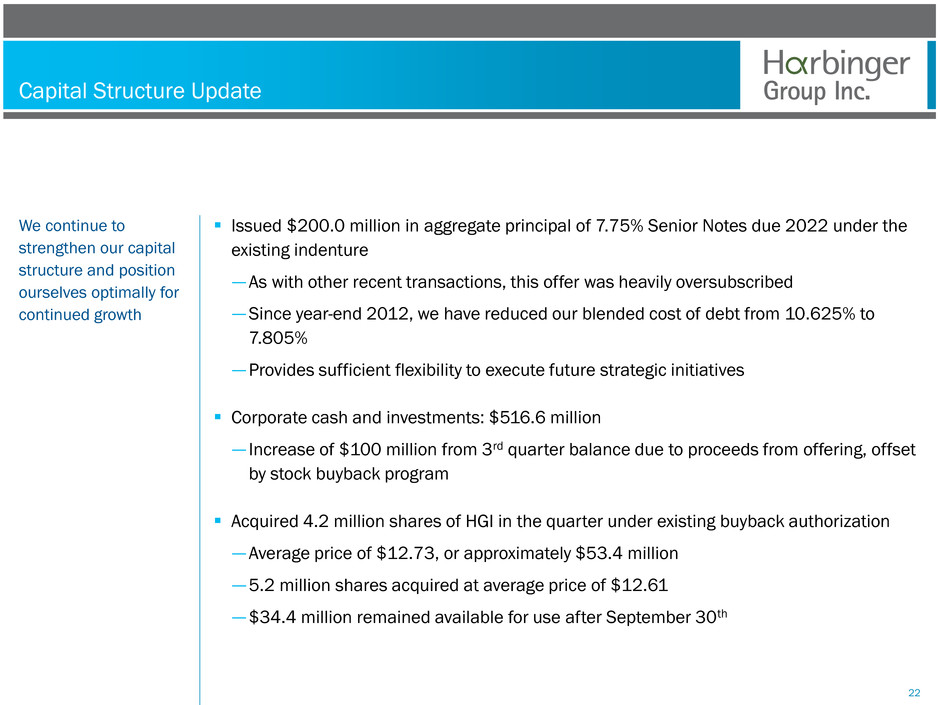
Capital Structure Update Issued $200.0 million in aggregate principal of 7.75% Senior Notes due 2022 under the existing indenture —As with other recent transactions, this offer was heavily oversubscribed —Since year-end 2012, we have reduced our blended cost of debt from 10.625% to 7.805% —Provides sufficient flexibility to execute future strategic initiatives Corporate cash and investments: $516.6 million — Increase of $100 million from 3rd quarter balance due to proceeds from offering, offset by stock buyback program Acquired 4.2 million shares of HGI in the quarter under existing buyback authorization —Average price of $12.73, or approximately $53.4 million —5.2 million shares acquired at average price of $12.61 —$34.4 million remained available for use after September 30th We continue to strengthen our capital structure and position ourselves optimally for continued growth 22
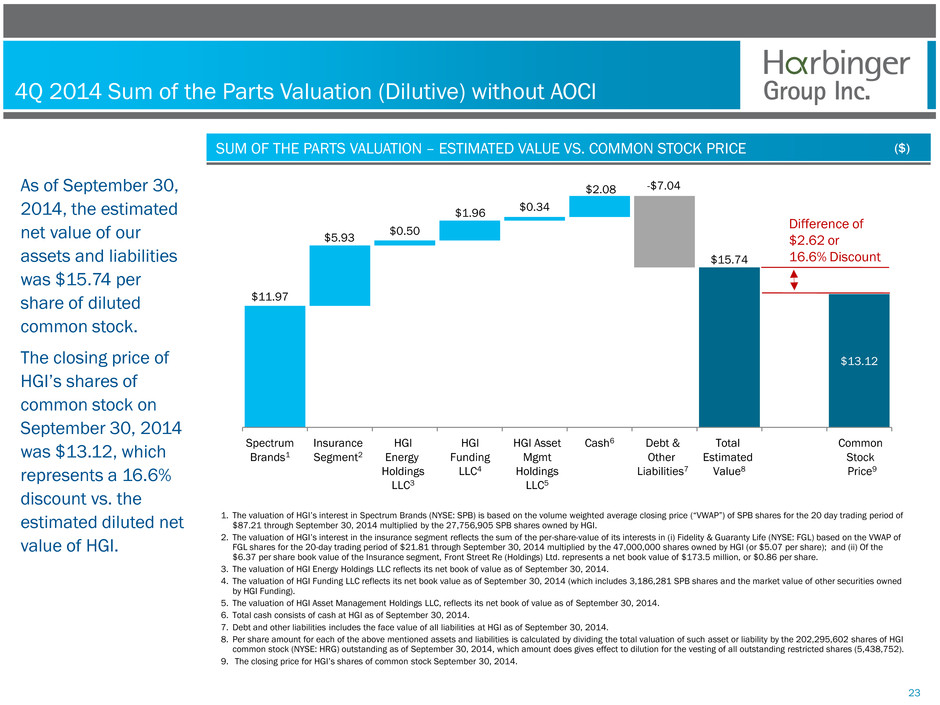
4Q 2014 Sum of the Parts Valuation (Dilutive) without AOCI As of September 30, 2014, the estimated net value of our assets and liabilities was $15.74 per share of diluted common stock. The closing price of HGI’s shares of common stock on September 30, 2014 was $13.12, which represents a 16.6% discount vs. the estimated diluted net value of HGI. SUM OF THE PARTS VALUATION – ESTIMATED VALUE VS. COMMON STOCK PRICE ($) $11.97 $5.93 $0.50 $1.96 $0.34 $2.08 -$7.04 $15.74 $13.12 Difference of $2.62 or 16.6% Discount Spectrum Brands1 Insurance Segment2 Total Estimated Value8 Common Stock Price9 HGI Funding LLC4 HGI Asset Mgmt Holdings LLC5 Cash6 Debt & Other Liabilities7 HGI Energy Holdings LLC3 23 1. The valuation of HGI’s interest in Spectrum Brands (NYSE: SPB) is based on the volume weighted average closing price (“VWAP”) of SPB shares for the 20 day trading period of $87.21 through September 30, 2014 multiplied by the 27,756,905 SPB shares owned by HGI. 2. The valuation of HGI’s interest in the insurance segment reflects the sum of the per-share-value of its interests in (i) Fidelity & Guaranty Life (NYSE: FGL) based on the VWAP of FGL shares for the 20-day trading period of $21.81 through September 30, 2014 multiplied by the 47,000,000 shares owned by HGI (or $5.07 per share); and (ii) Of the $6.37 per share book value of the Insurance segment, Front Street Re (Holdings) Ltd. represents a net book value of $173.5 million, or $0.86 per share. 3. The valuation of HGI Energy Holdings LLC reflects its net book of value as of September 30, 2014. 4. The valuation of HGI Funding LLC reflects its net book value as of September 30, 2014 (which includes 3,186,281 SPB shares and the market value of other securities owned by HGI Funding). 5. The valuation of HGI Asset Management Holdings LLC, reflects its net book of value as of September 30, 2014. 6. Total cash consists of cash at HGI as of September 30, 2014. 7. Debt and other liabilities includes the face value of all liabilities at HGI as of September 30, 2014. 8. Per share amount for each of the above mentioned assets and liabilities is calculated by dividing the total valuation of such asset or liability by the 202,295,602 shares of HGI common stock (NYSE: HRG) outstanding as of September 30, 2014, which amount does gives effect to dilution for the vesting of all outstanding restricted shares (5,438,752). 9. The closing price for HGI’s shares of common stock September 30, 2014.
Conclusion Sustainable Free Cash Flow Generating Assets Strong Management Team Disciplined Acquisition Approach Commitment to Long-term Value Creation 24
Questions and Answers
4th Quarter Conference Call November 21st, 2014
Appendix
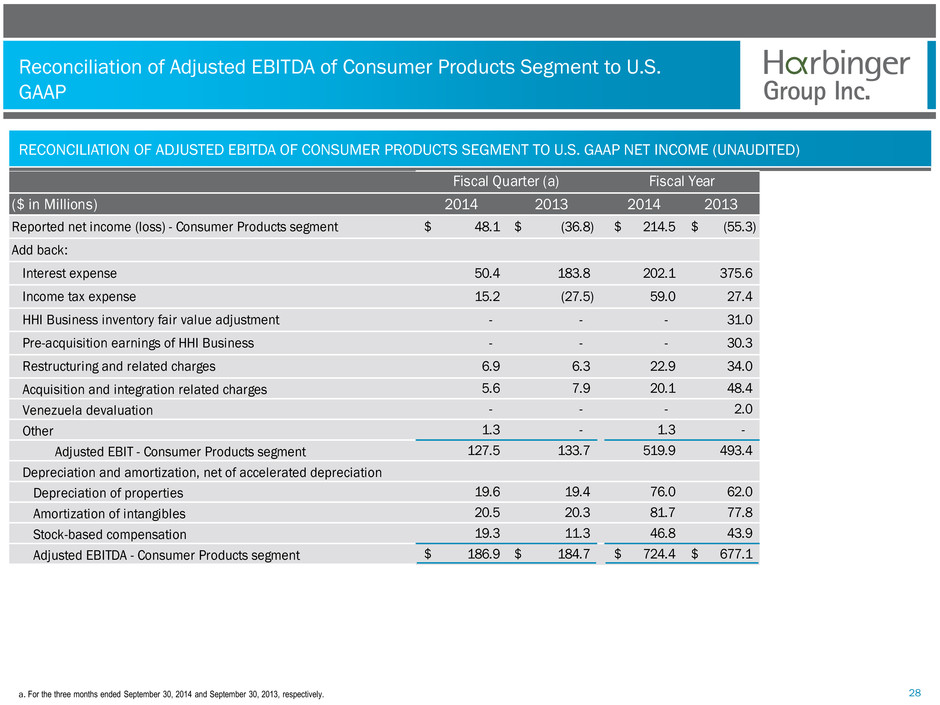
Reconciliation of Adjusted EBITDA of Consumer Products Segment to U.S. GAAP a. For the three months ended September 30, 2014 and September 30, 2013, respectively. RECONCILIATION OF ADJUSTED EBITDA OF CONSUMER PRODUCTS SEGMENT TO U.S. GAAP NET INCOME (UNAUDITED) 28 ($ in Millions) 2014 2013 2014 2013 Reported net income (loss) - Consumer Products segment 48.1$ (36.8)$ 214.5$ (55.3)$ Add back: Interest expense 50.4 183.8 202.1 375.6 Income tax expense 15.2 (27.5) 59.0 27.4 HHI Business inventory fair value adjustment - - - 31.0 Pre-acquisition earnings of HHI Business - - - 30.3 Restructuring and related charges 6.9 6.3 22.9 34.0 Acquisition and integration related charges 5.6 7.9 20.1 48.4 Venezuela d valuation - - - 2.0 Other 1.3 - 1.3 - Adjusted EBIT - Consumer Products segment 127.5 133.7 519.9 493.4 Depreciation and amortization, net of accelerated depreciation Depreciation of properties 19.6 19.4 76.0 62.0 Amortization of intangibles 20.5 20.3 81.7 77.8 Stock-based compensation 19.3 11.3 46.8 43.9 Adjusted EBITDA - Consumer Products segment 186.9$ 184.7$ 724.4$ 677.1$ Fiscal Quarter (a) Fiscal Year
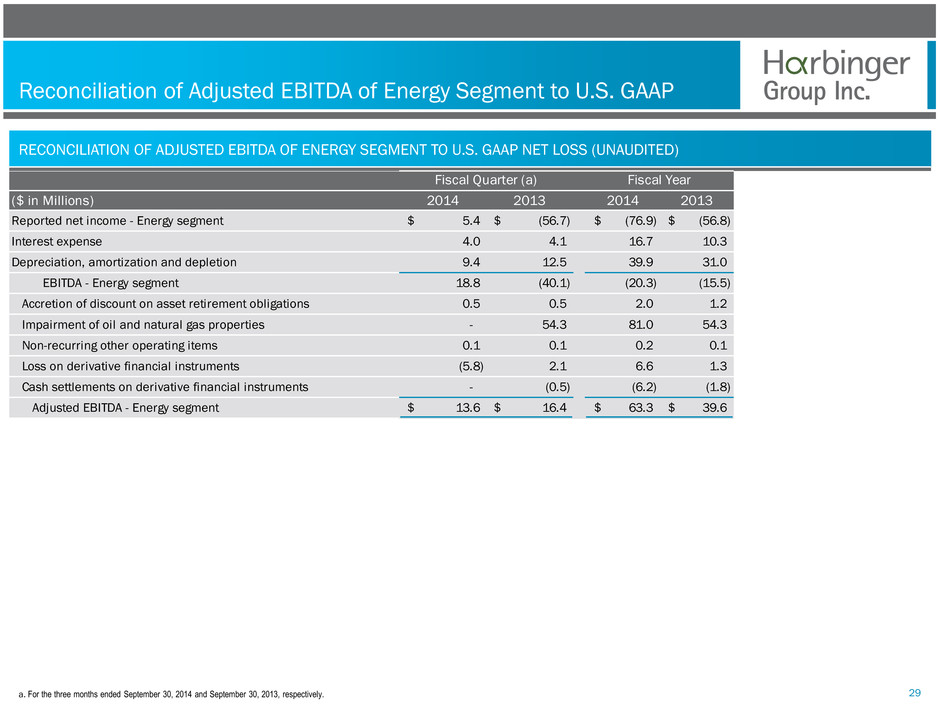
Reconciliation of Adjusted EBITDA of Energy Segment to U.S. GAAP a. For the three months ended September 30, 2014 and September 30, 2013, respectively. RECONCILIATION OF ADJUSTED EBITDA OF ENERGY SEGMENT TO U.S. GAAP NET LOSS (UNAUDITED) 29 ($ in Millions) 2014 2013 2014 2013 Reported net income - Energy segment 5.4$ (56.7)$ (76.9)$ (56.8)$ Interest expense 4.0 4.1 16.7 10.3 Depreciation, amortization and depletion 9.4 12.5 39.9 31.0 EBITDA - Energy segment 18.8 (40.1) (20.3) (15.5) ccretion of discount on asset retirement obligations 0.5 0.5 2.0 1.2 Impairment of oil and natural gas properties - 54.3 81.0 54.3 Non-recurring other operating items 0.1 0.1 0.2 0.1 Loss on derivative financial instruments (5.8) 2.1 6.6 1.3 Cash settlements on derivative financial instruments - (0.5) (6.2) (1.8) Adjusted EBITDA - Energy segment 13.6$ 16.4$ 63.3$ 39.6$ Fiscal Quarter (a) Fiscal Year
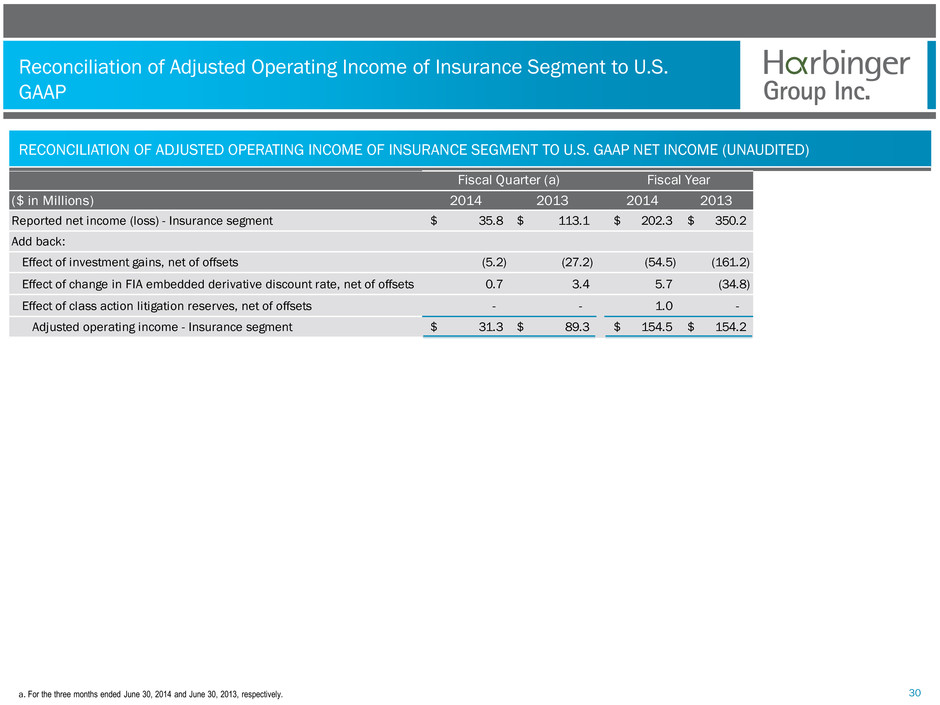
Reconciliation of Adjusted Operating Income of Insurance Segment to U.S. GAAP a. For the three months ended June 30, 2014 and June 30, 2013, respectively. RECONCILIATION OF ADJUSTED OPERATING INCOME OF INSURANCE SEGMENT TO U.S. GAAP NET INCOME (UNAUDITED) 30 ($ in Millions) 2014 2013 2014 2013 Reported net income (loss) - Insurance segment 35.8$ 113.1$ 202.3$ 350.2$ Add back: Effect of investment gains, net of offsets (5.2) (27.2) (54.5) (161.2) Effect of change in FIA embedded derivative discount rate, net of offsets 0.7 3.4 5.7 (34.8) Effect of class action litigation reserves, net of offsets - - 1.0 - Adjusted operating income - Insurance segment 31.3$ 89.3$ 154.5$ 154.2$ Fiscal Quarter (a) Fiscal Year
