Attached files
| file | filename |
|---|---|
| EX-32.1 - RULE 13A-14(B) CERTIFICATION - APOLLO SOLAR ENERGY, INC. | apolloexh321.htm |
| EX-31.1 - RULE 13A-14(A) CERTIFICATION ? CEO - APOLLO SOLAR ENERGY, INC. | apolloexh311.htm |
| EXCEL - IDEA: XBRL DOCUMENT - APOLLO SOLAR ENERGY, INC. | Financial_Report.xls |
UNITED STATES
SECURITIES AND EXCHANGE COMMISSION
Washington, D.C. 20549
FORM 10-Q
|
QUARTERLY REPORT PURSUANT TO SECTION 13 OR 15(d) OF THE SECURITIES EXCHANGE ACT OF 1934.
|
For the quarterly period ended September 30, 2014
|
TRANSITION REPORT PURSUANT TO SECTION 13 OR 15(d) OF THE SECURITIES EXCHANGE ACT OF 1934
|
For the transition period from __________ to ____________
Commission File Number: 000-12122
APOLLO SOLAR ENERGY, INC.
(Exact name of registrant as specified in its charter)
|
(State or other jurisdiction of incorporation or organization)
|
84-0601802
(I.R.S. Employer Identification No.)
|
|
No. 485 Tengfei Third,
Shuangliu Southwest Airport Economic Development Zone,
Shuangliu, Chengdu
People’s Republic of China, 610207
|
|
|
(Address of principal executive offices)
|
|
Registrant’s Telephone Number, Including Area Code: +86 (28) 8562-3888
Indicate by check mark whether the registrant (1) has filed all reports required to be filed by Section 13 or 15(d) of the Securities Exchange Act of 1934 during the preceding 12 months (or for such shorter period that the registrant was required to file such reports), and (2) has been subject to such filing requirements for the past 90 days. Yes ý No o
Indicate by check mark whether the registrant has submitted electronically and posted on its corporate Web site, if any, every Interactive Data File required to be submitted and posted pursuant to Rule 405 of Regulation S-T (§232.405 of this chapter) during the preceding 12 months (or for such shorter period that the registrant was required to submit and post such files). Yes ý No o
Indicate by check mark whether the registrant is a large accelerated filer, an accelerated filer, a non-accelerated filer, or a smaller reporting company. See the definitions of “large accelerated filer,” “accelerated filer” and “smaller reporting company” in Rule 12b-2 of the Exchange Act.
|
Large accelerated filer
|
o
|
Accelerated filer
|
o
|
|
Non-accelerated filer
|
o
|
Smaller reporting company
|
ý
|
| (Do not check if a smaller reporting company) | |||
Indicate by check mark whether the registrant is a shell company (as defined in Rule 12b-2 of the Act). Yes o No ý
There were 50,387,038 shares of common stock outstanding as of November 14, 2014.
APOLLO SOLAR ENERGY, INC.
TABLE OF CONTENTS TO QUARTERLY REPORT ON FORM 10-Q
For the Quarterly Period Ended September 30, 2014
|
ITEM
|
Page
|
|
|
PART I
|
FINANCIAL INFORMATION
|
2
|
|
Item 1.
|
Financial Statements
|
2
|
|
Item 2.
|
Management’s Discussion and Analysis of Financial Condition and Results of Operations
|
15
|
|
Item 3.
|
Quantitative and Qualitative Disclosures About Market Risk
|
20
|
|
Item 4.
|
Controls and Procedures
|
20
|
|
PART II
|
OTHER INFORMATION
|
21
|
|
Item 1.
|
Legal Proceedings
|
21
|
|
Item 1A.
|
Risk Factors
|
21
|
|
Item 6.
|
Exhibits
|
21
|
|
Signatures
|
21
|
1
|
APOLLO SOLAR ENERGY, INC
|
||||||||
|
CONSOLIDATED BALANCE SHEETS
|
||||||||
|
September 30,
2014
|
December 31,
2013
|
|||||||
|
(Unaudited)
|
||||||||
|
ASSETS
|
||||||||
|
Current Assets
|
||||||||
|
Cash
|
$ | 40,837 | $ | 921,197 | ||||
|
Restricted cash
|
1,139,329 | 1,147,224 | ||||||
|
Accounts receivable, net of allowance of $57,952 and $33,443
|
25,164 | 591,209 | ||||||
|
Inventories
|
2,421,829 | 2,602,547 | ||||||
|
Prepaid expenses and other current assets
|
499,385 | 429,599 | ||||||
|
Total Current Assets
|
4,126,544 | 5,691,776 | ||||||
|
Long-term Assets
|
||||||||
|
Property, machinery and mining assets, net
|
15,964,393 | 16,318,045 | ||||||
|
Non-marketable investment
|
56,879 | 57,279 | ||||||
|
Investment in and advances to Joint Venture
|
5,476,078 | 5,634,030 | ||||||
|
Total long-term Assets
|
21,497,350 | 22,009,354 | ||||||
|
Total Assets
|
$ | 25,623,894 | $ | 27,701,130 | ||||
|
LIABILITIES AND SHAREHOLDERS' EQUITY
|
||||||||
|
Current Liabilities
|
||||||||
|
Short-term loans
|
$ | 9,497,026 | $ | 9,236,548 | ||||
|
Account payable - trade
|
265,199 | 648,609 | ||||||
|
Account payable - construction vendors
|
1,157,916 | 1,166,065 | ||||||
|
Accrued expenses and other current liabilities
|
1,929,253 | 1,878,069 | ||||||
|
Due to stockholders and related parties
|
376,639 | 368,344 | ||||||
|
Total Current Liabilities
|
13,226,033 | 13,297,635 | ||||||
|
Long-term liabilities
|
||||||||
|
Convertible loan
|
510,000 | 1,000,000 | ||||||
|
Total liabilities
|
13,736,033 | 14,297,635 | ||||||
|
Stockholders' Equity
|
||||||||
|
Preferred stock:
|
- | - | ||||||
|
$0.001 par value, 25,000,000 shares authorized; 0 shares issued and outstanding as of September 30, 2014 and December 31, 2013
|
||||||||
|
Common stock:
|
52,806 | 52,806 | ||||||
|
$0.001 par value, 100,000,000 shares authorized; 52,805,961 shares issued and 50,387,038 shares outstanding as of September 30, 2014 and December 31, 2013
|
||||||||
|
Additional paid-in capital
|
36,742,099 | 36,742,099 | ||||||
|
Treasury stock 2,418,923 shares at cost
|
(5,216,770 | ) | (5,216,770 | ) | ||||
|
Accumulated deficit
|
(23,321,733 | ) | (21,916,564 | ) | ||||
|
Accumulated other comprehensive income
|
3,631,459 | 3,741,924 | ||||||
|
Total Stockholders' Equity
|
11,887,861 | 13,403,495 | ||||||
|
Total Liabilities and Stockholders' Equity
|
$ | 25,623,894 | $ | 27,701,130 | ||||
See accompanying notes to the consolidated financial statements
2
|
APOLLO SOLAR ENERGY, INC
|
||||||||||||||||
|
CONSOLIDATED STATEMENTS OF COMPREHENSIVE LOSS
|
||||||||||||||||
|
(Unaudited)
|
||||||||||||||||
|
For the Three months
Ended September 30,
|
For the Nine Months
Ended September 30,
|
|||||||||||||||
|
2014
|
2013
|
2014
|
2013
|
|||||||||||||
|
Sales
|
$ | 628,345 | $ | 6,350,549 | $ | 3,549,434 | $ | 13,446,941 | ||||||||
|
Cost of goods sold
|
(517,254 | ) | (6,194,430 | ) | (3,188,560 | ) | (13,025,818 | ) | ||||||||
|
Gross profit
|
111,091 | 156,119 | 360,874 | 421,123 | ||||||||||||
|
Operating expenses:
|
||||||||||||||||
|
General and administrative expenses
|
301,836 | 261,984 | 940,247 | 1,356,631 | ||||||||||||
|
Selling expense
|
30,899 | 54,980 | 101,543 | 189,127 | ||||||||||||
|
Research and development expenses
|
8,144 | 168,731 | 197,947 | 799,414 | ||||||||||||
|
Total operating expenses:
|
340,879 | 485,695 | 1,239,737 | 2,345,172 | ||||||||||||
|
Operating loss
|
(229,788 | ) | (329,576 | ) | (878,863 | ) | (1,924,049 | ) | ||||||||
|
Other income (expense)
|
||||||||||||||||
|
Interest expense, net
|
(153,260 | ) | (141,708 | ) | (449,639 | ) | (561,811 | ) | ||||||||
|
Income(Loss) in equity in Joint Venture
|
(8,887 | ) | (88,805 | ) | (76,667 | ) | (276,344 | ) | ||||||||
|
Total other income(expense)
|
(162,147 | ) | (230,513 | ) | (526,306 | ) | (838,155 | ) | ||||||||
|
Loss before provision for income taxes-continuing operations
|
(391,935 | ) | (560,089 | ) | (1,405,169 | ) | (2,762,204 | ) | ||||||||
|
Provison for income tax
|
- | - | - | - | ||||||||||||
|
Net loss from continued operations
|
(391,935 | ) | (560,089 | ) | (1,405,169 | ) | (2,762,204 | ) | ||||||||
|
Loss from discontinued operations
|
(12,789 | ) | ||||||||||||||
|
Gain on sale of subsidiary
|
- | 598,236 | - | 598,236 | ||||||||||||
|
Net income(loss) from discontinued operations
|
- | 598,236 | - | 585,447 | ||||||||||||
|
Net income(loss)
|
(391,935 | ) | 38,147 | (1,405,169 | ) | (2,176,757 | ) | |||||||||
|
Other comprehensive income(loss)
|
||||||||||||||||
|
Foreign currency translation adjustment
|
3,323 | 34,844 | (110,465 | ) | 395,742 | |||||||||||
|
Comprehensive loss
|
$ | (388,612 | ) | $ | (525,245 | ) | $ | (1,515,634 | ) | $ | (2,366,462 | ) | ||||
|
\
|
||||||||||||||||
|
Loss per share continuing operations
|
||||||||||||||||
|
Basic and diluted
|
$ | (0.01 | ) | $ | (0.01 | ) | $ | (0.03 | ) | $ | (0.06 | ) | ||||
|
Loss per share-discontinued operations
|
||||||||||||||||
|
Basic and diluted
|
$ | - | $ | 0.01 | $ | - | $ | 0.01 | ||||||||
|
Income(loss) per share-total loss
|
$ | (0.01 | ) | $ | 0.00 | $ | (0.03 | ) | $ | (0.05 | ) | |||||
|
Weighted average shares outstanding
|
||||||||||||||||
|
Basic and diluted
|
50,387,038 | 49,377,038 | 50,387,038 | 49,377,038 | ||||||||||||
See accompanying notes to the consolidated financial statements
3
|
APOLLO SOLAR ENERGY, INC
|
||||||||
|
CONSOLIDATED STATEMENTS OF CASH FLOWS
|
||||||||
|
(Unaudited)
|
||||||||
|
For the Nine Months
Ended September 30,
|
||||||||
|
2014
|
2013
|
|||||||
|
Cash flows from operating activities:
|
||||||||
|
Net Loss from continuing operations
|
$ | (1,405,169 | ) | $ | (2,762,204 | ) | ||
|
Net income from discontinued operations
|
- | 585,447 | ||||||
|
Net Loss
|
(1,405,169 | ) | (2,176,757 | ) | ||||
|
Adjustments to reconcile net loss to net cash provided by(used in) operating activities:
|
||||||||
|
Stock-based compensation
|
- | 211,824 | ||||||
|
Loss in equity of Joint Venture
|
76,666 | 276,346 | ||||||
|
Gain on sale of subsidiary
|
- | (598,236 | ) | |||||
|
Depreciation and amortization
|
517,082 | 634,851 | ||||||
|
Disposal of equipment
|
- | 51,289 | ||||||
|
Provision for bad debts
|
59,961 | - | ||||||
|
Changes in operating assets and liabilities:
|
||||||||
|
Restricted cash
|
(122 | ) | - | |||||
|
Accounts receivable
|
502,656 | (370,470 | ) | |||||
|
Inventory
|
162,736 | 504,832 | ||||||
|
Prepaid expenses and other current assets
|
(30,816 | ) | (280,948 | ) | ||||
|
Accounts payable-trade
|
(379,353 | ) | 75,686 | |||||
|
Accrued expenses and other current liabilities
|
63,295 | 99,913 | ||||||
|
Net cash used in continuing operations
|
(433,064 | ) | (1,571,671 | ) | ||||
|
Net cash provided by discontiuned operations
|
- | 63,122 | ||||||
|
Net cash used in operating activities
|
(433,064 | ) | (1,508,549 | ) | ||||
|
Cash flows from investing activities:
|
||||||||
|
Purchase of property and equipment
|
(277,117 | ) | (27,957 | ) | ||||
|
Disposal of property and equipment
|
- | 10,952 | ||||||
|
Proceeds from sale of subsidiary-net of cash sold
|
- | 567,811 | ||||||
|
Net cash provided by(used in) continuing operations
|
(277,117 | ) | 550,806 | |||||
|
Net cash used in discontinuing operations
|
- | (1,153 | ) | |||||
|
Net cash provided by(used in) investing activities
|
(277,117 | ) | 549,653 | |||||
|
Cash flows from financing activities:
|
||||||||
|
Proceeds of short-term loans
|
325,431 | 642,986 | ||||||
|
Repayment to(proceeds of) stockholder loan
|
(19,065 | ) | 63,708 | |||||
|
Due to related parties
|
29,000 | (50,244 | ) | |||||
|
Proceeds(repayment) from convertible loan, net of costs
|
(490,000 | ) | 899,030 | |||||
|
Net cash provided by(used in) continuing operations
|
(154,634 | ) | 1,555,480 | |||||
|
Net cash provided by(used in) discontinuing operations
|
- | - | ||||||
|
Net cash provided by(used in) financing activities
|
(154,634 | ) | 1,555,480 | |||||
|
Effect of exchange rate changes on cash
|
(15,545 | ) | 37,716 | |||||
|
Net increase(decrease) in cash
|
(880,360 | ) | 634,300 | |||||
|
Cash at beginning of period
|
921,197 | 935,750 | ||||||
|
Cash at end of period
|
$ | 40,837 | $ | 1,570,050 | ||||
|
Supplemental disclosure of cash flow information
|
||||||||
|
Income tax paid in cash
|
$ | - | $ | - | ||||
|
Interest paid
|
$ | 459,299 | $ | 544,893 | ||||
See accompanying notes to the consolidated financial statements
4
APOLLO SOLAR ENERGY, INC.
NOTES TO CONSOLIDATED FINANCIAL STATEMENTS
FOR THE NINE MONTHS ENDED SEPTEMBER 30, 2014
(Unaudited)
NOTE 1. BASIS OF PRESENTATION
The accompanying unaudited consolidated financial statements of Apollo Solar Energy, Inc. (the “Company) reflect all material adjustments consisting of only normal recurring adjustments which, in the opinion of management, are necessary for a fair presentation of results for the interim periods. Certain information and footnote disclosures required under accounting principles generally accepted in the United States of America have been condensed or omitted pursuant to the rules and regulations of the Securities and Exchange Commission, although the Company believes that the disclosures are adequate to make the information presented not misleading. These consolidated financial statements should be read in conjunction with the consolidated financial statements and notes thereto included in the Company’s Annual Report on Form 10-K for the year ended December 31, 2013 as filed with the Securities and Exchange Commission.
The results of operations for the three and nine months ended September 30, 2014 are not necessarily indicative of the results to be expected for the entire year or for any future period.
The Company’s functional currency is the Chinese Renminbi (“RMB”); however, the accompanying financial statements have been translated and presented in United States Dollars (“USD”).
The consolidated financial statements include the accounts of the Company and its subsidiaries. All intercompany transactions and accounts have been eliminated in consolidation.
NOTE 2. GOING CONCERN
The accompanying financial statements have been prepared assuming that the Company will continue as a going concern. As shown in the accompanying financial statements, the Company has negative working capital of $9,099,489 at September 30, 2014, and has had operating losses during past two years. These circumstances, among others, raise substantial doubt about the Company’s ability to continue as a going concern. The financial statements do not include any adjustments that might result from the outcome of this uncertainty.
Management plans to increase its marketing in order to generate more revenues and to reduce certain other operating expenses. Therefore, for our next fiscal year, we anticipate our cash flow from operations to improve. Nevertheless, the Company anticipates that its current cash position will be insufficient to support the Company's operations at current capacity for the next twelve month period and, therefore, will need to seek additional financing to support its operations. We may rely on bank borrowing as well as capital issuances and loans from existing shareholders. We are actively exploring various proposals and alternatives in order to secure sources of financing and improve our financial position. We may raise such additional capital through the issuance of our equity securities, which may result in significant dilution to our current investors. We are also exploring potential strategic partnerships, which could provide a capital infusion to the Company.
NOTE 3. SUMMARY OF SIGNIFICANT ACCOUNTING
Use of Estimates
The preparation of the financial statements in conformity with Generally Accepted Accounting Principles (“GAAP”) requires management to make estimates and assumptions that affect the reported amounts of assets and liabilities and disclosure of contingent assets and liabilities at the dates of the financial statements and the reported amounts of revenue and expenses during the reporting periods. Actual results could differ from those estimates. These estimates and assumptions include valuing equity securities issued in share based payment arrangements, determining the fair value of our common stock, the collectability of accounts receivable and deferred taxes and related valuation allowances. Certain of our estimates, including evaluating the collectability of accounts receivable, could be affected by external conditions, including those unique to our industry, and general economic conditions. It is possible that these external factors could have an effect on our estimates that could cause actual results to differ from our estimates. We re-evaluate all of our accounting estimates at least quarterly based on these conditions and record adjustments when necessary.
5
APOLLO SOLAR ENERGY, INC.
NOTES TO CONSOLIDATED FINANCIAL STATEMENTS
FOR THE NINE MONTHS ENDED SEPTEMBER 30, 2014
(Unaudited)
NOTE 3. SUMMARY OF SIGNIFICANT ACCOUNTING (Continued)
Restricted cash
Restricted cash is related to deposits required by bank for banker’s acceptance notes and loans.
Deferred income taxes
We use the asset and liability method of accounting for income taxes in accordance with ASC Topic 740, “Income Taxes.” Under this method, income tax expense is recognized for the amount of: (i) taxes payable or refundable for the current year and (ii) deferred tax consequences of temporary differences resulting from matters that have been recognized in an entity’s financial statements or tax returns. Deferred tax assets and liabilities are measured using enacted tax rates expected to apply to taxable income in the years in which those temporary differences are expected to be recovered or settled. The effect on deferred tax assets and liabilities of a change in tax rates is recognized in the results of operations in the period that includes the enactment date. A valuation allowance is provided to reduce the deferred tax assets reported if based on the weight of the available positive and negative evidence, it is more likely than not some portion or all of the deferred tax assets will not be realized.
ASC Topic 740.10.30 clarifies the accounting for uncertainty in income taxes recognized in an enterprise’s financial statements and prescribes a recognition threshold and measurement attribute for the financial statement recognition and measurement of a tax position taken or expected to be taken in a tax return. ASC Topic 740.10.40 provides guidance on derecognition, classification, interest and penalties, accounting in interim periods, disclosure, and transition. We have no material uncertain tax positions for any of the reporting periods presented.
Currency translation
Since the Company operates in the PRC, the Company’s functional currency is the RMB. Revenue and expense accounts are translated at the average rates during the period, and assets and liabilities are translated at year-end rates and equity accounts are translated at historical rate. Translation adjustments arising from the use of different exchange rates from period to period are included as a component of stockholders’ equity. Gains and losses from foreign currency transactions are recognized in current operations.
Fair value of financial instruments
We have adopted the provisions of ASC Topic 820, “Fair Value Measurements and Disclosures”, which defines fair value as used in numerous accounting pronouncements, establishes a framework for measuring fair value and expands disclosure of fair value measurements.
The estimated fair value of certain financial instruments, including cash and cash equivalents, accounts receivable, accounts payable and accrued expenses are carried at historical cost basis, which approximates fair values because of the short-term maturing of these instruments. The carrying amounts of our short and long term credit obligations approximate fair value because the effective yields on these obligations, which include contractual interest rates which are comparable to rates of returns for instruments of similar credit risk and because of the short term maturity of these instruments.
6
APOLLO SOLAR ENERGY, INC.
NOTES TO CONSOLIDATED FINANCIAL STATEMENTS
FOR THE NINE MONTHS ENDED SEPTEMBER 30, 2014
(Unaudited)
NOTE 3. SUMMARY OF SIGNIFICANT ACCOUNTING (Continued)
ASC 820 defines fair value as the exchange price that would be received for an asset or paid to transfer a liability (an exit price) in the principal or most advantageous market for the asset or liability in an orderly transaction between market participants on the measurement date. ASC 820 also establishes a fair value hierarchy, which requires an entity to maximize the use of observable inputs and minimize the use of unobservable inputs when measuring fair value. ASC 820 describes three levels of inputs that may be used to measure fair value:
Level 1 – quoted prices in active markets for identical assets or liabilities.
Level 2 – quoted prices for similar assets and liabilities in active markets or inputs that are observable
Level 3 – inputs that are unobservable (for example cash flow modeling inputs based on assumptions)
We have no financial assets or liabilities measured at fair value on a recurring basis.
Segment reporting
The Company is using “management approach” model for segment reporting. The management approach model is based on the way a company’s management organized segments within the company for making operating decisions and assessing performance. Reportable segments are based on products and services, geography, legal structure, management structure, or any other manner in which management disaggregates a company.
Revenue recognition
Revenue is recognized at the date of shipment to customers when a formal arrangement exists, the price is fixed or determinable, the delivery is completed, no other significant obligations of the Company exist, and collectability is reasonably assured. Payments received before all of the relevant criteria for revenue recognition are satisfied are recorded as advances from customers. No revenues have been recognized in the mining segment or manufacturing segment.
Research and development
Research and development expenditures are charged to operations as incurred, net with any government grant for specific research projects. Research and development expenditures were $589,203, less $391,256 of government grant received in the nine months ended September 30, 2014.
Loss per share
Basic losses per share are computed by dividing losses available to common shareholders by the weighted-average number of common shares outstanding during the period. Diluted losses per share are computed similar to basic earnings per share, except that the denominator is increased to include the number of additional common shares that would have been outstanding if the potential common shares had been issued and if the additional common shares were dilutive. As a result of the net loss in 2014 and 2013, the calculation of diluted loss per share does not include the dilutive effect to stock options.
NOTE 4. INVENTORIES
Inventories are valued at the lower of cost or net realizable value with cost determined on the weighted-average method. Work in progress and finished goods are composed of direct material, direct labor and a portion of manufacturing overhead. Net realizable value is the estimated selling price in the ordinary course of business, less estimated costs to complete and dispose. There is no inventory mark-down for the years ended September 30, 2014 and 2013, respectively.
7
APOLLO SOLAR ENERGY, INC.
NOTES TO CONSOLIDATED FINANCIAL STATEMENTS
FOR THE NINE MONTHS ENDED SEPTEMBER 30, 2014
(Unaudited)
NOTE 4. INVENTORIES (continued)
Inventories consist of the following:
|
September 30,
2014
|
December 31,
2013
|
|||||||
|
Raw Materials
|
$
|
442,126
|
$
|
693,065
|
||||
|
Work-in-progress
|
711,217
|
698,020
|
||||||
|
Finished goods
|
1,268,486
|
1,211,462
|
||||||
|
Total
|
$
|
2,421,829
|
$
|
2,602,547
|
||||
Prepaid expenses and other current assets consist following:
|
September 30,
2014
|
December 31,
2013
|
|||||||
|
Advances for purchases
|
$
|
328,719
|
$
|
283,112
|
||||
|
Other receivables
|
170,666
|
146,487
|
||||||
|
Total
|
$
|
499,385
|
$
|
429,599
|
||||
NOTE 6. RELATED PARTIES TRANSACTIONS AND BALANCES
The breakdown of due from/due to related parties consists of the following:
|
September 30,
2014
|
December 31,
2013
|
|||||||
|
Due from Xinju
|
$
|
(39,220
|
)
|
$
|
(39,495
|
)
|
||
|
Due to shareholders and related parties
|
415,859
|
407,839
|
||||||
|
Total
|
$
|
376,639
|
$
|
368,344
|
||||
Due to shareholders and due from Xinju are non-interest bearing and due on demand.
Xinju is a related company partially owned by the second largest shareholder of the Company.
NOTE 7. EQUITY METHOD INVESTMENT IN JOINT VENTURE
On November 9, 2009, Sichuan Apollo Solar Science & Technology Co. Ltd. (“Sichuan Apollo”), a wholly-owned foreign subsidiary of the Company, entered into a joint venture agreement (the “Agreement”) with Bengbu Design & Research Institute for Glass Industry (“Bengbu”) and a local Chinese government agency (the “Agency”). The Joint Venture (“JV”) was formed to conduct research and development related to glass used in the production of thin film solar cells and manufacture thin film solar cells. Under the terms of the agreement, Benghu and the Agency own an aggregate of 65% of the JV and Sichuan Apollo owns the remaining 35%. The Company accounts for this investment under the equity method of accounting.
8
APOLLO SOLAR ENERGY, INC.
NOTES TO CONSOLIDATED FINANCIAL STATEMENTS
FOR THE NINE MONTHS ENDED SEPTEMBER 30, 2014
(Unaudited)
NOTE 7. EQUITY METHOD INVESTMENT IN JOINT VENTURE (continued)
Summarized financial information for our investment in the JV assuming a 100% ownership interest is as follows:
|
September 30,
2014
|
September 30,
2013
|
|||||||
|
Statement of operations
|
||||||||
|
Revenues
|
$
|
23,106
|
$
|
25,628
|
||||
|
Cost of sales
|
47,651
|
54,367
|
||||||
|
Gross profit
|
(24,545)
|
(28,739)
|
||||||
|
Operating Loss
|
(212,047)
|
(789,550)
|
||||||
|
Loss before income tax
|
(219,047)
|
(789,550)
|
||||||
NOTE 8. ACCRUED EXPENSES, TAXES AND OTHER CURRENT LIABILITIES
Accrued expenses, taxes and other current liabilities are listed as below:
|
September 30,
2014
|
December 31,
2013
|
|||||||
|
Accrued interest
|
$
|
847,260
|
$
|
875,842
|
||||
|
Salaries and benefits
|
215,440
|
201,616
|
||||||
|
Other taxes
|
495,673
|
461,466
|
||||||
|
Professional fees
|
11,735
|
67,563
|
||||||
|
Customer deposit
|
119,475
|
-
|
||||||
|
Other payables
|
239,670
|
271,582
|
||||||
|
Total
|
$
|
1,929,253
|
$
|
1,878,069
|
||||
9
APOLLO SOLAR ENERGY, INC.
NOTES TO CONSOLIDATED FINANCIAL STATEMENTS
FOR THE NINE MONTHS ENDED SEPTEMBER 30, 2014
(Unaudited)
NOTE 9. SHORT-TERM LOAN
Short-term loans consist of the following loans:
|
September 30,
2014
|
December 31,
2013
|
|||||||
|
1) Loan payable to Chengdu Xihang Gang Construction & Investment Co., Ltd. due on demand, collateralized by certain plant equipment of Sichuan Apollo
|
$
|
671,174
|
$
|
675,897
|
||||
|
2) Loans payable to Industrial and Commercial Bank of China, Due on November 12 and 25, 2014, and December 12, 2014, with interest of 6.00% per annum, respectively, collateralized by cash deposits of RMB 7 million($1.13 million) with a year term in Industrial and Commercial Bank of China and Sichuan Apollo’s land and buildings. The loan due on November 12, 2014 was paid off in November 2014.
|
3,461,500
|
3,485,861
|
||||||
|
3) Loan payable to Bank of China, Xihanggang Branch, Chengdu, due on September 20, 2013, collateralized by cash deposit of RMB 10,000 with a year term in Bank of China. The loan was paid off in October 2014.
|
1,463
|
1,473
|
||||||
|
4) Loan payable to an unrelated party, with interest of 10% per annum, collateralized by 1,000,000 shares of common stock and due on March 30, 2014. The loan is in default. The lender verbally agreed to extend the due date to September 30, 2014. As of the date of the report, the Company has not paid off the loan.
|
162,512
|
163,655
|
||||||
|
5) Loan payable to China CITIC Bank, due on April 18 and 22, 2014, with interest at 7.5% per annum, collateralized by land and buildings of Sichuan Apollo. The loans were paid in April 2014.
|
-
|
4,909,662
|
||||||
|
6)Loan payable to an unrelated party, bearing no interest and due on February 7, 2015
|
325,024
|
|||||||
|
7) Loan payable to China CITIC Bank, due on April 8, 2015, with interest at 7.5% per annum, collateralized by land and buildings of Sichuan Apollo
|
4,875,353
|
-
|
||||||
|
Total
|
$
|
9,497,026
|
$
|
9,236,548
|
||||
10
APOLLO SOLAR ENERGY, INC.
NOTES TO CONSOLIDATED FINANCIAL STATEMENTS
FOR THE NINE MONTHS ENDED SEPTEMBER 30, 2014
(Unaudited)
NOTE 10. CONVERTIBLE LOAN
On October 31, 2012, the Company entered into a Loan Agreement with Golden Bridge Education Inc., pursuant to which the Company could borrow up to $500,000. This loan has an annual interest rate of 10% and a term of 5 years. The loan is collateralized by 2% of the ownership of the Joint Venture referred to in Note 7.
On March 28, 2013, the Company entered into another loan Agreement with Golden Bridge Education Inc., pursuant to which the Company was entitled to borrow up to $500,000. Pursuant to the Agreement, the loan has an annual interest rate of 10% and a term of 5 years. The Company is required to pay $12,500 of interest every three months. The lender has an option to convert the loan balance into the Company’s common stock before the loan agreement has expired.
Both loans were subordinated to the bank loan and was a senior loan to all other liabilities. The purpose of the loan is to purchase raw materials. During March 2014, the Company paid $490,000 of the principal. As of September 30, 2014, the balance of the loan was $510,000.
The Company evaluated the conversion option of these loans and determined that they do not contain an embedded derivative instrument, or beneficial conversion feature.
NOTE 11. TAXES
Corporation income tax
The Company is incorporated in the United States of America and is subject to United States federal taxation. No provisions for income taxes have been made, as the Company had no U.S. taxable income for the three and nine months ended September 30, 2014 and 2013.
The Company’s Chinese subsidiaries are governed by the Income Tax Law of the PRC concerning the privately run and foreign invested enterprises, which are generally subject to tax at a statutory rate of 25% on income reported in the statutory financial statements after appropriate tax adjustments.
Based on management's present assessment, the Company has determined that it is more likely than not a deferred tax asset attributable to the future utilization of the net operating loss carry-forward as of September 30, 2014 will not be realized. Accordingly, the Company has provided a 100% allowance against the deferred tax asset in the financial statements at September 30, 2014. The Company will continue to review this valuation allowance and make adjustments as appropriate.
The Company has net operating loss carry-forwards in China and United States of approximately $3,000,000 and $8,000,000, respectively, which expire between 2014 and 2024. The Company has a deferred tax asset resulting from the tax loss carry-forwards of approximately $3,000,000 for which the Company has provided a 100% valuation allowance.
The reconciliation of income tax expense at the U.S. statutory rate of 35% in, to the Company’s effective tax is as follows:
|
Nine months Ended September 30,
|
||||||||
|
Taxes
|
2014
|
2013
|
||||||
|
U.S. Statutory rate of 35%
|
$
|
(491,807
|
)
|
$
|
(761,865) | |||
|
Tax rate difference between China and U.S.
|
133,074
|
189,059
|
||||||
|
Change in valuation allowance
|
77,017
|
521,625
|
||||||
|
Net operating loss expired
|
281,716
|
200,741 | ||||||
|
Permanent difference
|
-
|
(149,560) | ||||||
|
Effective tax
|
$
|
-
|
$
|
- | ||||
11
APOLLO SOLAR ENERGY, INC.
NOTES TO CONSOLIDATED FINANCIAL STATEMENTS
FOR THE NINE MONTHS ENDED SEPTEMBER 30, 2014
(Unaudited)
NOTE 11. TAXES (continued)
The provisions for income taxes are summarized as follows:
|
Nine months Ended September 30,
|
||||||||
|
2014
|
2013
|
|||||||
|
Current
|
$
|
-
|
$
|
-
|
||||
|
Deferred
|
-
|
-
|
||||||
|
Total
|
$
|
-
|
$
|
-
|
||||
Value added tax (“VAT”)
Enterprises or individuals who sell commodities, engage in repair and maintenance or import or export goods in the PRC are subject to a value added tax in accordance with the PRC laws. The value added tax standard rate is 17% of the gross sales price. A credit is available whereby VAT paid on the purchases of semi-finished products or raw materials used in the production of the Company’s finished products can be used to offset the VAT due on the sales of the finished products.
NOTE 12. PRC STATUTORY RESERVES
In accordance with the PRC Companies Law, the Company was required to transfer 10% of its profit after tax, as determined in accordance with accounting standards and regulations of the PRC, to the statutory surplus reserve. The statutory surplus reserve is non-distributable. As of September 30, 2014 and December 31, 2013, the Company did not accumulate any statutory reserve due to the accumulated deficit.
NOTE 13. BUSINESS SEGMENTS
For the nine months ended September 30, 2014
|
Manufacturing
|
Refining
|
Mining
|
Corporate &
Others
|
Consolidated
Total
|
||||||||||||||||
|
Revenue
|
$ | 279 | $ | 3,549,155 | $ | - | $ | - | $ | 3,549,434 | ||||||||||
|
Operating loss
|
$ | (313,834 | ) | $ | (386,260 | ) | $ | (118,051 | ) | $ | (60,718 | ) | $ | (878,863 | ) | |||||
|
Depreciation and amortization
|
$ | 349,128 | $ | 149,868 | $ | 18,086 | $ | - | $ | 517,082 | ||||||||||
|
Capital expenditures
|
$ | 243,937 | $ | 33,180 | $ | - | $ | - | $ | 277,117 | ||||||||||
For the nine months ended September 30, 2013
|
Manufacturing
|
Refining
|
Mining
|
Corporate &
Others
|
Consolidated
Total
|
||||||||||||||||
|
Revenue
|
$
|
-
|
$
|
13,446,941
|
$
|
-
|
$
|
-
|
$
|
13,446,941
|
||||||||||
|
Operating loss
|
$
|
(422,212
|
)
|
$
|
(1,105,719
|
)
|
$
|
(144,374
|
)
|
$
|
(251,744
|
)
|
$
|
(1,924,049
|
)
|
|||||
|
Depreciation and amortization
|
$
|
488,181
|
$
|
123,980
|
$
|
22,690
|
$
|
-
|
$
|
634,851
|
||||||||||
|
Capital expenditures
|
$
|
-
|
$
|
26,804
|
$
|
-
|
$
|
-
|
$
|
26,804
|
||||||||||
12
APOLLO SOLAR ENERGY, INC.
NOTES TO CONSOLIDATED FINANCIAL STATEMENTS
FOR THE NINE MONTHS ENDED SEPTEMBER 30, 2014
(Unaudited)
NOTE 13. BUSINESS SEGMENTS (continued)
For the three months ended September 30, 2014
|
Manufacturing
|
Refining
|
Mining
|
Corporate &
Others
|
Consolidated
Total
|
||||||||||||||||
|
Revenue
|
$
|
-
|
$
|
628,345
|
$
|
-
|
$
|
-
|
$
|
628,345
|
||||||||||
|
Operating loss
|
$
|
(166,144)
|
$
|
21,823
|
$
|
(52,779)
|
$
|
(32,688)
|
$
|
(229,788)
|
||||||||||
|
Depreciation and amortization
|
$
|
116,409
|
$
|
50,505
|
$
|
5,906
|
$
|
-
|
$
|
172,820
|
||||||||||
|
Capital expenditures
|
$
|
-
|
$
|
-
|
$
|
-
|
$
|
-
|
$
|
-
|
||||||||||
For the three months ended September 30, 2013
|
Manufacturing
|
Refining
|
Mining
|
Corporate &
Others
|
Consolidated
Total
|
||||||||||||||||
|
Revenue
|
$
|
-
|
$
|
6,350,549
|
$
|
-
|
$
|
-
|
$
|
6,350,549
|
||||||||||
|
Operating loss
|
$
|
(225,266)
|
$
|
(49,450)
|
$
|
(41,769)
|
$
|
(13,091)
|
$
|
(329,576)
|
||||||||||
|
Depreciation and amortization
|
$
|
159,374
|
$
|
48,635
|
$
|
7,176
|
$
|
-
|
$
|
215,185
|
||||||||||
|
Capital expenditures
|
$
|
-
|
$
|
14,354
|
$
|
-
|
$
|
-
|
$
|
14,354
|
||||||||||
13
APOLLO SOLAR ENERGY, INC.
NOTES TO CONSOLIDATED FINANCIAL STATEMENTS
FOR THE NINE MONTHS ENDED SEPTEMBER 30, 2014
(Unaudited)
NOTE 14. CONCENTRATIONS
For the nine months ended September 30, 2014, three major customers accounted for approximately 13%, 15% and 17% of total sales, respectively. For the three months ended September 30, 2014, one major customer accounted for approximately 16% of total sales, respectively.
For the nine months ended September 30, 2013, three major customers accounted for approximately 15% 25% and 33.% of total sales, respectively.
For the three months ended September 30, 2013, two major customers accounted for approximately 66% and 19% of total sales, respectively.
NOTE 15. COMMITMENT AND CONTINGENCIES
Employment Agreement
Effective November 8, 2010, Dr. Jingong Pan, the Company’s former Vice President, was appointed as Chairman of the Board of Directors and Chief Executive Officer of the Company. As Chief Executive Officer, Dr. Pan will receive an annual salary of RMB 660,000. Dr. Pan was also granted stock options to acquire up to 1,000,000 shares of the Company’s common stock, which vested in equal yearly installments over a three year period. The options have an exercise price of $3.50 per share. The agreement was for a three year term that expired on November 8, 2013. Dr. Pan has remained as Chairman of the Board of Directors and Chief Executive Officer of the Company.
Dispute with Renyi Hou
Between 2007 and 2010, a period during which Renyi Hou was CEO of the Company, Sichuan Xinju Mineral Resources Development Co. Ltd. (“Xinju”) borrowed a total of RMB28, 665,844 from Sichuan Apollo Solar Science & Technology Co. Ltd and Sichuan Xinlong Tellurium Industry & Technique Co. Ltd. Xinju is a private company, of which Mr. Hou owned 40%. On March 10, 2011 the Company’s Board of Directors agreed that Mr. Hou could satisfy the loans by surrendering 2,418,923 shares of the Company’s common stock. Those shares, when delivered by Mr. Hou, were held as treasury shares by the Company. In July 2013 counsel for Sichuan Apollo issued a legal opinion that the cancellation of the Sichuan Apollo receivables in exchange for shares of its parent corporation was illegal under Chinese law, and so voidable in court. Accordingly, Sichuan Apollo initiated a legal complaint with the local bureau of economic investigation. On November 19, 2013 the local bureau dismissed the complaint. Sichuan Apollo appealed the dismissal in December 2013. In addition, the Company tendered a certificate for 1,418,923 shares to Renyi Hou in order to reverse the 2011 transaction (1,000,000 shares otherwise due from Mr. Hou to the Company being withheld from the tender). However, as no consideration has been given for those shares, they are not considered outstanding, and remain treasury shares.
Dispute with Sichuan Xinju
On the same day that Sichuan Apollo filed a criminal complaint against Renyi Hou, as described above, Sichuan Xinju filed a civil lawsuit in a Chinese court against Sichuan Apollo. The complaint alleged that Sichuan Xinju paid RMB 3,548,160 ($579,765) to satisfy a loan owed to a third party by Sichuan Apollo and demanded reimbursement. Sichuan Apollo replied, denying liability on the grounds that the funds paid by Sichuan Xinju to the third party had been illegally transferred from a subsidiary of Sichuan Apollo to Sichuan Xinju by Renyi Hou. The civil court entered judgment in favor of Sichuan Xinju and imposed a lien on the bank account of Sichuan Apollo. Sichuan Apollo intends to appeal the judgment.
NOTE 16. SUBSEQUENT EVENTS
The Company has reviewed its subsequent events through the date these financial statements were issued and has determined that no additional material subsequent events have occurred through such date.
14
|
ITEM 2. MANAGEMENT’S DISCUSSION AND ANALYSIS OF FINANCIAL CONDITION AND RESULTS OF OPERATIONS
|
The following discussion contains forward-looking statements that involve risks and uncertainties. Forward-looking statements include, but are not limited to, statements regarding future events, our plans and expectations and financial projections. Our actual results could differ materially from those discussed herein. Factors that could cause or contribute to such differences include, but are not limited to, those discussed elsewhere in this Form 10-Q and in our Annual Report on Form 10-K filed on May 7, 2014. Unless the context otherwise requires, the terms “we,” the “Company,” “us,” or “Apollo” refers to Apollo Solar Energy, Inc. and our wholly-owned subsidiaries and variable interest entities.
Overview
We are a China-based vertically integrated refiner of tellurium (“Te”) and high-purity tellurium-based metals for specific segments of the electronic materials market. Our main expertise is in the production of Te-based compounds used to produce thin-film solar cells, cell modules and solar electronic products. While no reserves under the SEC’s Industry Guide 7 can currently be delineated at our properties, we believe that the tellurium to be used in our products in the future will be primarily sourced from our Dashuigou project located in Sichuan Province, PRC. In addition, we expect to source tellurium from another property in Shimian, Majiagou, PRC, through variable interest entity agreements, or the VIE Agreements, executed in April, 2009, with Sichuan Xinju Mineral Resources Development Corporation and certain of its shareholders holding 51.6619% of its voting stock. Under the terms of the VIE Agreements, we have been granted the exclusive exploration and mining rights to these two projects in accordance with a license granted by the Chinese government, which extends through June 2015 for exploration activities at our Dashuigou property, and through June 2014 for exploration and mining activities at our Majiagou property. The licenses are subject to potential renewal at their termination date. On January 14, 2014 our license to carry on mining activities at the Dashuigou property terminated; our hope is that we will be able to renew it if our exploration activities on that site prove fruitful.
Currently, tellurium is produced as a by-product in the process of processing copper and other metals. As a result, costs are high. We believe that the Dashuigou and Majiagou projects are the only two known deposits in the world in which tellurium, one of the rarest metallic elements on earth, is the primary commodity of economic interest. We had planned to begin mining at Dashuigou in 2012, but were delayed by new mining regulations adopted by the local government. We have achieved compliance with the new regulations. Our long-term plan, therefore, is to obtain approximately 50% to 60% of the tellurium necessary for our products from the Dashuigou, Majiagou and other projects and believe this ability to be a significant competitive advantage because the cost of tellurium sourced from our own properties will be substantially lower than that purchased from an outside third party. For the near-term (at least into 2015), we will source all of our tellurium requirements, and thereafter source the remaining 40% to 50% of our tellurium needs from third-party suppliers with whom we have established good business relationships over the past few years. By vertically integrating our processes, we believe we are able to achieve significant operating efficiencies and produce high-quality products that offer cost and quality benefits to our customers.
Our refining operations are currently based in a 330,000 square foot facility in Chengdu, Sichuan Province, PRC. We expect this facility to eventually have the capacity to produce more than 300 tons of high-purity photovoltaic cell materials and 42 other types of electronic materials. Future expansion of this facility in vacant land leased to the Company will have a capacity to produce up to an additional 350 tons of high-purity photovoltaic cell materials.
In November 2009 we entered into a joint venture to produce thin film solar cells. Our principal joint venture partner is Bengbu Design & Research Institute for the Glass Industry, which is an affiliate of China National Building Materials Group, a giant state-owned entity. A local government agency also owns an equity interest in the joint venture. In exchange for our contribution of land and facilities as well as three patents, we received a 35% equity interest in the joint venture, which is named CEO Apollo Solar. At present, COE Apollo Solar is engaged in research regarding glass used in production of thin film solar cells, and is developing a production line for 80MW CdTe thin film solar modules. COE Apollo Solar has obtained the requisite government licenses, and expects to complete construction of the assembly line during 2015.
15
We are currently in the exploration stage of operations in accordance with the requirements of SEC Industry Guide 7. However, we believe we are unique in that we expect to both mine and refine our tellurium-based products, with primary refining capabilities as provided by Sichuan Xinju Minteral Resources Development Corporation pursuant to the VIE Agreements, and secondary refining capabilities directly through our Company. Our primary refining capabilities are such that we can treat metal concentrates (containing, for example, as little as 50% of the metals of interest), and extract and refine the metals of interest so that they can be fed to our secondary refining operations, where we attain a higher level of purity. Because we expect to mine the raw material in the future, and perform both refining functions, both directly and through our VIE Arrangement, we consider ourselves a supplier that will in the future have uniquely integrated capabilities. Our end-products are tellurium, cadmium, zinc and related compounds of 99.999% (five nines, or 5N) purity or above. Our products are critical precursors in a number of electronic applications, including the rapidly-expanding thin-film photovoltaic, or PV, market.
Thin film technologies, because of their relatively low usage of raw materials when compared with traditional silicon-based photovoltaic technologies, offer a potential cost advantage in the marketplace. Accordingly, we believe these technologies are beginning to gain an ever increasing foothold in the market.
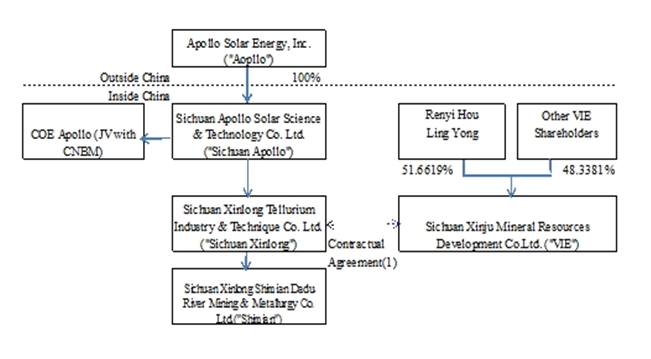
Our Variable Interest Entity Agreements
As illustrated in the diagram below, we entered into various exclusive contractual arrangements on April 10, 2009 with Sichuan Xinju Mineral Resources Development Corporation (the “VIE”) and certain of its shareholders who are our direct or indirect employees and who collectively own 51.6619% of the VIE. Among other things, these VIE Agreements granted to our wholly-owned subsidiary a first option to purchase the exploration rights related to the Dashuigou area property and the mining rights related to that certain tellurium and bismuth property in Shimian Majiagou, which rights we collectively referred to as the Exploration Business. Additionally, the VIE and certain of its shareholders who collectively own 51.6619% of the VIE granted to our wholly-owned subsidiary an exclusive right to purchase all of the products produced from the Exploration Business for a specified period of time. As a result, we consolidate the financial results of the VIE related to the Exploration Business pursuant to FASB ASC 810-10, “Consolidation.”
16
(1) Agreements that provide us with effective control over Sichuan Xinju Mineral Resources Development Co. Ltd., or the VIE, include a purchase option agreement, a business operations agreement and an exclusive technical and consulting agreement.
The agreements between the VIE and our other affiliated entities or persons are summarized below:
|
·
|
First Option Exclusive Acquiring Agreement among Sichuan Xinlong Tellurium Industry & Technique Co., Ltd., Sichuan Xinju Mineral Resources Development Co., Ltd., Renyi Hou and Ling Yong, which grants to our wholly-owned subsidiary a first option to purchase the Mining Business at such time as the purchase becomes advisable, permissible and in our best interest.
|
|
·
|
Exclusive Sales Agreement between Sichuan Xinlong Tellurium Industry & Technique Co., Ltd. and Sichuan Xinju Mineral Resources Development Co., Ltd., which grant to our wholly-owned subsidiary the exclusive right to buy all of the output of the Mining Business.
|
|
·
|
Business Operation Agreement among Sichuan Xinlong Tellurium Industry & Technique Co., Ltd., Sichuan Xinju Mineral Resources Development Co., Ltd., Renyi Hou and Ling Yong, which imposes certain restrictions and obligations on the VIE and certain of its shareholders to support the VIE arrangement, including refraining from competing with our business and modifying the business operations of the VIE without the prior consent of our wholly-owned subsidiary.
|
|
·
|
Exclusive Technical and Consulting Agreement between Sichuan Xinlong Tellurium Industry & Technique Co., Ltd. and Sichuan Xinju Mineral Resources Development Co., Ltd., which requires the VIE to provide certain technical and consulting services exclusively to our wholly-owned subsidiary in connection with the Mining Business. Our wholly-owned subsidiary agrees to provide up to $6.0 million in investing funding to the VIE in connection with its operation of the Mining Business, on such terms as the parties shall agree from time to time.
|
Results of Operations
Sales
Sales for the three and nine months ended September 30, 2014 were $628,345 and 3,549,434 respectively, compared to the sales of $6,350,549 and $13,446,941 in the same periods in 2013, a decrease of $5,722,204 or approximately 90.1% for the three months period and a decrease of $9,897,507 or approximately 73.6% for the nine months period. The primary reason for the decrease is that the Company engaged in purchase and sale transactions during 2013 that had features of high turnover and low margin, with increased sales as a result. The Company has not been pursuing that kind of transaction during 2014, which has resulted in reduced sales but improved margins.
Gross profit/loss
Our cost of sales decreased by $5,677,176 and $9,837,258 or 91.6% and 75.5% in the three and nine months ended September 30, 2014 compared to the same period of 2013. Our gross margin remained very low: 17.6% during the three months ended September 30, 2014 and 10.2% during the nine months ended September 30, 2014 compared to 2.5% and 3.1% for the same period in 2013. The primary reason for this low level of gross margin was the delay in production from our tellurium mines, caused by new government regulations. Without an internal source of tellurium, we were forced to purchase tellurium on the world market. As a significant amount of our revenue was generated from the sale of compounds incorporating high purity tellurium, our margin was impacted adversely. We expect this situation to improve as we have satisfied the new government regulations and expect internal tellurium production to be initiated in 2015.
17
Selling expense
For the three months ended September 30, 2014, selling expenses were $30,899 compared to $54,980 for the three months ended September 30, 2013, representing a decrease of 43.8%. For the nine months ended September 30, 2014, selling expenses were $101,543 compared to $189,127 for the nine months ended September 30, 2013, representing a decrease of 46.3%. Selling expenses were higher during three and nine months ended September 30, 2013 because the Company initiated a concerted effort to increase sales by hiring more sales people and increasing efforts to promote the product to the market. Due to lack of resources, we have scaled back our marketing efforts in 2014.
General and administrative expenses
We incurred general and administrative expenses of $301,836 and $940,247 for the three and nine months ended September 30, 2014, compared to $261,984 and $1,356,631 in the same period of 2013, representing an increase of 15.2% and a decrease of 30.7% compare to the same periods in 2013. The increase in our general and administrative expenses was primarily consulting fee incurred during three months ended September 30, 2014. The decrease in our general and administrative expenses was primarily due to headcount reduction as a result of internal reform.
Research and development expenses
For the nine months ended September 30, 2014, we incurred research and development expenses of $589,203, less $391,256 of government grant received. For the nine months ended September 30, 2013, we incurred research and development expenses of $799,414. For the three months ended September 30, 2014, we incurred research and development expenses of $8,144, compared to $168,731 for the three months ended September 30, 2013.
Operating loss
Our operating loss for the three months ended September 30, 2014 was $229,788, which was $99,788 or 30.3% less than our operating loss for the three months ended September 30, 2013. Our operating loss for the nine months ended September 30, 2014 was $878,863, which was $1,045,186 or 54.3% less than our operating loss for the nine months ended September 30, 2013.
Other income (expense)
In 2009, we acquired a 35% interest in a joint venture. We accounts for this investment under the equity method of accounting.
During the nine months ended September 30, 2014 and 2013, the operations of the Joint Venture resulted in net loss of $219,047 and $789,550, respectively. Because we own 35% of the equity in the Joint Venture and account for that investment on the equity method, we recorded equity in loss of Joint Venture of $8,887 and $88,805 for the three month periods ended September 30, 2014 and 2013, respectively; we recorded Equity in Loss of Joint Venture of $76,667 and $276,344 for the nine month periods ended September 30, 2014 and 2013, respectively.
In addition, during the three and nine month periods ended September 30, 2014, we recorded net interest expense of $153,260 and $449,639, compare to $141,708 and $561,811 in the same periods in 2013, respectively. The decrease in interest expenses was related to the decrease in interest rate during year 2014 compared the same periods in 2013.
Net loss
We recorded net loss of $391,935 for the three months ended September 30, 2014 and a net loss of $1,405,169 for the nine months ended September 30, 2014.
We recorded net income of 38,147 for the three months ended September 30, 2013 and a net loss of $2,176,757 for the nine months ended September 30, 2013.
18
Liquidity and Capital Resources
We have historically funded our operations primarily through paid-in capital, sales of goods, loan from stockholders and short term loans from financial institutions in China. Based on our current cash level and management’s forecast of operating cash flows, management has determined that the Company will require additional funds, either debt or equity, to finance our planned operations for the next twelve months.
The following table summarizes our liquidity and capital resources from on the dates presented:
|
September 30,
2014
|
December 31,
2013
|
|||||||
|
Cash
|
$
|
40,837
|
$
|
921,197
|
||||
|
Working capital(deficit)
|
$
|
(9,099,489
|
)
|
$
|
(7,605,859
|
)
|
||
|
Stockholders' Equity
|
$
|
11,887,861
|
$
|
13,403,495
|
||||
The Company had a working capital deficit of $9,099,489 at September 30, 2014. This represented an atrophy of $1,493,630 since December 31, 2013. The primary reason for the atrophy of working capital was the $1,405,169 loss that we incurred during nine months ended September 30, 2014, which we funded from our cash resources.
The following table describes our contractual commitments and obligations as of September 30, 2014:
|
Payments due by Period (in $)
|
||||||||||||||||||||
|
Contractual Obligations
|
Total
|
Less Than 1 Year
|
1 – 3
Years
|
3 – 5
Years
|
More Than
5 Years
|
|||||||||||||||
|
Short term loans
|
$ | 9,497,026 | $ | 9,497,026 | $ | - | $ | - | $ | - | ||||||||||
|
Loans from shareholder and related party
|
$ | 376,639 | $ | 376,639 | $ | - | $ | - | $ | - | ||||||||||
|
Convertible loans
|
$ | 510,000 | $ | 510,000 | $ | - | ||||||||||||||
|
Total
|
$ | 10,383,665 | $ | 9,873,665 | $ | - | $ | 510,000 | $ | - | ||||||||||
Given that the Company’s debt obligations in the next twelve months equal 233% of its current assets at September 30, 2014, management has determined that additional funds will have to be secured in order to finance our operations for the coming year.
Cash Flows
|
Nine months Ended
September 30,
|
||||||||
|
2014
|
2013
|
|||||||
|
Net cash used in operating activities
|
$
|
(433,064
|
)
|
$
|
(1,508,549
|
)
|
||
|
Net Cash provided by(used in) investing activities
|
(277,117
|
)
|
549,653
|
|||||
|
Net cash provided by(used in) financing activities
|
(154,634)
|
1,555,480
|
||||||
|
Effect of exchange rate changes on cash
|
(15,545)
|
37,716
|
||||||
|
Net increase(decrease) in cash
|
(880,360)
|
634,300
|
||||||
|
Cash at beginning of period
|
921,197
|
935,750
|
||||||
|
Cash at end of period
|
$
|
40,837
|
$
|
1,570,050
|
||||
19
Net cash used in operating activities.
Our operating activities during the nine months ended September 30, 2014 used $433,064 in cash. The use of cash was less than our net loss from operations of $1,405,169, primarily because we reduced our accounts receivable by $502,656 and decreased account payable-trade by $379,353.
The operating activities of our continuing operations during the nine months ended September 30, 2013 used $1,571,671 in cash. The use of cash was less that our net loss from continuing operations of $2,762,204, primarily because we reduced our inventory by $504,832.
Net cash used in investing activities.
Due to our lack of funds, we have made only very modest additions to our capital assets during recent years. During the nine months ended June 30, 2014 and 2013, we invested $277,117 and $27,957 in property and equipment and construction in process.
Net cash (used in)/provided by financing activities.
During the nine months ended September 30, 2014, we received the proceeds of $325,431 from a loan from an unrelated party. We repaid $490,000 in partial satisfaction of our outstanding convertible loans. In contrast, during the nine months ended September 30, 2013, the Company received $642,986 of proceeds from those same convertible loans and repaid $50,244 to related party and stockholder loans.
The Company believes that its cash flows generated internally will not be sufficient to sustain operations and repay short term bank loans for the next twelve months. Therefore, from time to time, the Company will require extra funding through short term borrowing from PRC banks or other financing activities.
Off-Balance Sheet Transactions
We have no material off-balance sheet transactions.
ITEM 3. QUANTITATIVE AND QUALITATIVE DISCLOSURES ABOUT MARKET RISK
Not Applicable.
ITEM 4. CONTROLS AND PROCEDURES
(a) Evaluation of Disclosure Controls and Procedures
Under the supervision and with the participation of our management, including our Chief Executive Officer and Chief Financial Officer, we evaluated the effectiveness of the design and operation of our disclosure controls and procedures pursuant to Rule 13a-15 under the Securities Exchange Act of 1934, as amended, or the Exchange Act, as of the end of the period covered by this report. That evaluation disclosed that the Company has material defects in its disclosure controls and procedures. Specifically management determined that there is a lack of expertise in U.S. GAAP among the Company’s management personnel. They also determined that the size of the Company’s accounting staff and low number of supervisory personnel prevented an appropriate segregation of accounting functions. Based on that evaluation, the Company’s Chief Executive Officer and Chief Financial Officer have concluded that were not effective as of September 30, 2014.
(b) Changes in Internal Controls
There were no changes in our internal control over financial reporting during the nine months ended September 30, 2014 that have materially affected, or are reasonably likely to materially affect our internal control over financial reporting.
20
PART II. OTHER INFORMATION
In addition to other information set forth in this report, you should carefully consider the “Risk Factors” discussed in our Annual Report on Form 10-K filed on May 7, 2014, for our 2013 fiscal year. There have been no material changes to the “Risk Factors” previously disclosed in our Annual Report on Form 10-K for the year ended December 31, 2013.
|
Rule 13a-14(a) Certification – CEO
|
|
|
32
|
Rule 13a-14(b) Certification
|
|
101 INS
|
XBRL Instance Document**
|
|
101 SCH
|
XBRL Schema Document**
|
|
101 CAL
|
XBRL Calculation Linkbase Document**
|
|
101 DEF
|
XBRL Definition Linkbase Document**
|
|
101 LAB
|
XBRL Labels Linkbase Document**
|
|
101 PRE
|
XBRL Presentation Linkbase Document**
|
** The XBRL related information in Exhibit 101 shall not be deemed “filed” for purposes of Section 18 of the Securities Exchange Act of 1934, as amended, or otherwise subject to liability of that section and shall not be incorporated by reference into any filing or other document pursuant to the Securities Act of 1933, as amended, except as shall be expressly set forth by specific reference in such filing or document.
In accordance with the requirements of the Exchange Act, the registrant has duly caused this report to be signed on its behalf by the undersigned, thereunto duly authorized.
|
Apollo Solar Energy, Inc.
|
|
|
Date: November 19, 2014
|
By: /s/ Jingong Pan
|
|
Jingong Pan
|
|
|
Chief Executive Officer and
Chief Financial and Accounting Officer
|
21