Attached files
| file | filename |
|---|---|
| EXCEL - IDEA: XBRL DOCUMENT - SILVERBOW RESOURCES, INC. | Financial_Report.xls |
| EX-23.1 - CONSENT OF H.J. GRUY AND ASSOCIATES, INC - SILVERBOW RESOURCES, INC. | a201310ka-exhibit231.htm |
| EX-21 - LIST OF SUBSIDIARIES OF SWIFT ENERGY COMPANY - SILVERBOW RESOURCES, INC. | a201310ka-exhibit21.htm |
| EX-23.2 - CONSENT OF ERNST AND YOUNG LLP - SILVERBOW RESOURCES, INC. | a201310ka-exhibit232.htm |
| EX-32 - CERTIFICATION OF CEO AND CFO (SECTION 906) - SILVERBOW RESOURCES, INC. | a201310ka-exhibit32.htm |
| EX-31.1 - CERTIFICATION OF CEO (SECTION 302) - SILVERBOW RESOURCES, INC. | a201310ka-exhibit311.htm |
| EX-99.1 - REPORT OF H.J. GRUY AND ASSOCIATES, INC - SILVERBOW RESOURCES, INC. | a201310ka-exhibit991.htm |
| EX-31.2 - CERTIFICATION OF CFO (SECTION 302) - SILVERBOW RESOURCES, INC. | a201310ka-exhibit312.htm |
| EX-12 - SWIFT ENERGY COMPANY RATIO OF EARNINGS TO FIXED CHARGES - SILVERBOW RESOURCES, INC. | a201310ka-exhibit12.htm |
UNITED STATES
SECURITIES AND EXCHANGE COMMISSION
Washington, D.C. 20549
FORM 10-K/A
(Amendment No. 1)
Annual Report Pursuant to Section 13 or 15(d) of the Securities Exchange Act of 1934
For the Fiscal Year Ended December 31, 2013
Commission File Number 1-8754

SWIFT ENERGY COMPANY
(Exact Name of Registrant as Specified in Its Charter)
Texas (State of Incorporation) | 20-3940661 (I.R.S. Employer Identification No.) |
16825 Northchase Drive, Suite 400 Houston, Texas 77060 (281) 874-2700 (Address and telephone number of principal executive offices) Securities registered pursuant to Section 12(b) of the Act: | |
Title of Class | Exchanges on Which Registered: |
Common Stock, par value $.01 per share | New York Stock Exchange |
Securities registered pursuant to Section 12(g) of the Act: None
Indicate by check mark if the registrant is a well-known seasoned issuer, as defined in Rule 405 of the Securities Act.
Yes | o | No | þ |
Indicate by check mark if the registrant is not required to file reports pursuant to Section 13 or Section 15(d) of the Securities Exchange Act of 1934.
Yes | o | No | þ |
Indicate by check mark whether the registrant (1) has filed all reports required to be filed by Section 13 or 15(d) of the Securities Exchange Act of 1934 during the preceding 12 months, and (2) has been subject to such filing requirements for the past 90 days.
Yes | þ | No | o |
Indicate by check mark if disclosure of delinquent filers pursuant to Item 405 of Regulation S-K is not contained herein, and will not be contained, to the best of Registrant's knowledge, in definitive proxy or information statements incorporated by reference in Part III of this Form 10-K or any amendment to this Form 10-K.
þ |
1
Indicate by check mark whether the registrant is a large accelerated filer, an accelerated filer, or a non-accelerated filer. See definition of “accelerated filer and large accelerated filer” in Rule 12b-2 of the Exchange Act.
Large accelerated filer | þ | Accelerated filer | o | Non-accelerated filer | o | Smaller reporting company | o | |||
Indicate by check mark whether the registrant is a shell company (as defined in Rule 12b-2 of the Exchange Act).
Yes | o | No | þ |
The aggregate market value of the voting and non-voting common equity held by non-affiliates computed by reference to the price at which the common equity was last sold on the New York Stock Exchange as of June 30, 2013, the last business day of June 2013, was approximately $504,125,149.
The number of shares of common stock outstanding as of January 31, 2014 was 43,475,471.
Documents Incorporated by Reference
Proxy Statement for the Annual Meeting of Shareholders to be held May 20, 2014 | Part III, Items 10, 11, 12, 13 and 14 |
2
Explanatory Note
We are filing this amended Form 10-K/A (“Form 10-K/A”) to amend our Annual Report on Form 10-K for the year ended December 31, 2013, originally filed with the Securities and Exchange Commission (the “SEC”) on March 3, 2014 (“Original Filing”), to restate our consolidated financial statements and related footnote disclosures for the years ended December 31, 2013, 2012 and 2011. This Form 10-K/A also includes certain restated quarterly information under the Supplementary Information heading in Item 8 of this Form 10-K/A. This Form 10-K/A also amends certain other Items in the Original Filing, as listed in “Items Amended in this Form 10-K/A” below.
Restatement Background
On November 10, 2014, the Audit Committee of our Board of Directors (the “Audit Committee”), after discussion with management and Ernst & Young LLP (“EY”), our independent registered public accounting firm, determined that the following financial statements previously filed with the SEC should no longer be relied upon: (1) the audited consolidated financial statements included in our Annual Report on Form 10-K for the year ended December 31, 2013, 2012 and 2011; (2) the unaudited condensed consolidated financial statements included in our Quarterly Reports on Form 10-Q for the quarters ended March 31, 2013 and 2012, June 30, 2013 and 2012, and September 30, 2013 and 2012; and (3) the unaudited condensed consolidated financial statements included in our quarterly reports on Form 10-Q for the quarters ended March 31, 2014 and June 30, 2014. Similarly, the related press releases, auditor reports on the consolidated financial statements as of and for the year ended December 31, 2013 and the effectiveness of internal control over financial reporting as of December 31, 2013, management’s report on the effectiveness of internal control over financial reporting as of December 31, 2013, and stockholder communications describing the portion of our financial statements for these periods that need to be restated should no longer be relied upon.
In connection with the preparation of our financial statements for the quarter ended September 30, 2014, we determined that an error occurred in our model used for the ceiling test calculation prepared at December 31, 2013, March 31, 2009 and December 31, 2008, to determine whether the net book value of the Company's oil and gas properties exceed the ceiling. Specifically, this error related to incorrectly including the deferred income tax effect of the Company's asset retirement obligations when computing the ceiling test limitation of its oil and natural gas properties under the full-cost method of accounting. The Company determined that the error caused a material overstatement of its full-cost ceiling test write-down of oil and gas properties in periods prior to 2014, including associated depletion for all periods presented. As a result of this error, we have restated our audited consolidated financial statements for the years ended December 31, 2013, 2012 and 2011 and our unaudited condensed consolidated financial information for the quarters ended March 31, 2013, June 30, 2013, September 30, 2013, and December 31, 2013.
As of December 31, 2013, the correction of this error principally increased the Company's net oil and gas property balances by approximately $49 million, increased the net deferred tax liabilities by approximately $18 million, and increased retained earnings by approximately $31 million. Approximately $15 million of the increase in retained earnings is related to periods prior to 2013, more specifically to the first quarter of 2009 and the fourth quarter of 2008. For the year ended December 31, 2013, the correction of the ceiling test error also resulted in a decrease in our ceiling-test write-down for the year ended December 31, 2013 of approximately $27 million, which was partially offset by an increase in our depreciation, depletion and amortization expense for the year of approximately $1 million. Further, these corrections increased net income for the year ended December 31, 2013 by approximately $16 million (net of an increase to the income tax benefit of approximately $9 million for the period). Please refer to Note 1A - “Restatement of Previously Issued Consolidated Financial Statements” of this Form 10-K/A for more information regarding the impact of these adjustments.
Along with restating our financial statements to correct the error discussed above, we are making adjustments for certain previously identified immaterial accounting errors related to the periods covered by this Form 10-K/A. When these financial statements were originally issued, we assessed the impact of these errors and concluded that they were not material to our financial statements for each of the years ended December 31, 2013, 2012, and 2011, and reported fiscal quarters within each of these years. However, in conjunction with our need to restate our financial statements as a result of the error noted above, we have determined that it would be appropriate within this Form 10-K/A to record all such previously unrecorded adjustments. Please refer to Note 1A - “Restatement of Previously Issued Consolidated Financial Statements” of this Form 10-K/A for more information regarding the impact of these adjustments.
Because these revisions are treated as corrections of errors to our prior period financial results, the revisions are considered to be a “restatement” under U.S. generally accepted accounting principles. Accordingly, the revised financial information included in this Annual Report on Form 10-K/A has been identified as “restated”.
3
Restatement of Other Financial Statements
In addition to this Form 10-K/A, we are concurrently filing an amendment to our Quarterly Reports on Form 10-Q for the quarters ended March 31, 2014 and June 30, 2014 (the “Form 10-Q/As”). We are filing the Form 10-Q/As to restate our unaudited condensed consolidated financial statements and related financial information for the periods contained in those reports and to amend certain other Items within those reports.
Internal Control Consideration
Our management has determined that there was a deficiency in our internal control over financial reporting that constitutes a material weakness, as defined by SEC regulations, at December 31, 2013, as discussed in Part II, Item 9A of this Form 10-K/A.
Items Amended in this Form 10-K/A
For the convenience of the reader, this Form 10-K/A sets forth the Original Filing, in its entirety, as modified and superseded as necessary to reflect the restatement. The following items in the Original Filing have been amended as a result of, and to reflect, the restatement:
A. | Part II, Item 6. Selected Financial Data |
B. | Part II, Item 7. Management’s Discussion and Analysis of Financial Condition and Results of Operations |
C. | Part II, Item 8. Financial Statements and Supplementary Data |
D. | Part II, Item 9A. Controls and Procedures |
E. | Part IV, Item 15. Exhibits, Financial Statement Schedules |
This report on Form 10-K/A is presented as of the filing date of the Original Form 10-K and does not reflect events occurring after that date, or modify or update the information contained therein in any way other than as required to correct the error and record the adjustments described above.
In accordance with applicable SEC rules, this Form 10-K/A includes new certifications required by Sections 302 and 906 of the Sarbanes-Oxley Act of 2002, as amended, from our Chief Executive Officer and Chief Financial Officer dated as of the filing date of this Form 10-K/A.
4
Form 10-K/A
Swift Energy Company and Subsidiaries
10-K/A Part and Item No.
Part I | Page | |
Items 1 & 2 | Business and Properties | |
Item 1A. | Risk Factors | |
Item 1B. | Unresolved Staff Comments | |
Item 3. | Legal Proceedings | |
Item 4. | Mine Safety Disclosures | |
Part II | ||
Item 5. | Market for Registrant's Common Equity, Related Stockholder Matters and Issuer Purchases of Equity Securities | |
Item 6. | Selected Financial Data (As Restated) | |
Item 7. | Management's Discussion and Analysis of Financial Condition and Results of Operations | |
Item 7A. | Quantitative and Qualitative Disclosures About Market Risk | |
Item 8. | Financial Statements and Supplementary Data (As Restated) | |
Item 9. | Changes in and Disagreements with Accountants on Accounting and Financial Disclosure | |
Item 9A. | Controls and Procedures | |
Item 9B. | Other Information | |
Part III | ||
Item 10. | Directors, Executive Officers and Corporate Governance (1) | |
Item 11. | Executive Compensation (1) | |
Item 12. | Security Ownership of Certain Beneficial Owners and Management and Related Stockholders Matters (1) | |
Item 13. | Certain Relationships and Related Transactions, and Director Independence (1) | |
Item 14. | Principal Accountant Fees and Services (1) | |
Part IV | ||
Item 15. | Exhibits and Financial Statement Schedules | |
(1) Incorporated by reference from Proxy Statement for the Annual Meeting of Shareholders to be held May 20, 2014 | ||
5
Items 1 and 2. Business and Properties
See pages 25 and 26 for explanations of abbreviations and terms used herein.
General
Swift Energy Company is engaged in developing, exploring, acquiring, and operating oil and natural gas properties, with a focus on oil and natural gas reserves in Texas as well as onshore and in the inland waters of Louisiana. Swift Energy was founded in 1979 and is headquartered in Houston, Texas. At December 31, 2013, we had estimated proved reserves of 219.2 MMBoe with a PV-10 Value of $2.4 billion (PV-10 Value is a non-GAAP measure, see the section titled “Oil and Natural Gas Reserves” in our Property section for a reconciliation of this non-GAAP measure to the closest GAAP measure). Our total proved reserves at December 31, 2013 were approximately 24% crude oil, 62% natural gas, and 14% NGLs while 29% of our total proved reserves were developed. Our proved reserves are concentrated with 80% in Texas and 20% in Louisiana.
We currently focus primarily on development and exploration of three core areas. The major fields in our core areas are:
•South Texas
◦ | Olmos |
▪ | AWP |
◦ | Eagle Ford |
▪ | AWP |
▪ | Artesia Wells |
▪ | Fasken |
• | Southeast Louisiana |
▪ | Lake Washington |
▪ | Bay De Chene |
• | Central Louisiana |
▪ | South Bearhead Creek |
▪ | Masters Creek |
▪ | Burr Ferry |
Competitive Strengths and Business Strategy
Our competitive strengths, together with a balanced and comprehensive business strategy, provide us with the flexibility and capability to achieve our goals. Our primary strengths and strategies are set forth below.
Demonstrated Ability to Grow Reserves and Production
We have grown our proved reserves from 116.4 MMBoe to 219.2 MMBoe over the five-year period ended December 31, 2013. Over the same period, our annual production has grown from 10.0 MMBoe to 11.7 MMBoe. Our growth in reserves and production over this five-year period has resulted primarily from drilling activities in our core areas. During 2013, our proved reserves increased by 14%, due mainly to additional drilling in our South Texas core area. Based on our long-term historical performance and our business strategy going forward, we believe that we have the opportunities, experience, and knowledge to continue growing both our reserves and production.
2014 Strategy
We currently plan to fund our 2014 capital expenditures with our 2014 operating cash flow, potential line of credit borrowings and proceeds from asset dispositions and/or joint ventures. Our 2014 planned capital expenditures are $300 to $350 million. These amounts are flexible and will be adjusted based on the timing of any announced transactions and market fundamentals. The Company is currently negotiating the sale of some or all of its properties in Central Louisiana and is also negotiating joint venture arrangements for a portion of our natural gas Eagle Ford properties to accelerate drilling and development, monetize a portion of those asset values, diversify our risk profile and possibly free up capital dollars for other purposes. The Company expects these transactions will be finalized by the end of the second quarter. The completion of one or both of these transactions will affect the level of our 2014 capital expenditures as we better align our capital expenditures with our expected cash flows. We will continue to rationalize our portfolio to focus on properties that generate the most attractive returns on capital.
6
Replacement of Reserves
Historically we have added proved reserves through both our drilling and acquisition activities. We believe that this strategy will continue to add reserves for us over the long-term; however, external factors beyond our control, such as limited availability of capital or its cost, competition within our industry, adverse weather conditions, commodity market factors, the requirement of new or upgraded infrastructure at the production sites, technological advances, and governmental regulations, could limit our ability to drill wells, access reserves, and acquire proved properties in the future. We have included a listing of the vintages of our proved undeveloped reserves in the table titled “Proved Undeveloped Reserves” and believe this table will provide an understanding of the time horizon required to convert proved undeveloped reserves to oil and natural gas production. Our reserves additions for each year are estimates. Reserves volumes can change over time and therefore cannot be absolutely known or verified until all volumes have been produced and a cumulative production total for a well or field can be calculated. We have replaced 300% of our production on average over the last five years with our new reserves.
Concentrated Focus on Core Areas with Operational Control
The concentration of our operations in our core areas allows us to leverage our drilling unit and workforce synergies while minimizing the continued escalation of drilling and completion costs. Our average lease operating costs, excluding taxes, were $10.28, $10.02 and $9.95 per Boe for the years ended December 31, 2013, 2012 and 2011, respectively. Each of our core areas includes properties that are targeted for future growth. This concentration allows us to utilize the experience and knowledge we gain in these areas to continually improve our operations and guide us in developing our future activities and in operating similar types of assets. The value of this concentration is enhanced by our operational control of 99% of our proved oil and natural gas reserves base as of December 31, 2013. Retaining operational control allows us to more effectively manage production, control operating costs, allocate capital, and time field development.
Develop Under-Exploited Properties
We are focused on applying advanced technologies and recovery methods to areas with known hydrocarbon resources to optimize our exploration and exploitation of such properties as illustrated in our core areas. For instance, in 1989 we acquired producing properties in the AWP field in Texas from a major producer. This field had been developed in the early 1980's and was considered close to maturity when we made this acquisition. The Company began to acquire adjacent undeveloped acreage and in 1994 launched an aggressive drilling program. This area has remained a cornerstone of our operations as we have pursued other opportunities. Since assuming operations in this area, our drilling and completion techniques have been continuously refined to improve hydrocarbon recovery from the tight sand Olmos formation. Almost all of our existing interest overlays portions of the now very active Eagle Ford shale play which is being developed through the combination of horizontal drilling and multi-stage fracture stimulation completion techniques. While the combination of proven drilling and completion technologies have allowed us to begin to exploit the Eagle Ford shale, we have applied the same methods to further develop the “mature” Olmos sand. As a result, we substantially increased our Olmos production even though we have been producing from this formation for over 20 years. The Company has acquired 800 square miles of 3D seismic data over the AWP and Artesia Wells areas. In 2011 and 2012 we merged and prestack time migrated 800 square miles of this data that we are using to plan our wells and enhance and expand our developments at AWP and the Artesia Wells area. We continue to apply our advanced inversion techniques and improve and expand our rock properties understanding which allows us to identify and drill within the most highly productive zones in the Eagle Ford and Olmos formations.
Another of our significant successes is the Lake Washington field. This field was discovered in the 1930s. We acquired our properties in this area for $30.5 million in 2001 and increased our average daily net production from less than 700 Boe to a historical peak of over 18,000 Boe several years ago. We have utilized enhanced 3-D seismic and various completion techniques including sliding sleeves to improve drilling success and production performance. In 2013 we commenced the application of advanced inversion techniques to identify new drilling opportunities around the Lake Washington salt dome. When we acquired this field we booked 7.7 MMBoe of reserves. Since acquisition we produced approximately 52 MMBoe and still have remaining proved reserves of 12.0 MMBoe.
7
Experienced Technical Team and Technology Utilization
We employ 59 oil and gas technical professionals, including geophysicists, petrophysicists, geologists, petroleum engineers and production and reservoir engineers, who have an average of approximately 23 years of experience in their technical fields and have been employed by us for an average of approximately seven years. In addition, we engage experienced and qualified consultants to perform various comprehensive seismic acquisitions, processing, reprocessing, interpretation, and other related services. We continually apply our extensive in-house experience and current technologies to benefit our drilling and production operations.
We increasingly use advanced technology to enhance the results of our drilling and production efforts, including two and three-dimensional seismic acquisition, licensing and pre-stack time and depth imaging, advanced attributes, pore-pressure analysis, inversion and detailed field reservoir depletion planning. In the past three years, we completed projects to invert, calibrate, merge and prestack time-migrate our 800 square miles of merged 3-D seismic data over and near our AWP and Artesia Wells fields. In 2013, we initiated a project to license high-quality 3-D seismic and apply advanced inversion techniques over our Fasken field.
The application of horizontal drilling and multi-stage hydraulic fracturing technology has resulted in increases in production and decreases in completion and operating costs in our South Texas Olmos and Eagle Ford operations. In 2013, we successfully drilled 42 horizontal wells in our South Texas area using this technology. We will continue to improve and employ this new technology in South Texas and apply this to other areas in which we operate. We use numerous recovery techniques, including gas lift, acid treatments, water flooding, and pressure maintenance to enhance crude oil and natural gas production in all of our core operating areas. We also fracture reservoir rock through the injection of high-pressure fluid, the installation of gravel packs, and the insertion of coiled-tubing velocity strings to enhance and maintain production.
Swift Energy's success at drilling both in South Texas and in Louisiana can be marked by requiring excellence in geosciences and engineering. This is accomplished by elevating the quality of engineering first and operations second, with a focus on continuing improvement. Specific drilling and completion guidelines and design specifications are developed and implemented as best practices and standards, respectively, from which all planning and execution is derived. The emphasis on well planning has permeated throughout the organization and the results of that planning constantly show up in performance across all operations. Lastly, the quality of the equipment and field personnel, together with a complete drilling process, is consistently enforced. This is the mixture of resources that aids Swift Energy in moving toward becoming a top tier company.
Operating Areas
The following table sets forth information regarding our 2013 year-end proved reserves from continuing operations of 219.2 MMBoe and production of 11.7 MMBoe by area:
Core Areas & Fields | Developed Reserves (MMBoe) | Undeveloped Reserves (MMBoe) | Total Proved Reserves (MMBoe) | % of Total Proved Reserves | Oil and NGLs as % of Reserves | % of Total Production | Oil and NGLs as % of Production | ||||||||||||||
Artesia Wells - Eagle Ford | 9.6 | 14.8 | 24.4 | 11.1 | % | 48.9 | % | 24.3 | % | 49.7 | % | ||||||||||
AWP - Eagle Ford | 11.6 | 28.1 | 39.7 | 18.1 | % | 70.1 | % | 17.8 | % | 71.1 | % | ||||||||||
AWP - Olmos | 15.1 | 3.6 | 18.7 | 8.5 | % | 41.4 | % | 19.7 | % | 43.5 | % | ||||||||||
Fasken - Eagle Ford | 10.3 | 77.3 | 87.6 | 40.0 | % | — | % | 12.5 | % | 0.2 | % | ||||||||||
Other South Texas | 4.3 | — | 4.3 | 1.9 | % | 47.9 | % | 2.4 | % | 50.1 | % | ||||||||||
Total South Texas | 50.9 | 123.8 | 174.7 | 79.6 | % | 76.7 | % | ||||||||||||||
Southeast Louisiana | 7.5 | 6.7 | 14.2 | 6.5 | % | 86.2 | % | 15.3 | % | 87.6 | % | ||||||||||
Central Louisiana | 4.4 | 25.8 | 30.2 | 13.8 | % | 71.4 | % | 7.6 | % | 67.1 | % | ||||||||||
Other | 0.1 | — | 0.1 | 0.1 | % | 0.6 | % | 0.4 | % | 35.6 | % | ||||||||||
Total | 62.9 | 156.3 | 219.2 | 100.0 | % | 38.0 | % | 100.0 | % | 53.2 | % | ||||||||||
8
Focus Areas
Our operations are primarily focused in three core areas identified as South Texas, Southeast Louisiana and Central Louisiana. In addition, we have a strategic growth area with acreage in the Four Corners area of southwest Colorado. South Texas is the oldest of our core areas, with our operations first established in the AWP field in 1989 and subsequently expanded with the acquisition of the Sun TSH and Fasken area during 2007. Operations in our Central Louisiana area began in mid-1998 when we acquired the Masters Creek field in Louisiana, later adding the South Bearhead Creek field in Louisiana in late 2005. The Southeast Louisiana area was established when we acquired majority interests in producing properties in the Lake Washington field in early 2001 and in the Bay de Chene field in December 2004.
South Texas
AWP - Eagle Ford. During 2013, the Company drilled 20 wells in our AWP Eagle Ford field, of which one was a joint venture well. The Company owns a 50% working interest in joint venture wells. All wells in this field were drilled and are operated by Swift Energy. At December 31, 2013, we had identified 104 proved undeveloped locations. Our December 31, 2013 proved reserves in this formation are 30% natural gas, 18% NGLs, and 52% oil on a Boe basis.
AWP - Olmos. In the Olmos formation, from which the Company has been producing since 1989, we drilled three horizontal Olmos wells in 2013. These wells were all operated and 100% owned by Swift Energy. We operate wells producing oil and natural gas from the Olmos sand formation at depths from 9,000 to 11,500 feet. Our South Texas reserves in this formation are approximately 59% natural gas, 31% NGLs, and 11% oil on a Boe basis. At December 31, 2013, we had 7 proved undeveloped locations in the Olmos.
Artesia Wells - Eagle Ford. During 2013, the Company drilled 14 operated wells in the Artesia Wells Eagle Ford area. These wells were drilled and are operated by Swift Energy. Our December 31, 2013 proved reserves in this formation are 51% natural gas, 38% NGLs, and 11% oil on a Boe basis. At December 31, 2013, we had identified 35 proved undeveloped locations.
Fasken - Eagle Ford. During 2013, the Company drilled five operated wells in the Fasken Eagle Ford area. Our reserves in this Eagle Ford formation are 100% natural gas. At December 31, 2013, we had identified 58 proved undeveloped locations.
Pursuit of Eagle Ford Joint Venture. We are currently negotiating a joint venture arrangement with prospective partner(s) in order to monetize our highest value acreage in our Eagle Ford natural gas properties, while at the same time creating opportunities to accelerate development of these properties in South Texas. Entering into a joint venture agreement would accelerate drilling and offer additional capital that we could deploy for our development program in other areas. We are targeting completion of this initiative by the end of the second quarter of 2014.
Southeast Louisiana
Lake Washington. As of December 31, 2013, we owned drilling and production rights in 16,697 net acres in the Lake Washington field located in Southeast Louisiana near shore waters within Plaquemines Parish. Since its discovery in the 1930's, the field has produced over 300 million Boe from multiple stacked Miocene sand layers radiating outward from a central salt dome and ranging in depth from 2,000 feet to 13,000 feet. The area around the dome is heavily faulted, thereby creating a large number of potential hydrocarbon traps. Approximately 92% of our proved reserves of 12.0 MMBoe in this field as of December 31, 2013, consisted of oil and NGLs. Oil and natural gas is gathered to several platforms located in water depths from 2 to 12 feet, with drilling and workover operations performed with rigs on barges.
In 2013 we drilled 2 development wells of which one was a dry hole. In our production optimization program we performed 17 recompletions and numerous production enhancement operations including sliding sleeve changes, gas lift modifications and well stimulations. At December 31, 2013, we had 44 proved undeveloped locations in this field.
Bay de Chene. The Bay de Chene field is located along the border of Jefferson Parish and Lafourche Parish in near shore waters approximately 25 miles from the Lake Washington field. As of December 31, 2013, we owned drilling and production rights in approximately 14,254 net acres in the Bay de Chene field. Like Lake Washington, it produces from Miocene sands surrounding a central salt dome. At December 31, 2013, we had one proved undeveloped location in the Bay de Chene field.
Central Louisiana
Sales and Planned Dispositions. In May 2013, we disposed of our Brookeland field in Texas for net cash proceeds of approximately $6.0 million and the buyer's assumption of our $11.3 million asset retirement obligation. In August 2013, we
9
announced plans to divest our Austin Chalk and Wilcox assets in Louisiana to intensify our focus and build upon the operational success of our assets in South Texas. For further discussion please see the 2014 Strategy and Outlook section in Item 7. Management’s Discussion and Analysis of Financial Condition and Results of Operations.
Burr Ferry. The Company has 98,671 net acres in the Burr Ferry field predominately located in Vernon Parish, Louisiana. A majority of this acreage is subject to a joint venture agreement with a large independent oil and gas producer, which terminates mid-year 2014. We entered into this joint venture agreement in 2009 for development and exploitation and hold a 50% working interest in the joint venture. During 2013, the Company participated in drilling two non-operated wells. The reserves are approximately 67% oil and NGLs. We have identified 20 proved undeveloped locations in this field.
Masters Creek. As of December 31, 2013, we owned drilling and production rights in 50,057 net acres in the Masters Creek field. The Masters Creek field is located in Vernon Parish and Rapides Parish, Louisiana. Oil and natural gas are produced from the Austin Chalk formation within natural fractures encountered in the lateral borehole sections from depths of 11,500 to 13,500 feet. The reserves are approximately 65% oil and NGLs.
South Bearhead Creek. The South Bearhead Creek field is located in Beauregard Parish, Louisiana approximately 50 miles south of our Masters Creek field and 30 miles north of Lake Charles, Louisiana. The field was discovered in 1958 and is a large east-west trending anticline closure with cumulative production of over 4 million Boe. As of December 31, 2013, we owned drilling and production rights in 7,327 net acres in this field. Wells drilled in this field are completed in a multiple set of separate sands in the Wilcox formation. In 2013, we drilled one horizontal well in this field. At December 31, 2013, we had 31 proved undeveloped locations in this field.
Other
Four Corners. At December 31, 2013, we had approximately 59,201 net acres leased in the Four Corners area of southwest Colorado. This high quality, cost effective and meaningful acreage position prospective for shallow, oil-rich, Niobrara production, is primarily in La Plata County, Colorado. In 2013, we drilled one exploratory well and completion of the this well is pending until all of the tests, core samples and logs are fully analyzed and an appropriate completion approach can be designed.
Oil and Natural Gas Reserves
The following tables present information regarding proved reserves of oil and natural gas attributable to our interests in producing properties as of December 31, 2013, 2012 and 2011. The information set forth in the tables regarding reserves is based on proved reserves reports we have prepared. Our Chief Reservoir Engineer, the primary technical person responsible for overseeing the preparation of our 2013 reserves estimates, holds a bachelor's degree in geology, is a member of the Society of Petroleum Engineers and the Society of Professional Well Log Analysts, and has over 25 years of experience in petrophysical analysis, reservoir engineering, and reserves estimation. H.J. Gruy and Associates, Inc., Houston, Texas, independent petroleum engineers, has audited 97%, 96% and 94% of our proved reserves for the years ended December 31, 2013, 2012 and 2011. The audit by H.J. Gruy and Associates, Inc. conformed to the meaning of the term “reserves audit” as presented in Regulation S-K, Item 1202. The technical person at H.J. Gruy and Associates, Inc. primarily responsible for overseeing the audit, is a Licensed Professional Engineer, holds a degree in petroleum engineering, is past Chairman of the Gulf Coast Section of the Society of Petroleum Engineers, is past President of the Society of Petroleum Evaluation Engineers and has over 30 year's worth of experience overseeing reserves audits. Based on its audits, it is the judgment of H.J. Gruy and Associates, Inc. that Swift Energy used appropriate engineering, geologic, and evaluation principles and methods that are consistent with practices generally accepted in the petroleum industry.
The reserves estimation process involves asset team senior petroleum reservoir engineers whose duty is to prepare estimates of reserves in accordance with the Commission's rules, regulations and guidelines, and who are part of multi-disciplinary teams responsible for each of the Company's major core asset areas. The multi-disciplinary teams consist of experienced reservoir engineers, geologists and other oil and gas professionals. A majority of our asset team reservoir engineers involved in the reserves estimation process have over 10 years reservoir engineering experience. The Chief Reservoir Engineer supervises this process with multiple levels of review and reconciliation of reserves estimates to ensure they conform to SEC guidelines. Reserves data is also reported to and reviewed by senior management and the Board of Directors on a periodic basis. At year-end, a reserves audit is performed by the third-party engineering firm, H.J. Gruy and Associates, Inc., to ensure the integrity and reasonableness of our reserves estimates. In addition, our independent Board members meet with H.J. Gruy and Associates, Inc. in executive session at least annually to review the annual reserves audit report and the overall reserves audit process.
A reserves audit and a financial audit are separate activities with unique and different processes and results. As currently defined by the U.S. Securities and Exchange Commission within Regulation S-K, Item 1202, a reserves audit is the process of
10
reviewing certain of the pertinent facts interpreted and assumptions underlying a reserves estimate prepared by another party and the rendering of an opinion about the appropriateness of the methodologies employed, the adequacy and quality of the data relied upon, the depth and thoroughness of the reserves estimation process, the classification of reserves appropriate to the relevant definitions used, and the reasonableness of the estimated reserves quantities. A financial audit includes examining, on a test basis, evidence supporting the amounts and disclosures in the financial statements. A financial audit also includes assessing the accounting principles used and significant estimates made by management, as well as evaluating the overall financial statement presentation.
Estimates of future net revenues from our proved reserves and their PV-10 Value, for the years ended December 31, 2013, 2012 and 2011 are made based on the preceding 12-months' average adjusted price after differentials based on closing prices on the first business day of each month, excluding the effects of hedging and are held constant, for that year's reserves calculation, throughout the life of the properties, except where such guidelines permit alternate treatment, including, in the case of natural gas contracts, the use of fixed and determinable contractual price escalations. We have interests in certain tracts that are estimated to have additional hydrocarbon reserves that cannot be classified as proved and are not reflected in the following tables.
The following prices are used to estimate our year-end PV-10 Value. The 12-month 2013 average adjusted prices after differentials for operations were $3.41 per Mcf of natural gas, $104.38 per barrel of oil, and $31.68 per barrel of NGL, compared to $2.71 per Mcf of natural gas, $103.64 per barrel of oil, and $46.22 per barrel of NGL at year-end 2012 and $3.89 per Mcf of natural gas, $103.87 per barrel of oil, and $49.55 per barrel of NGL at year-end 2011.
The following tables set forth estimates of future net revenues presented on the basis of unescalated prices and costs in accordance with criteria prescribed by the SEC and their PV-10 Value as of December 31, 2013, 2012 and 2011. Operating costs, development costs, asset retirement obligation costs, and certain production-related taxes were deducted in arriving at the estimated future net revenues. No provision was made for income taxes. The estimates of future net revenues and their present value differ in this respect from the standardized measure of discounted future net cash flows set forth in supplemental information to our consolidated financial statements (the "Standardized Measure"), which is calculated after provision for future income taxes. The following amounts shown in MBoe below are based on a natural gas conversion factor of 6 Mcf to 1 Boe:
Estimated Proved Natural Gas, Oil and NGL Reserves | As of December 31, | |||||||||||
2013 | 2012 | 2011 | ||||||||||
Natural gas reserves (MMcf): | ||||||||||||
Proved developed | 197,816 | 195,643 | 184,355 | |||||||||
Proved undeveloped | 617,309 | 401,926 | 432,404 | |||||||||
Total | 815,125 | 597,569 | 616,759 | |||||||||
Oil reserves (MBbl): | ||||||||||||
Proved developed | 16,884 | 17,780 | 13,840 | |||||||||
Proved undeveloped | 36,110 | 25,479 | 17,091 | |||||||||
Total | 52,994 | 43,259 | 30,931 | |||||||||
NGL reserves (MBbl): | ||||||||||||
Proved developed | 13,059 | 15,328 | 11,078 | |||||||||
Proved undeveloped | 17,320 | 33,891 | 14,759 | |||||||||
Total | 30,379 | 49,219 | 25,837 | |||||||||
Total Estimated Reserves (MBoe) | 219,227 | 192,073 | 159,562 | |||||||||
Estimated Discounted Present Value of Proved Reserves (in millions) | ||||||||||||
Proved developed | $ | 1,028 | $ | 1,201 | $ | 1,075 | ||||||
Proved undeveloped | 1,397 | 1,083 | 843 | |||||||||
PV-10 Value | $ | 2,425 | $ | 2,284 | $ | 1,918 | ||||||
The PV-10 Values as of December 31, 2013, 2012 and 2011 are net of $87.0 million, $89.6 million, and $75.0 million of asset retirement obligation liabilities, respectively.
Proved reserves are estimates of hydrocarbons to be recovered in the future. Reserves estimation is a subjective process of estimating the sizes of underground accumulations of oil and natural gas that cannot be measured in an exact way. The accuracy of any reserves estimate is a function of the quality of available data and of engineering and geological interpretation and judgment.
11
Reserves reports of other engineers might differ from the reports contained herein. Results of drilling, testing, and production subsequent to the date of the estimate may justify revision of such estimates. Future prices received for the sale of oil and natural gas may be different from those used in preparing these reports. The amounts and timing of future operating and development costs may also differ from those used. Accordingly, reserves estimates are often different from the quantities of oil and natural gas that are ultimately recovered. There can be no assurance that these estimates are accurate predictions of the present value of future net cash flows from oil and natural gas reserves.
PV-10 Value is a non-GAAP measure. The closest GAAP measure to the PV-10 Value is the Standardized Measure. We believe the PV-10 Value is a useful supplemental disclosure to the Standardized Measure because the PV-10 Value is a widely used measure within the industry and is commonly used by securities analysts, banks and credit rating agencies to evaluate the value of proved reserves on a comparative basis across companies or specific properties. We use the PV-10 Value in our ceiling test computations, for comparison against our debt balances, to evaluate properties that are bought and sold and to assess the potential return on investment in our oil and gas properties. PV-10 Value is not a measure of financial or operating performance under GAAP, nor should it be considered in isolation or as a substitute for the Standardized Measure. Our PV-10 Value and the Standardized Measure do not purport to represent the fair value of our oil and natural gas reserves. The following table provides a reconciliation between the PV-10 Value and the Standardized Measure.
As of December 31, | |||||||||||
(in millions) | 2013 | 2012 | 2011 | ||||||||
PV-10 Value | $ | 2,425 | $ | 2,284 | $ | 1,918 | |||||
Future income taxes (discounted at 10%) | (423 | ) | (412 | ) | (400 | ) | |||||
Standardized Measure of Discounted Future Net Cash Flows relating to oil and natural gas reserves | $ | 2,002 | $ | 1,872 | $ | 1,518 | |||||
Proved Undeveloped Reserves
The following table sets forth the aging of our proved undeveloped reserves as of December 31, 2013:
Year Added | Volume (MMBoe) | % of PUD Volumes | |||
2013 | 140.7 | 90 | % | ||
2012 | 10.4 | 7 | % | ||
2011 | 0.8 | — | % | ||
2010 | 2.4 | 2 | % | ||
2009 | 0.6 | — | % | ||
Prior to 2009 | 1.4 | 1 | % | ||
Total | 156.3 | 100 | % | ||
We expect to develop the proved undeveloped reserves listed above, excluding certain Southeast Louisiana reserves noted below, within five years of when they were initially disclosed. Included in the table above are proved undeveloped reserves located in Southeast Louisiana which are older than five years from initial disclosure date, and development is delayed as a result of external factors related to the physical operating conditions in the field. We must prudently wait for down structure wells in the field to water out before up structure locations are drilled to efficiently drain the reservoirs. We believe these conditions qualify these proved undeveloped reserves for an exemption from the five year development rule.
During 2013, we increased our proved undeveloped reserves by 72 MMBoe based on the results of the drilling program conducted during the year, primarily due to new wells drilled in the Fasken Eagle Ford area. We also recorded net downward revisions during the year of 21 MMBoe, which were due to changing economics and performance issues in the Artesia Wells Eagle Ford field and the release of natural gas acreage in our AWP Olmos field. These negative revisions were partially offset by net upward revisions in our other areas. We also incurred approximately $247 million in capital expenditures during the year to convert 21 MMBoe of our December 31, 2012 proved undeveloped reserves to proved developed reserves, primarily in the Artesia Wells and AWP Eagle Ford areas.
The PV-10 Value from our proved undeveloped reserves was $1.4 billion at December 31, 2013, which was approximately 58% of our total PV-10 Value of $2.4 billion. The PV-10 Value of our proved undeveloped reserves, by year of booking, was 81% in 2013, 5% in 2012, 2% in 2011, 7% in 2010, 1% in 2009 and 4% prior to 2009.
12
Sensitivity of Reserves to Pricing
As of December 31, 2013, a 5% increase in oil and NGL pricing would increase our total estimated proved reserves of 219.2 MMBoe by approximately 0.3 MMBoe, and would increase the PV-10 Value of $2.4 billion by approximately $165 million. Similarly, a 5% decrease in oil and NGL pricing would decrease our total estimated proved reserves by approximately 0.5 MMBoe and would decrease the PV-10 Value by approximately $164 million.
As of December 31, 2013, a 5% increase in natural gas pricing would increase our total estimated proved reserves by approximately 0.3 MMBoe and would increase the PV-10 Value by approximately $76 million. Similarly, a 5% decrease in natural gas pricing would decrease our total estimated proved reserves by approximately 0.4 MMBoe and would decrease the PV-10 Value by approximately $76 million.
Oil and Gas Wells
The following table sets forth the total gross and net wells in which we owned an interest at the following dates:
Oil Wells | Gas Wells | Total Wells(1) | ||||||
December 31, 2013 | ||||||||
Gross | 345 | 719 | 1,064 | |||||
Net | 325.1 | 701.2 | 1,026.3 | |||||
December 31, 2012 | ||||||||
Gross | 375 | 744 | 1,119 | |||||
Net | 345.9 | 713.5 | 1,059.4 | |||||
December 31, 2011 | ||||||||
Gross | 342 | 729 | 1,071 | |||||
Net | 316.5 | 699.2 | 1,015.7 | |||||
(1) | Excludes 60, 59 and 38 service wells in 2013, 2012 and 2011. |
Oil and Gas Acreage
The following table sets forth the developed and undeveloped leasehold acreage held by us at December 31, 2013:
Developed | Undeveloped | ||||||||||
Gross | Net | Gross | Net | ||||||||
Colorado | — | — | 79,818 | 59,201 | |||||||
Louisiana (1) | 125,503 | 107,936 | 110,956 | 90,005 | |||||||
Texas (2) | 61,300 | 59,800 | 6,800 | 5,500 | |||||||
Wyoming | — | — | 8,957 | 8,174 | |||||||
Total | 186,803 | 167,736 | 206,531 | 162,880 | |||||||
(1) | The Company holds the fee mineral (royalty) interest in a portion of the acreage located in Central Louisiana. The above table includes acreage where Swift Energy is the fee mineral owner as well as a working interest owner. This acreage included in the above table totals 66,027 gross and 65,905 net undeveloped acres and 20,174 gross and net developed acres. The Company also owns fee mineral interest in approximately 16,295 acres that are currently unleased and not included in the table above. Swift owns a total of 86,201 mineral acres. |
(2) | In South Texas a substantial portion of our Eagle Ford and Olmos acreage overlaps. In most cases the Eagle Ford and Olmos rights are contracted under separate lease agreements. For the purposes of the above table, a surface acre where we have leased both the Eagle Ford and Olmos rights is counted as a single acre. Acreage which is developed in any formation is counted in the developed acreage above, even though there may also be undeveloped acreage in other formations. In the Eagle Ford, we have 37,300 gross and 34,802 net developed acres and 16,500 gross and 10,300 net undeveloped acres. A large portion of our undeveloped Eagle Ford acreage underlies developed Olmos acreage. In the Olmos, we have 59,900 gross and 48,400 net developed acres and 8,000 gross and 8,000 net undeveloped acres. |
As of December 31, 2013, Swift Energy's net undeveloped acreage subject to expiration over the next three years, if not renewed, is approximately 2% in 2014, 6% in 2015 and 8% in 2016. In most cases, acreage scheduled to expire can be held through drilling operations or we can exercise extension options. The exploration potential of all undeveloped acreage is fully
13
evaluated before expiration. In each fiscal year where undeveloped acreage is subject to expiration our intent is to reduce the expirations through either development or extensions, if we believe it is commercially advantageous to do so.
Drilling and Other Exploratory and Development Activities
The following table sets forth the results of our drilling activities during the years ended December 31, 2013, 2012 and 2011:
Gross Wells | Net Wells | |||||||||||||||||||
Year | Type of Well | Total | Producing | Dry | Total | Producing | Dry | |||||||||||||
2013 | Exploratory | 1 | 1 | — | 1.0 | 1.0 | — | |||||||||||||
Development | 47 | 46 | 1 | 45.0 | 44.0 | 1.0 | ||||||||||||||
2012 | Exploratory | — | — | — | — | — | — | |||||||||||||
Development | 71 | 71 | — | 66.2 | 66.2 | — | ||||||||||||||
2011 | Exploratory | — | — | — | — | — | — | |||||||||||||
Development | 44 | 44 | — | 39.6 | 39.6 | — | ||||||||||||||
Present Activities
As of December 31, 2013, we were in the process of drilling four wells in our South Texas Area, in which we own a 100% working interest. We are also currently expanding and/or upgrading three facilities in South Texas to handle additional production volumes expected to come online in 2014. In the Lake Washington field, we have continued the production optimization program to mitigate natural field declines; involving facility modifications, recompletions, stimulations, gas lift enhancements and sliding sleeve shifts to change productive zones.
Operations
We generally seek to be the operator of the wells in which we have a significant economic interest. As operator, we design and manage the development of a well and supervise operation and maintenance activities on a day-to-day basis. We do not own drilling rigs or other oil field services equipment used for drilling or maintaining wells on properties we operate. Independent contractors supervised by us provide this equipment and personnel. We employ drilling, production, and reservoir engineers, geologists, and other specialists who work to improve production rates, increase reserves, and lower the cost of operating our oil and natural gas properties.
Operations on our oil and natural gas properties are customarily administrated in accordance with COPAS guidelines. We charge a monthly per-well supervision fee to the wells we operate including our wells in which we own up to a 100% working interest. Supervision fees vary widely depending on the geographic location and depth of the well and whether the well produces oil or natural gas. The fees for these activities in 2013 totaled $11.6 million and ranged from $374 to $1,898 per well per month.
Fixed and Determinable Commitments
As of December 31, 2013, we had natural gas sales commitments to deliver fixed and determinable quantities of natural gas under term contracts in the amount of 3.7 MMBTU. The sales price is tied to current spot gas prices at the time of delivery. Delivery quantities in excess of the minimums for any given year will proportionally reduce the minimum quantities for subsequent periods. The delivery point is in South Texas, and the Company's proven reserves and production rates in the area significantly exceed the minimum obligations. There is no dedication of production from specific leases under the agreement.
Marketing of Production
We typically sell our oil and natural gas production at market prices near the wellhead or at a central point after gathering and/or processing. We usually sell our natural gas in the spot market on a monthly basis, while we sell our oil at prevailing market prices. We do not refine any oil we produce. For the years ended December 31, 2013, 2012 and 2011, Shell Oil Company and affiliates accounted for 33%, 46% and 49% of our total oil and gas gross receipts, respectively. BP America accounted for approximately 21% of our total oil and gas gross receipts in 2013 while Southcross Energy accounted for approximately 11% of our total oil and gas gross receipts in 2012. Credit losses in each of the last three years were immaterial. Due to the demand for
14
oil and natural gas and the availability of other purchasers, we do not believe that the loss of any single oil or natural gas purchaser or contract would materially affect our revenues.
Our oil production from the Lake Washington field is either delivered into ExxonMobil's crude oil pipeline system or transported on barges for sales to various purchasers at prevailing market prices or at fixed prices tied to the then current NYMEX crude oil contract for the applicable month(s). Historically, our natural gas production from this field is either consumed on the lease or is delivered to El Paso's Southern Natural Gas pipeline system (the segment of line into which Swift Energy delivers its gas was sold to High Point Energy, LLC in 2012) and the processing of natural gas is delivered to Sonat at the Toca Plant.
In 2011, we entered into gas processing and gathering agreements with Southcross Energy for a majority of our natural gas production in the AWP area, replacing agreements with Enterprise Texas Pipeline and Enterprise Hydrocarbons. The processed natural gas liquids are sold to Southcross. The residue gas is sold at prevailing prices to Southcross and other parties at downstream connections on Southcross' system. Other gas production in the AWP area is processed or transported under arrangements with Houston Pipe Line, DCP Midstream and Enterprise. Oil production is transported to market by truck or pipeline and sold at prevailing market prices.
In the Sun TSH and Fasken fields, our oil production is sold at prevailing market prices and transported to market by truck. Natural gas from the fields has historically been delivered either to Enterprise South Texas Gathering or Regency Gas Services. For natural gas delivered to Enterprise, the natural gas is sold to Enterprise with Swift Energy receiving revenues from residue gas sales and processed natural gas liquids. For natural gas delivered to Regency, the natural gas production is transported to a downstream processing plant. We sell the residue gas at prevailing market prices and receive processing revenues from Regency. In the fourth quarter of 2010, Meritage Midstream Services, LLC completed construction of a new pipeline to the Fasken area. We entered into a gathering agreement providing for the transportation of our Eagle Ford production on the new pipeline from Fasken to Kinder Morgan Texas Pipeline, where it is sold at prices tied to monthly and daily natural gas price indices. The Meritage pipeline was sold to Howard Energy in 2012. At Fasken, we also have a connection with the Navarro gathering system into which we may deliver natural gas from time to time.
In 2012, we entered into an agreement with Eagle Ford Gathering LLC that provides for the gathering and processing for almost all of our natural gas production in the Artesia Wells area. The processed natural gas liquids are purchased by Eagle Ford Gathering. The residue gas is sold to various parties at prevailing market prices at connections downstream of the processing facilities. For natural gas deliveries to Enterprise, Enterprise purchases the processed liquids when processing is available, with the residue gas sold at prevailing market prices. In the Artesia Wells area, our oil production is sold at prevailing market prices and transported to market by truck.
Our oil production from the Burr Ferry, Masters Creek and South Bearhead Creek fields is sold to various purchasers at prevailing market prices. Our natural gas production from the Burr Ferry and Masters Creek fields is processed under long term gas processing contracts with Eagle Rock Operating, LLC. The processed liquids and residue gas production are sold in the spot market at prevailing prices. South Bearhead Creek natural gas production is sold into the interstate market on Trunkline Gas Company's pipeline at prevailing market prices. There is field level extraction of a portion of the NGLs in the gas stream prior to delivery to Trunkline. Those NGLs are stored in a pressurized vessel and transported by truck to market for sale at prevailing market prices.
15
The prices in the tables below do not include the effects of hedging. Quarterly prices and hedge adjusted pricing are detailed in the “Management's Discussion and Analysis of Financial Condition and Results of Operations” section of this Form 10-K/A.
The following table summarizes sales volumes, sales prices, and production cost information for our net oil, NGL and natural gas production from our continuing operations for the years ended December 31, 2013, 2012 and 2011.
Year Ended December 31, | ||||||||||||
All Fields | 2013 | 2012 | 2011 | |||||||||
Net Sales Volume: (1) | ||||||||||||
Oil (MBbls) | 3,926 | 3,774 | 3,865 | |||||||||
Natural Gas Liquids (MBbls) | 2,320 | 1,862 | 1,362 | |||||||||
Natural gas (MMcf) (2) | 30,005 | 33,129 | 29,237 | |||||||||
Total (MBoe) | 11,247 | 11,158 | 10,100 | |||||||||
Average Sales Price: (1) | ||||||||||||
Oil (Per Bbl) | $ | 103.42 | $ | 106.17 | $ | 107.00 | ||||||
Natural Gas Liquids (Per Bbl) | $ | 31.39 | $ | 35.07 | $ | 52.13 | ||||||
Natural gas (Per Mcf) | $ | 3.65 | $ | 2.66 | $ | 4.03 | ||||||
Average Production Cost (Per Boe sold) (3) | $ | 10.74 | $ | 10.51 | $ | 10.38 | ||||||
(1) As described in Note 1A to the consolidated financial statements, adjustments for certain previously identified immaterial accounting errors have been made in this Form 10-K/A. Any effect on the historical net sales volumes and unit sales prices were evaluated and deemed to be immaterial to any period presented and therefore not restated.
(2) Excludes gas consumed in operations that is included in reported production volumes of 2,992 MMcf in 2013, 3,257 MMcf in 2012 and 2,561 MMcf in 2011.
(3) Excludes severance and ad valorem taxes.
The following table provides a summary of our sales volumes, average sales prices, and average production costs for our fields with proved reserves greater than 15% of total proved reserves. These fields account for approximately 58% of the Company's proved reserves based on total Boe as of December 31, 2013:
Year Ended December 31, | ||||||||||||
Fasken - Eagle Ford | 2013 | 2012 | 2011 | |||||||||
Net Sales Volume: | ||||||||||||
Oil (MBbls) | — | — | — | |||||||||
Natural Gas Liquids (MBbls) | 3 | 1 | — | |||||||||
Natural gas (MMcf) (1) | 8,571 | 12,346 | 8,109 | |||||||||
Total (MBoe) | 1,432 | 2,059 | 1,352 | |||||||||
Average Sales Price: | ||||||||||||
Oil (Per Bbl) | $ | — | $ | — | $ | — | ||||||
Natural Gas Liquids (Per Bbl) | $ | 35.59 | $ | 37.85 | $ | — | ||||||
Natural gas (Per Mcf) | $ | 3.52 | $ | 2.49 | $ | 3.85 | ||||||
Average Production Cost (Per Boe sold) (2) | $ | 4.28 | $ | 4.09 | $ | 3.57 | ||||||
(1) Excludes gas consumed in operations that is included in reported production volumes of 246 MMcf in 2013, 655 MMcf in 2012 and 520 MMcf in 2011.
(2) Excludes severance and ad valorem taxes.
16
Year Ended December 31, | ||||||||||||
AWP Eagle Ford | 2013 | 2012 | 2011 | |||||||||
Net Sales Volume: | ||||||||||||
Oil (MBbls) | 1,085 | 677 | 400 | |||||||||
Natural Gas Liquids (MBbls) | 399 | 296 | 173 | |||||||||
Natural gas (MMcf) (1) | 3,260 | 2,999 | 3,162 | |||||||||
Total (MBoe) | 2,027 | 1,473 | 1,100 | |||||||||
Average Sales Price: | ||||||||||||
Oil (Per Bbl) | $ | 100.16 | $ | 101.57 | $ | 96.36 | ||||||
Natural Gas Liquids (Per Bbl) | $ | 30.9 | $ | 36.53 | $ | 49.84 | ||||||
Natural gas (Per Mcf) | $ | 3.75 | $ | 2.73 | $ | 4.05 | ||||||
Average Production Cost (Per Boe sold) (2) | $ | 7.31 | $ | 6.43 | $ | 6.93 | ||||||
(1) Excludes gas consumed in operations that is included in reported production volumes of 356 MMcf in 2013, 103 MMcf in 2012 and 49 MMcf in 2011.
(2) Excludes severance and ad valorem taxes.
Risk Management
Our operations are subject to all of the risks normally incident to the exploration for and the production of oil and natural gas, including blowouts, cratering, pipe failure, casing collapse, fires, and adverse weather conditions, each of which could result in severe damage to or destruction of oil and natural gas wells, production facilities or other property, or individual injuries. The oil and natural gas exploration business is also subject to environmental hazards, such as oil spills, natural gas leaks, and ruptures and discharges of toxic substances or gases that could expose us to substantial liability due to pollution and other environmental damage. See “1A. Risk Factors” of this report for more details and for discussion of other risks. We maintain comprehensive insurance coverage, including general liability insurance, operators extra expense insurance, and property damage insurance. Our standing Insurable Risk Adviser Team, which includes individuals from operations, drilling, facilities, reserves, legal, HSE and finance meets regularly to evaluate risks, review property values, review and monitor claims, review market conditions and assist with the selection of coverages. We believe that our insurance is adequate and customary for companies of a similar size engaged in comparable operations, but if a significant accident or other event occurs that is uninsured or not fully covered by insurance, it could adversely affect us. See Item 1A. - Risk Factors.
Commodity Risk
The oil and gas industry is affected by the volatility of commodity prices. Realized commodity prices received for such production are primarily driven by the prevailing worldwide price for crude oil and spot prices applicable to natural gas. We have a price-risk management policy to use derivative instruments to protect against declines in oil and natural gas prices.
At December 31, 2013, we had derivative instruments in place for natural gas, natural gas basis and oil volumes. For additional discussion related to our price-risk management policy, refer to Note 1 of these consolidated financial statements.
Competition
We operate in a highly competitive environment, competing with major integrated and independent energy companies for desirable oil and natural gas properties, as well as for equipment, labor, and materials required to develop and operate such properties. Many of these competitors have financial and technological resources substantially greater than ours. The market for oil and natural gas properties is highly competitive and we may lack technological information or expertise available to other bidders. We may incur higher costs or be unable to acquire and develop desirable properties at costs we consider reasonable because of this competition. Our ability to replace and expand our reserves base depends on our continued ability to attract and retain quality personnel and identify and acquire suitable producing properties and prospects for future drilling and acquisition.
17
Federal Leases
Some of our properties are located on federal oil and natural gas leases administered by various federal agencies, including the Bureau of Land Management. Various regulations and administrative orders affect the terms of leases, and in turn may affect our exploration and development plans, methods of operation, and related matters.
Litigation
In the ordinary course of business, we have been party to various legal actions, which arise primarily from our activities as operator of oil and natural gas wells. In our opinion, the outcome of any such currently pending legal actions will not have a material adverse effect on our financial position or results of operations.
Employees
At December 31, 2013, we employed 313 persons. None of our employees are represented by a union. Relations with employees are considered to be good.
Facilities
At December 31, 2013, we occupied approximately 202,355 square feet of office space at 16825 Northchase Drive, Houston, Texas, under a lease expiring February 2015. In February 2014, we amended and extended the lease through November 2015. We also have field offices in various locations from which our employees supervise local oil and natural gas operations.
Available Information
Our annual reports on Form 10-K, quarterly reports on Form 10-Q, current reports on Form 8-K, amendments to those reports, changes in and stock ownership of our directors and executive officers, together with other documents filed with the Securities and Exchange Commission under the Securities Exchange Act can be accessed free of charge on our web site at www.swiftenergy.com as soon as reasonably practicable after we electronically file these reports with the SEC. All exhibits and supplemental schedules to these reports are available free of charge through the SEC web site at www.sec.gov. In addition, we have adopted a Code of Ethics for Senior Financial Officers and the Principal Executive Officers. We have posted this Code of Ethics on our website, where we also intend to post any waivers from or amendments to this Code of Ethics.
18
Item 1A. Risk Factors
The nature of the business activities conducted by Swift Energy subjects it to certain hazards and risks. The following is a summary of all the material risks relating to our business activities.
Oil and natural gas prices are volatile. A substantial decrease in oil and natural gas prices would adversely affect our financial results.
Our future revenues, net income, cash flow, and the value of our oil and natural gas properties depend primarily upon the prices we receive for our oil and natural gas production. Oil and natural gas prices historically have been volatile and will likely continue to be volatile in the future. Oil and natural gas prices could drop precipitously in a short period of time. The prices for oil and natural gas are subject to wide fluctuation in response to relatively minor changes in the supply of and demand for oil and natural gas, market uncertainty, worldwide economic conditions, weather conditions, currency exchange rates, and political conditions (particularly those in major oil producing regions, especially the Middle East).
A significant decrease in price levels for either oil or gas would negatively affect us in several ways, including:
• | our cash flow would be reduced, decreasing funds available for capital expenditures employed to increase production or replace reserves; |
• | certain reserves would no longer be economic to produce, leading to both lower cash flow and proved reserves; |
• | our lenders could reduce the borrowing base under our bank credit facility because of lower oil and natural gas reserves values, reducing our liquidity and possibly requiring mandatory loan repayments; |
• | such a reduction may result in a downward adjustment to our estimated proved reserves, and require write-downs of our properties; and |
• | access to other sources of capital, such as equity or long term debt markets, could be severely limited or unavailable in a low price environment. |
We have incurred a write-down of the carrying values of our properties in the current year and could incur additional write-downs in the future.
The SEC accounting rules require that on a quarterly basis we review the carrying value of our oil and natural gas properties for possible write-down or impairment. Any capital costs in excess of the ceiling must be permanently written down. We reported a non-cash write-down on a before-tax basis of $46.9 million ($30.0 million after-tax) in the fourth quarter of 2013 on our oil and gas properties. If oil and natural gas prices decline from the prices used in the Ceiling Test, even if only for a short period, it is reasonably possible that additional non-cash write-downs of oil and gas properties would occur in the future. If future capital expenditures out pace future discounted net cash flows in our reserve calculations or if we have significant declines in our oil and natural gas reserves volumes, which also reduces our estimate of discounted future net cash flows from proved oil and natural gas reserves, non-cash write-downs of our oil and natural gas properties could occur in the future.
If we cannot replace our reserves, our revenues and financial condition will suffer.
Unless we successfully replace our reserves, our long-term production will decline, which could result in lower revenues and cash flow. When our capital expenditures are limited to funding from our cash flow in lower commodity price environments, or when oil and natural gas prices decrease, our cash flow decreases, resulting in less available cash to drill and replace our reserves and an increased need to draw on our bank credit facility. Even if we have the capital to drill, unsuccessful wells can hurt our efforts to replace reserves. Additionally, lower oil and natural gas prices can have the effect of lowering our reserves estimates and the number of economically viable prospects that we have to drill.
Our business depends on oil and natural gas transportation facilities, some of which are owned by others.
The marketability of our oil and natural gas production depends in part on the availability, proximity, and capacity of pipeline systems owned by third parties an area in which we have been affected by constraints for periods of time. The unavailability of or lack of available capacity on these systems and facilities could result in the shut-in of producing wells or the delay or discontinuance of development plans for properties. Although we have some contractual control over the transportation of our product, material changes in these business relationships could materially affect our operations. Federal and state regulation of oil and natural gas production and transportation, tax and energy policies, changes in supply and demand, pipeline pressures, damage to or destruction of pipelines and general economic conditions could adversely affect our ability to produce, gather and transport oil and natural gas.
19
Estimates of proved reserves are uncertain, and revenues from production may vary significantly from expectations.
The quantities and values of our proved reserves included in this report are only estimates and subject to numerous uncertainties. The accuracy of any reserves estimate is a function of the quality of available data and of engineering and geological interpretation. These estimates depend on assumptions regarding quantities and production rates of recoverable oil and natural gas reserves, future prices for oil and natural gas, timing and amounts of development expenditures and operating expenses, all of which will vary from those assumed in our estimates. If the variances in these assumptions are significant, many of which are based upon extrinsic events we cannot control, they could significantly affect these estimates.
Any significant variance from the assumptions used could result in the actual amounts of oil and natural gas ultimately recovered and future net cash flows being materially different from the estimates in our reserves reports. In addition, results of drilling, testing, production, and changes in prices after the date of the estimates of our reserves may result in substantial downward revisions. These estimates may not accurately predict the present value of future net cash flows from our oil and natural gas reserves.
At December 31, 2013, approximately 71% of our estimated proved reserves were undeveloped. Recovery of undeveloped reserves generally requires significant capital expenditures and successful drilling operations. The reserves data assumes that we can and will make these expenditures and conduct these operations successfully, which may not occur.
Our development and exploration operations require substantial capital and we may be unable to obtain needed capital at satisfactory levels, which could lead to declines in our cash flow or in our oil and natural gas reserves, or a loss of properties.
The oil and natural gas industry is capital intensive. We make and expect to continue to make substantial capital expenditures in our business and operations for the exploration for and development, production and acquisition of oil and natural gas reserves. In 2013, our total capital expenditures, including expenditures for leasehold acquisitions, drilling and infrastructure, were approximately $539 million.
We intend to finance our future capital expenditures with cash flow from operations, proceeds from asset dispositions and/or joint ventures and borrowings under our revolving credit facility. Our cash flow from operations and access to capital are subject to a number of variables, including:
•our proved reserves;
•the volume of oil and natural gas we are able to produce from existing wells;
•the prices at which our oil and natural gas are sold;
•our ability to acquire, located and produce new reserves; and
•our ability to borrow under our credit facility.
We cannot guarantee that our operations and other capital resources will provide cash in sufficient amounts to maintain planned or future levels of capital expenditures. If we are unable to fund our capital requirements, we may be required to curtail our operations relating to the exploration and development of our prospects, which in turn could lead to declines in our cash flow, or in our oil and natural gas reserves, or in a loss of properties; or we may be otherwise unable to implement our development plan, complete acquisitions or take advantage of business opportunities or respond to competitive pressures, any of which could have a material adverse effect on our production, revenues and results of operations. In addition, a delay in or the failure to complete proposed or future infrastructure projects could delay or eliminate potential efficiencies and related cost savings.
Our Southeast Louisiana core areas could occasionally be affected by hurricane activity in the Gulf of Mexico, resulting in pipeline outages or damage to production facilities, causing production delays and/or significant repair costs.
Approximately 7% of our 2013 reserves and 15% of our 2013 production was located in our Southeast Louisiana core areas. Increased hurricane activity over the past six years has resulted in production curtailments and physical damage to our Gulf Coast operations. For example, a significant percentage of our production was shut down by Hurricanes Katrina and Rita in 2005, by Hurricanes Gustav and Ike in 2008, and by Hurricane Isaac in 2012. Due to increased costs after the 2005 hurricanes, we no longer carry business interruption insurance (loss of production). If hurricanes damage the Gulf Coast region where we have a significant percentage of our operations, our cash flow would suffer. This decrease in cash flow, depending on the extent of the decrease, could reduce the funds we would have available for capital expenditures and reduce our ability to borrow money or raise additional capital.
20
A worldwide financial downturn or negative credit market conditions may have lasting effects on our liquidity,
business and financial condition that we cannot control or predict.
Global economic growth drives demand for energy from all sources, including fossil fuels. A lower future economic growth rate is likely to result in decreased demand growth for our crude oil and natural gas production. A decrease in demand, notwithstanding impacts from other factors, could potentially result in lower commodity prices, which would reduce our cash flows from operations, our profitability and our liquidity and financial position.
Global economic conditions may adversely affect the financial viability of and increase the credit risk associated with our purchasers, suppliers, insurers, and commodity derivative counterparties to perform under the terms of contracts or financial arrangements we have with them. Although we have heightened our level of scrutiny of our contractual counterparties, our assessment of the risk of non-performance by various parties is subject to sudden swings in the financial and credit markets. This same crisis may adversely impact insurers and their ability to pay current and future insurance claims that we may have.
Our future access to capital could be limited due to tightening credit markets that could affect our ability to fund our future capital projects. Although during 2012 we extended our line of credit through November 2017 and although we had an outstanding balance under that line of credit as of December 31, 2013 of $265 million, long-term restrictions, freezing of the capital markets and legislation related to financial and banking reform may affect the availability or pricing of our renewal of the line of credit.
Our oil and natural gas exploration and production business involves high risks and we may suffer uninsured losses.
These risks include blowouts, explosions, adverse weather effects and pollution and other environmental damage, any of which could result in substantial losses to the Company due to injury or loss of life, damage to or destruction of wells, production facilities or other property, clean-up responsibilities, regulatory investigations and penalties and suspension of operations. Although the Company currently maintains insurance coverage that it considers reasonable and that is similar to that maintained by comparable companies in the oil and gas industry, it is not fully insured against certain of these risks, such as business interruption, either because such insurance is not available or because of the high premium costs and deductibles associated with obtaining and carrying such insurance.
Our level of indebtedness may adversely affect operations and reduce our financial flexibility.
As of December 31, 2013, our total debt comprised approximately 52% of our total capitalization. Although our bank credit facility and indentures limit our ability and the ability of our restricted subsidiaries to incur additional indebtedness, we will be permitted to incur significant additional indebtedness, including secured indebtedness, in the future if specified conditions are satisfied. Higher levels of indebtedness could negatively affect us by requiring us to dedicate a substantial portion of our cash flow to the payment of interest, and limiting our ability to obtain financing or raise equity capital in the future.
Any significant reduction in our borrowing base under our corporate revolving credit facility as a result of the periodic borrowing base redeterminations or otherwise may negatively impact our ability to fund our operations, and we may not have sufficient funds to repay borrowings under our revolving credit facility if required as a result of a borrowing base redetermination.
Availability under our corporate revolving credit facility is currently subject to a borrowing base of $450 million. As of December 31, 2013, we had outstanding borrowings of $265 million. We intend to continue borrowing under our revolving credit facility in the future. The borrowing base is subject to periodic redetermination and is based in part on oil, NGL and natural gas prices and the value of properties owned, which could be reduced in the case of asset disposition. Any significant reduction in our borrowing base as a result of such redeterminations or otherwise may negatively impact our liquidity and our ability to fund our operations. Further, if the outstanding borrowings under our revolving credit facility were to exceed the borrowing base as a result of such redetermination, we would be required to repay indebtedness in excess of the newly established borrowing base, or we might need to further secure the debt with additional collateral. Our ability to meet any debt obligations in the future depends on our future performance. General business, economic, financial and product pricing conditions, along with other factors, affect our future performance, and many of these factors are beyond our control.
Federal legislation and state legislative and regulatory initiatives relating to hydraulic fracturing could result in increased costs and additional operating restrictions or delays.
Hydraulic fracturing using fluids other than diesel is currently exempt from regulation under the federal Safe Drinking Water Act, but opponents of hydraulic fracturing have called for further study of the technique's environmental effects and, in some cases, a moratorium on the use of the technique. Various committees of Congress have been investigating hydraulic fracturing
21
practices and several proposals have been submitted to Congress that, if implemented, would subject all hydraulic fracturing to regulation under the Safe Drinking Water Act. Further, the EPA's Office of Research and Development (ORD) is conducting a scientific study to investigate the possible relationships between hydraulic fracturing and drinking water. Several states have adopted or are otherwise considering legislation to regulate hydraulic fracturing practices, including restrictions on its use in environmentally sensitive areas. Some municipalities have significantly limited or prohibited drilling activities, or are considering doing so.
Although it is not possible at this time to predict the final outcome of the ORD's study or the requirements of any additional federal or state legislation or regulation regarding hydraulic fracturing, any new federal or state, or local restrictions on hydraulic fracturing that may be imposed in areas in which we conduct business could significantly increase our operating, capital and compliance costs as well as delay or halt our ability to develop oil and gas reserves.
Drilling wells is speculative and capital intensive.
Developing and exploring properties for oil and natural gas requires significant capital expenditures and involves a high degree of financial risk, including the risk that no commercially productive oil or natural gas reservoirs will be encountered. The budgeted costs of drilling, completing, and operating wells are often exceeded and can increase significantly when drilling costs rise. Drilling may be unsuccessful for many reasons, including title problems, weather, cost overruns, equipment shortages, and mechanical difficulties. Moreover, the successful drilling or completion of an oil or natural gas well does not ensure a profit on investment. Exploratory wells bear a much greater risk of loss than development wells.
We may incur substantial losses and be subject to substantial liability claims as a result of our oil and natural gas operations.
We are not insured against all risks. Losses and liabilities arising from uninsured and underinsured events could materially and adversely affect our business, financial condition, or results of operations. Our oil and natural gas exploration and production activities are subject to all of the operating risks associated with drilling for and producing oil and natural gas, including the possibility of:
• | hurricanes, tropical storms or other natural disasters; |
• | environmental hazards, such as uncontrollable flows of oil, natural gas, brine, well fluids, toxic gas, or other pollution into the environment, including groundwater and shoreline contaminates |
• | abnormally pressured formations; |
• | mechanical difficulties, such as stuck oil field drilling and service tools and casing collapse; |
• | fires and explosions; and |
• | personal injuries and death. |
Any of these risks could adversely affect our ability to conduct operations or result in substantial losses. We may elect not to obtain insurance if we believe that the cost of available insurance is excessive relative to the risks presented, as is the case in our declining business interruption insurance following the hurricanes in 2005. In addition, pollution and environmental risks generally are not fully insurable. If a significant accident or other event occurs and is not fully covered by insurance, it could adversely affect our financial condition.
Prospects that we decide to drill may not yield oil or natural gas in commercially viable quantities.
There is no way to predict in advance of drilling and testing whether any particular prospect will yield oil or natural gas in sufficient quantities, if at all, to recover drilling or completion costs or to be economically viable. The use of seismic data and other technologies and the study of producing fields in the same area will not enable us to know conclusively prior to drilling whether oil or natural gas will be present. We cannot assure you that the analogies we draw from available data from other wells, more fully explored prospects, or producing fields will be applicable to our drilling prospects. In addition, a variety of factors, including geological and market-related, can cause a well to become uneconomical or only marginally economical. For example, if oil and natural gas prices are much lower after we complete a well than when we identified it as a prospect, the completed well may not yield commercially viable quantities.
22
Our use of oil and natural gas price hedging contracts involves credit risk and may limit future revenues from price increases and expose us to risk of financial loss.
From time to time we enter into hedging transactions for our oil and natural gas production to reduce exposure to fluctuations in the price of oil and natural gas, primarily to protect against declines in prices, although we typically enter into only shorter-term hedges, which limits the price protection they provide. Our hedging transactions can consist of financially settled crude oil and natural gas forward sales contracts with major financial institutions as well as crude oil price floors, calls, swaps, collars and participating collars.
We intend to continue entering into these types of hedging transactions in the foreseeable future when appropriate. Hedging transactions expose us to risk of financial loss in some circumstances, including if production is less than expected, the other party to the contract defaults on its obligations, or there is a change in the expected differential between the underlying price in the hedging agreement and actual prices received. Hedging transactions other than floors may limit the benefit we would have otherwise received from increases in the price for oil and natural gas. Additionally, hedging transactions other than floors may expose us to cash margin requirements.
We may have difficulty competing for oil and gas properties, equipment, supplies, oilfield services, and trained and experienced personnel.
We operate in a highly competitive environment, competing with major integrated and independent energy companies for desirable oil and natural gas properties, as well as for the equipment, labor, and materials required to develop and operate such properties. Many of these competitors have financial and technological resources substantially greater than ours. The market for oil and natural gas properties is highly competitive and we may lack technological information or expertise available to other bidders. We may incur higher costs or be unable to acquire and develop desirable properties at costs we consider reasonable because of this competition. As demand increases for equipment, services, and personnel, we may experience increased costs and various shortages and may not be able to obtain the necessary oilfield services and trained personnel.
We operate in a litigious environment.
Some of the jurisdictions within which we operate have proven to be litigious environments. Oil and gas companies, such as us, can be involved in various legal proceedings, such as title, royalty, or contractual disputes, in the ordinary course of business. For example, in the state of Louisiana, oil and gas companies are often the target of “legacy lawsuits,” by which a landowner claims that oil and gas operations, often performed many years ago and by another operator, caused pollution or contamination of a property. Various properties we have owned over the past decades potentially expose us to "legacy lawsuit" claims.
Because we maintain a diversified portfolio of assets the complexity and types of legal procedures with which we may become involved may vary, and we could incur significant legal and support expenses in different jurisdictions. If we are not able to successfully defend ourselves, there could be a delay or even halt in our exploration, development or production activities or other business plans, resulting in a reduction in reserves, loss of production and reduced cash flows. Legal proceedings could result in a substantial liability and/or negative publicity about us and adversely affect the price of our common stock. In addition, legal proceedings distract management and other personnel from their primary responsibilities.
A change in US energy policy can have a significant negative impact on our operations and profitability.
US energy policy and laws and regulations could change quickly. Currently, substantial uncertainty exists about the nature of potential rules and regulations that could impact the sources and uses of energy in the US. We design our exploration and development strategy and related capital investment programs years in advance. As a result, we are hindered in our ability to plan, invest and respond to potential changes in our business. This can result in a reduction of our cash flows and profitability to the extent we are unable to respond to sudden or significant changes in our operating environment due to changes in US energy policy.
Any such future laws and regulations could result in increased costs or additional operating restrictions, and could have an effect on demand for oil and gas or prices at which it can be sold. Until any such legislation or regulations are enacted or adopted, it is not possible to gauge their impact on our future operations or our results of operations and financial condition.
Governmental laws and regulations relating to environmental protection are costly and stringent.
Our exploration, production, and marketing operations are subject to complex and stringent federal, state, and local laws and regulations governing, among other things, the discharge of substances into the environment or otherwise relating to environmental protection. These laws, regulations and related public policy considerations affect the costs, manner, and feasibility of our operations
23
and require us to make significant expenditures in order to comply. Failure to comply with these laws and regulations may result in the assessment of administrative, civil, and criminal penalties, the imposition of investigatory and remedial obligations, and the issuance of injunctions that could limit or prohibit our operations. In addition, some of these laws and regulations may impose joint and several, strict liability for contamination resulting from spills, discharges, and releases of substances, including petroleum hydrocarbons and other wastes, without regard to fault or the legality of the original conduct. Under such laws and regulations, we could be required to remove or remediate previously disposed substances and property contamination, including wastes disposed or released by prior owners or operators. Changes in, or additions to, environmental laws and regulations occur frequently, and any changes or additions that result in more stringent and costly waste handling, storage, transport, disposal, cleanup or other environmental protection requirements could have a material adverse effect on our operations and financial position.
Enactment of legislative or regulatory proposals under consideration could negatively affect our business.
Numerous legislative and regulatory proposals affecting the oil and gas industry have been introduced, are anticipated to be introduced, or are otherwise under consideration, by Congress and various federal agencies. Among these proposals are: (1) climate change/carbon tax legislation introduced in Congress, and EPA regulations to reduce greenhouse gas emissions; (2) proposals contained in the President's budget, along with legislation introduced in Congress (none of which have passed), to impose new taxes on, or repeal various tax deductions available to, oil and gas producers, such as the current tax deductions for intangible drilling and development costs and qualified tertiary injectant expenses which deductions, if eliminated, could raise the cost of energy production, reduce energy investment and affect the economics of oil and gas exploration and production activities; and (3) legislation previously considered by Congress (but not adopted) that would subject the process of hydraulic fracturing to federal regulation under the Safe Drinking Water Act, and new or anticipated Department of Interior and EPA regulations to impose new and more stringent regulatory requirements on hydraulic fracturing activities, particularly those performed on federal lands, and to require disclosure of the chemicals used in the fracturing process. Any of the foregoing described proposals could affect our operations, and the costs thereof. The trend toward stricter standards, increased oversight and regulation and more extensive permit requirements, along with any future laws and regulations, could result in increased costs or additional operating restrictions which could have an effect on demand for oil and natural gas or prices at which it can be sold. However, until such legislation or regulations are enacted or adopted into law and thereafter implemented, it is not possible to gauge their impact on our future operations or our results of operations and financial condition.
Our ability to produce crude oil and natural gas economically and in commercial quantities could be impaired if we are unable to acquire adequate supplies of water for our drilling operations or are unable to dispose of or recycle the water we use economically and in an environmentally safe manner.
Drilling activities require the use of fresh water. For example, the hydraulic fracturing process which we employ to produce commercial quantities of crude oil and natural gas from many reservoirs, including the Eagle Ford Shale, require the use and disposal of significant quantities of water. In certain areas, there may be insufficient aquifer capacity to provide a local source of water for drilling activities. Water must be obtained from other sources and transported to the drilling site.
Our inability to secure sufficient amounts of water, or to dispose of or recycle the water used in our operations, could adversely impact our operations in certain areas. Moreover, the imposition of new environmental initiatives and regulations could include restrictions on our ability to conduct certain operations such as hydraulic fracturing or disposal of waste, including, but not limited to, produced water, drilling fluids and other wastes associated with the exploration, development or production of natural gas.
Compliance with environmental regulations and permit requirements governing the withdrawal, storage and use of surface water or groundwater necessary for hydraulic fracturing of wells may increase our operating costs and cause delays, interruptions or termination of our operations, the extent of which cannot be predicted, all of which could have an adverse effect on our operations and financial condition.
Certain federal income tax deductions currently available with respect to natural gas and oil exploration and development may be eliminated, and additional state taxes on natural gas extraction may be imposed, as a result of future legislation.
In recent years, legislation has been proposed that would, if enacted into law, make significant changes to U.S. federal income tax laws, including the elimination of certain U.S. federal income tax benefits and deductions currently available to oil and gas companies. Such changes include, but are not limited to, (i) the repeal of the percentage depletion allowance for oil and gas properties, (ii) the increase of the amortization period of geological and geophysical expenses, (iii) the elimination of current deductions for intangible drilling and development costs; and (iv) the elimination of the deduction for certain U.S. production activities. It is currently unclear whether any such proposals will be enacted or what form they might possibly take. The passage of such legislation or any other similar change in U.S. federal income tax law could eliminate, reduce or postpone certain tax
24
deductions that are currently available to us, and any such change could negatively affect our financial condition and results of operations.
The recent adoption of derivatives legislation by the U.S. Congress could have an adverse effect on our ability to hedge risks associated with our business.
The Dodd-Frank Act requires the Commodities Futures Trading Commission ("CFTC") and the SEC to promulgate rules and regulations establishing federal oversight and regulation of the over-the-counter derivatives market and entities that participate in that market including swap clearing and trade execution requirements. New or modified rules, regulations or requirements may increase the cost and availability to our counterparties of their hedging and swap positions which they can make available to us, and may further require the counterparties to our derivative instruments to spin off some of their derivative activities to separate entities which may not be as creditworthy as the current counterparties. In addition, for uncleared swaps, the CFTC or federal banking regulators may require end-users to enter into credit support documentation or post margin collateral. Any changes in the regulations of swaps may result in certain market participants deciding to curtail or cease their derivative activities.
While many rules and regulations have been promulgated and are already in effect, other rules and regulations, including the proposed margin rules, remain to be finalized or effectuated, and therefore, the impact of those rules and regulations on us is uncertain at this time. The Dodd-Frank Act, and the rules promulgated thereunder, could (i) significantly increase the cost, or decrease the liquidity, of energy-related derivatives we use to hedge against commodity price fluctuations (including through requirements to post collateral), (ii) materially alter the terms of derivative contracts, (iii) reduce the availability of derivatives to protect against risks we encounter, and (iv) increase our exposure to less creditworthy counterparties. If we reduce our use of derivatives as a result of the Dodd-Frank Act and applicable rules and regulations, our cash flow may become more volatile and less predictable, which could adversely affect our ability to plan for and fund capital expenditures.
Legal proceedings could result in liability affecting our results of operations
Most oil and gas companies, such as us, are involved in various legal proceedings, such as title, royalty, or contractual disputes, in the ordinary course of business. We defend ourselves vigorously in all such matters.
Because we maintain a portfolio of assets in the various areas in which we operate, the complexity and types of legal procedures with which we may become involved may vary, and we could incur significant legal and support expenses in different jurisdictions. If we are not able to successfully defend ourselves, there could be a delay or even halt in our exploration, development or production activities or other business plans, resulting in a reduction in reserves, loss of production and reduced cash flows. Legal proceedings could result in a substantial liability. In addition, legal proceedings distract management and other personnel from their primary responsibilities.
A cyber incident could result in information theft, data corruption, operational disruption, and/or financial loss.
Our business has become increasingly dependent on digital technologies to conduct day-to-day operations, including certain of our exploration, development and production activities. We depend on digital technology to estimate quantities of oil and gas reserves, process and record financial and operating data, analyze seismic and drilling information and in many other activities related to our business. Our technologies, systems and networks may become the target of cyber attacks or information security breaches that could result in the disruption of our business operations. For example, unauthorized access to our seismic data, reserves information or other proprietary information could lead to data corruption, communication interruption, or other operational disruptions in our drilling or production operations.
To date we have not experienced any material losses relating to cyber attacks, however there can be no assurance that we will not suffer such losses in the future. As cyber threats continue to evolve, we may be required to expend significant additional resources to continue to modify or enhance our protective measures or to investigate and remediate any cyber vulnerabilities.
25
Item 1B. Unresolved Staff Comments
None.
Glossary of Abbreviations and Terms
The following abbreviations and terms have the indicated meanings when used in this report:
ASC - Accounting Standards Codification.
Bbl - Barrel or barrels of oil.
Bcf - Billion cubic feet of natural gas.
Bcfe - Billion cubic feet of natural gas equivalent (see Mcfe).
Boe - Barrels of oil equivalent.
Condensate - Liquid hydrocarbons that are found in natural gas wells and condense when brought to the well surface. Condensate is used synonymously with oil.
Developed Oil and Gas Reserves - Oil and natural gas reserves of any category that can be expected to be recovered through existing wells with existing equipment and operating methods.
Development Well - A well drilled within the proved area of an oil or natural gas reservoir to the depth of a stratigraphic horizon known to be productive.
Discovery Cost - With respect to proved reserves, a three-year average (unless otherwise indicated) calculated by dividing total incurred exploration and development costs (exclusive of future development costs) by net reserves added during the period through extensions, discoveries, and other additions.
Dry Well - An exploratory or development well that is not a producing well.
EBITDA - Earnings before interest, taxes, depreciation, depletion and amortization.
EBITDAX - Earnings before interest, taxes, depreciation, depletion and amortization, and exploration expenses. Since Swift Energy uses full-cost accounting for oil and property expenditures, as noted in footnote one of the accompanying consolidated financial statements, exploration expenses are not applicable to Swift Energy.
Exploratory Well - A well drilled to find a new field or to find a new reservoir in a field previously found to be productive of oil or natural gas in another reservoir.
FASB - The Financial Accounting Standards Board.
Gross Acre - An acre in which a working interest is owned. The number of gross acres is the total number of acres in which a working interest is owned.
Gross Well - A well in which a working interest is owned. The number of gross wells is the total number of wells in which a working interest is owned.
MBbl - Thousand barrels of oil.
MBoe - Thousand barrels of oil equivalent.
Mcf - Thousand cubic feet of natural gas.
Mcfe - Thousand cubic feet of natural gas equivalent, which is determined using the ratio of one barrel of oil, condensate, or natural gas liquids to 6 Mcf of natural gas.
MMBbl - Million barrels of oil.
MMBoe - Million barrels of oil equivalent.
MMBtu - Million British thermal units, which is a heating equivalent measure for natural gas and is an alternate measure of natural gas reserves, as opposed to Mcf, which is strictly a measure of natural gas volumes. Typically, prices quoted for natural gas are designated as price per MMBtu, the same basis on which natural gas is contracted for sale.
MMcf - Million cubic feet of natural gas.
MMcfe - Million cubic feet of natural gas equivalent (see Mcfe).
Net Acre - A net acre is deemed to exist when the sum of fractional working interests owned in gross acres equals one. The number of net acres is the sum of fractional working interests owned in gross acres expressed as whole numbers and fractions thereof.
Net Well - A net well is deemed to exist when the sum of fractional working interests owned in gross wells equals one. The number of net wells is the sum of fractional working interests owned in gross wells expressed as whole numbers and fractions thereof.
NGL - Natural gas liquid.
Producing Well - An exploratory or development well found to be capable of producing either oil or natural gas in sufficient quantities to justify completion as an oil or natural gas well.
Proved Oil and Gas Reserves - Those quantities of oil and gas, which, by analysis of geoscience and engineering data, can be estimated with reasonable certainty to be economically producible from a given date forward, from known reservoirs, and under existing economic conditions, operating methods, and government regulations. For reserves calculations economic conditions include prices based on either the preceding 12-months' average price based on closing prices on the first day of each month, or prices defined by existing contractual arrangements.
Proved Undeveloped (PUD) Locations - A location containing proved undeveloped reserves.
26
PV-10 Value - The estimated future net revenues to be generated from the production of proved reserves discounted to present value using an annual discount rate of 10%. These amounts are calculated net of estimated production costs and future development costs, using prices based on either the preceding 12-months' average price based on closing prices on the first day of each month, or prices defined by existing contractual arrangements, without escalation and without giving effect to non-property related expenses, such as general and administrative expenses, debt service, future income tax expense, or depreciation, depletion, and amortization. PV-10 Value is a non-GAAP measure and its use is explained under “Item 2. Properties - Oil and Natural Gas Reserves” above in this Form 10-K/A.
Standardized Measure - The present value, discounted at 10% per year, of estimated future net revenues from the production of proved reserves, computed by applying sales prices and deducting the estimated future costs to be incurred in developing, producing and abandoning the proved reserves (computed based on current costs and assuming continuation of existing economic conditions). Future income taxes are calculated by applying the statutory federal and state income tax rate to pre-tax future net cash flows, net of the tax basis of the properties involved and utilization of available tax carryforwards related to oil and natural gas operations. Sales prices were prepared using average hydrocarbon prices equal to the unweighted arithmetic average of hydrocarbon prices on the first day of each month within the 12-month period preceding the reporting date (except for consideration of price changes to the extent provided by contractual arrangements).
Undeveloped Oil and Gas Reserves - Oil and natural gas reserves of any category that are expected to be recovered from new wells on undrilled acreage or from existing wells where a relatively major expenditure is required for recompletion.
Item 3. Legal Proceedings
No material legal proceedings are pending other than ordinary, routine litigation and claims incidental to our business.
Item 4. Mine Safety Disclosures
None.
27
PART II
Item 5. Market for Registrant's Common Equity, Related Stockholder Matters and Issuer Purchases of Equity Securities
Common Stock, 2013 and 2012
Our common stock is traded on the New York Stock Exchange under the symbol “SFY.” The high and low quarterly closing sales prices for the common stock for 2013 and 2012 were as follows:
2013 | 2012 | ||||||||
First Quarter | Second Quarter | Third Quarter | Fourth Quarter | First Quarter | Second Quarter | Third Quarter | Fourth Quarter | ||
Low | $13.18 | $11.81 | $10.99 | $11.59 | $28.30 | $15.09 | $17.25 | $14.28 | |
High | $17.10 | $15.63 | $13.56 | $14.90 | $35.00 | $30.44 | $23.10 | $21.07 | |
Since inception, no cash dividends have been declared on our common stock. Cash dividends are restricted under the terms of our credit agreements, as discussed in Note 4 to the consolidated financial statements, and we presently intend to continue a policy of using retained earnings for expansion of our business.
We had approximately 162 stockholders of record as of December 31, 2013.
Stock Repurchase Table
The following table summarizes repurchases of our common stock during the fourth quarter of 2013, all of which were shares withheld from employees to satisfy tax obligations arising upon the vesting of restricted shares:
Period | Total Number of Shares Purchased | Average Price Paid Per Share | Total Number of Shares Purchased as Part of Publicly Announced Plans or Programs | Approximate Dollar Value of Shares that May Yet Be Purchased Under the Plans or Programs (in thousands) | |||||||||
10/01/13 - 10/31/13 (1) | 487 | $ | 12.85 | — | $--- | ||||||||
11/01/13 - 11/30/13 (1) | 715 | $ | 13.26 | — | — | ||||||||
12/01/13 - 12/31/13 (1) | 256 | $ | 13.00 | — | — | ||||||||
Total | 1,458 | $ | 13.08 | — | $--- | ||||||||
Equity Compensation Plan Information
The information regarding the number of shares of our common stock that are available for issuance under all of our existing equity compensation plans as of December 31, 2013 is located in Note 6 to the consolidated financial statements.
28
Share Performance Graph
The following Share Performance Graph shall not be deemed to be “soliciting material” or to be “filed” with the Securities and Exchange Commission, nor shall such information be incorporated by reference into any future filings under the Securities Act of 1933 or Securities Exchange Act of 1934, each as amended, except to the extent that the Company specifically incorporates it by reference into such filing.
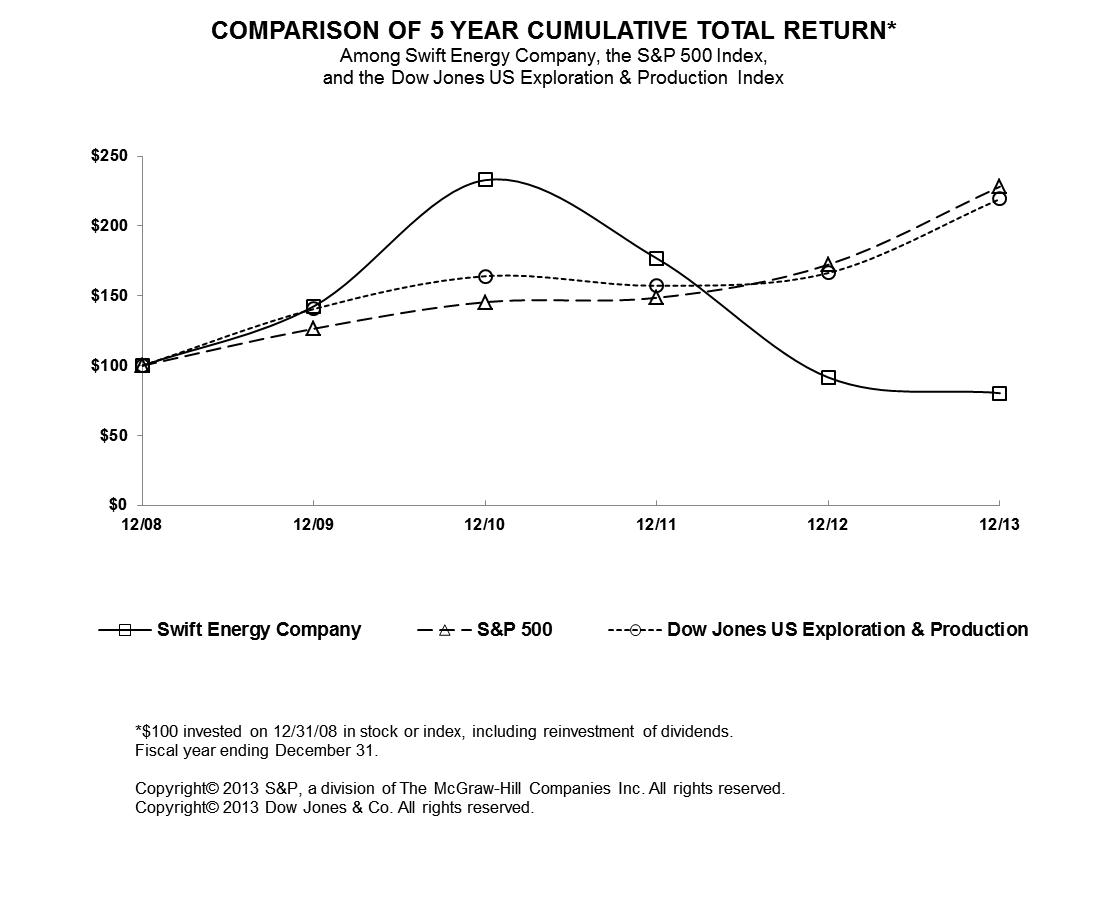
29
Item 6. Selected Financial Data (Restated)
As discussed in the Explanatory Note to this Form 10-K/A and in Note 1A of the Notes to Consolidated Financial Statements included in Part II. Item 8 of this Form 10-K/A, we are restating our audited consolidated financial statements and related disclosures for the years ended December 31, 2013, 2012 and 2011. The following selected financial data should be read together with “Management’s Discussion and Analysis of Financial Condition and Results of Operations” and our consolidated financial statements and related notes included elsewhere in this Form 10-K/A. Our historical results are not necessarily indicative of the results that should be expected in the future and the selected financial data is not intended to replace the consolidated financial statements.
30
December 31, | |||||||||||||||
(annual data in thousands except per share & well amounts) | 2013 (As Restated) | 2012 (As Restated) | 2011 (As Restated) | 2010 (As Restated) | 2009 (As Restated) | ||||||||||
Total Revenues from Continuing Operations (1) | $ | 584,401 | $ | 561,486 | $ | 597,809 | $ | 438,867 | $ | 370,445 | |||||
Income (Loss) from Continuing Operations, Before Income Taxes (1) | $ | 198 | $ | 37,773 | $ | 131,125 | $ | 72,225 | $ | (64,338 | ) | ||||
Income (Loss) from Continuing Operations (1) | $ | (2,442 | ) | $ | 21,701 | $ | 82,071 | $ | 45,146 | $ | (38,898 | ) | |||
Net Cash Provided by Operating Activities - Continuing Operations | $ | 311,447 | $ | 314,606 | $ | 373,058 | $ | 258,996 | $ | 226,176 | |||||
Per Share and Share Data | |||||||||||||||
Weighted Average Shares Outstanding | 43,331 | 42,840 | 42,394 | 38,300 | 33,594 | ||||||||||
Earnings per Share--Basic(1) | $ | (0.06 | ) | $ | 0.51 | $ | 1.94 | $ | 1.17 | $ | (1.16 | ) | |||
Earnings per Share--Diluted(1) | $ | (0.06 | ) | $ | 0.50 | $ | 1.91 | $ | 1.16 | $ | (1.16 | ) | |||
Shares Outstanding at Year-End | 43,402 | 42,930 | 42,485 | 41,999 | 37,457 | ||||||||||
Book Value per Share at Year-End | $ | 24.55 | $ | 24.52 | $ | 23.80 | $ | 21.36 | $ | 18.62 | |||||
Market Price | |||||||||||||||
High | $ | 17.10 | $ | 35.00 | $ | 47.32 | $ | 40.83 | $ | 25.61 | |||||
Low | $ | 10.99 | $ | 14.28 | $ | 21.81 | $ | 24.52 | $ | 4.95 | |||||
Year-End Close | $ | 13.50 | $ | 15.39 | $ | 29.72 | $ | 39.15 | $ | 23.96 | |||||
Assets | |||||||||||||||
Current Assets | $ | 92,489 | $ | 87,005 | $ | 334,594 | $ | 158,796 | $ | 108,600 | |||||
Property & Equipment, Net of Accumulated Depreciation, Depletion, and Amortization | $ | 2,588,817 | $ | 2,367,954 | $ | 1,892,866 | $ | 1,599,796 | $ | 1,344,772 | |||||
Total Assets | $ | 2,698,505 | $ | 2,473,463 | $ | 2,244,012 | $ | 1,771,305 | $ | 1,463,573 | |||||
Liabilities | |||||||||||||||
Current Liabilities | $ | 176,033 | $ | 179,412 | $ | 216,605 | $ | 157,102 | $ | 103,604 | |||||
Long-Term Debt | $ | 1,142,368 | $ | 916,934 | $ | 719,775 | $ | 471,624 | $ | 471,397 | |||||
Total Liabilities | $ | 1,633,155 | $ | 1,420,680 | $ | 1,232,661 | $ | 874,237 | $ | 766,294 | |||||
Stockholders' Equity | $ | 1,065,350 | $ | 1,052,783 | $ | 1,011,351 | $ | 897,068 | $ | 697,279 | |||||
Number of Employees | 313 | 332 | 309 | 292 | 295 | ||||||||||
Producing Wells | |||||||||||||||
Swift Operated | 1,039 | 1,069 | 1,025 | 1,212 | 1,146 | ||||||||||
Outside Operated | 25 | 50 | 46 | 119 | 148 | ||||||||||
Total Producing Wells | 1,064 | 1,119 | 1,071 | 1,331 | 1,294 | ||||||||||
Wells Drilled (Gross) | 48 | 71 | 44 | 56 | 20 | ||||||||||
Proved Reserves | |||||||||||||||
Natural Gas (Bcf) | 815.1 | 597.6 | 616.8 | 423.0 | 290.6 | ||||||||||
Oil Reserves (MBoe) | 53.0 | 43.3 | 30.9 | 39.3 | 44.5 | ||||||||||
NGL Reserves (MBoe) | 30.4 | 49.2 | 25.8 | 23.0 | 20.0 | ||||||||||
Total Proved Reserves (MMBoe equivalent) | 219.2 | 192.1 | 159.6 | 132.8 | 112.9 | ||||||||||
Production (MMBoe equivalent) | 11.7 | 11.7 | 10.5 | 8.3 | 9.1 | ||||||||||
Average Sales Price (2) | |||||||||||||||
Natural Gas (per Mcf produced) | $ | 3.32 | $ | 2.42 | $ | 3.70 | $ | 3.96 | $ | 3.48 | |||||
Natural Gas Liquids (per barrel) | $ | 31.39 | $ | 35.07 | $ | 52.13 | $ | 42.44 | $ | 31.36 | |||||
Oil (per barrel) | $ | 103.42 | $ | 106.17 | $ | 107.00 | $ | 79.45 | $ | 60.07 | |||||
Boe Equivalent | $ | 50.11 | $ | 47.37 | $ | 57.22 | $ | 52.42 | $ | 41.05 | |||||
(1) Amounts have been retroactively adjusted in all periods presented to give recognition to discontinued operations related to the sale of our New Zealand oil & gas assets.
(2) These prices do not include the effects of our hedging activities which were recorded in “Price-risk management and other, net” on the accompanying statements of operations. The hedge adjusted prices are detailed in the “Management's Discussion and Analysis of Financial Condition and Results of Operations” section of this Form 10-K/A. As described in Note 1A to the consolidated financial statements, adjustments for certain previously identified immaterial accounting errors have been made in this Form 10-K/A. Any effect on the historical unit sales prices were evaluated and deemed to be immaterial to any period presented and therefore not restated.
31
December 31, 2013 | December 31, 2012 | ||||||||||||||||||
(in thousands except per share amounts) | (As Reported) | (Adjustments) | (As Restated) | (As Reported) | (Adjustments) | (As Restated) | |||||||||||||
Total Revenues from Continuing Operations (1) | $ | 587,713 | $ | (3,312 | ) | $ | 584,401 | $ | 557,290 | $ | 4,196 | $ | 561,486 | ||||||
Income (Loss) from Continuing Operations, Before Income Taxes (1) | $ | (25,805 | ) | $ | 26,003 | $ | 198 | $ | 36,578 | $ | 1,195 | $ | 37,773 | ||||||
Income (Loss) from Continuing Operations (1) | $ | (19,032 | ) | $ | 16,590 | $ | (2,442 | ) | $ | 20,939 | $ | 762 | $ | 21,701 | |||||
Net Cash Provided by Operating Activities - Continuing Operations | $ | 311,447 | $ | — | $ | 311,447 | $ | 314,606 | $ | — | $ | 314,606 | |||||||
Per Share and Share Data | |||||||||||||||||||
Weighted Average Shares Outstanding | 43,331 | — | 43,331 | 42,840 | — | 42,840 | |||||||||||||
Earnings per Share--Basic(1) | $ | (0.44 | ) | $ | 0.38 | $ | (0.06 | ) | $ | 0.49 | $ | 0.02 | $ | 0.51 | |||||
Earnings per Share--Diluted(1) | $ | (0.44 | ) | $ | 0.38 | $ | (0.06 | ) | $ | 0.48 | $ | 0.02 | $ | 0.50 | |||||
Shares Outstanding at Year-End | 43,402 | — | 43,402 | 42,930 | — | 42,930 | |||||||||||||
Book Value per Share at Year-End | $ | 23.81 | $ | 0.74 | $ | 24.55 | $ | 24.15 | $ | 0.37 | $ | 24.52 | |||||||
Assets | |||||||||||||||||||
Current Assets | $ | 86,748 | $ | 5,741 | $ | 92,489 | $ | 80,537 | $ | 6,468 | $ | 87,005 | |||||||
Property & Equipment, Net of Accumulated Depreciation, Depletion, and Amortization | $ | 2,539,646 | $ | 49,171 | $ | 2,588,817 | $ | 2,345,020 | $ | 22,934 | $ | 2,367,954 | |||||||
Total Assets | $ | 2,643,593 | $ | 54,912 | $ | 2,698,505 | $ | 2,444,061 | $ | 29,402 | $ | 2,473,463 | |||||||
Liabilities | |||||||||||||||||||
Current Liabilities | $ | 177,076 | $ | (1,043 | ) | $ | 176,033 | $ | 177,480 | $ | 1,932 | $ | 179,412 | ||||||
Long-Term Debt | $ | 1,142,368 | $ | — | $ | 1,142,368 | $ | 916,934 | $ | — | $ | 916,934 | |||||||
Total Liabilities | $ | 1,610,377 | $ | 22,778 | $ | 1,633,155 | $ | 1,407,201 | $ | 13,479 | $ | 1,420,680 | |||||||
Stockholders' Equity | $ | 1,033,216 | $ | 32,134 | $ | 1,065,350 | $ | 1,036,860 | $ | 15,923 | $ | 1,052,783 | |||||||
(1) Amounts have been retroactively adjusted in all periods presented to give recognition to discontinued operations related to the sale of our New Zealand oil & gas assets.
December 31, 2011 | December 31, 2010 | ||||||||||||||||||
(in thousands except per share amounts) | (As Reported) | (Adjustments) | (As Restated) | (As Reported) | (Adjustments) | (As Restated) | |||||||||||||
Total Revenues from Continuing Operations (1) | $ | 599,131 | $ | (1,322 | ) | $ | 597,809 | $ | 438,429 | $ | 438 | $ | 438,867 | ||||||
Income (Loss) from Continuing Operations, Before Income Taxes (1) | $ | 135,104 | $ | (3,979 | ) | $ | 131,125 | $ | 74,308 | $ | (2,083 | ) | $ | 72,225 | |||||
Income (Loss) from Continuing Operations (1) | $ | 84,610 | $ | (2,539 | ) | $ | 82,071 | $ | 46,475 | $ | (1,329 | ) | $ | 45,146 | |||||
Net Cash Provided by Operating Activities - Continuing Operations | $ | 373,058 | $ | — | $ | 373,058 | $ | 258,996 | $ | — | $ | 258,996 | |||||||
Per Share and Share Data | |||||||||||||||||||
Weighted Average Shares Outstanding | 42,394 | — | 42,394 | 38,300 | — | 38,300 | |||||||||||||
Earnings per Share--Basic(1) | $ | 2.00 | $ | (0.06 | ) | $ | 1.94 | $ | 1.21 | $ | (0.04 | ) | $ | 1.17 | |||||
Earnings per Share--Diluted(1) | $ | 1.97 | $ | (0.06 | ) | $ | 1.91 | $ | 1.20 | $ | (0.04 | ) | $ | 1.16 | |||||
Shares Outstanding at Year-End | 42,485 | — | 42,485 | 41,999 | — | 41,999 | |||||||||||||
Book Value per Share at Year-End | $ | 23.46 | $ | 0.34 | $ | 23.80 | $ | 20.95 | $ | 0.41 | $ | 21.36 | |||||||
Assets | |||||||||||||||||||
Current Assets | $ | 332,119 | $ | 2,475 | $ | 334,594 | $ | 158,358 | $ | 438 | $ | 158,796 | |||||||
Property & Equipment, Net of Accumulated Depreciation, Depletion, and Amortization | $ | 1,867,766 | $ | 25,100 | $ | 1,892,866 | $ | 1,572,845 | $ | 26,951 | $ | 1,599,796 | |||||||
Total Assets | $ | 2,216,437 | $ | 27,575 | $ | 2,244,012 | $ | 1,743,916 | $ | 27,389 | $ | 1,771,305 | |||||||
Liabilities | |||||||||||||||||||
Current Liabilities | $ | 215,762 | $ | 843 | $ | 216,605 | $ | 156,735 | $ | 367 | $ | 157,102 | |||||||
Long-Term Debt | $ | 719,775 | $ | — | $ | 719,775 | $ | 471,624 | $ | — | $ | 471,624 | |||||||
Total Liabilities | $ | 1,219,928 | $ | 12,733 | $ | 1,232,661 | $ | 863,899 | $ | 10,338 | $ | 874,237 | |||||||
Stockholders' Equity | $ | 996,509 | $ | 14,842 | $ | 1,011,351 | $ | 880,017 | $ | 17,051 | $ | 897,068 | |||||||
(1) Amounts have been retroactively adjusted in all periods presented to give recognition to discontinued operations related to the sale of our New Zealand oil & gas assets.
32
December 31, 2009 | |||||||||
(in thousands except per share amounts) | (As Reported) | (Adjustments) | (As Restated) | ||||||
Total Revenues from Continuing Operations (1) | $ | 370,445 | $ | — | $ | 370,445 | |||
Income (Loss) from Continuing Operations, Before Income Taxes (1) | $ | (64,617 | ) | $ | 279 | $ | (64,338 | ) | |
Income (Loss) from Continuing Operations (1) | $ | (39,076 | ) | $ | 178 | $ | (38,898 | ) | |
Net Cash Provided by Operating Activities - Continuing Operations | $ | 226,176 | $ | — | $ | 226,176 | |||
Per Share and Share Data | |||||||||
Weighted Average Shares Outstanding | 33,594 | — | 33,594 | ||||||
Earnings per Share--Basic(1) | $ | (1.16 | ) | $ | — | $ | (1.16 | ) | |
Earnings per Share--Diluted(1) | $ | (1.16 | ) | $ | — | $ | (1.16 | ) | |
Shares Outstanding at Year-End | 37,457 | — | 37,457 | ||||||
Book Value per Share at Year-End | $ | 18.12 | $ | 0.5 | $ | 18.62 | |||
Assets | |||||||||
Current Assets | $ | 108,600 | $ | — | $ | 108,600 | |||
Property & Equipment, Net of Accumulated Depreciation, Depletion, and Amortization | $ | 1,315,964 | $ | 28,808 | $ | 1,344,772 | |||
Total Assets | $ | 1,434,765 | $ | 28,808 | $ | 1,463,573 | |||
Liabilities | |||||||||
Current Liabilities | $ | 103,604 | $ | — | $ | 103,604 | |||
Long-Term Debt | $ | 471,397 | $ | — | $ | 471,397 | |||
Total Liabilities | $ | 755,866 | $ | 10,428 | $ | 766,294 | |||
Stockholders' Equity | $ | 678,899 | $ | 18,380 | $ | 697,279 | |||
(1) Amounts have been retroactively adjusted in all periods presented to give recognition to discontinued operations
related to the sale of our New Zealand oil & gas assets.
33
Item 7. Management’s Discussion and Analysis of Financial Condition and Results of Operations
You should read the following discussion and analysis in conjunction with our financial information and our audited consolidated financial statements and accompanying notes for the years ended December 31, 2013, 2012 and 2011 included in this report. Unless otherwise noted, both historical information for all periods and forward-looking information provided in this Management's Discussion and Analysis relates solely to our continuing operations located in the United States, and excludes our New Zealand operations discontinued since late 2007. The following information contains forward-looking statements; see “Forward-Looking Statements” on page 38 of this report.
Restatement
As discussed in the Explanatory Note to this Form 10-K/A and in Note 1A of the Notes to Consolidated Financial Statements included in Part II. Item 8 of this Form 10-K/A, we are restating our audited consolidated financial statements and related disclosures for the years ended December 31, 2013, 2012 and 2011. The following discussion and analysis of our financial condition and results of operations incorporates the restated amounts. For this reason, the data set forth in this Item 7 may not be comparable to the discussion and data in our previously filed Annual Report on Form 10-K for the year ended December 31, 2013.
Overview
We are an independent oil and natural gas company formed in 1979 and we are engaged in the exploration, development, acquisition and operation of oil and natural gas properties, with a focus on our reserves and production from our Texas properties as well as onshore and inland waters of Louisiana. We hold a large acreage position in Texas prospective for Eagle Ford shale and Olmos tight sands development and are one of the largest producers of crude oil in the state of Louisiana. Oil production accounted for 33% of our 2013 production and 69% of our oil and gas sales, and combined production of both oil and natural gas liquids (“NGLs”) constituted 53% of our 2013 production and 81% of our oil and gas sales. In recent periods, this has allowed us to benefit from better margins for oil production, as oil prices are significantly higher on a Boe basis than natural gas prices.
2013 Activities
• | Production: Our production volumes increased less than 1% in 2013 when compared to volumes in 2012 as oil volumes increased by 4%, NGL volumes increased by 25% and natural gas production volumes decreased by 9%. The increase in oil volumes was from our South Texas area, primarily offset by declines in our Southeast Louisiana area. The changes in both NGL and natural gas volumes were primarily from our South Texas area. |
• | Pricing: Driven by higher prices for natural gas, our weighted average sales price in 2013 increased by 6% when compared to our weighted average sales price 2012. Natural gas prices increased 37%, oil prices decreased 3%, and NGL prices decreased 10% when compared to 2012. |
• | Cash provided by operating activities: For 2013, our cash provided by operating activities of $311.4 million was a 1% decrease from 2012 levels, due primarily to working capital changes during 2013. |
• | Available liquidity: At December 31, 2013, we had $265.0 million in outstanding borrowings under our credit facility. Our borrowing base and commitment amount under the credit facility is $450.0 million, which provides us with approximately $185 million of liquidity. We plan to utilize amounts received from asset sales and joint ventures entered into during 2014 to strengthen our balance sheet, enhance liquidity, and fund a portion of our 2014 capital expenditures. The completion of these transactions will affect our 2014 capital expenditures as we align our capital expenditures with our expected cash flows. |
• | 2013 capital expenditures: Our capital expenditures on a cash flow basis were $540.4 million in 2013 compared to $757.8 million spent in 2012. The expenditures in both years were mainly due to drilling and completion activity in our South Texas core region. In 2013 we drilled 14 wells in our Artesia Wells Eagle Ford field, 20 wells in our AWP Eagle Ford field, three wells in our AWP Olmos field and five wells in our Fasken Eagle Ford field, which helped us evaluate and maintain our acreage positions in those areas. In Southeast Louisiana we drilled two wells at Lake Washington, one of which was a dry hole, and in Central Louisiana we drilled two non-operated wells in our Burr Ferry field and one operated well in our South Bearhead Creek field. We also drilled our first well in the Niobrara formation of La Plata County, Colorado. These expenditures were funded by $311.4 million of cash provided by operating activities and the remainder through borrowings under our credit facility. |
34
• | Artesia Wells Performance and Economic Issues: In the condensate window of our Artesia Wells field, we experienced decreases in expected liquids production as our wells matured, which we believe may partially be due to retrograde condensation. This occurs when condensate turns into liquid form within the reservoir as the pressure in the reservoir decreases below dew point pressure. This retrograde condensate does not flow out of the reservoir which reduces our production rates and ultimate EURs. We started experiencing this issue during late 2013 and are still assessing the situation. Based on our recent experience we decided to remove 32 proved undeveloped locations from our proved reserves (in the southern and western areas) as we currently are not planning to develop them in the next five years. The proved undeveloped locations in the liquid-yielding northern area are economic and remain in our reserves as we do plan to drill these locations within the next five years. |
2014 Strategy and Outlook
• | 2014 Planned Capital Expenditures: Our 2014 planned capital expenditures are $300 to $350 million. We currently plan to fund our 2014 capital expenditures with our operating cash flow and potential line of credit borrowings, plus any proceeds from the disposition of all or a portion of our Central Louisiana assets (see below) and/or proceeds from joint ventures we enter into involving our properties in the Fasken Eagle Ford area (see below). If we do not receive such disposition or joint venture proceeds, we will align our capital spending with our expected cash flows. These amounts are flexible and will be adjusted based on the timing of any announced transactions and market fundamentals. For 2014, the Company is targeting production levels of 11.3 to 11.8 MMBoe. |
• | Central Louisiana Property Disposition: We are currently negotiating with prospective buyers to sell some or all of our Austin Chalk and Wilcox assets in Central Louisiana in order to focus our spending on our South Texas properties. We expect to finalize an agreement by the end of the second quarter. These Central Louisiana assets include approximately 86,000 mineral acres and three producing oil and natural gas fields: Burr Ferry, Masters Creek, and South Bearhead Creek. |
• | Pursuit of Eagle Ford Joint Venture: We are currently negotiating with prospective partners regarding a joint venture arrangement for a portion of our natural gas properties in the Eagle Ford area, principally our natural gas properties in the Fasken area. Entering into a joint venture agreement would accelerate drilling and development, monetize a portion of those asset values, diversify our risk profile and possibly free up capital dollars for other purposes. We are targeting completion of this initiative by the end of the second quarter of 2014. |
• | Reduced Spending for 2014: We expect a reduction in capital spending targets for 2014 to levels more in line with our internally generated cash flow and disposition and/or joint venture proceeds. Our priorities are financial discipline first and growth second. We expect to continue focusing on South Texas production and reserves, while maintaining a stronger balance sheet and enhancing liquidity. We are also taking current steps to reduce our future operating and overhead costs through a number of initiatives, including reducing personnel in conjunction with any asset dispositions and alignment of our other expenses, including cancellation of a new lease for future corporate office space, which will allow us to seek out more efficient and cost effective space. |
• | Operating improvements through new Eagle Ford drilling and completion technology: Our South Texas drilling activities continue to benefit from optimized well design as we are drilling longer laterals in our horizontal wells and performing more frac stages per well. When we began drilling in the Eagle Ford, our average lateral length was approximately 3,000 feet, and we performed up to nine frac stages per well. Our current process allows us to drill laterals of over 6,000 feet and complete 20 or more frac stages per well. We have observed a high correlation between the lateral length and number of frac stages in horizontal Eagle Ford wells, along with improved initial performance and long-term cumulative production. Additionally, as several of our peers have also announced, we are now increasing the number of frac stages per 1,000 feet of lateral length and using greater amounts of sand with each frac as we believe these changes could bring further improvement in our results. |
• | Improved performance of Eagle Ford shale assets through reduction in per well costs: We have seen improved performance this year in our initial production (IP) rates for Eagle Ford wells and have also seen our per well drilling and completion costs come down from those experienced in the prior year. Part of our goals for 2013 was to improve IP rates by 10% for these wells and reduce the average cost per well by 10%. Our IP rates increased over 10% in each area - Fasken was 62% higher than our 2012 model IP, Artesia Wells oil and condensate increased 44%, and AWP oil increased 33%. Overall our drilling and completion costs combined decreased by more than 10%, with drilling costs down 17% and completion costs down 9%. With faster drilling times, we are currently able to drill more wells per rig than previously expected. We have also |
35
experienced efficiency gains in our hydraulic fracturing activities (fracs), which enable us to perform more frac stages per month, lower the overall frac cost per stage and achieve better overall results. We believe that progression along this technology learning curve is important to improving performance and reducing costs. As an example, we have had excellent production results from the last two wells completed in our Fasken area during December 2013 which have been the most prolific wells in that area. While no two wells are the same, we have seen significant increases in 30, 60, 90, and 120 day oil recoveries from our more recent vintage wells.
• | Advances in 3D Geoscience technologies allow more targeted drilling: We are utilizing state of the art geoscience technologies to improve our lateral placements and completion design in the Eagle Ford and to better define our undeveloped resource potential in Lake Washington. In the Eagle Ford, GEOFRAC logging of the horizontal well bore has led to more effective placement of frac stages and also assisted in identifying sections of rock that are not ideal for stimulation, affording opportunities to eliminate potentially non-productive frac stages. We have been able to utilize our 3D seismic in this area, along with the analysis of cores and well logs, to identify a narrow high quality interval of the lower Eagle Ford within which to steer our laterals, resulting in marked improvement in our well results. In our Lake Washington area, we have applied new state of the art tools to better define the undeveloped resources in the field. We will be reprocessing our proprietary 3D seismic data with the help of these new tools and expect to identify additional unevaluated development potential in this field. |
• | Ability to capitalize on increased natural gas prices in the future: Although current natural gas prices are lower than historical highs, prices have improved significantly from the lows seen in the last several years. With increasing demand, including the volume of LNG available for export increasing over the next several years, we believe natural gas prices will increase from current levels and that selected natural gas properties can be economically developed in today’s market, although much of the potential for natural gas development will require higher prices. Our Fasken properties in Webb County, which include some of the best Eagle Ford rock in South Texas as defined by porosity, total organic content and other geologic and petrophysical qualities, can be economically developed today, while such potential natural gas resources as those in our South AWP area in McMullen County require a higher price environment to provide adequate economic returns. Our strategy includes a balanced approach to oil and natural gas, and as such we plan to continue some development on our prolific natural gas properties, such as Fasken. |
36
Results of Operations
Revenues — Years Ended December 31, 2013, 2012 and 2011
2013 - Our revenues in 2013 increased by 4% compared to revenues in 2012, due to higher natural gas pricing and higher oil and NGL production, partially offset by lower oil and NGL pricing and lower natural gas production. Average oil prices we received were 3% lower than those received during 2012, while natural gas prices were 37% higher, and NGL prices were 10% lower.
2012 - Our revenues in 2012 decreased by 6% compared to revenues in 2011, due to lower NGL and natural gas pricing, partially offset by higher natural gas and NGL production. Average oil prices we received were 1% lower than those received during 2011, while natural gas prices were 35% lower, and NGL prices were 33% lower.
Crude oil production was 33%, 32% and 37% of our production volumes while crude oil sales were 69%, 72% and 69% of oil and gas sales for the years ended December 31, 2013, 2012 and 2011, respectively. Natural gas production was 47%, 52% and 50% of our production volumes while natural gas sales were 19%, 16% and 20% of oil and gas sales for the years ended December 31, 2013, 2012 and 2011, respectively. The remaining production in each year was from NGLs.
The following table provides information regarding the changes in the sources of our oil and gas sales and volumes for the years ended December 31, 2013, 2012 and 2011:
Core Areas | Oil and Gas Sales (In Millions) | Net Oil and Gas Production Volumes (MBoe) | |||||||||||||||||||
2013 | 2012 | 2011 | 2013 | 2012 | 2011 | ||||||||||||||||
Southeast Louisiana | $ | 168.0 | $ | 215.0 | $ | 287.4 | 1,797 | 2,227 | 3,164 | ||||||||||||
South Texas | 360.2 | 290.1 | 224.2 | 9,009 | 8,555 | 5,937 | |||||||||||||||
Central Louisiana | 54.9 | 52.6 | 86.8 | 897 | 898 | 1,375 | |||||||||||||||
Other | 2.1 | 0.7 | 2.6 | 43 | 20 | 51 | |||||||||||||||
Total | $ | 585.2 | $ | 558.4 | $ | 601.0 | 11,746 | 11,700 | 10,527 | ||||||||||||
In 2013, our $26.8 million, or 5% increase in oil, NGL, and natural gas sales resulted from:
• | Price variances that accounted for approximately $10 million of the favorable increase as gas prices were up 37%, partially offset by lower prices for oil (down 3%) and NGLs (down 10%); and |
• | Volume variances that had an approximate $17.0 million favorable impact on sales attributable to higher oil and NGL production, partially offset by a reduction in natural gas volumes. |
In 2012, our $42.6 million, or 7% decrease in oil, NGL, and natural gas sales resulted from:
• | Price variances that resulted in an approximate $80.0 million decrease primarily attributable to lower natural gas and NGL prices; and |
• | Volume variances that had an approximate $39.0 million favorable impact on sales, primarily attributable to higher natural gas and NGL production. |
37
The following table provides additional information regarding our oil and gas sales, excluding any effects of our hedging activities, by quarter, for the years ended December 31, 2013, 2012 and 2011:
Production Volume | Average Price (1) | ||||||||||||
Oil | NGL | Gas | Combined | Oil | NGL | Gas | |||||||
(MBbl) | (MBbl) | (Bcf) | (MBoe) | (Bbl) | (Bbl) | (Mcf) | |||||||
2011 | |||||||||||||
First Quarter | 985 | 348 | 7.9 | 2,646 | $98.61 | $48.87 | $3.82 | ||||||
Second Quarter | 994 | 335 | 7.9 | 2,641 | $112.09 | $50.41 | $3.93 | ||||||
Third Quarter | 937 | 247 | 8.1 | 2,542 | $105.55 | $57.76 | $3.68 | ||||||
Fourth Quarter | 950 | 432 | 7.9 | 2,699 | $111.79 | $52.86 | $3.39 | ||||||
Total | 3,865 | 1,362 | 31.8 | 10,527 | $107.00 | $52.13 | $3.70 | ||||||
2012 | |||||||||||||
First Quarter | 884 | 376 | 9.2 | 2,799 | $111.99 | $45.30 | $2.18 | ||||||
Second Quarter | 905 | 430 | 9.5 | 2,918 | $108.02 | $35.25 | $2.01 | ||||||
Third Quarter | 870 | 512 | 9.0 | 2,875 | $102.73 | $31.29 | $2.52 | ||||||
Fourth Quarter | 1,115 | 544 | 8.7 | 3,108 | $102.73 | $31.42 | $3.04 | ||||||
Total | 3,774 | 1,862 | 36.4 | 11,700 | $106.17 | $35.07 | $2.42 | ||||||
2013 | |||||||||||||
First Quarter | 988 | 557 | 7.6 | 2,819 | $108.45 | $29.90 | $2.96 | ||||||
Second Quarter | 911 | 549 | 7.9 | 2,778 | $103.15 | $29.74 | $3.86 | ||||||
Third Quarter | 1,004 | 600 | 8.7 | 3,057 | $108.17 | $31.67 | $3.15 | ||||||
Fourth Quarter | 1,023 | 615 | 8.7 | 3,092 | $94.14 | $33.93 | $3.32 | ||||||
Total | 3,926 | 2,320 | 32.9 | 11,746 | $103.42 | $31.39 | $3.32 | ||||||
(1) As described in Note 1A to the consolidated financial statements, adjustments for certain previously identified immaterial accounting errors have been
made in this Form 10-K/A. Any effect on the historical unit sales prices were evaluated and deemed to be immaterial to any period presented and therefore
not restated.
For the years ended December 31, 2013, 2012 and 2011, we recorded net gains (losses) of ($0.9) million, $2.3 million and ($0.9) million, respectively, related to our derivative activities. This activity is recorded in “Price-risk management and other, net” on the accompanying consolidated statements of operations. Had these amounts been recognized in the oil and gas sales account, our average oil price would have been $102.93, $106.77 and $106.81 for the years ended December 31, 2013, 2012 and 2011, respectively, and our average natural gas price would have been $3.35, $2.42 and $3.70 for the years ended December 31, 2013, 2012 and 2011, respectively.
Costs and Expenses
Our expenses for the year ended December 31, 2013 increased $60.5 million, or 12%, compared to the prior year levels, for the reasons noted below.
Lease Operating Cost. These expenses increased $1.9 million, or 2%, compared to the level of such expenses for the year ended December 31, 2012, due to higher costs in our South Texas region for chemical treating, compressor rentals and lease operator costs, partially offset by lower salt water disposal costs in South Texas. Our lease operating costs per Boe produced were $8.49 and $8.36 for the years ended December 31, 2013 and 2012, respectively.
Transportation and gas processing. These expenses increased $1.6 million, or 8%, compared to the level of such expenses for the year ended December 31, 2012, due to additional NGL production. Our transportation and gas processing costs per Boe produced were $1.79 and $1.66 for the years ended December 31, 2013 and 2012, respectively.
Depreciation, Depletion and Amortization (“DD&A”). These expenses increased $3.4 million, or 1%, from those during the year ended December 31, 2012, due to a higher depletable base including higher future development costs, partially offset by higher reserves volumes. Our DD&A rate per Boe of production was $21.52 and $21.31 for the years ended December 31, 2013 and 2012, respectively.
General and Administrative Expenses, Net. These expenses decreased $1.7 million or 4%, compared to the level of such expenses for the year ended December 31, 2012, due to lower stock compensation, partially offset by higher salaries and burdens and higher temporary labor costs. For the years ended December 31, 2013 and 2012, our capitalized general and administrative costs totaled $31.8 million and $31.1 million, respectively. Our net general and administrative expenses per Boe produced were $3.87 and $4.03 for the years ended December 31, 2013 and 2012, respectively. The supervision fees recorded as a reduction to
38
general and administrative expenses were $11.6 million and $11.3 million for the years ended December 31, 2013 and 2012, respectively.
Severance and Other Taxes. These expenses decreased $4.8 million, or 10%, from the year ended December 31, 2012. Severance and other taxes, as a percentage of oil and gas sales, were approximately 7.3% and 8.5% for the years ended December 31, 2013 and 2012, respectively. The change in rate was primarily driven by higher oil production in South Texas as our Texas oil production carries a lower severance tax rate than in Louisiana.
Interest. Our gross interest cost for the year ended December 31, 2013 was $76.6 million, of which $7.2 million was capitalized. Our gross interest cost for the year ended December 31, 2012 was $65.2 million, of which $7.9 million was capitalized. The increase in interest came from increased credit facility borrowings during 2013.
Write-down of oil and gas properties. Due to the effects of pricing, timing of projects and changes in our reserves product mix, in 2013 we reported a non-cash write-down on a before-tax basis of $46.9 million ($30.0 million after tax) for our oil and natural gas properties.
Income Taxes. Our effective income tax rate was over 100% for the year ended December 31, 2013. As our net income was near break-even tax expense is primarily attributable to non-deductible book expenses. For the year ended December 31, 2012 our effective rate was 42.5%.
Final Recognition of New Zealand Sales Proceeds. In August 2008, we completed the sale of our remaining New Zealand permit for $15.0 million; with three $5.0 million payments spread over a 30 month period. The Company initially deferred the gain on the sale due to legal claims around the transfer of this property. In July 2011, a settlement was reached and all legal claims were dismissed. As a result, in the second quarter of 2011 the Company recognized sale proceeds of $15.0 million, net of $0.6 million in capitalized costs in assets held for sale, relating to our remaining New Zealand permit. As of December 31, 2011, all payments under this sale agreement had been received and thus 100% of the Company's oil and gas operations were in the United States of America.
Liquidity and Capital Resources
Net Cash Provided by Operating Activities. For the year ended December 31, 2013, our net cash provided by operating activities was $311.4 million, representing a 1% decrease compared to $314.6 million generated during 2012. The $3.2 million decrease was mainly due to changes in working capital.
Working Capital and Debt to Capitalization Ratio. Our working capital increased from a deficit of $92.4 million at December 31, 2012, to a deficit of $83.5 million at December 31, 2013. Working capital, which is calculated as current assets less current liabilities, can be used to measure both a company's operational efficiency and short-term financial health. The Company uses this measure to track our short-term financial position. Our working capital ratio does not include available liquidity through our credit facility. Our debt to capitalization ratio was 52% and 47% at December 31, 2013 and December 31, 2012, respectively. The increase was due to increased credit facility borrowings during 2013 as well as lower equity and retained earnings balances from the non-cash write-down of our oil and gas properties in 2013.
Existing Credit Facility. Our borrowing base was reaffirmed at $450.0 million on October 28, 2013. The commitment amount and maturity of the credit facility remained unchanged. The next borrowing base redetermination is scheduled for May 2014.
At December 31, 2013, we had $265.0 million in outstanding borrowings under our credit facility. Our available borrowings under our credit facility provide us liquidity along with any proceeds received from asset sales. In light of credit market volatility in recent years, which caused many financial institutions to experience liquidity issues, we periodically review the creditworthiness of the banks that fund our credit facility.
2012 Debt Issuance. On October 3, 2012, we issued an additional $150.0 million of 7.875% senior notes due on March 1, 2022. The notes were issued at 105% of par, which equates to a yield to worst of 6.993%. The proceeds from this debt issuance were used to pay down the balance on our credit facility, which increased our available liquidity.
Asset Dispositions and Joint Ventures. We plan to utilize amounts received from asset sales and joint ventures entered into during 2014 to strengthen our balance sheet, enhance liquidity, and potentially fund a portion of our 2014 capital expenditures. As previously noted; we are currently negotiating the sale of our Central Louisiana assets with prospective buyers as well as joint venture proposals with prospective partners related to our South Texas Eagle Ford acreage. The completion of these transactions will affect the level of our 2014 capital expenditures as we better align our capital expenditures with our expected cash flows.
39
Contractual Commitments and Obligations
Our contractual commitments for the next five years and thereafter as of December 31, 2013 were as follows (in thousands):
2014 | 2015 | 2016 | 2017 | 2018 | Thereafter | Total | |||||||||||||||
Non-cancelable operating leases (1) | $ | 9,031 | $ | 1,327 | $ | 102 | $ | — | $ | — | $ | — | $ | 10,460 | |||||||
Asset retirement obligation (2) | 15,859 | 3,265 | 2,951 | 2,659 | 1,669 | 52,681 | 79,084 | ||||||||||||||
Geoscience data services | 2,329 | — | — | — | — | — | 2,329 | ||||||||||||||
Gas transportation and Processing (3) | 8,770 | 7,984 | 6,456 | 3,723 | 3,723 | 5,593 | 36,249 | ||||||||||||||
7-1/8% senior notes due 2017 | — | — | — | 250,000 | — | — | 250,000 | ||||||||||||||
8-7/8% senior notes due 2020 | — | — | — | — | — | 225,000 | 225,000 | ||||||||||||||
7-7/8% senior notes due 2022 | — | — | — | — | — | 400,000 | 400,000 | ||||||||||||||
Interest Cost | 69,281 | 69,281 | 69,281 | 60,375 | 51,469 | 140,203 | 459,891 | ||||||||||||||
Credit facility (4) | — | — | — | 265,000 | — | — | 265,000 | ||||||||||||||
Total | $ | 105,270 | $ | 81,857 | $ | 78,790 | $ | 581,757 | $ | 56,861 | $ | 823,477 | $ | 1,728,013 | |||||||
(1) As of December 31, 2013 our most significant office lease was in Houston, Texas and expired February 2015. In February 2014 we amended and extended the lease through November 30, 2015.
(2) Amounts shown by year are the net present value at December 31, 2013.
(3) Amounts shown represent fees for the minimum delivery obligations. Any amount of transportation utilized in excess of the minimum will reduce future year obligations.
(4) The credit facility expires in November 2017 and these amounts exclude $1.7 million standby letters of credit outstanding under this facility.
As of December 31, 2013, we had no off-balance sheet arrangements requiring disclosure pursuant to article 303(a) of Regulation S-K.
Proved Oil and Gas Reserves
We have added proved reserves over the past three years primarily through our drilling activities, including 76.3 MMBoe added in 2013, 43.8 MMBoe added in 2012, and 58.0 MMBoe added in 2011. The 2013 proved reserves additions from drilling activities consisted primarily of additions in the Fasken Eagle Ford area in South Texas based on the results of the horizontal drilling program conducted in the area during the year, along with additions in the AWP Eagle Ford area. We obtained reasonable certainty regarding these reserves additions by applying the same methodologies that have been used historically in this area. At year-end 2013, 29% of our total proved reserves were proved developed, compared with 34% at year-end 2012 and 35% at year-end 2011.
At December 31, 2013, our proved reserves were 219.2 MMBoe with a PV-10 Value of $2.4 billion (PV-10 Value is a non-GAAP measure, see the section titled “Oil and Natural Gas Reserves” in our Property section for a reconciliation of this non-GAAP measure to the closest GAAP measure), an increase in the PV-10 Value of approximately $141 million, or 6%, from the prior year-end levels. In 2013, our proved natural gas reserves increased 217.6 Bcf, or 36%, while our proved oil reserves increased 9.7 MMBbl, or 23%, and our NGL reserves decreased 18.8 MMBbl, or 38%, for a total equivalent increase of 27.2 MMBoe, or 14%.
We use the preceding 12-months' average price based on closing prices on the first business day of each month in calculating our average prices used in the PV-10 Value calculation. Our average natural gas price used in the PV-10 Value calculation for 2013 was $3.41 per Mcf. This average price increased from the average price of $2.71 per Mcf used in the PV-10 calculation for 2012. Our average oil price used in the PV-10 Value calculation for 2013 was $104.38 per Bbl. This average price increased from the average price of $103.64 per Bbl used in the PV-10 calculation for 2012.
Critical Accounting Policies and New Accounting Pronouncements
Property and Equipment. We follow the “full-cost” method of accounting for oil and natural gas property and equipment costs. Under this method of accounting, all productive and nonproductive costs incurred in the exploration, development, and acquisition of oil and natural gas reserves are capitalized including internal costs incurred that are directly related to these activities and which are not related to production, general corporate overhead, or similar activities. Future development costs are estimated property-by-property based on current economic conditions and are amortized to expense as our capitalized oil and natural gas
40
property costs are amortized. We compute the provision for depreciation, depletion, and amortization (“DD&A”) of oil and natural gas properties using the unit-of-production method.
The costs of unproved properties not being amortized are assessed quarterly, on a property-by-property basis, to determine whether such properties have been impaired. In determining whether such costs should be impaired, we evaluate current drilling results, lease expiration dates, current oil and gas industry conditions, international economic conditions, capital availability, and available geological and geophysical information. As these factors may change from period to period, our evaluation of these factors will change. Any impairment assessed is added to the cost of proved properties being amortized.
The calculation of the provision for DD&A requires us to use estimates related to quantities of proved oil and natural gas reserves and estimates of unproved properties. For both reserves estimates (see discussion below) and the impairment of unproved properties (see discussion above), these processes are subjective, and results may change over time based on current information and industry conditions. We believe our estimates and assumptions are reasonable; however, such estimates and assumptions are subject to a number of risks and uncertainties that may cause actual results to differ materially from such estimates.
Full-Cost Ceiling Test. At the end of each quarterly reporting period, the unamortized cost of oil and natural gas properties (including natural gas processing facilities, capitalized asset retirement obligations and deferred income taxes, and excluding the recognized asset retirement obligation liability) is limited to the sum of the estimated future net revenues from proved properties (excluding cash outflows from recognized asset retirement obligations, including future development and abandonment costs of wells to be drilled, using the preceding 12-months’ average price based on closing prices on the first day of each month, adjusted for price differentials, discounted at 10%, and the lower of cost or fair value of unproved properties) adjusted for related income tax effects ("Ceiling Test").
Due to the effects of pricing, timing of projects and changes in our reserves product mix, in 2013 we reported a non-cash write-down on a before-tax basis of $46.9 million ($30.0 million after tax) on our oil and natural gas properties.
We believe our estimates and assumptions are reasonable; however, such estimates and assumptions are subject to a number of risks and uncertainties that may cause actual results to differ materially from such estimates.
Given the volatility of oil and natural gas prices, it is reasonably possible that our estimate of discounted future net cash flows from proved oil and natural gas reserves could continue to change in the near-term. If oil and natural gas prices decline from the prices used in the Ceiling Test, even if only for a short period, it is reasonably possible that additional non-cash write-downs of oil and gas properties would occur in the future. If future capital expenditures out pace future discounted net cash flows in our reserve calculations or if we have significant declines in our oil and natural gas reserves volumes, which also reduces our estimate of discounted future net cash flows from proved oil and natural gas reserves, non-cash write-downs of our oil and natural gas properties would occur in the future. We cannot control and cannot predict what future prices for oil and natural gas will be, thus we cannot estimate the amount or timing of any potential future non-cash write-down of our oil and natural gas properties if a decrease in oil and/or natural gas prices were to occur.
New Accounting Pronouncements. There are no material new accounting pronouncements that have been issued but not yet adopted as of December 31, 2013.
41
Forward-Looking Statements
This report includes forward-looking statements intended to qualify for the safe harbors from liability established by the Private Securities Litigation Reform Act of 1995, Section 27A of the Securities Act of 1933, as amended, and Section 21E of the Securities Exchange Act of 1934, as amended. These forward-looking statements are subject to a number of risks and uncertainties, many of which are beyond our control. All statements, other than statements of historical fact included in this report, regarding our strategy, future operations, financial position, estimated production levels, reserve increases, capital expenditures, projected costs, prospects, plans and objectives of management are forward-looking statements. When used in this report, the words "could," "believe," "anticipate," "intend," "estimate," “budgeted”, "expect," "may," continue," "predict," "potential," "project" and similar expressions are intended to identify forward-looking statements, although not all forward-looking statements contain such identifying words.
Forward-looking statements may include statements about our:
• business strategy;
• estimated oil and natural gas reserves or the present value thereof;
• technology;
• our borrowing capacity, cash flows and liquidity;
• financial strategy, budget, projections and operating results;
• asset disposition efforts or the timing or outcome thereof;
• prospective joint ventures, their structure and substance, and the likelihood of their finalization or the timing thereof;
• oil and natural gas pricing expectations;
• the amount, nature and timing of capital expenditures, including future development costs;
• timing and amount of future production of oil and natural gas;
• availability of drilling and production equipment or availability of oil field labor;
• availability and terms of capital;
• drilling of wells;
• marketing and transportation of oil and natural gas;
• costs of exploiting and developing our properties and conducting other operations;
• competition in the oil and natural gas industry;
• general economic conditions;
• opportunities to monetize assets;
• effectiveness of our risk management activities;
• environmental liabilities;
• counterparty credit risk;
• governmental regulation and taxation of the oil and natural gas industry;
• developments in world oil markets and in oil and natural gas-producing countries;
• uncertainty regarding our future operating results;
• plans, objectives, expectations and intentions contained in this report that are not historical.
All forward-looking statements speak only as of the date they are made. You should not place undue reliance on these forward-looking statements. Although we believe that our plans, intentions and expectations reflected in or suggested by the forward-looking statements we make in this report are reasonable, we can give no assurance that these plans, intentions or expectations will be achieved. We disclose important factors that could cause our actual results to differ materially from our expectations under "Risk factors" in Item 1A of our annual report on Form 10-K/A for the year ended December 31, 2013. These cautionary statements qualify all forward-looking statements attributable to us or persons acting on our behalf.
All subsequent written and oral forward-looking statements attributable to us or to persons acting on our behalf are expressly qualified in their entirety by the foregoing. We undertake no obligation to publicly release the results of any revisions to any such forward-looking statements that may be made to reflect events or circumstances after the date of this report or to reflect the occurrence of unanticipated events.
42
Item 7A. Quantitative and Qualitative Disclosures About Market Risk
Commodity Risk. Our major market risk exposure is the commodity pricing applicable to our oil and natural gas production. Realized commodity prices received for such production are primarily driven by the prevailing worldwide price for crude oil and spot prices applicable to natural gas. This commodity pricing volatility has continued with unpredictable price swings throughout 2012 and 2013.
Our price-risk management policy permits the utilization of agreements and financial instruments (such as futures, forward contracts, swaps and options contracts) to mitigate price risk associated with fluctuations in oil and natural gas prices. We do not utilize these agreements and financial instruments for trading and only enter into derivative agreements with banks in our credit facility. For additional discussion related to our price-risk management policy, refer to Note 1 of these consolidated financial statements.
Income Tax Carryforwards. As of December 31, 2013, the Company has net deferred tax carryforward assets of $108.1 million for federal net operating losses, $2.1 million for federal alternative minimum tax credits and $8.0 million, net of a $6.6 million valuation allowance, for deferred state tax net operating loss carryforwards which in management's judgment will more likely than not be utilized to offset future taxable earnings. Changes in markets conditions or significant changes in the Company's ownership could impact our ability to utilize these carryforwards.
Customer Credit Risk. We are exposed to the risk of financial non-performance by customers. Our ability to collect on sales to our customers is dependent on the liquidity of our customer base. Continued volatility in both credit and commodity markets may reduce the liquidity of our customer base. To manage customer credit risk, we monitor credit ratings of customers and from certain customers we also obtain letters of credit, parent company guaranties if applicable, and other collateral as considered necessary to reduce risk of loss. Due to availability of other purchasers, we do not believe the loss of any single oil or natural gas customer would have a material adverse effect on our results of operations.
Concentration of Sales Risk. Over the last several years, a large portion of our oil and gas sales have been to Shell Oil Corporation and affiliates and we expect to continue this relationship in the future. For the years ended December 31, 2013, 2012 and 2011, Shell Oil Company and affiliates accounted for 33%, 46% and 49% of our total oil and gas gross receipts, respectively. We believe that the risk of these unsecured receivables is mitigated by the short-term sales agreements we have in place as well as the size, reputation and nature of their business.
Interest Rate Risk. Our senior notes due in 2017, 2020 and 2022 have fixed interest rates, so consequently we are not exposed to cash flow risk from market interest rate changes on these notes. At December 31, 2013, we had $265.0 million drawn under our credit facility, which bears a floating rate of interest and therefore is susceptible to interest rate fluctuations. The result of a 10% fluctuation in the bank’s base rate would constitute 33 basis points and would not have a material adverse effect on our future cash flows.
43
Item 8. Financial Statements and Supplementary Data | Page | |
Management's Report on Internal Control Over Financial Reporting | ||
Report of Independent Registered Public Accounting Firm on Internal Control Over Financial Reporting | ||
Report of Independent Registered Public Accounting Firm on Consolidated Financial Statements | ||
Consolidated Balance Sheets | ||
Consolidated Statements of Operations | ||
Consolidated Statements of Comprehensive Income | ||
Consolidated Statements of Stockholders' Equity | ||
Consolidated Statements of Cash Flows | ||
Notes to Consolidated Financial Statements | ||
Supplementary Information | ||
44
Management's Report on Internal Control Over Financial Reporting
Management of Swift Energy Company is responsible for establishing and maintaining adequate internal control over financial reporting as defined in Rules 13a-15(f) and 15d-15(f) under the Securities Exchange Act of 1934. The Company's internal control over financial reporting is a process designed by, or under the supervision of, the Company's Chief Executive Officer and Chief Financial Officer to provide reasonable assurance regarding the reliability of financial reporting and the preparation of the Company's financial statements for external purposes in accordance with U. S. generally accepted accounting principles.
Management of the Company assessed the effectiveness of the Company's internal control over financial reporting as of December 31, 2013. In making this assessment, management used the criteria established in the Internal Control-Integrated Framework issued by the Committee of Sponsoring Organizations of the Treadway Commission (1992 framework)(the COSO criteria). Based on the assessment, at the time that the Original Filing was filed on March 3, 2014, our management concluded that our internal control over financial reporting was effective as of December 31, 2013.
In connection with the restatement discussed in the Explanatory Note to this Form 10-K/A and Note 1A of the Notes to Consolidated Financial Statements included in Part II. Item 8 of this Form 10-K/A, management, including our Chief Executive Officer and Chief Financial Officer, reassessed the effectiveness of our internal control over financial reporting as of December 31, 2013. Based on this reassessment using the COSO criteria, management has concluded that we did not maintain effective internal control over financial reporting as of December 31, 2013 because of a deficiency in the control over the review of the full-cost ceiling test write-down calculation specifically related to the deferred income tax effects attributable to the Company’s asset retirement obligations. Management concluded that this deficiency was a material weakness as defined in the Securities and Exchange Commission regulations. This control deficiency resulted in the misstatement of the ceiling test write-down as well as net income and the related financial disclosures for the year ended December 31, 2013 (and the restatement of the unaudited condensed consolidated financial information for the quarters ended March 31, 2013, June 30, 2013, September 30, 2013 and December 31, 2013) as more fully discussed in Note 1A to the Consolidated Financial Statements included in Part II, Item 8 of this Form 10-K/A.
The effectiveness of our internal control over financial reporting as of December 31, 2013 has been audited by Ernst & Young LLP, an independent registered public accounting firm, as stated in its report which is included in this Form 10-K/A.
Remediation Plan
We are remediating this material weakness by, among other things, implementing a process of enhanced review of the non-cash ceiling test calculation. The actions that we are taking are subject to ongoing senior management review and Audit Committee oversight. Management believes the foregoing efforts will effectively remediate the material weakness in the fourth quarter of 2014. As we continue to evaluate and work to improve our internal control over financial reporting, management may execute additional measures to address potential control deficiencies or modify the remediation plan described above and will continue to review and make necessary changes to the overall design of our internal controls.
45
Report of Independent Registered Public Accounting Firm
The Board of Directors and Stockholders of Swift Energy Company
We have audited Swift Energy Company and subsidiaries’ (the “Company”) internal control over financial reporting as of December 31, 2013, based on criteria established in Internal Control-Integrated Framework issued by the Committee of Sponsoring Organizations of the Treadway Commission (1992 framework) (the COSO criteria). The Company’s management is responsible for maintaining effective internal control over financial reporting, and for its assessment of the effectiveness of internal control over financial reporting included in the accompanying Management’s Report on Internal Control Over Financial Reporting. Our responsibility is to express an opinion on the Company’s internal control over financial reporting based on our audit.
We conducted our audit in accordance with the standards of the Public Company Accounting Oversight Board (United States). Those standards require that we plan and perform the audit to obtain reasonable assurance about whether effective internal control over financial reporting was maintained in all material respects. Our audit included obtaining an understanding of internal control over financial reporting, assessing the risk that a material weakness exists, testing and evaluating the design and operating effectiveness of internal control based on the assessed risk, and performing such other procedures as we considered necessary in the circumstances. We believe that our audit provides a reasonable basis for our opinion.
A company’s internal control over financial reporting is a process designed to provide reasonable assurance regarding the reliability of financial reporting and the preparation of financial statements for external purposes in accordance with generally accepted accounting principles. A company’s internal control over financial reporting includes those policies and procedures that (1) pertain to the maintenance of records that, in reasonable detail, accurately and fairly reflect the transactions and dispositions of the assets of the company; (2) provide reasonable assurance that transactions are recorded as necessary to permit preparation of financial statements in accordance with generally accepted accounting principles, and that receipts and expenditures of the company are being made only in accordance with authorizations of management and directors of the company; and (3) provide reasonable assurance regarding prevention or timely detection of unauthorized acquisition, use, or disposition of the company’s assets that could have a material effect on the financial statements.
Because of its inherent limitations, internal control over financial reporting may not prevent or detect misstatements. Also, projections of any evaluation of effectiveness to future periods are subject to the risk that controls may become inadequate because of changes in conditions, or that the degree of compliance with the policies or procedures may deteriorate.
In our report dated March 3, 2014, we expressed an unqualified opinion that Swift Energy Company maintained, in all material respects, effective internal control over financial reporting as of December 31, 2013, based on the COSO criteria. Management has subsequently determined that a deficiency in internal control over financial reporting exists related to the review controls for the full cost ceiling test calculation, specifically analyzing the deferred income tax effects in the calculation, and has further concluded that such deficiency represented a material weakness as of December 31, 2013. As a result, management has revised its assessment, as presented in the accompanying Management’s Annual Report on Internal Control Over Financial Reporting, to conclude that the Company’s internal control over financial reporting was not effective as of December 31, 2013. Accordingly, our present opinion on the effectiveness of the Company’s internal control over financial reporting as of December 31, 2013, as expressed herein, is different from that expressed in our previous report.
A material weakness is a deficiency, or a combination of deficiencies, in internal control over financial reporting, such that there is a reasonable possibility that a material misstatement of the company’s annual or interim financial statements will not be prevented or detected on a timely basis. The following material weakness has been identified and included in management’s assessment. Management has identified a material weakness in a control over the review of the full cost ceiling test write down calculation specifically related to the deferred income tax effects attributable to the Company’s asset retirement obligation. This material weakness resulted in the restatement of Swift Energy Company’s consolidated financial statements as of December 31, 2013 and for the year then ended.
We also have audited, in accordance with the standards of the Public Company Accounting Oversight Board (United States), the consolidated balance sheets of the Company as of December 31, 2013 and 2012, and the related consolidated statements of operations, comprehensive income, stockholders' equity, and cash flows for each of the three years in the period ended December 31, 2013. The material weakness was considered in determining the nature timing and extent of audit tests applied in our audit of those consolidated financial statements, and this report does not affect our report dated March 3, 2014, except for the effects of the restatement described in Note 1A, as to which the date is November 17, 2014, which expressed an unqualified opinion on those financial statements.
46
In our opinion, because of the effect of the material weakness described above on the achievement of the objectives of the control criteria, Swift Energy Company has not maintained effective internal control over financial reporting as of December 31, 2013, based on the COSO criteria.
/s/ ERNST & YOUNG LLP
Houston, Texas
March 3, 2014 except for the effects of the material weakness described in the sixth paragraph above, as to which the date is November 17, 2014
47
Report of Independent Registered Public Accounting Firm
The Board of Directors and Stockholders of Swift Energy Company
We have audited the accompanying consolidated balance sheets of Swift Energy Company and subsidiaries (the “Company”) as of December 31, 2013 and 2012, and the related consolidated statements of operations, comprehensive income, stockholders' equity, and cash flows for each of the three years in the period ended December 31, 2013. These financial statements are the responsibility of the Company's management. Our responsibility is to express an opinion on these financial statements based on our audits.
We conducted our audits in accordance with the standards of the Public Company Accounting Oversight Board (United States). Those standards require that we plan and perform the audit to obtain reasonable assurance about whether the financial statements are free of material misstatement. An audit includes examining, on a test basis, evidence supporting the amounts and disclosures in the financial statements. An audit also includes assessing the accounting principles used and significant estimates made by management, as well as evaluating the overall financial statement presentation. We believe that our audits provide a reasonable basis for our opinion.
In our opinion, the financial statements referred to above present fairly, in all material respects, the consolidated financial position of the Company at December 31, 2013 and 2012, and the consolidated results of their operations and their cash flows for each of the three years in the period ended December 31, 2013, in conformity with U.S. generally accepted accounting principles.
As discussed in Note 1A to the consolidated financial statements, the consolidated financial statements have been restated to correct the write-down of the oil and gas properties and certain other errors.
We also have audited, in accordance with the standards of the Public Company Accounting Oversight Board (United States), the Company's internal control over financial reporting as of December 31, 2013, based on criteria established in Internal Control-Integrated Framework issued by the Committee of Sponsoring Organizations of the Treadway Commission (1992 framework) and our report dated March 3, 2014, except for the effect of the material weakness described in the sixth paragraph of that report as to which the date is November 17, 2014, expressed an adverse opinion thereon.
/s/ ERNST & YOUNG LLP
Houston, Texas
March 3, 2014 except for the effects of the restatement described in Note 1A, as to which the date is November 17, 2014
48
Consolidated Balance Sheets (As Restated)
Swift Energy Company and Subsidiaries (in thousands, except share amounts)
December 31, 2013 (As Restated) | December 31, 2012 (As Restated) | ||||||
ASSETS | |||||||
Current Assets: | |||||||
Cash and cash equivalents | $ | 3,277 | $ | 170 | |||
Accounts receivable | 70,897 | 71,203 | |||||
Deferred tax asset | 10,715 | 8,262 | |||||
Other current assets | 7,600 | 7,370 | |||||
Total Current Assets | 92,489 | 87,005 | |||||
Property and Equipment: | |||||||
Property and Equipment, including $71,452 and $92,579 of unproved property costs not being amortized, respectively | 5,714,099 | 5,192,793 | |||||
Less – Accumulated depreciation, depletion, and amortization | (3,125,282 | ) | (2,824,839 | ) | |||
Property and Equipment, Net | 2,588,817 | 2,367,954 | |||||
Other Long-Term Assets | 17,199 | 18,504 | |||||
Total Assets | $ | 2,698,505 | $ | 2,473,463 | |||
LIABILITIES AND STOCKHOLDERS’ EQUITY | |||||||
Current Liabilities: | |||||||
Accounts payable and accrued liabilities | $ | 82,318 | $ | 77,310 | |||
Accrued capital costs | 61,164 | 73,190 | |||||
Accrued interest | 21,561 | 21,362 | |||||
Undistributed oil and gas revenues | 10,990 | 7,550 | |||||
Total Current Liabilities | 176,033 | 179,412 | |||||
Long-Term Debt | 1,142,368 | 916,934 | |||||
Deferred Tax Liabilities | 241,205 | 234,493 | |||||
Asset Retirement Obligation | 63,225 | 79,643 | |||||
Other Long-Term Liabilities | 10,324 | 10,198 | |||||
Commitments and Contingencies | — | — | |||||
Stockholders' Equity: | |||||||
Preferred stock, $.01 par value, 5,000,000 shares authorized, none outstanding | — | — | |||||
Common stock, $.01 par value, 150,000,000 shares authorized, 43,915,346 and 43,450,367 shares issued, and 43,401,920 and 42,930,071 shares outstanding, respectively | 439 | 435 | |||||
Additional paid-in capital | 762,242 | 748,517 | |||||
Treasury stock held, at cost, 513,426 and 520,296 shares, respectively | (12,575 | ) | (13,855 | ) | |||
Retained earnings | 315,244 | 317,686 | |||||
Total Stockholders’ Equity | 1,065,350 | 1,052,783 | |||||
Total Liabilities and Stockholders’ Equity | $ | 2,698,505 | $ | 2,473,463 | |||
See accompanying Notes to Consolidated Financial Statements. | |||||||
49
Consolidated Statements of Operations (As Restated)
Swift Energy Company and Subsidiaries (in thousands, except per-share amounts)
Year Ended December 31, | |||||||||||
2013 (As Restated) | 2012 (As Restated) | 2011 (As Restated) | |||||||||
Revenues: | |||||||||||
Oil and gas sales | $ | 585,229 | $ | 558,390 | $ | 601,019 | |||||
Price-risk management and other, net | (828 | ) | 3,096 | (3,210 | ) | ||||||
Total Revenues | 584,401 | 561,486 | 597,809 | ||||||||
Costs and Expenses: | |||||||||||
General and administrative, net | 45,423 | 47,097 | 45,325 | ||||||||
Depreciation, depletion, and amortization | 252,769 | 249,344 | 223,081 | ||||||||
Accretion of asset retirement obligation | 6,181 | 5,121 | 4,570 | ||||||||
Lease operating cost | 99,731 | 97,835 | 89,069 | ||||||||
Transportation and gas processing | 21,044 | 19,467 | 15,722 | ||||||||
Severance and other taxes | 42,725 | 47,546 | 53,351 | ||||||||
Interest expense, net | 69,382 | 57,303 | 35,566 | ||||||||
Write-down of oil and gas properties | 46,948 | — | — | ||||||||
Total Costs and Expenses | 584,203 | 523,713 | 466,684 | ||||||||
Income from Continuing Operations Before Income Taxes | 198 | 37,773 | 131,125 | ||||||||
Provision for Income Taxes | 2,640 | 16,072 | 49,054 | ||||||||
Income (Loss) from Continuing Operations | (2,442 | ) | 21,701 | 82,071 | |||||||
Income from Discontinued Operations, net of taxes | — | — | 14,211 | ||||||||
Net Income (Loss) | $ | (2,442 | ) | $ | 21,701 | $ | 96,282 | ||||
Per Share Amounts- | |||||||||||
Basic: Income (Loss) from Continuing Operations | $ | (0.06 | ) | $ | 0.51 | $ | 1.94 | ||||
Income from Discontinued Operations, net of taxes | — | — | 0.34 | ||||||||
Net Income (Loss) | $ | (0.06 | ) | $ | 0.51 | $ | 2.27 | ||||
Diluted: Income (Loss) from Continuing Operations | $ | (0.06 | ) | $ | 0.50 | $ | 1.91 | ||||
Income from Discontinued Operations, net of taxes | — | — | 0.33 | ||||||||
Net Income (Loss) | $ | (0.06 | ) | $ | 0.50 | $ | 2.24 | ||||
Weighted Average Shares Outstanding - Basic | 43,331 | 42,840 | 42,394 | ||||||||
Weighted Average Shares Outstanding - Diluted | 43,331 | 43,174 | 42,896 | ||||||||
See accompanying Notes to Consolidated Financial Statements. | |||||||||||
50
Consolidated Statements of Comprehensive Income (As Restated)
Swift Energy Company and Subsidiaries (in thousands)
Year Ended December 31, | |||||||||||
2013 (As Restated) | 2012 (As Restated) | 2011 (As Restated) | |||||||||
Net Income (Loss): | $ | (2,442 | ) | $ | 21,701 | $ | 96,282 | ||||
Other Comprehensive Income: | |||||||||||
Unrealized gains (losses) related to price risk management transactions, before taxes | — | 1,210 | (520 | ) | |||||||
Provision (benefit) for income taxes | — | 440 | (190 | ) | |||||||
Unrealized gains (losses) related to price risk management transactions, net of taxes | — | 770 | (330 | ) | |||||||
Less: reclassification of (gains) losses on price risk management transactions to net income, before taxes | — | (1,210 | ) | 738 | |||||||
(Provision) benefit for income taxes | — | (440 | ) | 270 | |||||||
Reclassification of (gains) losses on price risk management transactions to net income, net of taxes | — | (770 | ) | 468 | |||||||
Other comprehensive income, before income taxes | — | — | 218 | ||||||||
Provision for income taxes | — | — | 80 | ||||||||
Other comprehensive income, net of taxes | — | — | 138 | ||||||||
Comprehensive Income (Loss) | $ | (2,442 | ) | $ | 21,701 | $ | 96,420 | ||||
See accompanying Notes to Consolidated Financial Statements. | |||||||||||
51
Consolidated Statements of Stockholders’ Equity (As Restated)
Swift Energy Company and Subsidiaries (in thousands, except share amounts)
Common Stock | Additional Paid-in Capital | Treasury Stock | Retained Earnings | Accumulated Other Comprehensive Income (Loss) | Total | ||||||||||||||||||
Balance, December 31, 2010 (As Reported) | $ | 424 | $ | 706,857 | $ | (9,778 | ) | $ | 182,652 | $ | (138 | ) | $ | 880,017 | |||||||||
Cumulative effect of adjustments | $ | — | $ | — | $ | — | $ | 17,051 | $ | — | $ | 17,051 | |||||||||||
Balance, December 31, 2010 (As Restated) | $ | 424 | $ | 706,857 | $ | (9,778 | ) | $ | 199,703 | $ | (138 | ) | $ | 897,068 | |||||||||
Stock issued for benefit plans (37,068 shares) | — | 791 | 821 | — | — | 1,612 | |||||||||||||||||
Shares issued from option exercises (130,902 shares) | 1 | 1,150 | — | — | — | 1,151 | |||||||||||||||||
Purchase of treasury shares (80,014 shares) | — | — | (3,393 | ) | — | — | (3,393 | ) | |||||||||||||||
Tax benefits from share-based compensation | — | 333 | — | — | — | 333 | |||||||||||||||||
Employee stock purchase plan (49,089 shares) | 1 | 999 | — | — | — | 1,000 | |||||||||||||||||
Issuance of restricted stock (348,972 shares) | 4 | (4 | ) | — | — | — | — | ||||||||||||||||
Amortization of share-based compensation | — | 17,160 | — | — | — | 17,160 | |||||||||||||||||
Net Income | — | — | — | 96,282 | — | 96,282 | |||||||||||||||||
Other comprehensive income | — | — | — | — | 138 | 138 | |||||||||||||||||
Balance, December 31, 2011 (As Restated) | $ | 430 | $ | 727,286 | $ | (12,350 | ) | $ | 295,985 | $ | — | $ | 1,011,351 | ||||||||||
Stock issued for benefit plans (50,987 shares) | — | 354 | 1,300 | — | — | 1,654 | |||||||||||||||||
Shares issued from option exercises (63,040 shares) | 1 | 635 | — | — | — | 636 | |||||||||||||||||
Purchase of treasury shares (86,812 shares) | — | — | (2,805 | ) | — | — | (2,805 | ) | |||||||||||||||
Tax benefits from share-based compensation | — | 175 | — | — | — | 175 | |||||||||||||||||
Employee stock purchase plan (42,624 shares) | — | 1,076 | — | — | — | 1,076 | |||||||||||||||||
Issuance of restricted stock (375,157 shares) | 4 | (4 | ) | — | — | — | — | ||||||||||||||||
Amortization of share-based compensation | — | 18,995 | — | — | — | 18,995 | |||||||||||||||||
Net Income | — | — | — | 21,701 | — | 21,701 | |||||||||||||||||
Balance, December 31, 2012 (As Restated) | $ | 435 | $ | 748,517 | $ | (13,855 | ) | $ | 317,686 | $ | — | $ | 1,052,783 | ||||||||||
Stock issued for benefit plans (104,890 shares) | — | (1,171 | ) | 2,793 | — | — | 1,622 | ||||||||||||||||
Shares issued from option exercises (1,125 shares) | — | 4 | — | — | — | 4 | |||||||||||||||||
Purchase of treasury shares (98,020 shares) | — | — | (1,513 | ) | — | — | (1,513 | ) | |||||||||||||||
Tax shortfall from share-based compensation | — | (1,607 | ) | — | — | — | (1,607 | ) | |||||||||||||||
Employee stock purchase plan (72,273 shares) | 1 | 945 | — | — | — | 946 | |||||||||||||||||
Issuance of restricted stock (391,581 shares) | 3 | (3 | ) | — | — | — | — | ||||||||||||||||
Amortization of share-based compensation | — | 15,557 | — | — | — | 15,557 | |||||||||||||||||
Net Loss | — | — | — | (2,442 | ) | — | (2,442 | ) | |||||||||||||||
Balance, December 31, 2013 (As Restated) | $ | 439 | $ | 762,242 | $ | (12,575 | ) | $ | 315,244 | $ | — | $ | 1,065,350 | ||||||||||
See accompanying Notes to Consolidated Financial Statements. | |||||||||||||||||||||||
52
Consolidated Statements of Cash Flows (As Restated)
Swift Energy Company and Subsidiaries (in thousands)
Year Ended December 31, | |||||||||||
2013 (As Restated) | 2012 (As Restated) | 2011 (As Restated) | |||||||||
Cash Flows from Operating Activities: | |||||||||||
Net income (loss) | $ | (2,442 | ) | $ | 21,701 | $ | 96,282 | ||||
Gain from discontinued operations, net of taxes | — | — | (14,211 | ) | |||||||
Adjustments to reconcile net income to net cash provided by operating activities- | |||||||||||
Write-down of oil and gas properties | 46,948 | — | — | ||||||||
Depreciation, depletion, and amortization | 252,769 | 249,344 | 223,081 | ||||||||
Accretion of asset retirement obligation | 6,181 | 5,121 | 4,570 | ||||||||
Deferred income taxes | 2,647 | 17,231 | 47,555 | ||||||||
Share-based compensation expense | 10,099 | 13,795 | 12,955 | ||||||||
Other | (5,443 | ) | 976 | 2,143 | |||||||
Change in assets and liabilities- | |||||||||||
(Increase) decrease in accounts receivable | (1,894 | ) | (1,534 | ) | (11,303 | ) | |||||
Increase (decrease) in accounts payable and accrued liabilities | 2,607 | (1,013 | ) | 10,610 | |||||||
Increase (decrease) in income taxes payable | (224 | ) | 82 | (73 | ) | ||||||
Increase in accrued interest | 199 | 8,903 | 1,449 | ||||||||
Cash provided by operating activities – continuing operations | 311,447 | 314,606 | 373,058 | ||||||||
Cash used by operating activities – discontinued operations | — | — | (2 | ) | |||||||
Net Cash Provided by Operating Activities | 311,447 | 314,606 | 373,056 | ||||||||
Cash Flows from Investing Activities: | |||||||||||
Additions to property and equipment | (540,368 | ) | (757,755 | ) | (505,332 | ) | |||||
Proceeds from the sale of property and equipment | 6,991 | 528 | 50,284 | ||||||||
Cash used in investing activities – continuing operations | (533,377 | ) | (757,227 | ) | (455,048 | ) | |||||
Cash provided by investing activities – discontinued operations | — | — | 5,000 | ||||||||
Net Cash Used in Investing Activities | (533,377 | ) | (757,227 | ) | (450,048 | ) | |||||
Cash Flows from Financing Activities: | |||||||||||
Proceeds from long-term debt | — | 157,500 | 247,890 | ||||||||
Net proceeds from bank borrowings | 225,600 | 39,400 | — | ||||||||
Net proceeds from issuances of common stock | 950 | 1,712 | 2,151 | ||||||||
Purchase of treasury shares | (1,513 | ) | (2,805 | ) | (3,393 | ) | |||||
Payments of debt issuance costs | — | (4,712 | ) | (4,327 | ) | ||||||
Cash provided by financing activities – continuing operations | 225,037 | 191,095 | 242,321 | ||||||||
Cash provided by financing activities – discontinued operations | — | — | — | ||||||||
Net Cash Provided by Financing Activities | 225,037 | 191,095 | 242,321 | ||||||||
Net Increase (decrease) in Cash and Cash Equivalents | 3,107 | (251,526 | ) | 165,329 | |||||||
Cash and Cash Equivalents at Beginning of Period | 170 | 251,696 | 86,367 | ||||||||
Cash and Cash Equivalents at End of Period | $ | 3,277 | $ | 170 | $ | 251,696 | |||||
Supplemental Disclosures of Cash Flows Information: | |||||||||||
Cash paid during period for interest, net of amounts capitalized | $ | 67,070 | $ | 46,911 | $ | 32,078 | |||||
Cash paid during period for income taxes | $ | 217 | $ | 248 | $ | 1,770 | |||||
See accompanying Notes to Consolidated Financial Statements. | |||||||||||
53
Notes to Consolidated Financial Statements
Swift Energy Company and Subsidiaries
1A. Restatement of Previously Issued Consolidated Financial Statements
Overview. In connection with the preparation of our financial statements for the quarter ended September 30, 2014, we determined that the ceiling test calculation we had prepared at December 31, 2013, March 31, 2009 and December 31, 2008, to determine whether the net book value of the Company's oil and gas properties exceed the ceiling, incorrectly included the deferred income tax effect of the Company's asset retirement obligations when computing the ceiling test limitation of its oil and natural gas properties under the full-cost method of accounting. The Company determined that the error caused a material overstatement of its full-cost ceiling test write-down of oil and gas properties in periods prior to 2014, more specifically in the fourth quarter of 2013, in the first quarter of 2009 and the fourth quarter of 2008, including associated depletion for all periods presented. As a result of this error, we are restating our audited consolidated financial statements for the years ended December 31, 2013, 2012 and 2011 and our unaudited condensed consolidated financial information for the quarters ended March 31, 2013, June 30, 2013, September 30, 2013, and December 31, 2013.
As of December 31, 2013, the correction of this error increased the Company's net oil and gas property balances by approximately $49 million, increased net deferred tax liabilities by approximately $18 million, and increased retained earnings by approximately $31 million. Approximately $15 million of the increase in retained earnings is related to periods prior to 2013, more specifically to the first quarter of 2009 and the fourth quarter of 2008. For the year ended December 31, 2013, the correction of the ceiling test error resulted in a decrease in our ceiling-test write-down for the year ended December 31, 2013 of approximately $27 million, which was partially offset by an increase in our depreciation, depletion and amortization expense for full year 2013 of approximately $1 million. These corrections increased net income for the year ended December 31, 2013 by approximately $16 million (net of an increase to the income tax benefit of approximately $9 million for the period).
Along with restating our financial statements to correct the error discussed above, we have recorded adjustments for certain previously identified immaterial accounting errors related to the periods covered by this Form 10-K/A. When these financial statements were originally issued, we assessed the impact of these errors and concluded that they were not material to our financial statements for the each of the years ended December 31, 2013, 2012, and 2011, and reported fiscal quarters within each of these years. However, in conjunction with our need to restate our financial statements as a result of the error noted above, we have determined that it would be appropriate to make adjustments for all such previously unrecorded adjustments in this Form 10-K/A.
The combined impacts of all adjustments to the applicable line items in our audited consolidated financial statements for the periods covered by this Form 10K-A are provided in the tables below.
Financial Statement Presentation. In addition to the restatement of our consolidated financial statements, we have also restated the following items to reflect certain changes noted above.
• | Note 1. Summary of Significant Accounting Policies |
• | Note 2. Earnings Per Share |
• | Note 3. Provision for Income Taxes |
• | Note 6. Share-Based Compensation |
• | Supplemental Information – Capitalized Costs |
• | Supplemental Information – Selected Quarterly Financial Data (Unaudited) |
54
Notes to Condensed Consolidated Financial Statements
Swift Energy Company and Subsidiaries (continued)
The following tables present the effect of the correction of the ceiling test calculation error and other adjustments on selected line items of our previously reported consolidated financial statements for the years ended December 31, 2013, 2012 and 2011 (in thousands):
Consolidated Balance Sheet as of December 31, 2013 | |||||||||
(As Reported) | Adjustments | (As Restated) | |||||||
Accounts Receivable | $ | 70,897 | $ | — | $ | 70,897 | |||
Deferred Tax Asset | 4,974 | 5,741 | 10,715 | ||||||
Total Current Assets | 86,748 | 5,741 | 92,489 | ||||||
Accumulated depreciation, depletion, and amortization | (3,174,453 | ) | 49,171 | (3,125,282 | ) | ||||
Property and Equipment, Net | 2,539,646 | 49,171 | 2,588,817 | ||||||
Total Assets | 2,643,593 | 54,912 | 2,698,505 | ||||||
Accounts payable and accrued liabilities | 83,361 | (1,043 | ) | 82,318 | |||||
Total Current Liabilities | 177,076 | (1,043 | ) | 176,033 | |||||
Deferred Tax Liabilities | 217,384 | 23,821 | 241,205 | ||||||
Other Long-Term Liabilities | 10,324 | — | 10,324 | ||||||
Additional paid-in capital | 761,972 | 270 | 762,242 | ||||||
Retained earnings | 283,380 | 31,864 | 315,244 | ||||||
Total Stockholders’ Equity | 1,033,216 | 32,134 | 1,065,350 | ||||||
Total Liabilities and Stockholders’ Equity | 2,643,593 | 54,912 | 2,698,505 | ||||||
Consolidated Balance Sheet as of December 31, 2012 | |||||||||
(As Reported) | Adjustments | (As Restated) | |||||||
Accounts Receivable (2) | $ | 67,318 | $ | 3,885 | $ | 71,203 | |||
Deferred Tax Asset (1) | 5,679 | 2,583 | 8,262 | ||||||
Total Current Assets | 80,537 | 6,468 | 87,005 | ||||||
Accumulated depreciation, depletion, and amortization (1) | (2,847,773 | ) | 22,934 | (2,824,839 | ) | ||||
Property and Equipment, Net | 2,345,020 | 22,934 | 2,367,954 | ||||||
Total Assets | 2,444,061 | 29,402 | 2,473,463 | ||||||
Accounts payable and accrued liabilities | 75,378 | 1,932 | 77,310 | ||||||
Total Current Liabilities | 177,480 | 1,932 | 179,412 | ||||||
Deferred Tax Liabilities (1) | 223,243 | 11,250 | 234,493 | ||||||
Other Long-Term Liabilities | 9,901 | 297 | 10,198 | ||||||
Additional paid-in capital | 747,868 | 649 | 748,517 | ||||||
Retained earnings (1) | 302,412 | 15,274 | 317,686 | ||||||
Total Stockholders’ Equity | 1,036,860 | 15,923 | 1,052,783 | ||||||
Total Liabilities and Stockholders’ Equity | 2,444,061 | 29,402 | 2,473,463 | ||||||
(1) The adjustments column includes the impact of correcting the error in the ceiling test write-down as of December 31, 2012. Included in these amounts are approximately $23 million related to Accumulated depreciation, depletion, and amortization, $9 million related to the net deferred tax liabilities and $15 million related to retained earnings.
(2) The adjustments column includes the impact of a $2.9 million revenue adjustment related to the 2012 finalization of a property unitization which was originally recorded in 2013.
55
Notes to Condensed Consolidated Financial Statements
Swift Energy Company and Subsidiaries (continued)
Consolidated Statement of Operations for the year ended December 31, 2013 | |||||||||
(As Reported) | Adjustments | (As Restated) | |||||||
Oil and Gas Sales (2) | $ | 588,541 | $ | (3,312 | ) | $ | 585,229 | ||
Total Revenues | 587,713 | (3,312 | ) | 584,401 | |||||
General and Administrative, net | 45,802 | (379 | ) | 45,423 | |||||
Depreciation, depletion, and amortization | 252,043 | 726 | 252,769 | ||||||
Lease operating cost | 101,611 | (1,880 | ) | 99,731 | |||||
Transportation and gas processing | 22,336 | (1,292 | ) | 21,044 | |||||
Severance and other taxes | 42,252 | 473 | 42,725 | ||||||
Write-down of oil and gas properties | 73,911 | (26,963 | ) | 46,948 | |||||
Total Costs and Expenses | 613,518 | (29,315 | ) | 584,203 | |||||
Income (Loss) from Continuing Operations Before Income Taxes | (25,805 | ) | 26,003 | 198 | |||||
Provision (Benefit) for Income Taxes | (6,773 | ) | 9,413 | 2,640 | |||||
Income (Loss) from Continuing Operations | (19,032 | ) | 16,590 | (2,442 | ) | ||||
Net Income (Loss) | (19,032 | ) | 16,590 | (2,442 | ) | ||||
Basic EPS: Income (Loss) from Continuing Operations | $ | (0.44 | ) | $ | 0.38 | $ | (0.06 | ) | |
Basic EPS: Net Income (Loss) | $ | (0.44 | ) | $ | 0.38 | $ | (0.06 | ) | |
Diluted EPS: Income (Loss) from Continuing Operations | $ | (0.44 | ) | $ | 0.38 | $ | (0.06 | ) | |
Diluted EPS: Net Income (Loss) | $ | (0.44 | ) | $ | 0.38 | $ | (0.06 | ) | |
(2) The adjustments column includes the impact of a $2.9 million revenue adjustment related to the 2012 finalization of a property unitization which was originally recorded in 2013.
Consolidated Statements of Operations for the year ended December 31, 2012 | |||||||||
(As Reported) | Adjustments | (As Restated) | |||||||
Oil and Gas Sales (2) | $ | 554,194 | $ | 4,196 | $ | 558,390 | |||
Total Revenues | 557,290 | 4,196 | 561,486 | ||||||
General and Administrative, net | 46,778 | 319 | 47,097 | ||||||
Depreciation, depletion, and amortization | 247,178 | 2,166 | 249,344 | ||||||
Lease operating cost | 97,295 | 540 | 97,835 | ||||||
Transportation and gas processing | 18,175 | 1,292 | 19,467 | ||||||
Severance and other taxes | 48,862 | (1,316 | ) | 47,546 | |||||
Total Costs and Expenses | 520,712 | 3,001 | 523,713 | ||||||
Income (Loss) from Continuing Operations Before Income Taxes | 36,578 | 1,195 | 37,773 | ||||||
Provision (Benefit) for Income Taxes | 15,639 | 433 | 16,072 | ||||||
Income (Loss) from Continuing Operations | 20,939 | 762 | 21,701 | ||||||
Net Income (Loss) | 20,939 | 762 | 21,701 | ||||||
Basic EPS: Income (Loss) from Continuing Operations | $ | 0.49 | $ | 0.02 | $ | 0.51 | |||
Basic EPS: Net Income (Loss) | $ | 0.49 | $ | 0.02 | $ | 0.51 | |||
Diluted EPS: Income (Loss) from Continuing Operations | $ | 0.48 | $ | 0.02 | $ | 0.50 | |||
Diluted EPS: Net Income (Loss) | $ | 0.48 | $ | 0.02 | $ | 0.50 | |||
56
Notes to Condensed Consolidated Financial Statements
Swift Energy Company and Subsidiaries (continued)
Consolidated Statements of Operations for the year ended December 31, 2011 | |||||||||
(As Reported) | Adjustments | (As Restated) | |||||||
Oil and Gas Sales | $ | 602,341 | $ | (1,322 | ) | $ | 601,019 | ||
Total Revenues | 599,131 | (1,322 | ) | 597,809 | |||||
General and Administrative, net | 45,362 | (37 | ) | 45,325 | |||||
Depreciation, depletion, and amortization | 221,230 | 1,851 | 223,081 | ||||||
Severance and other taxes | 52,508 | 843 | 53,351 | ||||||
Total Costs and Expenses | 464,027 | 2,657 | 466,684 | ||||||
Income (Loss) from Continuing Operations Before Income Taxes | 135,104 | (3,979 | ) | 131,125 | |||||
Provision (Benefit) for Income Taxes | 50,494 | (1,440 | ) | 49,054 | |||||
Income (Loss) from Continuing Operations | 84,610 | (2,539 | ) | 82,071 | |||||
Net Income (Loss) | 98,821 | (2,539 | ) | 96,282 | |||||
Basic EPS: Income (Loss) from Continuing Operations | $ | 2.00 | $ | (0.06 | ) | $ | 1.94 | ||
Basic EPS: Net Income (Loss) | $ | 2.33 | $ | (0.06 | ) | $ | 2.27 | ||
Diluted EPS: Income (Loss) from Continuing Operations | $ | 1.97 | $ | (0.06 | ) | $ | 1.91 | ||
Diluted EPS: Net Income (Loss) | $ | 2.30 | $ | (0.06 | ) | $ | 2.24 | ||
Consolidated Statements of Comprehensive Income for the year ended December 31, | |||||||||||||||||||||||||||||
2013 | 2012 | 2011 | |||||||||||||||||||||||||||
(As Reported) | Adjustments | (As Restated) | (As Reported) | Adjustments | (As Restated) | (As Reported) | Adjustments | (As Restated) | |||||||||||||||||||||
Net Income (Loss) | $ | (19,032 | ) | $ | 16,590 | $ | (2,442 | ) | $ | 20,939 | $ | 762 | $ | 21,701 | $ | 98,821 | $ | (2,539 | ) | $ | 96,282 | ||||||||
Comprehensive Income (Loss) | (19,032 | ) | 16,590 | (2,442 | ) | 20,939 | 762 | 21,701 | 98,959 | (2,539 | ) | 96,420 | |||||||||||||||||
Consolidated Statements of Cash Flows for the year ended December 31, 2013 | |||
(As Reported) | Adjustments | (As Restated) | |
Net income (loss) | $(19,032) | $16,590 | $(2,442) |
Write-down of oil and gas properties | 73,911 | (26,963) | 46,948 |
Depreciation, depletion, and amortization | 252,043 | 726 | 252,769 |
Deferred income taxes | (6,766) | 9,413 | 2,647 |
Share-based compensation expense | 10,478 | (379) | 10,099 |
Other | (5,146) | (297) | (5,443) |
(Increase) decrease in accounts receivable | (5,779) | 3,885 | (1,894) |
Increase (decrease) in accounts payable and accrued liabilities | 5,582 | (2,975) | 2,607 |
Cash provided by operating activities – continuing operations | 311,447 | — | 311,447 |
57
Notes to Condensed Consolidated Financial Statements
Swift Energy Company and Subsidiaries (continued)
Consolidated Statements of Cash Flows for the year ended December 31, 2012 | |||||||||
(As Reported) | Adjustments | (As Restated) | |||||||
Net income (loss) | $ | 20,939 | $ | 762 | $ | 21,701 | |||
Depreciation, depletion, and amortization | 247,178 | 2,166 | 249,344 | ||||||
Deferred income taxes | 16,798 | 433 | 17,231 | ||||||
Share-based compensation expense | 13,476 | 319 | 13,795 | ||||||
(Increase) decrease in accounts receivable | 3,235 | (4,769 | ) | (1,534 | ) | ||||
Increase (decrease) in accounts payable and accrued liabilities | (2,102 | ) | 1,089 | (1,013 | ) | ||||
Cash provided by operating activities – continuing operations | 314,606 | — | 314,606 | ||||||
Consolidated Statements of Cash Flows for the year ended December 31, 2011 | |||||||||
(As Reported) | Adjustments | (As Restated) | |||||||
Net income (loss) | $ | 98,821 | $ | (2,539 | ) | $ | 96,282 | ||
Depreciation, depletion, and amortization | 221,230 | 1,851 | 223,081 | ||||||
Deferred income taxes | 48,995 | (1,440 | ) | 47,555 | |||||
Share-based compensation expense | 12,625 | 330 | 12,955 | ||||||
(Increase) decrease in accounts receivable | (12,625 | ) | 1,322 | (11,303 | ) | ||||
Increase (decrease) in accounts payable and accrued liabilities | 10,134 | 476 | 10,610 | ||||||
Cash provided by operating activities – continuing operations | 373,058 | — | 373,058 | ||||||
1. Summary of Significant Accounting Policies (As Restated)
Principles of Consolidation. The accompanying consolidated financial statements include the accounts of Swift Energy and its wholly owned subsidiaries, which are engaged in the exploration, development, acquisition, and operation of oil and gas properties, with a focus on inland waters and onshore oil and natural gas reserves in Louisiana and Texas. Our undivided interests in oil and gas properties are accounted for using the proportionate consolidation method, whereby our proportionate share of each entity’s assets, liabilities, revenues, and expenses are included in the appropriate classifications in the accompanying consolidated financial statements. Intercompany balances and transactions have been eliminated in preparing the accompanying consolidated financial statements.
Discontinued Operations. Unless otherwise indicated, information presented in the notes to the consolidated financial statements relates only to Swift Energy’s continuing operations. Information related to discontinued operations is included in Note 8 and in some instances, where appropriate, is included as a separate disclosure within the individual footnotes.
Subsequent Events. We have evaluated subsequent events of our consolidated financial statements. There were no material subsequent events requiring additional disclosure in these financial statements.
Use of Estimates. The preparation of financial statements in conformity with accounting principles generally accepted in the United States (“GAAP”) requires us to make estimates and assumptions that affect the reported amounts of certain assets and liabilities and the reported amounts of certain revenues and expenses during each reporting period. We believe our estimates and assumptions are reasonable; however, such estimates and assumptions are subject to a number of risks and uncertainties that may cause actual results to differ materially from such estimates. Significant estimates and assumptions underlying these financial statements include:
• | the estimated quantities of proved oil and natural gas reserves used to compute depletion of oil and natural gas properties and the related present value of estimated future net cash flows there-from, |
• | estimates related to the collectability of accounts receivable and the credit worthiness of our customers, |
• | estimates of the counterparty bank risk related to letters of credit that our customers may have issued on our behalf, |
• | estimates of future costs to develop and produce reserves, |
58
• | accruals related to oil and gas sales, capital expenditures and lease operating expenses, |
• | estimates of insurance recoveries related to property damage, and the solvency of insurance providers, |
• | estimates in the calculation of share-based compensation expense, |
• | estimates of our ownership in properties prior to final division of interest determination, |
• | the estimated future cost and timing of asset retirement obligations, |
• | estimates made in our income tax calculations, |
• | estimates in the calculation of the fair value of hedging assets and liabilities, and |
• | estimates in the assessment of current litigation claims against the company. |
While we are not aware of any material revisions to any of our estimates, there will likely be future revisions to our estimates resulting from matters such as new accounting pronouncements, changes in ownership interests, payouts, joint venture audits, re-allocations by purchasers or pipelines, or other corrections and adjustments common in the oil and gas industry, many of which require retroactive application. These types of adjustments cannot be currently estimated and will be recorded in the period during which the adjustments occur.
We are subject to legal proceedings, claims, liabilities and environmental matters that arise in the ordinary course of business. We accrue for losses when such losses are considered probable and the amounts can be reasonably estimated.
Property and Equipment. We follow the “full-cost” method of accounting for oil and natural gas property and equipment costs. Under this method of accounting, all productive and nonproductive costs incurred in the exploration, development, and acquisition of oil and natural gas reserves are capitalized. Such costs may be incurred both prior to and after the acquisition of a property and include lease acquisitions, geological and geophysical services, drilling, completion, and equipment. Internal costs incurred that are directly identified with exploration, development, and acquisition activities undertaken by us for our own account, and which are not related to production, general corporate overhead, or similar activities, are also capitalized. For the years ended December 31, 2013, 2012 and 2011, such internal costs capitalized totaled $31.8 million, $31.1 million and $29.3 million, respectively. Interest costs are also capitalized to unproved oil and natural gas properties. For the years ended December 31, 2013, 2012 and 2011, capitalized interest on unproved properties totaled $7.2 million, $7.9 million and $7.7 million, respectively. Interest not capitalized and general and administrative costs related to production and general corporate overhead are expensed as incurred.
The “Property and Equipment” balances on the accompanying consolidated balance sheets are summarized for presentation purposes. The following is a detailed breakout of our “Property and Equipment” balances.
(in thousands) | December 31, 2013 (As Restated) | December 31, 2012 (As Restated) | |||||
Property and Equipment | |||||||
Proved oil and gas properties | $ | 5,600,279 | $ | 5,058,524 | |||
Unproved oil and gas properties | 71,452 | 92,579 | |||||
Furniture, fixtures, and other equipment | 42,368 | 41,690 | |||||
Less – Accumulated depreciation, depletion, and amortization | (3,125,282 | ) | (2,824,839 | ) | |||
Property and Equipment, Net | $ | 2,588,817 | $ | 2,367,954 | |||
No gains or losses are recognized upon the sale or disposition of oil and natural gas properties, except in transactions involving a significant amount of reserves or where the proceeds from the sale of oil and natural gas properties would significantly alter the relationship between capitalized costs and proved reserves of oil and natural gas attributable to a cost center. Internal costs associated with selling properties are expensed as incurred.
Future development costs are estimated property-by-property based on current economic conditions and are amortized to expense as our capitalized oil and gas property costs are amortized.
We compute the provision for depreciation, depletion, and amortization (“DD&A”) of oil and natural gas properties using the unit-of-production method. Under this method, we compute the provision by multiplying the total unamortized costs of oil and gas properties—including future development costs, gas processing facilities, and both capitalized asset retirement obligations and undiscounted abandonment costs of wells to be drilled, net of salvage values, but excluding costs of unproved properties—by an overall rate determined by dividing the physical units of oil and natural gas produced during the period by the total estimated
59
units of proved oil and natural gas reserves at the beginning of the period. This calculation is done on a country-by-country basis, and the period over which we will amortize these properties is dependent on our production from these properties in future years. Furniture, fixtures, and other equipment are recorded at cost and are depreciated by the straight-line method at rates based on the estimated useful lives of the property, which range between two and 20 years. Repairs and maintenance are charged to expense as incurred. Renewals and betterments are capitalized.
Geological and geophysical (“G&G”) costs incurred on developed properties are recorded in “Proved properties” and therefore subject to amortization. G&G costs incurred that are directly associated with specific unproved properties are capitalized in “Unproved properties” and evaluated as part of the total capitalized costs associated with a prospect. The cost of unproved properties not being amortized is assessed quarterly, on a property-by-property basis, to determine whether such properties have been impaired. In determining whether such costs should be impaired, we evaluate current drilling results, lease expiration dates, current oil and gas industry conditions, international economic conditions, capital availability, and available geological and geophysical information. Any impairment assessed is added to the cost of proved properties being amortized.
Full-Cost Ceiling Test. At the end of each quarterly reporting period, the unamortized cost of oil and natural gas properties (including natural gas processing facilities, capitalized asset retirement obligations, net of related salvage values and deferred income taxes, and excluding the recognized asset retirement obligation liability) is limited to the sum of the estimated future net revenues from proved properties (excluding cash outflows from recognized asset retirement obligations, including future development and abandonment costs of wells to be drilled, using the preceding 12-months’ average price based on closing prices on the first day of each month, adjusted for price differentials, discounted at 10%, and the lower of cost or fair value of unproved properties) adjusted for related income tax effects (“Ceiling Test”). This calculation is done on a country-by-country basis.
The calculations of the Ceiling Test and provision for DD&A are based on estimates of proved reserves. There are numerous uncertainties inherent in estimating quantities of proved reserves and in projecting the future rates of production, timing, and plan of development. The accuracy of any reserves estimate is a function of the quality of available data and of engineering and geological interpretation and judgment. Results of drilling, testing, and production subsequent to the date of the estimate may justify revision of such estimates. Accordingly, reserves estimates are often different from the quantities of oil and natural gas that are ultimately recovered.
Due to the effects of pricing, timing of projects and changes in our reserves product mix, in 2013 we reported a non-cash write-down on a before-tax basis of $46.9 million (restated) on our oil and natural gas properties.
It is reasonably possible that our estimate of discounted future net cash flows from proved oil and natural gas reserves could change in the near term and that additional non-cash write-downs of oil and natural gas properties would occur in the future. If future capital expenditures out pace future discounted net cash flows in our reserve calculations, if we have significant declines in our oil and natural gas reserves volumes (which also reduces our estimate of discounted future net cash flows from proved oil and natural gas reserves) or if oil or natural gas prices decline, non-cash write-downs of our oil and natural gas properties could occur in the future. We cannot control and cannot predict what future prices for oil and natural gas will be, thus we cannot estimate the amount or timing of any potential future non-cash write-down of our oil and natural gas properties due to decreases in oil or natural gas prices.
Revenue Recognition. Oil and gas revenues are recognized when production is sold to a purchaser at a fixed or determinable price, when delivery has occurred and title has transferred, and if collectability of the revenue is probable. Swift Energy uses the entitlement method of accounting in which we recognize our ownership interest in production as revenue. If our sales exceed our ownership share of production, the natural gas balancing payables are reported in “Accounts payable and accrued liabilities” on the accompanying consolidated balance sheets. Natural gas balancing receivables are reported in “Other current assets” on the accompanying consolidated balance sheets when our ownership share of production exceeds sales. As of December 31, 2013 and 2012, we did not have any material natural gas imbalances.
Reclassification of Prior Period Balances. Certain reclassifications have been made to prior period amounts to conform to the current-year presentation.
Accounts Receivable. We assess the collectability of accounts receivable, and based on our judgment, we accrue a reserve when we believe a receivable may not be collected. At December 31, 2013 and 2012, we had an allowance for doubtful accounts of approximately $0.1 million. The allowance for doubtful accounts has been deducted from the total “Accounts receivable” balance on the accompanying consolidated balance sheets.
60
At December 31, 2013, our “Accounts receivable” balance included $56.9 million for oil and gas sales, $1.6 million for joint interest owners, $11.6 million for severance tax credit receivables and $0.8 million for other receivables. At December 31, 2012, our “Accounts receivable” balance included $57.2 million (restated) for oil and gas sales, $3.6 million for joint interest owners, $6.4 million (restated) for severance tax credit receivables and $4.0 million (restated) for other receivables.
Debt Issuance Costs. Legal fees, accounting fees, underwriting fees, printing costs, and other direct expenses associated with extensions of our bank credit facility and public debt offerings were capitalized and are amortized on an effective interest basis over the life of each of the respective senior note offerings and credit facility.
The 7.125% senior notes due in 2017 mature on June 1, 2017, and the remaining balance of their issuance costs at December 31, 2013, was $1.8 million. The 8.875% senior notes due in 2020 mature on January 15, 2020, and the remaining balance of their issuance costs at December 31, 2013, was $3.6 million. The 7.875% senior notes due in 2022 mature on March 1, 2022, and the balance of their remaining issuance costs at December 31, 2013, was $6.5 million. The remaining balance of revolving credit facility issuance costs at December 31, 2013, was $3.3 million.
Price-Risk Management Activities. The Company follows FASB ASC 815-10, which requires that changes in the derivative’s fair value are recognized currently in earnings unless specific hedge accounting criteria are met. The guidance also establishes accounting and reporting standards requiring that every derivative instrument (including certain derivative instruments embedded in other contracts) is recorded in the consolidated balance sheets as either an asset or a liability measured at its fair value. Hedge accounting for a qualifying hedge allows the gains and losses on derivatives to offset related results on the hedged item in the statement of operations and requires that a company formally document, designate, and assess the effectiveness of transactions that receive hedge accounting.
Prior to January 1, 2013, the Company had elected hedge accounting on all qualifying derivative instruments. As of December 31, 2012, the Company did not have any outstanding derivatives. For all derivatives entered into after January 1, 2013, the Company elected not to apply hedge accounting. The changes in the fair value of our derivatives initiated after January 1, 2013 are recognized in "Price-risk management and other, net” on the accompanying consolidated statements of operations.
We have a price-risk management policy to use derivative instruments to protect against declines in oil and natural gas prices, mainly through the purchase of price floors, calls, swaps, collars and participating collars. Prior to January 1, 2013, all hedges were designated as a hedge of the variability in cash flows associated with the forecasted sale of oil and natural gas production. Changes in the fair value of a hedge that was highly effective and was designated, documented and qualified as a cash flow hedge, to the extent that the hedge was effective, were recorded in “Accumulated other comprehensive income, net of income tax” on the accompanying consolidated balance sheets. When the hedged transactions were recorded upon the actual sale of the oil and natural gas, those gains or losses were reclassified from “Accumulated other comprehensive income, net of income tax” and were recorded in “Price-risk management and other, net” on the accompanying consolidated statements of operations. Changes in the fair value of derivatives that did not meet the criteria for hedge accounting, and the ineffective portion of the hedge for which hedge accounting was elected, were recognized in "Price-risk management and other, net."
For the years ended December 31, 2013, 2012 and 2011, we recognized net gains (losses) of ($0.9) million, $2.3 million and ($0.9) million, respectively, relating to our derivative activities. These amounts include an unrealized loss of $0.1 million for the year ended December 31, 2013. Had these amounts been recognized in the oil and gas sales account they would not have materially changed our per unit sales prices received. The ineffectiveness for the years ended December 31, 2012 and 2011, was not material. The effects of our derivatives are included in the "Other" section of our operating activities on the accompanying consolidated statements of cash flows.
The fair values of our derivatives are computed using commonly accepted industry-standard models and are periodically verified against quotes from brokers. The fair value of our derivative assets at December 31, 2013 was $0.8 million which was recognized on the accompanying consolidated balance sheet in “Other current assets.” The fair value of our derivative liabilities at December 31, 2013 was $0.9 million which was recognized on the accompanying consolidated balance sheet in “Accounts payable and accrued liabilities.”
The Company uses an International Swap and Derivatives Association "ISDA" master agreement for all derivative contracts. This is an industry standardized contract containing the general conditions of our derivative transactions including provisions relating to netting derivative settlement payments under certain circumstances (such as default). For reporting purposes, the Company has elected to not offset the asset and liability fair value amounts of its derivatives on the accompanying balance sheets. If all counterparties were in a default situation, the Company, under the right of set-off, would show a net derivative fair value
61
liability of $0.1 million at December 31, 2013. For further discussion related to the fair value of the Company's derivatives, refer to Note 10 of these consolidated financial statements.
At December 31, 2013, we had less than $0.1 million in receivables for settled derivatives which were recognized on the accompanying balance sheet in “Accounts receivable” and were subsequently collected in January 2014. At December 31, 2013, we also had $0.2 million in payables for settled derivatives which were recognized on the accompanying balance sheet in "Accounts payable and accrued liabilities" and were subsequently paid in January 2014.
The following tables summarize the weighted average prices and future production volumes for various derivative contracts the Company had in place as of December 31, 2013.
Collars | |||||||||||||||||
Oil Derivatives (NYMEX WTI Settlements) | Total Volumes (Bbls) | Swap Fixed Price | Purchased Call Price | Floor Price | Ceiling Price | ||||||||||||
2014 Contracts | |||||||||||||||||
Swaps | 462,000 | $ | 98.19 | ||||||||||||||
Calls | 87,000 | $ | 116.60 | ||||||||||||||
Collars | 87,000 | $ | 95.00 | $ | 107.30 | ||||||||||||
Collars | |||||||||||||
Natural Gas Derivatives (NYMEX Henry Hub Settlements) | Total Volumes (MMBtu) | Swap Fixed Price | Floor Price | Ceiling Price | |||||||||
2014 Contracts | |||||||||||||
Swaps | 7,460,000 | $ | 4.10 | ||||||||||
Collars | 3,075,000 | $ | 4.13 | $ | 4.44 | ||||||||
2015 Contracts | |||||||||||||
Swaps | 900,000 | $ | 4.42 | ||||||||||
Natural Gas Basis Derivatives (East Texas Houston Ship Channel Settlements) | Total Volumes (MMBtu) | Swap Fixed Price | |||
2014 Contracts | |||||
Swaps | 2,030,000 | $ | 0.085 | ||
Supervision Fees. Consistent with industry practice, we charge a supervision fee to the wells we operate including our wells in which we own up to a 100% working interest. Supervision fees are recorded as a reduction to “General and administrative, net”, on the accompanying consolidated statements of operations. Our supervision fees are based on COPAS industry guidelines. The amount of supervision fees charged for the years ended December 31, 2013, 2012 and 2011, respectively, did not exceed our actual costs incurred. The total amount of supervision fees charged to the wells we operated was $11.6 million, $11.3 million and $12.9 million for the years ended December 31, 2013, 2012 and 2011, respectively.
Inventories. Inventories consist primarily of tubulars and other equipment and supplies that we expect to place in service in production operations. Inventories carried at cost (weighted average method) are included in “Other current assets” on the accompanying consolidated balance sheets totaling $3.5 million and $5.6 million at December 31, 2013 and 2012, respectively.
For the year ended December 31, 2011, we recorded a charge of $2.1 million related to inventory obsolescence in “Price-risk management and other, net” on the accompanying consolidated statement of operations.
62
Income Taxes. Under guidance contained in FASB ASC 740-10, deferred taxes are determined based on the estimated future tax effects of differences between the financial statement and tax basis of assets and liabilities, given the provisions of the enacted tax laws.
We follow the recognition and disclosure provisions under guidance contained in FASB ASC 740-10-25. Under this guidance, tax positions are evaluated for recognition using a more-likely-than-not threshold, and those tax positions requiring recognition are measured as the largest amount of tax benefit that is greater than fifty percent likely of being realized upon ultimate settlement with a taxing authority that has full knowledge of all relevant information. Our policy is to record interest and penalties relating to uncertain tax positions in income tax expense.
Accounts Payable and Accrued Liabilities. The “Accounts payable and accrued liabilities” balances on the accompanying consolidated balance sheets are summarized below (in thousands):
December 31, 2013 (As Restated) | December 31, 2012 (As Restated) | ||||||
Trade accounts payable (1) | $ | 30,769 | $ | 31,128 | |||
Accrued operating expenses | 16,016 | 16,479 | |||||
Accrued payroll costs | 10,938 | 12,297 | |||||
Asset retirement obligation – current portion | 15,859 | 7,134 | |||||
Accrued taxes | 5,845 | 5,473 | |||||
Other payables | 2,891 | 4,799 | |||||
Total accounts payable and accrued liabilities | $ | 82,318 | $ | 77,310 | |||
(1) Included in “trade accounts payable” are liabilities of approximately $26.1 million and $13.3 million at December 31, 2013 and 2012, respectively, for outstanding checks.
Cash and Cash Equivalents. We consider all highly liquid instruments with an initial maturity of three months or less to be cash equivalents.
Credit Risk Due to Certain Concentrations. We extend credit, primarily in the form of uncollateralized oil and gas sales and joint interest owners' receivables, to various companies in the oil and gas industry, which results in a concentration of credit risk. The concentration of credit risk may be affected by changes in economic or other conditions within our industry and may accordingly impact our overall credit risk. However, we believe that the risk of these unsecured receivables is mitigated by the size, reputation, and nature of the companies to which we extend credit. From certain customers we also obtain letters of credit or parent company guaranties, if applicable, to reduce risk of loss. For the years ended December 31, 2013, 2012 and 2011, Shell Oil Company and affiliates accounted for 33%, 46% and 49% of our total oil and gas gross receipts, respectively. BP America accounted for approximately 21% of our total oil and gas gross receipts in 2013 while Southcross Energy accounted for approximately 11% of our total oil and gas gross receipts in 2012. Credit losses in each of the last three years were immaterial.
Restricted Cash. These balances primarily include amounts held in escrow accounts to satisfy plugging and abandonment obligations. As of December 31, 2013 and 2012, these assets were approximately $1.0 million, respectively. These amounts are restricted as to their current use, and will be released when we have satisfied all plugging and abandonment obligations in certain fields. Restricted cash balances are reported in “Other Long-Term Assets” on the accompanying consolidated balance sheets.
Asset Retirement Obligation. We record these obligations in accordance with the guidance contained in FASB ASC 410-20. This guidance requires entities to record the fair value of a liability for legal obligations associated with the retirement obligations of tangible long-lived assets in the period in which it is incurred. When the liability is initially recorded, the carrying amount of the related long-lived asset is increased. The liability is discounted from the expected date of abandonment. Over time, accretion of the liability is recognized each period, and the capitalized cost is depreciated on a unit-of-production basis as part of depreciation, depletion, and amortization expense for our oil and gas properties. Upon settlement of the liability, the Company either settles the obligation for its recorded amount or incurs a gain or loss upon settlement which is included in the “Property and Equipment” balance on our accompanying consolidated balance sheets. This guidance requires us to record a liability for the fair value of our dismantlement and abandonment costs, excluding salvage values.
63
The following provides a roll-forward of our asset retirement obligation (in thousands):
Asset Retirement Obligation as of December 31, 2011 | $ | 76,393 | |
Accretion expense | 5,121 | ||
Liabilities incurred for new wells and facilities construction | 2,195 | ||
Reductions due to sold and abandoned wells and facilities | (2,824 | ) | |
Revisions in estimates | 5,892 | ||
Asset Retirement Obligation as of December 31, 2012 | $ | 86,777 | |
Accretion expense | 6,181 | ||
Liabilities incurred for new wells and facilities construction | 1,588 | ||
Reductions due to sold and abandoned wells and facilities | (16,394 | ) | |
Revisions in estimates | 932 | ||
Asset Retirement Obligation as of December 31, 2013 | $ | 79,084 | |
Effective May 1, 2013, we sold our Brookeland field in Texas. This sale included the buyer's assumption of our plugging and abandonment liability for which we were carrying an $11.3 million asset retirement obligation. This decrease is shown above in “Reductions due to sold and abandoned wells and facilities.”
At December 31, 2013 and 2012, approximately $15.9 million and $7.1 million, respectively, of our asset retirement obligation was classified as a current liability in “Accounts payable and accrued liabilities” on the accompanying consolidated balance sheets.
New Accounting Pronouncements. There are no material new accounting pronouncements that have been issued but not yet adopted as of December 31, 2013.
2. Earnings Per Share (As Restated)
The Company computes earnings per share in accordance with FASB ASC 260-10. Basic earnings per share (“Basic EPS”) has been computed using the weighted average number of common shares outstanding during each period. Diluted earnings per share ("Diluted EPS") assumes, as of the beginning of the period, exercise of stock options and restricted stock grants using the treasury stock method. Diluted EPS also assumes conversion of performance-based restricted stock units to common shares based on the number of shares (if any) that would be issuable, according to predetermined performance and market goals, if the end of the reporting period was the end of the performance period. As we recognized a net loss for the year ended December 31, 2013, the unvested share-based payments and stock options were not recognized in diluted earnings per share (“Diluted EPS”) calculations as they would be antidilutive. Certain of our stock options and restricted stock grants that would potentially dilute Basic EPS in the future were also antidilutive for the years ended December 31, 2012 and 2011, and are discussed below.
Due to amendments to our stock plan agreement made in May 2013 which clarify that unvested shares or unvested units are not dividend eligible, our earnings per share calculations, including historical periods, have been presented based on the traditional earnings per share calculation methodology instead of the two-class methodology. The effects of this change were immaterial for all historical periods presented.
64
The following is a reconciliation of the numerators and denominators used in the calculation of Basic and Diluted EPS for the years ended December 31, 2013, 2012 and 2011 (in thousands, except per share amounts):
2013 (As Restated) | 2012 (As Restated) | 2011 (As Restated) | ||||||||||||||||||||||||||||||
Income from Continuing Operations | Shares | Per Share Amount | Income from Continuing Operations | Shares | Per Share Amount | Income from Continuing Operations | Shares | Per Share Amount | ||||||||||||||||||||||||
Basic EPS: | ||||||||||||||||||||||||||||||||
Net Income (Loss) and Share Amounts | $ | (2,442 | ) | 43,331 | $ | (0.06 | ) | $ | 21,701 | 42,840 | $ | 0.51 | $ | 82,071 | 42,394 | $ | 1.94 | |||||||||||||||
Dilutive Securities: | ||||||||||||||||||||||||||||||||
Stock Options | — | 90 | 235 | |||||||||||||||||||||||||||||
Restricted Stock Awards | — | 244 | 267 | |||||||||||||||||||||||||||||
Restricted Stock Units | — | — | — | |||||||||||||||||||||||||||||
Diluted EPS: | ||||||||||||||||||||||||||||||||
Net Income (Loss) and Assumed Share Conversions | $ | (2,442 | ) | 43,331 | $ | (0.06 | ) | $ | 21,701 | 43,174 | $ | 0.50 | $ | 82,071 | 42,896 | $ | 1.91 | |||||||||||||||
Options to purchase approximately 1.5 million shares at an average exercise price of $33.38 were outstanding at December 31, 2013, while options to purchase approximately 1.6 million shares at an average exercise price of $33.13 were outstanding at December 31, 2012 and options to purchase approximately 1.4 million shares at an average exercise price of $32.46 were outstanding at December 31, 2011.
All of the 1.6 million stock options to purchase shares were not included in the computation of Diluted EPS for the year ended December 31, 2013, as they would be antidilutive given the net loss from continuing operations. Approximately 1.3 million and 0.8 million stock options to purchase shares were not included in the computation of Diluted EPS for the years ended December 31, 2012 and 2011, respectively, because these stock options were antidilutive.
All of the 0.3 million restricted stock awards were not included in the computation of Diluted EPS for the year ended December 31, 2013, as they would be antidilutive given the net loss from continuing operations. Approximately 0.3 million and 0.2 million restricted stock awards were not included in the computation of Diluted EPS for the years ended December 31, 2012 and 2011, respectively, because they were antidilutive.
Approximately 0.3 million shares related to performance-based restricted stock units that could be converted to common shares based on predetermined performance and market goals were not included in the computation of Diluted EPS for year ended December 31, 2013, primarily because the performance and market conditions had not been met, assuming the end of the reporting period was the end of the performance period.
3. Provision for Income Taxes (As Restated)
Income (Loss) from continuing operations before taxes is as follows (in thousands):
Year Ended December 31, | |||||||||||
2013 (As Restated) | 2012 (As Restated) | 2011 (As Restated) | |||||||||
Income (Loss) from Continuing Operations Before Income Taxes | $ | 198 | $ | 37,773 | $ | 131,125 | |||||
65
The following is an analysis of the consolidated income tax provision (benefit) from continuing operations (in thousands):
Year Ended December 31, | |||||||||||
2013 (As Restated) | 2012 (As Restated) | 2011 (As Restated) | |||||||||
Current | $ | (12 | ) | $ | (1,144 | ) | $ | 1,616 | |||
Deferred | 2,652 | 17,216 | 47,438 | ||||||||
Total | $ | 2,640 | $ | 16,072 | $ | 49,054 | |||||
Reconciliations of income taxes computed using the U.S. Federal statutory rate to the effective income tax rates are as follows (in thousands):
Year Ended December 31, | |||||||||||
2013 (As Restated) | 2012 (As Restated) | 2011 (As Restated) | |||||||||
Income taxes computed at U.S. statutory rate (35%) | $ | 69 | $ | 13,221 | $ | 45,889 | |||||
State tax provisions (benefits), net of federal benefits | (184 | ) | (950 | ) | (1,206 | ) | |||||
Non-deductible equity compensation | 1,127 | 1,911 | 1,537 | ||||||||
Stock-based compensation tax shortfall | 558 | — | — | ||||||||
Valuation allowances | 385 | 2,370 | 2,273 | ||||||||
Expiration of carryover items | 400 | — | — | ||||||||
Uncertain Tax Positions | — | (977 | ) | — | |||||||
Other, net | 285 | 497 | 561 | ||||||||
Provision for income taxes | $ | 2,640 | $ | 16,072 | $ | 49,054 | |||||
Effective rate | 1,333.4 | % | 42.5 | % | 37.4 | % | |||||
The Company’s operations are concentrated in Texas and Louisiana. The Company’s state tax provision varies in proportion to the overall statutory rate due to differences in deductions allowed for U.S. Federal and state income taxes.
In 2013, the Company recorded tax expense of $0.6 million for stock-based compensation shortfall. This shortfall is for stock compensation grants on which the realized tax deduction was less than expense booked for these grants. Historically, the Company recorded excess tax benefits and shortfalls to paid-in-capital. However, during 2013 the Company exhausted its APIC Pool. The total tax effect of the shortfall for the year was $2.2 million, with $1.6 million being recorded as a reduction in paid-in-capital, and the remainder to tax expense.
The valuation allowances are primarily attributable to Louisiana net operating loss carryovers.
66
The tax effects of temporary differences representing the net deferred tax asset (liability) at December 31, 2013 and 2012 were as follows (in thousands):
Year Ended December 31, | |||||||
2013 (As Restated) | 2012 (As Restated) | ||||||
Deferred tax assets: | |||||||
Federal net operating loss (“NOL”) carryovers | $ | 117,713 | $ | 93,445 | |||
NOLs for excess stock-based compensation | (9,615 | ) | (9,676 | ) | |||
State NOL carryovers | 14,626 | 13,686 | |||||
Alternative minimum tax credits | 2,092 | 2,092 | |||||
Other Carryover Items | 1,295 | 1,378 | |||||
Asset Retirement Obligation | 28,628 | 31,413 | |||||
Unrealized share-based compensation | 9,957 | 9,096 | |||||
Valuation allowance | (6,703 | ) | (6,318 | ) | |||
Other | 6,042 | 5,904 | |||||
Total deferred tax assets | $ | 164,035 | $ | 141,020 | |||
Deferred tax liabilities: | |||||||
Oil and gas exploration and development costs | $ | (393,606 | ) | $ | (363,952 | ) | |
Other | (919 | ) | (3,299 | ) | |||
Total deferred tax liabilities | $ | (394,525 | ) | $ | (367,251 | ) | |
Net deferred tax liabilities | $ | (230,490 | ) | $ | (226,231 | ) | |
Net current deferred tax assets | 10,715 | 8,262 | |||||
Net non-current deferred tax liabilities | $ | (241,205 | ) | $ | (234,493 | ) | |
The federal NOL carryovers totaling $337.1 million will expire between 2027 and 2033 if not utilized in earlier periods. Deferred tax benefits for excess stock-based compensation deductions represent stock-based compensation that have generated tax deductions that have not yet resulted in a cash tax benefit because the Company has NOL carryovers. The Company plans to recognize the federal NOL net deferred tax assets associated with excess stock-based compensation tax deductions only when all other components of the federal NOL carryover tax assets have been fully utilized. If and when the excess stock-based compensation related NOL carryover tax assets are realized, the benefit will be credited directly to equity. The state NOL carryovers are for Louisiana. The Louisiana loss carryovers are scheduled to expire between 2014 and 2028. The valuation allowances include $6.6 million and $6.0 million for 2013 and 2012, respectively for the Louisiana NOL carryovers.
U.S. Federal income tax returns for 2007 forward, Louisiana income tax returns from 1999 forward, New Zealand income tax returns after 2007, and Texas franchise tax returns after 2008 remain open to possible examination by the taxing authorities. There are no material unresolved items related to periods previously audited by these taxing authorities. No other state returns are significant to our financial position.
As of December 31, 2013, we do not have any accrued liability for uncertain tax positions. We do not believe the total of unrecognized tax positions will significantly increase or decrease during the next 12 months.
During 2012, we reversed our previously accrued liability of 1.0 million for an uncertain tax position on which
the statutory audit period expired and recognized the related tax benefit.
67
4. Long-Term Debt
Our long-term debt as of December 31, 2013 and 2012, was as follows (in thousands):
December 31, 2013 | December 31, 2012 | ||||||
7.125% senior notes due in 2017 | $ | 250,000 | $ | 250,000 | |||
8.875% senior notes due in 2020 (1) | 222,446 | 222,147 | |||||
7.875% senior notes due in 2022 (1) | 404,922 | 405,387 | |||||
Bank Borrowings | 265,000 | 39,400 | |||||
Long-Term Debt (1) | $ | 1,142,368 | $ | 916,934 | |||
(1) Amounts are shown net of any debt discount or premium | |||||||
As of December 31, 2013, our bank borrowings of $265.0 million were due in 2017. The maturities on our senior notes were $250.0 million in 2017, $225.0 million in 2020 and $400.0 million in 2022.
We have capitalized interest on our unproved properties in the amount of $7.2 million, $7.9 million and $7.7 million for the years ended December 31, 2013, 2012 and 2011, respectively.
Bank Borrowings. On October 28, 2013, our syndicate of 11 banks reaffirmed the borrowing base of $450.0 million on our $500.0 million credit facility. The commitment amount of $450.0 million and maturity date of November 1, 2017 remained unchanged. Our next scheduled borrowing base redetermination is scheduled for May 2014.
At December 31, 2013 and 2012, we had $265.0 million and $39.4 million in outstanding borrowings under our credit facility, respectively. The interest rate on our credit facility is either (a) the lead bank’s prime rate plus an applicable margin or (b) the Eurodollar rate plus an applicable margin. However with respect to (a), if the lead bank’s prime rate is not higher than each of the federal funds rate plus 0.5%, and the adjusted London Interbank Offered Rate (“LIBOR”) plus 1%, the greatest of these three rates will then apply. The applicable margins vary depending on the level of outstanding debt with escalating rates of 50 to 150 basis points above the Alternative Base Rate and escalating rates of 150 to 250 basis points for Eurodollar rate loans. During 2013, the lead bank’s prime rate was 3.25% and the commitment fee associated with the credit facility was 0.5%.
The terms of our credit facility include, among other restrictions, a limitation on the level of cash dividends (not to exceed $15.0 million in any fiscal year), a remaining aggregate limitation on purchases of our stock of $50.0 million, requirements as to maintenance of certain minimum financial ratios (principally pertaining to adjusted working capital ratios and EBITDAX as defined in the terms of our credit facility) and limitations on incurring other debt. Since inception, no cash dividends have been declared on our common stock. As of December 31, 2013, we were in compliance with the provisions of this agreement. The credit facility is secured by our oil and natural gas properties. Under the terms of the credit facility, the commitment amount can be less than or equal to the total amount of the borrowing base with unanimous consent of the bank group as it might change from time to time.
Interest expense on the credit facility, including commitment fees and amortization of debt issuance costs, totaled $6.0 million, $3.7 million and $2.4 million for the years ended December 31, 2013, 2012 and 2011, respectively. The amount of commitment fees included in interest expense, net was $1.1 million, $1.4 million and $1.5 million for the years ended December 31, 2013, 2012 and 2011, respectively.
Senior Notes Due In 2022. These notes consist of $400.0 million of 7.875% senior notes that will mature on March 1, 2022. On November 30, 2011, we issued $250.0 million of these senior notes at a discount of $2.1 million or 99.156% of par, which equates to an effective yield to maturity of 8%. The original discount of $2.1 million is recorded in “Long-Term Debt” on our consolidated balance sheets and will be amortized over the life of the notes using the effective interest method. On October 3, 2012, we issued an additional $150.0 million of these senior notes at 105% of par, which equates to a yield to worst of 6.993%. The premium of $7.5 million is recorded in “Long-Term Debt” on our consolidated balance sheets and will be amortized over the life of the notes using the effective interest method. The notes are senior unsecured obligations that rank equally with all of our existing and future senior unsecured indebtedness, are effectively subordinated to all our existing and future secured indebtedness to the extent of the value of the collateral securing such indebtedness, including borrowing under our bank credit facility, and will rank senior to any future subordinated indebtedness of Swift Energy. Interest on these notes is payable semi-annually on March 1 and September 1 and commenced on March 1, 2012. On or after March 1, 2017, we may redeem some or all of these notes, with certain restrictions, at a redemption price, plus accrued and unpaid interest, of 103.938% of principal, declining in twelve-month intervals to 100% in 2020 and thereafter. In addition, prior to March 1, 2015, we may redeem up to 35% of the principal amount
68
of the notes with the net proceeds of qualified offerings of our equity at a redemption price of 107.875% of the principal amount of the notes, plus accrued and unpaid interest. We incurred approximately $7.5 million of debt issuance costs related to these notes, which is included in “Other Long–Term Assets” on the accompanying consolidated balance sheets and will be amortized to interest expense, net over the life of the notes using the effective interest method. In the event of certain changes in control of Swift Energy, each holder of notes will have the right to require us to repurchase all or any part of the notes at a purchase price in cash equal to 101% of the principal amount, plus accrued and unpaid interest to the date of purchase. The terms of these notes include, among other restrictions, limitations on our ability to repurchase shares, incur debt, create liens, make investments, transfer or sell assets, enter into transactions with affiliates and consolidate, merge or transfer all or substantially all of our assets. We were in compliance with the provisions of the indenture governing these senior notes as of December 31, 2013.
Interest expense on the senior notes due in 2022, including amortization of debt issuance costs and debt premium, totaled $31.6 million, $22.4 million and $1.7 million for the years ended December 31, 2013, 2012 and 2011.
Senior Notes Due In 2020. These notes consist of $225.0 million of 8.875% senior notes issued at 98.389% of par, which equates to an effective yield to maturity of 9.125%. The notes were issued on November 25, 2009 with an original discount of $3.6 million and will mature on January 15, 2020. The original discount of $3.6 million is recorded in “Long-Term Debt” on our consolidated balance sheets and will be amortized over the life of the notes using the effective interest method. The notes are senior unsecured obligations that rank equally with all of our existing and future senior unsecured indebtedness, are effectively subordinated to all our existing and future secured indebtedness to the extent of the value of the collateral securing such indebtedness, including borrowing under our bank credit facility, and will rank senior to any future subordinated indebtedness of Swift Energy. Interest on these notes is payable semi-annually on January 15 and July 15 and commenced on January 15, 2010. On or after January 15, 2015, we may redeem some or all of these notes, with certain restrictions, at a redemption price, plus accrued and unpaid interest, of 104.438% of principal, declining in twelve-month intervals to 100% in 2018 and thereafter. We incurred approximately $5.0 million of debt issuance costs related to these notes, which is included in “Other Long–Term Assets” on the accompanying consolidated balance sheets and will be amortized to interest expense, net over the life of the notes using the effective interest method. In the event of certain changes in control of Swift Energy, each holder of notes will have the right to require us to repurchase all or any part of the notes at a purchase price in cash equal to 101% of the principal amount, plus accrued and unpaid interest to the date of purchase. The terms of these notes include, among other restrictions, limitations on our ability to repurchase shares, incur debt, create liens, make investments, transfer or sell assets, enter into transactions with affiliates and consolidate, merge or transfer all or substantially all of our assets. We were in compliance with the provisions of the indenture governing these senior notes as of December 31, 2013.
Interest expense on the senior notes due in 2020, including amortization of debt issuance costs and debt discount, totaled $20.7 million for the year ended December 31, 2013 and $20.6 million for the years ended December 31, 2012 and 2011, respectively.
Senior Notes Due In 2017. These notes consist of $250.0 million of 7.125% senior notes due in 2017, which were issued on June 1, 2007 at 100% of the principal amount and will mature on June 1, 2017. The notes are senior unsecured obligations that rank equally with all of our existing and future senior unsecured indebtedness, are effectively subordinated to all our existing and future secured indebtedness to the extent of the value of the collateral securing such indebtedness, including borrowing under our bank credit facility, and will rank senior to any future subordinated indebtedness of Swift Energy. Interest on these notes is payable semi-annually on June 1 and December 1, and commenced on December 1, 2007. We may redeem some or all of these notes, with certain restrictions, starting at a redemption price of 102.375% of the principal, plus accrued and unpaid interest, declining in twelve-month intervals to 100% on June 1, 2015 and thereafter. We incurred approximately $4.2 million of debt issuance costs related to these notes, which is included in “Other Long-Term Assets” on the accompanying consolidated balance sheets and will be amortized to interest expense, net over the life of the notes using the effective interest method. In the event of certain changes in control of Swift Energy, each holder of notes will have the right to require us to repurchase all or any part of the notes at a purchase price in cash equal to 101% of the principal amount, plus accrued and unpaid interest to the date of purchase. The terms of these notes include, among other restrictions, limitations on our ability to repurchase shares, incur debt, create liens, make investments, transfer or sell assets, enter into transactions with affiliates and consolidate, merge or transfer all or substantially all of our assets. We were in compliance with the provisions of the indenture governing these senior notes as of December 31, 2013.
Interest expense on the senior notes due in 2017, including amortization of debt issuance costs, totaled $18.3 million for the year ended December 31, 2013 and $18.2 million for the years ended December 31, 2012 and 2011, respectively.
69
5. Commitments and Contingencies
Rental and lease expenses were $20.5 million, $19.9 million and $19.3 million for the years ended December 31, 2013, 2012 and 2011, respectively. The rental and lease expenses primarily relate to compressor rentals during the year and the lease of our office space in Houston, Texas.
Our remaining minimum annual obligations under non-cancelable operating lease commitments were $9.0 million for 2014, $1.3 million for 2015, $0.1 million for 2016 and $10.5 million in total. The remaining minimum annual obligations under non-cancelable operating lease commitments primarily relate to our initial ten-year lease for our office space in Houston, Texas which was set to expire in February 2015. In February 2014 we amended the lease eliminating our renewal options and extending the lease through November 30, 2015. We will amortize the total payments required under the lease agreement on a straight-line basis over the term of the lease.
Our employment agreement liabilities for certain named executive officers, as detailed in our most recent proxy statement, constitute the majority of other long-term liabilities on the balance sheet at both December 31, 2013 and 2012.
Our remaining gas transportation and processing minimum obligations were $8.8 million for 2014, $8.0 million for 2015, $6.5 million for 2016, $3.7 million for 2017, $3.7 million for 2018 and $36.2 million in the aggregate.
In the ordinary course of business, we have been party to various legal actions, which arise primarily from our activities as operator of oil and natural gas wells. In management's opinion, the outcome of any such currently pending legal actions will not have a material adverse effect on our financial position or results of operations.
6. Share-Based Compensation (As Restated)
Share-Based Compensation Plans
We have multiple share-based compensation plans with outstanding awards including the 2005 Stock Compensation Plan, most recently amended by our Board of Directors in May 2013, which was approved by shareholders at the 2005 annual meeting of shareholders; the 2001 Omnibus Stock Compensation Plan, which was adopted by our Board of Directors in February 2001 and was approved by shareholders at the 2001 annual meeting of shareholders; the 1990 Non-Qualified Stock Option Plan solely for our independent directors. No further grants will be made under the 2001 Omnibus Stock Compensation Plan or the 1990 Non-Qualified Stock Option Plan, both of which were replaced by the 2005 Stock Compensation Plan, although stock option awards remain outstanding under the plans and are accordingly included in the tables below. In addition, we have an employee stock purchase plan and an employee stock ownership plan. We follow guidance contained in FASB ASC 718 to account for share-based compensation.
Under the 2005 plan, stock option awards and other equity based awards may be granted to employees, directors, and consultants, with directors only eligible to receive restricted awards. Under the 2001 plan, stock option awards and other equity based awards were granted to employees. Under the 1990 non-qualified plan, non-employee members of our Board of Directors were automatically granted stock option awards to purchase shares of common stock on a formula basis. All three plans provide that the exercise prices for stock option awards equal 100% of the fair value of the common stock on the date of grant. Restricted stock grants become vested over a three year period, and stock option awards become exercisable in various terms ranging from one year to five years. Stock option awards granted typically expire ten years after the date of grant or earlier in the event of the optionee's separation from employment. At the time the stock option awards are exercised, the cash received is credited to common stock and additional paid-in capital. The 2005 plan allows for the use of a “stock swap” in lieu of a cash exercise for stock option awards, under certain circumstances. The delivery of Swift Energy common stock, held by the optionee for a minimum of six months, which are considered mature shares, with a fair market value equal to the required purchase price of the shares to which the exercise relates, constitutes a valid “stock swap.” Stock option awards issued under a “stock swap” also previously included a reload feature that was discontinued during 2012. Mature shares that were delivered in “stock swap” transactions were 10,752, 20,692 and 79,194 for the years ended December 31, 2013, 2012 and 2011, respectively.
The employee stock purchase plan, which began in 1993, provides eligible employees the opportunity to acquire shares of Swift Energy common stock at a discount through payroll deductions. To date, employees have been allowed to authorize payroll deductions of up to 10% of their base salary, within IRS limitations and plan rules, during the plan year by making an election to participate prior to the start of a plan year. The purchase price for stock acquired under the plan is 85% of the lower of the closing price of our common stock as quoted on the New York Stock Exchange at the beginning or end of the plan year. Under this plan for the last three years, we have issued 72,273 shares at a price of $13.08 in 2013, 42,624 shares at a price of $25.26 in 2012 and
70
49,089 shares at a price of $20.37 in 2011. The contributions for the years ended December 31, 2013, 2012 and 2011 were all made in common stock. As of December 31, 2013, 405,656 shares remained available for issuance under this plan.
We receive a tax deduction for certain stock option exercises during the period the stock option awards are exercised, generally for the excess of the market value on the exercise date over the exercise price of the stock option awards. We receive an additional tax deduction when restricted stock awards vest at a higher value than the value used to recognize compensation expense at the date of grant. We are required to report excess tax benefits from the award of equity instruments as financing cash flows. We recognized an excess tax shortfall for the year ended December 31, 2013, as noted in Note 3. We did not recognize any material excess tax benefit or shortfall in earnings for the years ended December 31, 2012 and 2011.
Net cash proceeds from the exercise of stock option awards were not material for the year ended December 31, 2013 and were $0.6 million and $1.2 million for the years ended December 31, 2012 and 2011, respectively. The actual income tax benefit from stock option exercises was $0.3 million and $1.1 million for the years ended December 31, 2012 and 2011, respectively.
Share-based compensation expense for both stock option awards and restricted stock issued to both employees and non-employees, which was recorded in “General and administrative, net” in the accompanying consolidated statements of operations, was $9.3 million (restated), $12.9 million (restated) and $12.2 million (restated) for the years ended December 31, 2013, 2012 and 2011, respectively. Share-based compensation recorded in lease operating cost was $0.3 million for the years ended December 31, 2013, 2012 and 2011, respectively. We also capitalized $5.5 million, $5.2 million and $4.2 million of share-based compensation for the years ended December 31, 2013, 2012 and 2011, respectively. We view stock option awards and restricted stock awards with graded vesting as single awards with an expected life equal to the average expected life of component awards and amortize the awards on a straight-line basis over the life of the awards.
Our shares available for future grant under our Share-Based Compensation plans were 2,383,672 at December 31, 2013. Each stock option award granted reduces the aforementioned total by one share, while each restricted stock award and restricted stock unit granted reduces the shares available for future grant by 1.44 shares.
Stock Option Awards
We use the Black-Scholes-Merton option pricing model to estimate the fair value of stock option awards with the following weighted-average assumptions for stock option awards issued during the indicated periods:
Twelve Months Ended December 31, | |||
2012 | 2011 | ||
Dividend yield | 0% | 0% | |
Expected volatility | 61.2% | 58.8% | |
Risk-free interest rate | 0.8% | 1.9% | |
Expected life of stock option awards (in years) | 4.3 | 3.8 | |
Weighted-average grant-date fair value | $15.71 | $19.17 | |
During the year ended December 31, 2013, we did not grant any stock option awards. The expected term for grants issued considers all relevant factors including historical and expected future employee exercise behavior. We have analyzed historical volatility and, based on an analysis of all relevant factors, we have used a 5.5 year look-back period to estimate expected volatility of our stock option awards.
71
At December 31, 2013, we had $0.6 million of unrecognized compensation cost related to stock option awards, which is expected to be recognized over a weighted-average period of 0.5 years. The following table represents stock option award activity for the year ended December 31, 2013:
2013 | ||||||
Shares | Wtd. Avg. Exer. Price | |||||
Options outstanding, beginning of period | 1,585,594 | $ | 33.13 | |||
Options granted | — | $ | — | |||
Options canceled | (85,403 | ) | $ | 31.51 | ||
Options exercised | (11,877 | ) | $ | 13.84 | ||
Options outstanding, end of period | 1,488,314 | $ | 33.38 | |||
Options exercisable, end of period | 1,201,971 | $ | 32.93 | |||
There was no aggregate intrinsic value for our outstanding and exercisable stock option awards at December 31, 2013 since all outstanding stock option awards were out of the money. The weighted average remaining contract life of stock option awards outstanding and exercisable at December 31, 2013 was 5.3 years and 4.7 years, respectively. The total intrinsic value of stock option awards exercised for the year ended December 31, 2013 was not material and was $0.9 million and $4.2 million, for the years ended December 31, 2012 and 2011, respectively.
The following table summarizes information about stock option awards outstanding at December 31, 2013:
Options Outstanding | Options Exercisable | |||||||||||||||
Range of Exercise Prices | Number Outstanding at 12/31/13 | Wtd. Avg. Remaining Contractual Life | Wtd. Avg. Exercise Price | Number Exercisable at 12/31/13 | Wtd. Avg. Exercise Price | |||||||||||
$8.00 to $24.99 | 430,730 | 5.2 | $ | 20.04 | 430,730 | $ | 20.04 | |||||||||
$25.00 to $44.99 | 1,051,893 | 5.4 | $ | 38.72 | 765,550 | $ | 40.00 | |||||||||
$45.00 to $65.00 | 5,691 | 1.3 | $ | 55.98 | 5,691 | $ | 55.98 | |||||||||
$8.00 to $65.00 | 1,488,314 | 5.3 | $ | 33.38 | 1,201,971 | $ | 32.93 | |||||||||
Restricted Stock Awards
For the years ended December 31, 2013, 2012 and 2011, the Company issued 869,430, 543,800 and 499,050 shares, respectively, of restricted stock to employees, consultants, and directors. These shares vest over three years and remain subject to forfeiture if vesting conditions are not met. The weighted average fair values of these shares when issued, for the years ended December 31, 2013, 2012 and 2011 were $14.86, $31.12 and $40.28 per share, respectively.
The compensation expense for these awards was determined based on the closing market price of our stock at the date of grant applied to the total number of shares that were anticipated to fully vest. As of December 31, 2013, we had unrecognized compensation expense of $12.9 million (restated) related to restricted stock awards which is expected to be recognized over a weighted-average period of 1.5 years. The grant date fair values of shares vested for the years ended December 31, 2013, 2012 and 2011 were $12.8 million, $10.0 million and $8.7 million, respectively.
The following table represents restricted stock award activity for the year ended December 31, 2013:
2013 | ||||||
Shares | Wtd. Avg. Grant Price | |||||
Restricted shares outstanding, beginning of period | 896,164 | $ | 33.38 | |||
Restricted shares granted | 869,430 | $ | 14.86 | |||
Restricted shares canceled | (106,903 | ) | $ | 25.79 | ||
Restricted shares vested | (391,581 | ) | $ | 32.65 | ||
Restricted shares outstanding, end of period | 1,267,110 | $ | 21.54 | |||
72
Performance-Based Restricted Stock Units
In 2013, our executive compensation program was modified and, for the first time in February 2013, performance-based restricted stock units were granted containing predetermined market and performance conditions set by our compensation committee with a performance period of 3 years and a cliff vesting period of 3.1 years. We granted 189,700 of these units at a 100% of target payout while the conditions of the grants allow for a payout ranging between no payout and 200% of target.
The compensation expense for the market condition is based on a grant date valuation of $14.85 per unit using a Monte-Carlo simulation. The unrecognized compensation expense related to these shares is approximately $1.5 million as of December 31, 2013 and is expected to be recognized over the next 2.3 years. The performance condition is remeasured quarterly and compensation expense is recorded based on the closing market price of our stock on the date of grant ($15.47 per unit) per unit multiplied by the expected payout level. The payout level is calculated based on actual performance achieved during the performance period compared to a defined peer group. The unrecognized compensation expense related to these shares, based on the current estimated payout level achieved for the performance period, is approximately $0.4 million as of December 31, 2013 and is expected to be recognized over the next 2.3 years. All performance-based restricted stock units granted during 2013 were outstanding as of December 31, 2013. The weighted average grant date fair value for all restricted stock units granted during 2013 was $15.01 per unit.
Employee Stock Ownership Plan
We established an Employee Stock Ownership Plan (“ESOP”) effective January 1, 1996. All employees over the age of 21 with one year of service are participants. This plan has a three-year cliff vesting requirement. The ESOP is designed to enable our employees to accumulate stock ownership. While there will be no employee contributions, participants will receive an allocation of stock that has been contributed by Swift Energy. Compensation expense is recognized upon vesting when such shares are released to employees. The plan may also acquire Swift Energy common stock, purchased at fair market value. The ESOP can borrow money from Swift Energy to buy Swift Energy common stock. ESOP payouts will be paid in a lump sum or installments, and the participants generally have the choice of receiving cash or stock. At December 31, 2013, 2012 and 2011, all of the ESOP compensation was earned. Our contribution to the ESOP plan totaled $0.2 million for the years ended December 31, 2013, 2012 and 2011, and were all made in common stock, from treasury shares, and are recorded as “General and administrative, net” on the accompanying consolidated statements of operations. The shares of common stock contributed to the ESOP plan, from treasury shares, totaled 14,815, 12,995 and 6,729 for the years ended December 31, 2013, 2012 and 2011, respectively.
Employee Savings Plan
We have a savings plan under Section 401(k) of the Internal Revenue Code. In 2013 this plan was updated so that eligible employees may make voluntary contributions into the 401(k) savings plan with Swift Energy contributing on behalf of the eligible employee an amount equal to 100% of the first 6% of compensation based on the contributions made by the eligible employees. Our contributions to the 401(k) savings plan were $1.8 million, $1.5 million and $1.4 million for the years ended December 31, 2013, 2012 and 2011, respectively, and were recorded as “General and administrative, net” on the accompanying consolidated statements of operations. The contributions were all made in common stock, from treasury shares. The shares of common stock contributed to the 401(k) savings plan totaled 140,078, 91,895 and 44,258 for the years ended December 31, 2013, 2012 and 2011, respectively.
7. Related-Party Transactions
We receive research, technical writing, publishing, and website-related services from Tec-Com Inc., a corporation located in Knoxville, Tennessee and controlled and majority owned by the aunt of the Company's Chairman of the Board and Chief Executive Officer. We paid Tec-Com, for services pursuant to the terms of the contract, approximately $0.6 million in 2013, 2012 and 2011. The contract was renewed on July 1, 2013 on substantially the same terms as the previous contract and expires June 30, 2014.
As a matter of corporate governance policy and practice, related party transactions are annually presented and considered by the Corporate Governance Committee of our Board of Directors in accordance with the Committee's charter.
8. Discontinued Operations
In August 2008, we completed the sale of our remaining New Zealand permit for $15.0 million; with three payments of $5.0 million to be received 9 months after the sale, 18 months after the sale, and 30 months after the sale. The Company initially deferred the gain on the sale due to legal claims around the transfer of this property. In July 2011, a settlement was reached and all legal
73
claims were dismissed. As a result, in the second quarter of 2011, the Company recognized sale proceeds of $15.0 million, net of $0.6 million in capitalized costs in assets held for sale, relating to our remaining New Zealand permit. In accordance with guidance contained in FASB ASC 360-10, the results of operations for the New Zealand operations have been excluded from continuing operations and reported as discontinued operations for the current and prior periods. As of December 31, 2011, all payments under this sale agreement had been received.
Our income from discontinued operations, net of taxes was $14.2 million for the year ended December 31, 2011, which equated to $0.34 and $0.33 per basic and diluted share, respectively.
9. Acquisitions and Dispositions
Effective May 1, 2013, we disposed of our Brookeland field in Texas and received net cash proceeds of approximately $6.0 million. This disposition also included the buyer's assumption of our plugging and abandonment liability that was previously included as $11.3 million in "Asset Retirement Obligation" on the accompanying consolidated balance sheets. There were no material acquisitions in 2013, 2012 and 2011.
10. Fair Value Measurements
FASB ASC 820-10 defines fair value, establishes guidelines for measuring fair value and expands disclosure about fair value measurements. It does not create or modify any current GAAP requirements to apply fair value accounting. However, it provides a single definition for fair value that is to be applied consistently for all prior accounting pronouncements.
Our financial instruments consist of cash and cash equivalents, accounts receivable, accounts payable, bank borrowings, and senior notes. The carrying amounts of cash and cash equivalents, accounts receivable, and accounts payable approximate fair value due to the highly liquid or short-term nature of these instruments.
Based upon quoted market prices as of December 31, 2013, 2012 and 2011, the fair value and carrying value of our senior notes was as follows (in millions):
December 31, 2013 | December 31, 2012 | December 31, 2011 | |||||||||||||||||||||
Fair Value | Carrying Value | Fair Value | Carrying Value | Fair Value | Carrying Value | ||||||||||||||||||
7.125% senior notes due in 2017 | $ | 256.7 | $ | 250.0 | $ | 258.1 | $ | 250.0 | $ | 254.8 | $ | 250.0 | |||||||||||
8.875% senior notes due in 2020 | $ | 239.1 | $ | 222.4 | $ | 244.4 | $ | 222.1 | $ | 239.6 | $ | 221.9 | |||||||||||
7.875% senior notes due in 2022 | $ | 409.0 | $ | 404.9 | $ | 424.0 | $ | 405.4 | $ | 252.8 | $ | 247.9 | |||||||||||
Our senior notes due in 2017, 2020 and 2022 are stated at carrying value on our financial statements, net of any discount or premium. If we recorded these notes at fair value they would be Level 1 in our fair value hierarchy as they are traded in an active market with quoted prices for identical instruments.
74
At December 31, 2012, the Company did not have any derivative instruments. The following table presents our assets that are measured at fair value as of December 31, 2013, and are categorized using the fair value hierarchy. For additional discussion related to the fair value of the Company's derivatives, refer to Note 1 of these consolidated financial statements. The fair value hierarchy has three levels based on the reliability of the inputs used to determine the fair value (in millions):
Fair Value Measurements at | |||||||||||||||
Total | Quoted Prices in Active markets for Identical Assets (Level 1) | Significant Other Observable Inputs (Level 2) | Significant Unobservable Inputs (Level 3) | ||||||||||||
December 31, 2013 | |||||||||||||||
Assets: | |||||||||||||||
Natural Gas Derivatives | $ | 0.5 | $ | — | $ | 0.5 | $ | — | |||||||
Oil Derivatives | $ | 0.3 | $ | — | $ | 0.3 | $ | — | |||||||
Liabilities | |||||||||||||||
Natural Gas Derivatives | $ | 0.7 | $ | — | $ | 0.7 | $ | — | |||||||
Oil Derivatives | $ | 0.2 | $ | — | $ | 0.2 | $ | — | |||||||
Our derivative assets and liabilities in the table above are measured at gross fair value and are shown on the accompanying consolidated balance sheets in “Other current assets” and "Accounts payable and accrued liabilities", respectively.
Level 1 – Uses quoted prices in active markets for identical, unrestricted assets or liabilities. Instruments in this category have comparable fair values for identical instruments in active markets.
Level 2 – Uses quoted prices for similar assets or liabilities in active markets or observable inputs for assets or liabilities in non-active markets. Instruments in this category are periodically verified against quotes from brokers and include our commodity derivatives that we value using commonly accepted industry-standard models which contain inputs such as contract prices, risk-free rates, volatility measurements and other observable market data that are obtained from independent third-party sources.
Level 3 – Uses unobservable inputs for assets or liabilities that are in non-active markets. We do not have any assets or liabilities in this category that are not supported by market activity and have significant unobservable inputs.
11. Condensed Consolidating Financial Information
Swift Energy Company (the parent) is the issuer and Swift Energy Operating, LLC (a wholly owned indirect subsidiary of Swift Energy Company) is the sole guarantor of our senior notes due in 2017, 2020 and 2022. Swift Energy Company does not have any independent assets or operations. The guarantees on our senior notes due in 2017, 2020 and 2022 are full and unconditional. All subsidiaries of Swift Energy Company, other than Swift Energy Operating, LLC, are minor.
75
Supplementary Information
Swift Energy Company and Subsidiaries
Oil and Gas Operations (Unaudited)
Capitalized Costs (As Restated). The following table presents our aggregate capitalized costs relating to oil and natural gas producing activities and the related depreciation, depletion, and amortization (in thousands):
Total | |||
December 31, 2013 (As Restated) | |||
Proved oil and gas properties | $ | 5,600,279 | |
Unproved oil and gas properties | 71,452 | ||
5,671,731 | |||
Accumulated depreciation, depletion, and amortization | (3,092,591 | ) | |
Net capitalized costs | $ | 2,579,140 | |
December 31, 2012 (As Restated) | |||
Proved oil and gas properties | $ | 5,058,524 | |
Unproved oil and gas properties | 92,579 | ||
5,151,103 | |||
Accumulated depreciation, depletion, and amortization | (2,795,956 | ) | |
Net capitalized costs | $ | 2,355,147 | |
There were $71.5 million of unproved property costs at December 31, 2013, excluded from the amortizable base. Of this amount, $34.2 million was incurred in 2013, $16.4 million was incurred in 2012, $10.3 million was incurred in 2011 and $10.6 million was incurred in prior years. We evaluate the majority of these unproved costs within a two to four year time frame.
Capitalized asset retirement obligations have been included in the Proved oil and gas properties as of December 31, 2013 and 2012.
Costs Incurred. The following table sets forth costs incurred related to our oil and natural gas operations from continuing operations (in thousands):
Year Ended December 31, | |||||||||||
2013 | 2012 | 2011 | |||||||||
Lease acquisitions and prospect costs | $ | 46,555 | $ | 52,840 | $ | 52,779 | |||||
Exploration | 5,279 | — | — | ||||||||
Development 1 | 486,967 | 670,251 | 540,714 | ||||||||
Total acquisition, exploration, and development 2, 3 | $ | 538,801 | $ | 723,091 | $ | 593,493 | |||||
1) Facility construction costs and capital costs have been included in development costs, and totaled $63.9 million, $81.3 million and $42.8 million for the years ended December 31, 2013, 2012 and 2011, respectively.
2) Includes capitalized general and administrative costs directly associated with the acquisition, exploration, and development efforts of approximately $31.8 million, $31.1 million and $29.3 million for the years ended December 31, 2013, 2012 and 2011, respectively. In addition, the total includes $7.2 million, $7.9 million and $7.7 million for the years ended December 31, 2013, 2012 and 2011, respectively, of capitalized interest on unproved properties.
3) Asset retirement obligations incurred, including revisions, of approximately ($2.6 million), $5.3 million and $20.7 million, have been included in exploration, development and acquisition costs as applicable for the years ended December 31, 2013, 2012 and 2011, respectively.
76
Supplementary Reserves Information. The following information presents estimates of our proved oil and natural gas reserves. Reserves were determined by us, and our reserves were audited by H. J. Gruy and Associates, Inc. (“Gruy”), independent petroleum consultants. Gruy has audited 97%, 96% and 94% of our proved reserves as of December 31, 2013, 2012 and 2011.
Estimates of Proved Reserves | Total | Natural Gas | Oil | NGL | |||||||
(Boe) | (Mcf) | (Bbls) | (Bbls) | ||||||||
Proved reserves as of December 31, 2011 | 159,561,788 | 616,759,607 | 30,931,512 | 25,837,008 | |||||||
Revisions of previous estimates (1) | 397,835 | (97,311,524 | ) | 5,175,468 | 11,440,954 | ||||||
Purchases of minerals in place | — | — | — | — | |||||||
Sales of minerals in place | — | — | — | — | |||||||
Extensions, discoveries, and other additions (3) | 43,813,417 | 114,506,574 | 10,925,490 | 13,803,498 | |||||||
Production | (11,700,398 | ) | (36,385,672 | ) | (3,773,856 | ) | (1,862,263 | ) | |||
Proved reserves as of December 31, 2012 | 192,072,642 | 597,568,985 | 43,258,614 | 49,219,197 | |||||||
Revisions of previous estimates (1) | (36,608,891 | ) | (137,035,411 | ) | 6,203,299 | (19,972,955 | ) | ||||
Purchases of minerals in place | — | — | — | — | |||||||
Sales of minerals in place (4) | (775,552 | ) | (1,802,335 | ) | (231,266 | ) | (243,897 | ) | |||
Extensions, discoveries, and other additions (3) | 76,284,504 | 389,390,614 | 7,690,171 | 3,695,897 | |||||||
Production | (11,745,635 | ) | (32,996,993 | ) | (3,926,323 | ) | (2,319,813 | ) | |||
Proved reserves as of December 31, 2013 | 219,227,067 | 815,124,860 | 52,994,495 | 30,378,429 | |||||||
Proved developed reserves (2): | |||||||||||
December 31, 2011 | 55,644,578 | 184,355,684 | 13,840,291 | 11,078,340 | |||||||
December 31, 2012 | 65,714,713 | 195,642,512 | 17,779,798 | 15,327,830 | |||||||
December 31, 2013 | 62,912,871 | 197,815,575 | 16,884,760 | 13,058,849 | |||||||
Proved undeveloped reserves | |||||||||||
December 31, 2011 | 103,917,210 | 432,403,923 | 17,091,221 | 14,758,668 | |||||||
December 31, 2012 | 126,357,929 | 401,926,473 | 25,478,816 | 33,891,367 | |||||||
December 31, 2013 | 156,314,196 | 617,309,285 | 36,109,735 | 17,319,580 | |||||||
(1) Revisions of previous estimates are related to upward or downward variations based on current engineering information for production rates, volumetrics, reservoir pressure and commodity pricing. The downward revisions were due to changing economics and performance issues in the Artesia Wells Eagle Ford field and the release of natural gas acreage in our AWP Olmos field during 2013. These were partially offset by net upward revisions in our other fields. In 2012, performance-related upward revisions in the Artesia Wells area were offset by downward revisions in other South Texas fields due to low natural gas prices. Proved reserves, as of December 31, 2013, 2012 and 2011, were based upon the preceding 12-months' average price based on closing prices on the first business day of each month, or prices defined by existing contractual arrangements are held constant, for that year's reserves calculation. Our hedging activity during the year did not materially affect prices used in these calculations for the years ended December 31, 2012 and 2011. The 12-month 2013 average adjusted prices after differentials used in our calculations were $3.41 per Mcf of natural gas, $104.38 per barrel of oil, and $31.68 per barrel of NGL compared to $2.71 per Mcf of natural gas, $103.64 per barrel of oil, and $46.22 per barrel of NGL for the 12-month average 2012 prices and $3.89 per Mcf of natural gas, $103.87 per barrel of oil, and $49.55 per barrel of NGL for the 12-month average 2011 prices.
(2) At December 31, 2013, 2012 and 2011, 29%, 34% and 35% of our reserves were proved developed, respectively.
(3) We have added proved reserves primarily through our drilling activities, including 76.3 MMBoe added in 2013 and 43.8 MMBoe added in 2012. The 2013 proved reserves additions from drilling activities consisted primarily of additions in the Fasken Eagle Ford area based on the results of the horizontal drilling program conducted in the area during the year, along with additions in the AWP Eagle Ford area. The 2012 proved reserves additions from drilling activities consisted primarily of reserves additions within our South Texas area, most of which were proved undeveloped additions based on the results of the horizontal drilling program conducted in this area during each year.
(4) In May 2013, we completed the disposition for our Brookeland field in Texas.
77
Standardized Measure of Discounted Future Net Cash Flows. The standardized measure of discounted future net cash flows relating to proved oil and natural gas reserves is as follows (in thousands):
Year Ended December 31, | |||||||||||
2013 | 2012 | 2011 | |||||||||
Future gross revenues | $ | 9,276,386 | $ | 8,376,948 | $ | 6,895,214 | |||||
Future production costs | (2,373,832 | ) | (2,257,087 | ) | (1,754,844 | ) | |||||
Future development costs | (2,335,339 | ) | (2,045,977 | ) | (1,863,492 | ) | |||||
Future net cash flows before income taxes | 4,567,215 | 4,073,884 | 3,276,878 | ||||||||
Future income taxes | (1,001,588 | ) | (906,125 | ) | (778,053 | ) | |||||
Future net cash flows after income taxes | 3,565,627 | 3,167,759 | 2,498,825 | ||||||||
Discount at 10% per annum | (1,563,846 | ) | (1,296,058 | ) | (981,204 | ) | |||||
Standardized measure of discounted future net cash flows relating to proved oil and natural gas reserves | $ | 2,001,781 | $ | 1,871,701 | $ | 1,517,621 | |||||
The standardized measure of discounted future net cash flows from production of proved reserves for the year ended December 31, 2013, was developed as follows:
1. Estimates were made of quantities of proved reserves and the future periods during which they are expected to be produced based on year-end economic conditions.
2. The estimated future gross revenues of proved reserves were based on the preceding 12-months' average price based on closing prices on the first day of each month, or prices defined by existing contractual arrangements.
3. The future gross revenues were reduced by estimated future costs to develop and to produce the proved reserves, including asset retirement obligation costs, based on year-end cost estimates and the estimated effect of future income taxes.
4. Future income taxes were computed by applying the statutory tax rate to future net cash flows reduced by the tax basis of the properties, the estimated permanent differences applicable to future oil and natural gas producing activities and tax carry forwards.
Subsequent changes to such oil and natural gas prices could have a significant impact on discounted future net cash flows. Under Securities and Exchange Commission rules, companies that follow the full-cost accounting method are required to make quarterly Ceiling Test calculations as of the period end date presented (see Note 1 to the consolidated financial statements). Application of these rules during periods of relatively low oil and natural gas prices, may result in non-cash write-downs.
The standardized measure of discounted future net cash flows is not intended to present the fair market value of our oil and natural gas reserves. An estimate of fair value would also take into account, among other things, the recovery of reserves in excess of proved reserves, anticipated future changes in prices and costs, an allowance for return on investment, and the risks inherent in reserves estimates.
78
The following are the principal sources of changes in the standardized measure of discounted future net cash flows (in thousands) for the years ended December 31, 2013, 2012 and 2011:
2013 | 2012 | 2011 | |||||||||
Beginning balance | $ | 1,871,701 | $ | 1,517,620 | $ | 1,344,708 | |||||
Revisions to reserves proved in prior years | |||||||||||
Net changes in prices, net of production costs | 428,680 | (156,121 | ) | 283,310 | |||||||
Net changes in future development costs | 15,213 | (22,300 | ) | (15,534 | ) | ||||||
Net changes due to revisions in quantity estimates | (736,754 | ) | 7,060 | (105,438 | ) | ||||||
Accretion of discount | 228,406 | 191,761 | 177,691 | ||||||||
Other | (136,615 | ) | (72,269 | ) | 61,676 | ||||||
Total revisions | (201,070 | ) | (51,869 | ) | 401,705 | ||||||
New field discoveries and extensions, net of future production and development costs | 503,604 | 663,572 | 103,983 | ||||||||
Purchases of minerals in place | — | — | — | ||||||||
Sales of minerals in place | 6,724 | — | (172,870 | ) | |||||||
Sales of oil and gas produced, net of production costs | (422,691 | ) | (389,862 | ) | (445,043 | ) | |||||
Previously estimated development costs incurred | 254,022 | 144,606 | 252,931 | ||||||||
Net change in income taxes | (10,509 | ) | (12,366 | ) | 32,206 | ||||||
Net change in standardized measure of discounted future net cash flows | 130,080 | 354,081 | 172,912 | ||||||||
Ending balance | $ | 2,001,781 | $ | 1,871,701 | $ | 1,517,620 | |||||
79
Selected Quarterly Financial Data (Unaudited) (As Restated). As discussed in Note 1A, we have identified certain accounting errors that affected consolidated financial statement amounts that were previously presented in our earlier filed Forms 10-Q and Form 10-K for the periods below. In the tables below, the sum of the individual quarterly net income (loss) per common share amounts may not agree with year-to-date net income (loss) per common share amounts as each quarterly computation is based on the weighted average number of common shares outstanding during that period. In addition, certain potentially dilutive securities were not included in certain of the quarterly computations of diluted net income per common share because to do so would have been antidilutive.
The quarterly financial data in 2013 and 2012, as originally reported (“As Reported”), as adjusted ("Adjustments") and as restated to correct these errors (“As Restated”), is presented below (in thousands, except per share data):
Revenues | Net Income (Loss) Before Taxes | Net Income (Loss) | Basic EPS | Diluted EPS | |||||||||||||||
2013 (As Reported) | |||||||||||||||||||
First | $ | 146,237 | $ | 11,586 | $ | 7,209 | $ | 0.17 | $ | 0.17 | |||||||||
Second | 142,466 | 11,015 | 6,722 | 0.15 | 0.15 | ||||||||||||||
Third | 153,001 | 15,378 | 8,886 | 0.20 | 0.20 | ||||||||||||||
Fourth | 146,009 | (63,784 | ) | (41,849 | ) | (0.96 | ) | (0.96 | ) | ||||||||||
Total | $ | 587,713 | $ | (25,805 | ) | $ | (19,032 | ) | $ | (0.44 | ) | $ | (0.44 | ) | |||||
2013 (Adjustments) | |||||||||||||||||||
First | $ | 54 | $ | 1,300 | $ | 829 | $ | 0.02 | $ | 0.01 | |||||||||
Second | 1,611 | 1,296 | 827 | 0.02 | 0.02 | ||||||||||||||
Third | (2,068 | ) | (2,394 | ) | (1,527 | ) | (0.03 | ) | (0.03 | ) | |||||||||
Fourth (1) | (2,909 | ) | 25,801 | 16,461 | 0.38 | 0.38 | |||||||||||||
Total | $ | (3,312 | ) | $ | 26,003 | $ | 16,590 | $ | 0.39 | $ | 0.38 | ||||||||
2013 (As Restated) | |||||||||||||||||||
First | $ | 146,291 | $ | 12,886 | $ | 8,038 | $ | 0.19 | $ | 0.18 | |||||||||
Second | 144,077 | 12,311 | 7,549 | 0.17 | 0.17 | ||||||||||||||
Third | 150,933 | 12,984 | 7,359 | 0.17 | 0.17 | ||||||||||||||
Fourth (2) | 143,100 | (37,983 | ) | (25,388 | ) | (0.58 | ) | (0.58 | ) | ||||||||||
Total | $ | 584,401 | $ | 198 | $ | (2,442 | ) | $ | (0.06 | ) | $ | (0.06 | ) | ||||||
(1) As discussed in Note 1A, these adjustments reflect (a) the correction to our ceiling test write-down for the fourth quarter of 2013 of approximately $27 million, which was partially offset by an increase in our depreciation, depletion and amortization expense of approximately $0.3 million, and (b) the impact of a $2.9 million revenue adjustment related to the 2012 finalization of a property unitization which was originally recorded in 2013. These corrections increased net income for the fourth quarter of 2013 by approximately $15 million (net of an increase to the income tax benefit of approximately $9 million for the period).
(2) Due to the effects of pricing, timing of projects and changes in our reserves product mix, in the fourth quarter of 2013 we reported a non-cash write-down on a before-tax basis of $46.9 million ($30.0 million after tax) on our oil and natural gas properties.
80
Revenues | Net Income (Loss) Before Taxes | Net Income (Loss) | Basic EPS | Diluted EPS | |||||||||||||||
2012 (As Reported) | |||||||||||||||||||
First | $ | 135,878 | $ | 5,882 | $ | 3,570 | $ | 0.08 | $ | 0.08 | |||||||||
Second | 134,757 | 5,115 | 3,028 | 0.07 | 0.07 | ||||||||||||||
Third | 128,750 | 5,544 | 3,122 | 0.07 | 0.07 | ||||||||||||||
Fourth (1) | 157,905 | 20,037 | 11,219 | 0.26 | 0.26 | ||||||||||||||
Total | $ | 557,290 | $ | 36,578 | $ | 20,939 | $ | 0.49 | $ | 0.48 | |||||||||
2012 (Adjustments) | |||||||||||||||||||
First | $ | 1,948 | $ | 2,672 | $ | 1,705 | $ | 0.04 | $ | 0.04 | |||||||||
Second | (1,175 | ) | (1,912 | ) | (1,220 | ) | (0.03 | ) | (0.03 | ) | |||||||||
Third | 111 | (604 | ) | (385 | ) | (0.01 | ) | (0.01 | ) | ||||||||||
Fourth (2) | 3,312 | 1,039 | 662 | 0.02 | 0.01 | ||||||||||||||
Total | $ | 4,196 | $ | 1,195 | $ | 762 | $ | 0.02 | $ | 0.01 | |||||||||
2012 (As Restated) | |||||||||||||||||||
First | $ | 137,826 | $ | 8,554 | $ | 5,275 | $ | 0.12 | $ | 0.12 | |||||||||
Second | 133,582 | 3,203 | 1,808 | 0.04 | 0.04 | ||||||||||||||
Third | 128,861 | 4,940 | 2,737 | 0.06 | 0.06 | ||||||||||||||
Fourth | 161,217 | 21,076 | 11,881 | 0.28 | 0.27 | ||||||||||||||
Total | $ | 561,486 | $ | 37,773 | $ | 21,701 | $ | 0.51 | $ | 0.50 | |||||||||
(1) There were no extraordinary items in 2012.
(2) These adjustments reflects a $2.9 million revenue adjustment related to the 2012 finalization of a property unitization which was originally recorded in 2013. This correction increased net income for the fourth quarter of 2012 by approximately $1.9 million (net of an increase to the income tax provision of approximately $1.0 million.
81
Item 9. Changes in and Disagreements with Accountants on Accounting and Financial Disclosure
None.
Item 9A. Controls and Procedures
We maintain disclosure controls and procedures, as defined in Rules 13a-15(e) and 15d-15(e) of the Securities Exchange Act of 1934, consisting of controls and other procedures designed to give reasonable assurance that information we are required to disclose in the reports we file or submit under the Securities Exchange Act of 1934 is recorded, processed, summarized and reported within the time periods specified in the Securities and Exchange Commission's rules and forms and that such information is accumulated and communicated to management, including our chief executive officer and our chief financial officer, to allow timely decisions regarding such required disclosure. At the time the Original Filing was filed on March 3, 2014, our management, including our chief executive officer and chief financial officer, concluded that our internal control over financial reporting and disclosure controls and procedures were effective as of December 31, 2013.
Subsequent to that evaluation management has determined that a deficiency in internal control exists related to the review controls for the full-cost ceiling test write-down calculation, specifically analyzing the deferred income tax effects in the calculation, and has further concluded that such deficiency represents a material weakness in our internal control over financial reporting as discussed in Item 8. Management's Report on Internal Control Over Financial Reporting. As a result of the determination of a material weakness, management has now concluded that our disclosure controls and procedures were not effective as of December 31, 2013.
In light of the material weakness referred to above, we performed additional analyses and procedures in order to conclude that our consolidated financial statements in this Form 10-K/A for the year ended December 31, 2013 and for each of the quarterly periods within fiscal 2013 are fairly presented, in all material respects, in accordance with US GAAP.
For further information about our remediation plans related to the referenced material weakness, refer to Item 8.
Management's Report on Internal Control Over Financial Reporting.
Item 9B. Other Information
None.
82
PART III
Item 10. Directors, Executive Officers and Corporate Governance
The information required under Item 10 which will be set forth in our definitive proxy statement to be filed within 120 days after the close of the fiscal year-end in connection with our May 20, 2014, annual shareholders' meeting is incorporated herein by reference.
Item 11. Executive Compensation
The information required under Item 11 which will be set forth in our definitive proxy statement to be filed within 120 days after the close of the fiscal year-end in connection with our May 20, 2014, annual shareholders' meeting is incorporated herein by reference.
Item 12. Security Ownership of Certain Beneficial Owners and Management and Related Stockholder Matters
The information required under Item 12 which will be set forth in our definitive proxy statement to be filed within 120 days after the close of the fiscal year-end in connection with our May 20, 2014, annual shareholders' meeting is incorporated herein by reference.
Item 13. Certain Relationships and Related Transactions, and Director Independence
The information required under Item 13 which will be set forth in our definitive proxy statement to be filed within 120 days after the close of the fiscal year-end in connection with our May 20, 2014, annual shareholders' meeting is incorporated herein by reference.
Item 14. Principal Accountant Fees and Services
The information required under Item 14 which will be set forth in our definitive proxy statement to be filed within 120 days after the close of the fiscal year-end in connection with our May 20, 2014, annual shareholders' meeting is incorporated by reference.
PART IV
Item 15. Exhibits and Financial Statement Schedules.
1. The following consolidated financial statements of Swift Energy Company together with the report thereon of Ernst & Young LLP and the data contained therein are included in Item 8 hereof:
Management's Report on Internal Control Over Financial Reporting | |
Report of Independent Registered Public Accounting Firm on Internal Control Over Financial Reporting | |
Report of Independent Registered Public Accounting Firm | |
Consolidated Balance Sheets | |
Consolidated Statements of Operations | |
Consolidated Statements of Comprehensive Income | |
Consolidated Statements of Stockholders' Equity | |
Consolidated Statements of Cash Flows | |
Notes to Consolidated Financial Statements | |
2. Financial Statement Schedules
[None]
83
3. Exhibits
3.1 | Restated Certificate of Formation of Swift Energy Company (incorporated by reference as Exhibit 3.1 to Swift Energy Company's Quarterly Report on Form 10-Q for the quarterly period ended September 30, 2009 filed November 3, 2009, File No. 1-08754). |
3.2 | Amendment No. 1 to the Company's Restated Certificate of Formation (incorporated by reference as Exhibit 3.1 to Swift Energy Company's Form 8-K filed May16, 2011, File No. 1-08754). |
3.3 | Fourth Amended and Restated Bylaws of Swift Energy Company, effective July 30, 2013 (incorporated by reference as Exhibit 3.1 to Swift Energy Company's Quarterly Report on Form 10-Q filed August 1, 2013, File No. 1-08754). |
3.4 | Certificate of Designation of Series A Junior Participating Preferred Stock of Swift Energy Company (incorporated by reference as Exhibit 3.4 to Swift Energy Company's Form 8-K filed December 29, 2005, File No. 1-08754). |
4.1 | Indenture dated as of May 16, 2007 between Swift Energy Company and Wells Fargo Bank, National Association (incorporated by reference as Exhibit 4.1 to Swift Energy Company's Registration Statement on Form S-3 filed May 17, 2007, File No. 333-143034). |
4.2 | First Supplemental Indenture dated as of June 1, 2007, between Swift Energy Company, Swift Energy Operating, LLC and Wells Fargo Bank, National Association relating to the 7-1/8% Senior Notes due 2017 (incorporated by reference as Exhibit 4.1 to Swift Energy Company's Form 8-K filed June 7, 2007, File No. 1-08754). |
4.3 | Indenture dated as of May 19, 2009, between Swift Energy Company and Wells Fargo Bank, National Association, as Trustee (incorporated by reference as Exhibit 4.1 to Swift Energy Company's Registration Statement on Form S-3 filed May 19, 2009, and amended June 17 and June 26, 2009, File No. 333-159341). |
4.4 | First Supplemental Indenture dated as of November 25, 2009, between Swift Energy Company, Swift Energy Operating, LLC, and Wells Fargo Bank, National Association, as Trustee, including the form of 8 7/8% Senior Notes (incorporated by reference as Exhibit 4.1 to Swift Energy Company's Form 8-K filed December 2, 2009, File No. 1-08754). |
4.5 | Second Supplemental Indenture dated as of November 30, 2011, among Swift Energy Company, Swift Energy Operating, LLC, and Wells Fargo Bank, National Association relating to the 7-7/8% Senior Notes due 2022 of Swift Energy Company (incorporated by reference as Exhibit 4.1 to Swift Energy Company's Form 8-K filed December 5, 2011, File No. 1-08754). |
4.6 | Registration Rights Agreement, dated October 18, 2012, by and among Swift Energy Company, Swift Energy Operating, LLC and J.P. Morgan Securities LLC, as representatives of the initial purchasers (incorporated by reference as Exhibit 4.3 to Swift Energy Company's Form 8-K filed October 24, 2012, File No. 1-08754). |
10.1+ | Amended and Restated 1990 Nonqualified Stock Option Plan, as of May 13, 1997 (incorporated by reference from Swift Energy Company's definitive proxy statement for the annual shareholders meeting filed April 14, 1997, File No. 1-08754). |
10.2+ | Amendment to the 1990 Stock Compensation Plan, as of May 9, 2000 (incorporated by reference as Exhibit 4.2 to the Swift Energy Company's Registration Statement on Form S-8 filed August 10, 2001, File No. 333-67242). |
10.3+ | 2001 Omnibus Stock Compensation Plan, as of January 1, 2001 (incorporated by reference as Exhibit 4.3 to the Swift Energy Company's Registration Statement on Form S-8 filed August 10, 2001, File No. 333-67242). |
84
10.4+ | Second Amended and Restated Swift Energy Company 2005 Stock Compensation Plan dated February 12, 2013 (incorporated by reference as Exhibit 10.1 to Swift Energy Company's Form 8-K filed May 24, 2013, File No. 1-08754). |
10.5+ | Forms of agreements for grant of incentive stock options and forms of agreement for grant of restricted stock under Swift Energy Company 2005 Stock Compensation Plan (incorporated by reference as Exhibit 10.19 to Swift Energy Company's Annual Report on Form 10-K for the fiscal year ended December 31, 2005 filed March 2, 2006, File No. 1-08754). |
10.6+ | Form of Indemnity Agreement for Swift Energy Company officers (incorporated by reference as Exhibit 10.9 to Swift Energy Company's Annual Report on Form 10-K for the fiscal year ended December 31, 2006 filed March 1, 2007, File No. 1-08754). |
10.7+ | Form of Indemnity Agreement for Swift Energy Company directors (incorporated by reference as Exhibit 10.10 to Swift Energy Company's Annual Report on Form 10-K for the fiscal year ended December 31, 2006 filed February 28, 2007, File No. 1-08754). |
10.8+ | Consulting Agreement between Swift Energy Company and Virgil N. Swift effective as of July 1, 2006 (incorporated by reference as Exhibit 10.1 to Swift Energy Company's Quarterly Report on Form 10-Q for the quarterly period ended March 31, 2006 filed May 5, 2006, File No. 1-08754). |
10.9 | Second Amended and Restated Credit Agreement as of September 21, 2010, among Swift Energy Company, Swift Energy Operating, LLC and JPMorgan Chase Bank, N.A. as Administrative Agent, BNP Paribas and Wells Fargo Bank, N.A. as Co-Syndication Agents, Bank of Scotland PLC and Societe Generale, as Co-Documentation Agents, and the Lenders party thereto (incorporated by reference as Exhibit 10.01 to the Swift Energy Company's Form 8-K filed September 27, 2010, File No. 1-08754). |
10.10 | First Amendment and Consent to Second Amended and Restated Credit Agreement dated May 12, 2011, among Swift Energy Company, Swift Energy Operating, LLC, JPMorgan Chase Bank, N.A., as Administrative Agent, and the lenders party thereto (incorporated by reference as Exhibit 10.1 to Swift Energy Company's Form 8-K filed May 17, 2011, File No. 1-08754). |
10.11 | Second Amendment to Second Amended and Restated Credit Agreement effective as of October 2, 2012, among Swift Energy Company, Swift Energy Operating, LLC and JPMorgan Chase Bank, N.A. as Administrative Agent, and the Lenders party thereto (incorporated by reference as Exhibit 10.1 to the Swift Energy Company's Form 8-K filed October 3, 2012, File No 1-08754). |
10.12 | Third Amendment to Second Amendment and Restated Credit Agreement effective as of October 3, 2012, among Swift Energy Company, Swift Energy Operating, LLC, JPMorgan Chase Bank, N.A., as Administrative Agent, and the lenders party thereto (incorporated by reference as Exhibit 10.1 to Swift Energy Company's Form 8-K filed November 5, 2012, File No. 1-08754). |
10.13 | Eighth Amendment to Lease Agreement between Swift Energy Company and Greenspoint Plaza Limited Partnership dated as of June 30, 2004 (incorporated by reference as Exhibit 10.1 to the Swift Energy Company Quarterly Report on Form 10-Q for the quarterly period ended June 30, 2004 filed August 6, 2004, File No. 1-08754). |
10.14+ | Swift Energy Company Change of Control Severance Plan dated November 4, 2008 (incorporated by reference as Exhibit 10.2 to Swift Energy Company's Quarterly Report on Form 10-Q for the quarterly period ended September 30, 2008 filed November 6, 2008). |
10.15+ | Second Amended and Restated Executive Employment Agreement between Swift Energy Company and Terry E. Swift dated November 4, 2008 (incorporated by reference as Exhibit 10.3 to Swift Energy Company's Quarterly Report on Form 10-Q for the quarterly period ended September 30, 2008 filed November 6, 2008, File No. 1-08754). |
85
10.16+ | Second Amended and Restated Executive Employment Agreement between Swift Energy Company and Bruce H. Vincent dated November 4, 2008 (incorporated by reference as Exhibit 10.4 to Swift Energy Company's Quarterly Report on Form 10-Q for the quarterly period ended September 30, 2008 filed November 6, 2008, File No. 1-08754). |
10.17+ | Second Amended and Restated Executive Employment Agreement between Swift Energy Company and Alton D. Heckaman dated November 4, 2008 (incorporated by reference as Exhibit 10.5 to Swift Energy Company's Quarterly Report on Form 10-Q for the quarterly period ended September 30, 2008 filed November 6, 2008, File No. 1-08754). |
10.18+ | Executive Employment Agreement between Swift Energy Company and Robert J. Banks dated November 4, 2008 (incorporated by reference as Exhibit 10.6 to Swift Energy Company's Quarterly Report on Form 10-Q for the quarterly period ended September 30, 2008 filed November 6, 2008, File No. 1-08754). |
10.19+ | Amended and Restated Executive Employment Agreement between Swift Energy Company and James P. Mitchell dated November 4, 2008 (incorporated by reference as Exhibit 10.8 to Swift Energy Company's Quarterly Report on Form 10-Q for the quarterly period ended September 30, 2008 filed November 6, 2008, File No. 1-08754). |
10.20 | Purchase Agreement, dated October 3, 2012 among Swift Energy Company, Swift Energy Operating, LLC and J.P. Morgan Securities LLC, as representatives of the several initial purchasers (incorporated by reference as Exhibit 10.1 to Swift Energy Company's Form 8-K filed October 5, 2012, File No. 1-08745). |
10.21+ | Form of Performance Restricted Stock Unit Award under the Second Amended and Restated Swift Energy 2005 Stock Compensation Plan (incorporated by reference as Exhibit 10.1 to Swift Energy Company's Quarterly Report on Form 10-Q for the quarterly period ended March 31, 2013 filed May 2, 2013, File No. 1-08754). |
12 * | Swift Energy Company Ratio of Earnings to Fixed Charges. |
21 * | List of Subsidiaries of Swift Energy Company. |
23.1 * | Consent of H.J. Gruy and Associates, Inc. |
23.2 * | Consent of Ernst & Young LLP as to incorporation by reference regarding Forms S-3, S-4 and S-8 Registration Statements. |
31.1 * | Certification of Chief Executive Officer pursuant to Section 302 of the Sarbanes-Oxley Act of 2002. |
31.2* | Certification of Chief Financial Officer pursuant to Section 302 of the Sarbanes-Oxley Act of 2002. |
32* | Certification of Chief Executive Officer and Chief Financial Officer pursuant to Section 906 of the Sarbanes-Oxley Act of 2002. |
99.1* | The reserves audit letter of H.J. Gruy and Associates, Inc. dated February 26, 2014. |
101.INS* | XBRL Instance Document |
101.SCH* | XBRL Schema Document |
101.CAL* | XBRL Calculation Linkbase Document |
101.LAB* | XBRL Label Linkbase Document |
101.PRE* | XBRL Presentation Linkbase Document |
86
101.DEF* | XBRL Definition Linkbase Document |
* Filed herewith.
+ Management contract or compensatory plan or arrangement.
87
SIGNATURES
Pursuant to the requirements of Section 13 or 15(d) of the Securities Exchange Act of 1934, the Registrant, Swift Energy Company, has duly caused this report to be signed on its behalf by the undersigned, thereunto duly authorized.
SWIFT ENERGY COMPANY | |
By: /s/ Terry E. Swift | |
Terry E. Swift | |
Chairman of the Board | |
Pursuant to the requirements of the Securities Exchange Act of 1934, this report has been signed below by the following persons on behalf of the Registrant, Swift Energy Company, and in the capacities and on the dates indicated:
Signatures | Title | Date |
Director | ||
/s/ Terry E. Swift | Chief Executive Officer | November 17, 2014 |
Terry E. Swift | ||
Executive Vice-President | ||
/s/ Alton D. Heckaman, Jr. | Principal Financial Officer | November 17, 2014 |
Alton D. Heckaman, Jr. | Principal Accounting Officer | |
/s/ Deanna L. Cannon | Director | November 17, 2014 |
Deanna L. Cannon | ||
88
/s/ Douglas J. Lanier | Director | November 17, 2014 |
Douglas J. Lanier | ||
/s/Greg Matiuk | Director | November 17, 2014 |
Greg Matiuk | ||
/s/ Clyde W. Smith, Jr. | Director | November 17, 2014 |
Clyde W. Smith, Jr. | ||
/s/ Charles J. Swindells | Director | November 17, 2014 |
Charles J. Swindells | ||
/s/ Bruce H. Vincent | Director | November 17, 2014 |
Bruce H. Vincent | ||
89