Attached files
| file | filename |
|---|---|
| 8-K - 8-K - AMICUS THERAPEUTICS, INC. | a14-24598_18k.htm |
| EX-99.1 - EX-99.1 - AMICUS THERAPEUTICS, INC. | a14-24598_1ex99d1.htm |
Exhibit 99.2
|
|
American Society of Nephrology (ASN) Migalastat Monotherapy Phase 3 Data November 15, 2014 |

|
|
Safe Harbor This presentation contains “forward-looking statements” within the meaning of the Private Securities Litigation Reform Act of 1995 relating to business, operations and financial conditions of Amicus including but not limited to preclinical and clinical development of Amicus’ candidate drug products, cash runway, ongoing collaborations and the timing and reporting of results from clinical trials evaluating Amicus’ candidate drug products. Words such as, but not limited to, “look forward to,” “believe,” “expect,” “anticipate,” “estimate,” “intend,” “plan,” “would,” “should” and “could,” and similar expressions or words, identify forward-looking statements. Although Amicus believes the expectations reflected in such forward-looking statements are based upon reasonable assumptions, there can be no assurance that its expectations will be realized. Actual results could differ materially from those projected in Amicus’ forward-looking statements due to numerous known and unknown risks and uncertainties, including the “Risk Factors” described in our Annual Report on Form 10-K for the year ended December 31, 2013. All forward-looking statements are qualified in their entirety by this cautionary statement, and Amicus undertakes no obligation to revise or update this presentation to reflect events or circumstances after the date hereof. |

|
|
Fabry Disease Overview Deficiency of lysosomal enzyme -Gal A leading to GL-3 accumulation Heterogeneous (>800 known mutations) Symptoms include pain, gastrointestinal problems, angiokeratomas Cardiac complications, renal failure, stroke are leading causes of morbidity Recent Fabry Registry data indicate cardiac complications are leading cause of death in patients1,2 Left ventricular hypertrophy is a hallmark of Fabry cardiomyopathy, associated with increased risk of cardiac events and mortality3 Natural history data indicates left ventricular mass increases progressively in untreated patients4,5 Kidney GL-3 Fatal lysosomal storage disease with significant unmet needs despite available treatment options 1Mehta 2009, 2Waldek 2009, 3Patel 2011, 4Kampmann 2008, 5Germain 2013 |

|
|
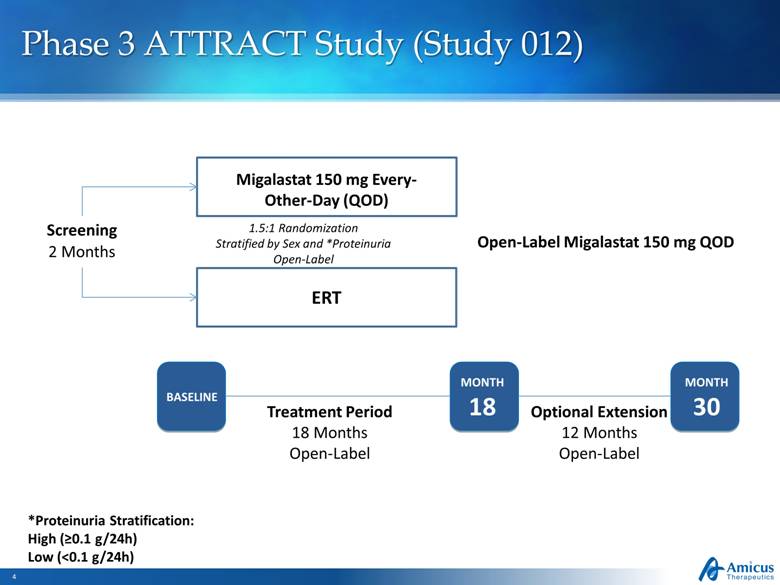
1.5:1 Randomization Stratified by Sex and *Proteinuria Open-Label Migalastat 150 mg Every-Other-Day (QOD) Open-Label Migalastat 150 mg QOD MONTH 18 MONTH 30 BASELINE Optional Extension 12 Months Open-Label Treatment Period 18 Months Open-Label Screening 2 Months ERT Slide 4 *Proteinuria Stratification: High (>0.1 g/24h) Low (<0.1 g/24h) Phase 3 ATTRACT Study (Study 012) |
|
|
Study 012 Data Presented at ASN 2014 |

|
|
Study 012 Top-Line 18-Month Data Key Findings (Previously Announced) Migalastat had a comparable effect to ERT on patients’ kidney function as measured by the change in both eGFR* and mGFR* with 100% overlap in the 95% confidence intervals for both measures Levels of plasma lyso-Gb3, an important biomarker of disease, remained low and stable in patients with amenable mutations who switched from ERT to Migalastat Migalastat was generally safe and well-tolerated Of 48 subjects with GLP HEK-amenable mutations who completed Study 012, 46 (96%) elected to continue with the 12-month treatment extension and 45 remain on migalastat today as their only treatment for Fabry disease Migalastat Successfully Met Co-Primary Endpoints of Comparability to ERT on Key Measures of Kidney Function * Estimated Glomerular Filtration Rate, ** Measured Glomerular Filtration Rate |
|
|
Kidney Function Annualized Change in GFR from Baseline to Month 18 – ANCOVA [mITT] Annualized rate of change in mGFR (ml/min/1.73 m2) Difference of mean annualized change in mGFR = -1.11 Migalastat n=34 ERT n=18 = -4.35 = -3.24 Difference of mean annualized change in eGFR CKD-Epi = +0.63 Annualized rate of change in eGFR (ml/min/1.73 m2) Migalastat n=34 ERT n=18 = -0.40 = -1.03 Data represent LS means and 95% confidence intervals Change in GFR over 18 months comparable for Migalastat and ERT 95% CI overlap > 50% Difference Means < 2.2 95% CI overlap > 50% Difference Means < 2.2 |

|
|
Kidney Function Annualized Change in GFR from Baseline to Month 18 – Median ± IQR Annualized rate of change in mGFR (ml/min/1.73 m2) Difference of median annualized change in mGFR = +0.34 Migalastat n=34 ERT n=18 = -3.23 = -3.57 Difference of median annualized change in eGFR CKD-Epi = -0.42 Annualized rate of change in eGFR (ml/min/1.73 m2) Migalastat n=34 ERT n=18 = -1.29 = -0.87 Data represent Medians and Interquartile range Change in GFR over 18 months comparable for Migalastat and ERT |
|
|
Disease Substrate in Plasma (Plasma Lyso-Gb3) Data points represent the mean, Error bars are SD; Based on subjects with available samples for this analysis No Change in Plasma Lyso-Gb3 over 18 months Following Switch From ERT to Migalastat in Subjects with Amenable Mutations In subjects with amenable mutations plasma lyso-Gb3 levels comparable for migalastat and ERT In 2 male subjects with non-amenable mutations plasma lyso-Gb3 increased following switch from ERT as compared to two (1M, 1F) who remained on ERT Amenable Non-Amenable |
|
|
Safety Summary Common AEs (>10%) Migalastat Was Generally Safe and Well-Tolerated Migalastat ERT N subjects 36 21 n subjects with TEAEs (%) 34 (94%) 20 (95%) Nasopharyngitis 33% 33% Headache 25% 24% Dizziness 17% 10% Influenza 14% 19% Abdominal Pain 14% 10% Diarrhea 14% 10% Nausea 14% 10% Back Pain 11% 14% Upper Respiratory Tract Infection 11% 5% Urinary Tract Infection 11% 5% Cough 8% 24% Vomiting 8% 14% Sinusitis 8% 14% Arthralgia 8% 10% Bronchitis 6% 14% Edema Peripheral 6% 10% Vertigo 3% 10% Dry Mouth 3% 10% Gastritis 3% 10% Pain In Extremity 3% 10% Dyspnea 3% 10% Procedural Pain - 10% |
|
|
Study 012 NEW Data at ASN 2014 |

|
|
Cardiac ECHO Cardiac ECHO Parameters – Change from Baseline to Month 18 (mITT)* Migalastat Baseline Mean (% abnormal) n=33 Migalastat Change from Baseline to M18 (mean, 95%CI) n=31 ERT Baseline Mean (% abnormal) n=16 ERT Change from Baseline to M18 (mean, 95%CI) n=13 LV Mass Index** (g/m2) 95.3 (39%) -6.6 (-11.0, -2.1)*** 92.9 (31%) -2.0 (-11.0, +7.0) Statistically Significant Decrease in LV Mass Index (LVMi) in Subjects in Migalastat Arm *Read in blinded manner in centralized lab every 6 months **Normal LVMI: 43-95 (female), 49-115 (male) ***Statistically significant (95% CI does not overlap zero) |
|
|
Migalastat Shows Steady Improvement in LVMi Over Time LVMi: Effect Over Time BL n=32 M6 n=32 M12 n=29 M18 n=31 Migalastat Change in LVMi from Baseline to Month 18 (g/m2) ERT Change in LVMi from Baseline to Month 18 (g/m2) BL n=18 M6 n=16 M12 n=14 M18 n=13 Note: Mean and 95% confidence intervals on change from baseline are plotted Migalastat ERT |
|
|
LVMi Waterfall Plots – Baseline to Month 18 ALL (n=33) Abnormal at Baseline (n=4M, 9F) 14 Reductions in LVMi Consistent Across Patients, in Particular Those Abnormal at Baseline Change in LVMi (g/m2) Change in LVMi (g/m2) Change in LVMi in All Patients (n=33) Change in LVMi in Patients Abnormal at Baseline (n=4M, 9F) Note: Includes last available LVMi value for 4 subjects missing a month 18 value 50 25 0 -25 -50 50 25 0 -25 -50 |

|
|
LVMi Waterfall Plots – Baseline to Month 18 ALL (n=33) Abnormal at Baseline (n=4M, 9F) Reductions in LVMi Observed in Both Males and Females Change in LVMi in Male Patients (n=13) Females (n=20) Change in LVMi (g/m2) Change in LVMi (g/m2) Change in LVMi in Female Patients (n=20) Note: Includes last available LVMi value for 4 subjects missing a month 18 value 50 25 0 -25 -50 50 25 0 -25 -50 |
|
|
Composite of Fabry-Associated Clinical Events 29% on Migalastat and 44% on ERT had a Fabry-Associated Clinical Event* % (Number) of Fabry Patients Who Experienced a Fabry-Associated Event (Baseline to Month 18) Event Migalastat (n=34) ERT (n=18) Cardiac 6% (2) chest pain, VT/chest pain 17% (3) cardiac failure, dyspnoea, arrhythmia Renal 24% (8) proteinuria (6), GFR (2) 33% (6) proteinuria (4), GFR (3) CNS 0% (0) 6% (1) TIA Total % (Number) 29% (10) 44% (8) *Defined set of morbidities or worsening in a Fabry patient’s renal, cardiac, or cerebrovascular status. Note: 1 patient on Migalastat and 3 patients on ERT had 2 events: Migalastat (proteinuria and cardiac), ERT (GFR and cardiac, GFR and cardiac, GFR and proteinura) |
|
|
Migalastat Monotherapy Experience for Fabry Information as of November 2014. All patients are receiving investigational drug, migalastat HCl, as part of ongoing clinical trials *Retention defined as # of patients who completed a study and chose to enter extension, e.g., Study 011 12-mo into 24-mo extension Total patients who have ever taken migalastat: 143 Total patient years of therapy: 403 Maximum years on therapy: 8.8 Average retention rate into next study: 96% * Patients taking migalastat today as only therapy: 95 97 Patients Today Take Migalastat HCl as Only Therapy for Fabry Disease1 |

|
|
Global Regulatory Strategy Totality of clinical data 8+ years of data in extension studies Complete data set from Phase 3 studies (011 and 012) Centralized Procedure underway EMA Pre-Submission Meeting scheduled 4Q 14 Clear regulatory pathway Non-inferiority to ERT (Study 012) Pursuing Fastest Path to Approval for Migalastat |

|
|
Key Milestones Timing Milestone 2Q14 12-month Study 011 data (kidney biopsies) 2Q14 24-month Study 011 data (clinical outcomes) 3Q14 18-month Study 012 data (kidney function) 4Q14 Additional 011, 012, and Phase 2 extension data 4Q14 EMA regulatory interaction 1Q15 FDA regulatory interaction |
|
|
American Society of Nephrology (ASN) Migalastat Monotherapy Phase 3 Data November 15, 2014 |