Attached files
| file | filename |
|---|---|
| 8-K - 8-K - COLE CORPORATE INCOME TRUST, INC. | ccitq320148-k.htm |
 | Q3 2014 SUPPLEMENTAL INFORMATION |
Cole Corporate Income Trust, Inc. (CCIT) |

| Q3 2014 SUPPLEMENTAL INFORMATION |
Table of Contents |
CCIT Supplemental Information |
September 30, 2014 |
Overview | Page 3 |  | ||
Financial Information | Page | |||
Financial Summary | 4 | |||
Balance Sheets | 5 | |||
Statements of Operations | 6 | |||
FFO, MFFO, AFFO, and Per Share Information | 7 | |||
EBITDA and Ratio Analysis | 8 |  | |
Net Operating Income by Property Type | 9 | ||
Debt Summary | 10 | ||
Portfolio Metrics | Page(s) | ||
Portfolio Composition by Tenant | 11-12 | ||
Portfolio Composition by State | 13 | ||
Portfolio Composition by Tenant Industry | 14 |  | |
Lease Expiration Schedule | 15 | ||
Portfolio Composition by Property Type | 16-17 | ||
Top Tenant Descriptions | 18-19 | ||
Definitions | 20-21 | ||
This data and other information described herein are as of and for the three-month period ended September 30, 2014, and subsequent events assessed through November 12, 2014, unless otherwise indicated. Future performance may not be consistent with past performance and is subject to change and inherent risks and uncertainties. This information should be read in conjunction with the financial statements and the management’s discussion and analysis of financial condition and results of operations section contained in CCIT’s Annual Report on Form 10-K for the year ended December 31, 2013 and Quarterly Report on Form 10-Q for the three and nine months ended September 30, 2014. |
Forward-Looking Statements |
Certain statements contained herein may be considered forward-looking statements within the meaning of Section 27A of the Securities Act of 1933, as amended (the “Securities Act”), and Section 21E of the Securities Exchange Act of 1934, as amended (the “Exchange Act”). CCIT intends for all such forward-looking statements to be covered by the safe harbor provisions for forward-looking statements contained in Section 27A of the Securities Act and Section 21E of the Exchange Act, as applicable. Such statements include, in particular, statements about CCIT’s plans, strategies, and prospects and are subject to certain risks and uncertainties, as well as known and unknown risks, which could cause actual results to differ materially from those projected or anticipated. Therefore, such statements are not intended to be a guarantee of CCIT’s performance in future periods. Such forward-looking statements can generally be identified by CCIT’s use of forward-looking terminology such as “may,” “will,” “would,” “could,” “should,” “expect,” “intend,” “anticipate,” “estimate,” “believe,” “continue,” or other similar words. Readers are cautioned not to place undue reliance on these forward-looking statements, which speak only as of the date hereof. CCIT makes no representation or warranty (express or implied) about the accuracy of any such forward-looking statements contained herein, and does not intend, and undertakes no obligation, to publicly update or revise any forward-looking statements, whether as a result of new information, future events, or otherwise. Factors and risks that could cause actual results to differ materially from expectations are disclosed from time to time in greater detail in CCIT’s filings with the Securities and Exchange Commission including, but not limited to, CCIT’s Annual Report on Form 10-K, Quarterly Reports on Form 10-Q, as well as CCIT’s press releases. |
| Q3 2014 SUPPLEMENTAL INFORMATION |
Overview: Cole Corporate Income Trust, Inc. |
Cole Corporate Income Trust, Inc. (the “Company”) is a | HIGHLIGHTS | |||
Maryland corporation that was formed on April 6, 2010, | Financial Performance1 — The Company generated | |||
which has elected to be taxed, and currently qualifies, as | revenue of $58.8 million, EBITDA of $41.8 million, and | |||
a real estate investment trust (“REIT”) for federal income | Modified Funds from Operations (MFFO) of $34.3 million | |||
tax purposes. The Company owns and operates a | during the quarter, which represented increases of 3.8%, | |||
diversified portfolio of commercial real estate investments | 2.9%, and 1.8%, respectively, from the second quarter of | |||
primarily consisting of single-tenant, income-producing | 2014. | |||
necessity corporate office and industrial properties, which | ||||
are net-leased to creditworthy tenants and strategically | Real Estate Investments — The Company made $60.8 | |||
located throughout the United States. As of September 30, 2014, | million of real estate investments during the quarter, | |||
the Company owned 87 properties comprising | based on purchase price, all of which were acquisitions | |||
approximately 18.3 million rentable square feet of | of industrial properties with a weighted average remaining | |||
commercial space located in 30 states, which were | term of 11.0 years. As of September 30, 2014, | |||
100% leased. | the Company owned $2.7 billion of real estate assets | |||
consisting of $2.0 billion of office properties and $702.1 | ||||
million of industrial properties, based on purchase price, | ||||
with a weighted average remaining lease term of | ||||
11.3 years. | ||||
Leverage Profile — The Company’s net leverage ratio | ||||
was 38% as of September 30, 2014 with over $2.1 billion, | ||||
or 79%, of its assets unencumbered. The Company had | ||||
$285 million of available borrowings on its Credit | ||||
Facility at September 30, 2014. | ||||
CCIT/SIR Merger — On August 30, 2014, the Company | ||||
entered into an Agreement and Plan of Merger with Select | ||||
Income REIT ("SIR"), a Maryland real estate investment | ||||
trust, and SC Merger Sub LLC, a Maryland limited liability | ||||
company and wholly-owned subsidiary of SIR. | ||||
Recent Activity — The Company did not purchase any | ||||
properties subsequent to September 30, 2014. | ||||
1. See the Definitions section beginning on page 20 for a description of the Company’s non-GAAP measures and pages 7 and 8 for GAAP reconciliations. | ||||
COLE CORPORATE INCOME TRUST, INC. (CCIT) | WWW.COLECAPITAL.COM | 3
| Q3 2014 SUPPLEMENTAL INFORMATION |
Financial Summary | |||||||||||||||||||
(dollars in thousands, except per share amounts) | |||||||||||||||||||
FINANCIAL RESULTS | Q3 2014 | Q2 2014 | Q1 2014 | Q4 2013 | Q3 2013 | ||||||||||||||
Revenue | $ | 58,771 | $ | 56,597 | $ | 53,478 | $ | 39,118 | $ | 25,589 | |||||||||
Net Operating Income (NOI)1 | $ | 48,810 | $ | 47,398 | $ | 44,919 | $ | 32,162 | $ | 21,148 | |||||||||
EBITDA1 | $ | 41,763 | $ | 40,585 | $ | 38,656 | $ | 26,749 | $ | 17,036 | |||||||||
Distributions paid per common share | $ | 0.16 | $ | 0.16 | $ | 0.16 | $ | 0.16 | $ | 0.16 | |||||||||
Funds from operations (FFO)1 | $ | 29,939 | $ | 29,097 | $ | 29,722 | $ | (2,743 | ) | $ | 2,169 | ||||||||
FFO per diluted share | $ | 0.15 | $ | 0.15 | $ | 0.15 | $ | (0.01 | ) | $ | 0.02 | ||||||||
Modified funds from operations (MFFO)1 | $ | 34,340 | $ | 33,741 | $ | 32,132 | $ | 21,640 | $ | 13,923 | |||||||||
MFFO per diluted share | $ | 0.17 | $ | 0.17 | $ | 0.17 | $ | 0.11 | $ | 0.13 | |||||||||
Adjusted funds from operations (AFFO)1 | $ | 29,957 | $ | 29,009 | $ | 26,623 | $ | 17,140 | $ | 10,637 | |||||||||
AFFO per diluted share | $ | 0.15 | $ | 0.15 | $ | 0.14 | $ | 0.09 | $ | 0.10 | |||||||||
PORTFOLIO STATISTICS | |||||||||||||||||||
Equity raised by quarter | $ | 12,929 | $ | 19,339 | $ | 18,676 | $ | 261,192 | $ | 1,070,705 | |||||||||
Leverage ratio, net of cash | 36.9 | % | 35.6 | % | 31.9 | % | 29.3 | % | — | % | |||||||||
Adjusted fixed charge coverage ratio | 5.6 x | 5.9 x | 5.9 x | 5.2 x | 5.5 x | ||||||||||||||
Weighted average remaining lease term | 11.3 | 11.5 | 11.8 | 12.2 | 11.5 | ||||||||||||||
Weighted Average Portfolio Credit Rating1 | BBB+ | BBB+ | BBB+ | BBB+ | BBB+ | ||||||||||||||
PROPERTY INVESTMENTS | |||||||||||||||||||
Office by quarter | $ | — | $ | 118,371 | $ | 86,192 | $ | 808,067 | $ | 218,702 | |||||||||
Industrial by quarter | 60,772 | 43,250 | 10,992 | 147,718 | 265,101 | ||||||||||||||
Total base purchase price | $ | 60,772 | $ | 161,621 | $ | 97,184 | $ | 955,785 | $ | 483,803 | |||||||||
Portfolio Straight Line Rental Revenue by Property Type | Portfolio Investments at Cost | ||||
 | | ||
1. See the Definitions section beginning on page 20 for a description of the Company’s non-GAAP measures and pages 7, 8 and 21 for GAAP reconciliations. | |||
COLE CORPORATE INCOME TRUST, INC. (CCIT) | WWW.COLECAPITAL.COM | 4
| Q3 2014 SUPPLEMENTAL INFORMATION |
Balance Sheets | |||||||||||||||||||
(in thousands) | |||||||||||||||||||
ASSETS | Q3 2014 | Q2 2014 | Q1 2014 | Q4 2013 | Q3 2013 | ||||||||||||||
Investment in real estate assets: | |||||||||||||||||||
Land | $ | 305,996 | $ | 301,666 | $ | 278,000 | $ | 266,088 | $ | 183,411 | |||||||||
Building and improvements | 2,095,652 | 2,044,654 | 1,916,655 | 1,840,941 | 1,079,395 | ||||||||||||||
Intangible lease assets | 311,057 | 304,549 | 285,823 | 275,420 | 163,420 | ||||||||||||||
Total real estate investments, at cost | 2,712,705 | 2,650,869 | 2,480,478 | 2,382,449 | 1,426,226 | ||||||||||||||
Less: accumulated depreciation and amortization | (98,637 | ) | (76,852 | ) | (56,069 | ) | (36,224 | ) | (21,917 | ) | |||||||||
Total investments in real estate, net | 2,614,068 | 2,574,017 | 2,424,409 | 2,346,225 | 1,404,309 | ||||||||||||||
Cash and cash equivalents | 29,057 | 18,206 | 17,985 | 64,073 | 258,401 | ||||||||||||||
Restricted cash | 6,257 | 4,900 | 3,898 | 4,853 | 18,015 | ||||||||||||||
Rents and tenant receivables | 33,004 | 28,398 | 21,110 | 14,388 | 8,212 | ||||||||||||||
Derivative asset, prepaid expenses, | |||||||||||||||||||
and other assets | 4,242 | 2,489 | 6,623 | 4,654 | 3,846 | ||||||||||||||
Deferred financing costs, net | 10,102 | 10,834 | 10,814 | 11,484 | 5,293 | ||||||||||||||
Total assets | $ | 2,696,730 | $ | 2,638,844 | $ | 2,484,839 | $ | 2,445,677 | $ | 1,698,076 | |||||||||
LIABILITIES AND STOCKHOLDERS' EQUITY | |||||||||||||||||||
Credit facility and notes payable | $ | 1,012,616 | $ | 945,616 | $ | 796,616 | $ | 752,616 | $ | 196,760 | |||||||||
Accounts payable and accrued expenses | 17,013 | 13,944 | 12,096 | 12,921 | 9,429 | ||||||||||||||
Escrowed investor proceeds | — | — | — | — | 15,705 | ||||||||||||||
Due to affiliates | 532 | 2,238 | 429 | 2,321 | 6,491 | ||||||||||||||
Acquired below market lease intangibles, net1 | 44,397 | 44,601 | 33,775 | 34,435 | 27,337 | ||||||||||||||
Distributions payable | 10,568 | 10,507 | 10,755 | 10,650 | 7,654 | ||||||||||||||
Deferred rental income and other liabilities | 12,233 | 12,076 | 12,966 | 10,877 | 5,767 | ||||||||||||||
Total liabilities | 1,097,359 | 1,028,982 | 866,637 | 823,820 | 269,143 | ||||||||||||||
Redeemable common stock and noncontrolling | |||||||||||||||||||
interest | 79,636 | 68,881 | 51,005 | 33,272 | 13,838 | ||||||||||||||
Common stock | 1,978 | 1,967 | 1,948 | 1,929 | 1,668 | ||||||||||||||
Capital in excess of par value | 1,696,276 | 1,696,287 | 1,696,344 | 1,696,395 | 1,477,968 | ||||||||||||||
Accumulated distributions in excess of earnings | (180,512 | ) | (156,522 | ) | (133,236 | ) | (111,977 | ) | (63,982 | ) | |||||||||
Accumulated other comprehensive income (loss) | 1,993 | (751 | ) | 2,141 | 2,238 | (559 | ) | ||||||||||||
Total stockholders' equity | 1,519,735 | 1,540,981 | 1,567,197 | 1,588,585 | 1,415,095 | ||||||||||||||
Total liabilities and stockholders' equity | $ | 2,696,730 | $ | 2,638,844 | $ | 2,484,839 | $ | 2,445,677 | $ | 1,698,076 | |||||||||
1. Acquired below market leases are presented net of accumulated amortization expenses of $4,580, $3,570, $2,603, $1,943, and $1,205 for Q3 2014, Q2 2014, Q1 2014, Q4 2013, and Q3 2013, respectively. | ||||
COLE CORPORATE INCOME TRUST, INC. (CCIT) | WWW.COLECAPITAL.COM | 5
| Q3 2014 SUPPLEMENTAL INFORMATION |
Statements of Operations | |||||||||||||||||||
(in thousands, except share and per share amounts) | |||||||||||||||||||
Q3 2014 | Q2 2014 | Q1 2014 | Q4 2013 | Q3 2013 | |||||||||||||||
REVENUES | |||||||||||||||||||
Rental and other property income | $ | 49,883 | $ | 48,213 | $ | 45,737 | $ | 33,067 | $ | 21,992 | |||||||||
Tenant reimbursement income | 8,888 | 8,384 | 7,741 | 6,051 | 3,597 | ||||||||||||||
Total revenue | 58,771 | 56,597 | 53,478 | 39,118 | 25,589 | ||||||||||||||
EXPENSES | |||||||||||||||||||
General and administrative expenses | 1,794 | 1,865 | 1,539 | 2,332 | 1,746 | ||||||||||||||
Property operating expenses | 9,961 | 9,199 | 8,559 | 6,956 | 4,441 | ||||||||||||||
Advisory fees and expenses | 5,131 | 4,916 | 4,713 | 3,604 | 2,387 | ||||||||||||||
Acquisition and merger-related expenses | 4,401 | 4,644 | 2,410 | 24,383 | 11,754 | ||||||||||||||
Depreciation | 15,269 | 14,590 | 14,053 | 10,048 | 7,028 | ||||||||||||||
Amortization | 6,347 | 6,025 | 5,803 | 4,098 | 2,854 | ||||||||||||||
Total operating expenses | 42,903 | 41,239 | 37,077 | 51,421 | 30,210 | ||||||||||||||
OPERATING INCOME (LOSS) | 15,868 | 15,358 | 16,401 | (12,303 | ) | (4,621 | ) | ||||||||||||
Other income (expense): | |||||||||||||||||||
Interest and other income | 21 | 13 | 47 | 506 | 21 | ||||||||||||||
Interest expense | (7,442 | ) | (6,844 | ) | (6,524 | ) | (5,109 | ) | (3,113 | ) | |||||||||
Total other expense: | (7,421 | ) | (6,831 | ) | (6,477 | ) | (4,603 | ) | (3,092 | ) | |||||||||
Net income (loss) | 8,447 | 8,527 | 9,924 | (16,906 | ) | (7,713 | ) | ||||||||||||
Net income (loss) allocated to noncontrolling interest | 54 | 45 | 58 | (17 | ) | — | |||||||||||||
Net income (loss) attributable to the Company | $ | 8,393 | $ | 8,482 | $ | 9,866 | $ | (16,889 | ) | $ | (7,713 | ) | |||||||
Weighted average number of common shares outstanding: | |||||||||||||||||||
Basic and diluted | 197,657,793 | 196,045,136 | 194,185,622 | 189,782,209 | 107,828,254 | ||||||||||||||
Net income (loss) per common share: | |||||||||||||||||||
Basic and diluted | $ | 0.04 | $ | 0.04 | $ | 0.05 | $ | (0.09 | ) | $ | (0.07 | ) | |||||||
COLE CORPORATE INCOME TRUST, INC. (CCIT) | WWW.COLECAPITAL.COM | 6
| Q3 2014 SUPPLEMENTAL INFORMATION |
FFO, MFFO, AFFO, and Per Share Information | |||||||||||||||||||
(in thousands, except share and per share amounts) | |||||||||||||||||||
Q3 2014 | Q2 2014 | Q1 2014 | Q4 2013 | Q3 2013 | |||||||||||||||
FUNDS FROM OPERATIONS | |||||||||||||||||||
Net income (loss) attributable to the Company | $ | 8,393 | $ | 8,482 | $ | 9,866 | $ | (16,889 | ) | $ | (7,713 | ) | |||||||
Depreciation and amortization | 21,546 | 20,615 | 19,856 | 14,146 | 9,882 | ||||||||||||||
Funds from operations (FFO)1: | 29,939 | 29,097 | 29,722 | (2,743 | ) | 2,169 | |||||||||||||
Acquisition and merger-related expenses | 4,401 | 4,644 | 2,410 | 24,383 | 11,754 | ||||||||||||||
Modified funds from operations (MFFO)1: | 34,340 | 33,741 | 32,132 | 21,640 | 13,923 | ||||||||||||||
Above market lease amortization | 168 | 169 | (12 | ) | 161 | 132 | |||||||||||||
Below market lease amortization | (1,011 | ) | (966 | ) | (660 | ) | (739 | ) | (478 | ) | |||||||||
Straight-line rent | (4,272 | ) | (4,665 | ) | (5,511 | ) | (4,594 | ) | (3,384 | ) | |||||||||
Amortization of deferred financing costs | 732 | 730 | 674 | 672 | 444 | ||||||||||||||
Adjusted funds from operations (AFFO)1: | $ | 29,957 | $ | 29,009 | $ | 26,623 | $ | 17,140 | $ | 10,637 | |||||||||
Weighted average number of common shares outstanding: | 197,657,793 | 196,045,136 | 194,185,622 | 189,782,209 | 107,828,254 | ||||||||||||||
Distributions declared | $ | 32,382 | $ | 31,768 | $ | 31,125 | $ | 31,106 | $ | 17,745 | |||||||||
Distributions paid | $ | 32,321 | $ | 32,016 | $ | 31,020 | $ | 28,110 | $ | 13,004 | |||||||||
Q3 2014 | Q2 2014 | Q1 2014 | Q4 2013 | Q3 2013 | |||||||||||||||
PER SHARE INFORMATION | |||||||||||||||||||
FFO per basic and diluted share | $ | 0.15 | $ | 0.15 | $ | 0.15 | $ | (0.01 | ) | $ | 0.02 | ||||||||
MFFO per basic and diluted share | $ | 0.17 | $ | 0.17 | $ | 0.17 | $ | 0.11 | $ | 0.13 | |||||||||
AFFO per basic and diluted share | $ | 0.15 | $ | 0.15 | $ | 0.14 | $ | 0.09 | $ | 0.10 | |||||||||
1. See the Definitions section beginning on page 20 for a description of the Company’s non-GAAP measures. | ||||
COLE CORPORATE INCOME TRUST, INC. (CCIT) | WWW.COLECAPITAL.COM | 7
| Q3 2014 SUPPLEMENTAL INFORMATION |
EBITDA and Ratio Analysis | |||||||||||||||||||
(dollars in thousands) | |||||||||||||||||||
Q3 2014 | Q2 2014 | Q1 2014 | Q4 2013 | Q3 2013 | |||||||||||||||
EBITDA1 | |||||||||||||||||||
Net income (loss) attributable to the Company | $ | 8,393 | $ | 8,482 | $ | 9,866 | $ | (16,889 | ) | $ | (7,713 | ) | |||||||
Acquisition and merger-related expenses | 4,401 | 4,644 | 2,410 | 24,383 | 11,754 | ||||||||||||||
Depreciation and amortization | 21,546 | 20,615 | 19,856 | 14,146 | 9,882 | ||||||||||||||
Interest expense | 7,423 | 6,844 | 6,524 | 5,109 | 3,113 | ||||||||||||||
EBITDA | $ | 41,763 | $ | 40,585 | $ | 38,656 | $ | 26,749 | $ | 17,036 | |||||||||
INTEREST COVERAGE RATIO | |||||||||||||||||||
Interest expense | $ | 7,423 | $ | 6,844 | $ | 6,524 | $ | 5,109 | $ | 3,113 | |||||||||
EBITDA | 41,763 | 40,585 | 38,656 | 26,749 | 17,036 | ||||||||||||||
Interest coverage ratio | 5.6 x | 5.9 x | 5.9 x | 5.2 x | 5.5 x | ||||||||||||||
FIXED CHARGE COVERAGE RATIO | |||||||||||||||||||
Total interest | $ | 7,423 | $ | 6,844 | $ | 6,524 | $ | 5,109 | $ | 3,113 | |||||||||
Secured debt principal amortization | — | — | — | — | — | ||||||||||||||
Total fixed charges | 7,423 | 6,844 | 6,524 | 5,109 | 3,113 | ||||||||||||||
EBITDA | 41,763 | 40,585 | 38,656 | 26,749 | 17,036 | ||||||||||||||
Fixed charge coverage ratio | 5.6 x | 5.9 x | 5.9 x | 5.2 x | 5.5 x | ||||||||||||||
NET DEBT TO EBITDA RATIO | |||||||||||||||||||
Total debt | $ | 1,012,616 | $ | 945,616 | $ | 796,616 | $ | 752,616 | $ | 196,760 | |||||||||
Less: cash and cash equivalents | (29,057 | ) | (18,206 | ) | (17,985 | ) | (64,073 | ) | (258,401 | ) | |||||||||
Net debt | 983,559 | 927,410 | 778,631 | 688,543 | (61,641 | ) | |||||||||||||
EBITDA annualized | 167,052 | 162,340 | 154,624 | 106,996 | 68,144 | ||||||||||||||
Net debt to EBITDA ratio | 5.9 x | 5.7 x | 5.0 x | 6.4 x | 0.0 x | ||||||||||||||
NET TOTAL CONSOLIDATED LEVERAGE RATIO | |||||||||||||||||||
Net debt | $ | 983,559 | $ | 927,410 | $ | 778,631 | $ | 688,543 | $ | (61,641 | ) | ||||||||
Real estate assets, gross | 2,663,728 | 2,602,698 | 2,444,100 | 2,346,071 | 1,397,684 | ||||||||||||||
Net debt leverage ratio | 36.9 | % | 35.6 | % | 31.9 | % | 29.3 | % | — | % | |||||||||
GROSS TOTAL CONSOLIDATED LEVERAGE RATIO | |||||||||||||||||||
Total debt | $ | 1,012,616 | $ | 945,616 | $ | 796,616 | $ | 752,616 | $ | 196,760 | |||||||||
Real estate assets, gross | 2,663,728 | 2,602,698 | 2,444,100 | 2,346,071 | 1,397,684 | ||||||||||||||
Total debt leverage ratio | 38.0% | 36.3 | % | 32.6 | % | 32.1 | % | 14.1 | % | ||||||||||
UNENCUMBERED ASSETS/TOTAL ASSETS | |||||||||||||||||||
Unencumbered real estate assets, gross | $ | 2,108,333 | $ | 2,045,636 | $ | 1,887,036 | $ | 1,790,715 | $ | 1,019,884 | |||||||||
Real estate assets, gross | 2,663,728 | 2,602,698 | 2,444,100 | 2,346,071 | 1,397,684 | ||||||||||||||
Unencumbered assets/total assets | 79.1 | % | 78.6 | % | 77.2 | % | 76.3 | % | 73 | % | |||||||||
1.See the Definitions section beginning on page 20 for a description of the Company's non-GAAP measures. | ||||
COLE CORPORATE INCOME TRUST, INC. (CCIT) | WWW.COLECAPITAL.COM | 8
| Q3 2014 SUPPLEMENTAL INFORMATION |
Net Operating Income by Property Type | |||||||||||||||||||
(in thousands) | |||||||||||||||||||
Q3 2014 | Q2 2014 | Q1 2014 | Q4 2013 | Q3 2013 | |||||||||||||||
REVENUES | |||||||||||||||||||
Office | $ | 46,301 | $ | 44,896 | $ | 41,910 | $ | 30,219 | $ | 19,504 | |||||||||
Industrial | 12,470 | 11,701 | 11,568 | 8,899 | 6,085 | ||||||||||||||
Total revenue | $ | 58,771 | $ | 56,597 | $ | 53,478 | $ | 39,118 | $ | 25,589 | |||||||||
PROPERTY OPERATING EXPENSES | |||||||||||||||||||
Office | $ | 9,158 | $ | 8,385 | $ | 7,590 | $ | 6,317 | $ | 4,364 | |||||||||
Industrial | 803 | 814 | 969 | 639 | 77 | ||||||||||||||
Total property operating expenses | $ | 9,961 | $ | 9,199 | $ | 8,559 | $ | 6,956 | $ | 4,441 | |||||||||
NOI1 | |||||||||||||||||||
Office | $ | 37,143 | $ | 36,511 | $ | 34,320 | $ | 23,902 | $ | 15,140 | |||||||||
Industrial | 11,667 | 10,887 | 10,599 | 8,260 | 6,008 | ||||||||||||||
Total NOI | $ | 48,810 | $ | 47,398 | $ | 44,919 | $ | 32,162 | $ | 21,148 | |||||||||
1.See the Definitions section beginning on page 20 for a description of the Company's non-GAAP measures and page 21 for GAAP reconciliation. | ||||
COLE CORPORATE INCOME TRUST, INC. (CCIT) | WWW.COLECAPITAL.COM | 9
| Q3 2014 SUPPLEMENTAL INFORMATION |
Debt Summary | |||||||||||||
(dollars in thousands) | |||||||||||||
Weighted | Weighted | ||||||||||||
Minimum | Maximum | Average | Average Years | Debt | |||||||||
Interest Rate | Interest Rate | Interest Rate | to Maturity | Balance1 | |||||||||
Fixed rate debt | 3.55% | 4.85% | 3.87% | 7.3 | $ | 257,511 | |||||||
Variable rate debt | 1m LIBOR + 1.40% | 1m LIBOR + 1.40% | 1.59% | 2.2 | 40,233 | ||||||||
Unsecured credit facility - term loan | 3.03% | 3.03% | 3.03% | 4.1 | 300,000 | ||||||||
Unsecured credit facility - revolving line of credit | 1m LIBOR + 1.60% | 1m LIBOR + 2.40% | 1.75% | 3.1 | 415,000 | ||||||||
Total | $ | 1,012,744 | |||||||||||
Debt Detail | |||||||||||||
(dollars in thousands) | |||||||||||||
Property | Contractual | Years to | Debt | ||||||||||
Purchase Price | Maturity Date | Maturity | Interest Rate | Balance1 | |||||||||
VARIABLE RATE DEBT | |||||||||||||
Primerica GA - Duluth | $ | 73,150 | 12/19/2016 | 2.2 | 1.6% | $ | 40,234 | ||||||
FIXED RATE DEBT | |||||||||||||
Dr.Pepper/Snapple IL - Harvey | 3,896 | 6/1/2019 | 4.6 | 4.5% | 2,000 | ||||||||
Safelite AutoGlass OH - Columbus | 4,700 | 6/1/2019 | 4.6 | 4.5% | 2,400 | ||||||||
Hillshire Brands-HQ IL - Chicago | 97,500 | 6/1/2023 | 8.7 | 3.7% | 50,000 | ||||||||
Amazon VA - Chesterfield | 81,250 | 11/1/2020 | 6.1 | 4.0% | 48,750 | ||||||||
F5 Networks WA - Seattle | 142,500 | 5/1/2023 | 8.6 | 3.6% | 71,000 | ||||||||
Toro DC IA - Ankeny | 22,470 | 7/19/2020 | 5.8 | 3.9% | 12,360 | ||||||||
Mini-Med Medtronic TX - San Antonio | 32,850 | 7/1/2016 | 1.8 | 4.7% | 18,000 | ||||||||
Allergan/SkinMedica CA - Carlsbad | 23,500 | 10/1/2022 | 7.5 | 4.9% | 12,000 | ||||||||
PNC Bank PA - Philadelphia | 74,650 | 8/3/2020 | 5.8 | 4.2% | 41,000 | ||||||||
CREDIT FACILITY - UNSECURED | |||||||||||||
Unsecured credit facility - term loan | 1,380,853 | 10/25/2018 | 4.1 | 3.0% | 300,000 | ||||||||
Unsecured credit facility - revolving line of credit | – | 10/25/2017 | 3.1 | 1.75% | 415,000 | ||||||||
Total | $ | 1,937,319 | 4.3 | 2.2% | $ | 1,012,744 | |||||||
Debt Maturity Schedule | |||||||||||||
(dollars in thousands) | |||||||||||||
 | |||||
1. The debt balance reflects the face amount of notes payable. As of September 30, 2014, the fair value adjustment, net of amortization, of mortgage notes assumed was $127,000. | ||||
COLE CORPORATE INCOME TRUST, INC. (CCIT) | WWW.COLECAPITAL.COM | 10
| Q3 2014 SUPPLEMENTAL INFORMATION |
Portfolio Composition by Tenant | |||||||||||||||||
(dollars in thousands, sorted by rental revenue) | |||||||||||||||||
% of Total | Annualized | % of Total | % of Total | ||||||||||||||
Purchase | Purchase | Straight Line | Rental | Square | Square | # of | Credit | ||||||||||
Tenant | Price | Price | Rental Revenue1 | Revenue | Feet | Feet | Leases | Rating1 | |||||||||
Amazon | $ | 213,553 | 8.0 | % | $ | 14,272 | 7.2 | % | 3,048,672 | 16.7 | % | 3 | S&P: AA- | ||||
Tesoro | 194,318 | 7.2 | % | 13,717 | 6.9 | % | 618,017 | 3.4 | % | 1 | S&P: BB+ | ||||||
F5 | 142,500 | 5.3 | % | 9,814 | 4.9 | % | 299,643 | 1.6 | % | 2 | Not Rated | ||||||
Noble Energy | 114,750 | 4.3 | % | 7,871 | 4.0 | % | 497,477 | 2.7 | % | 1 | S&P: BBB | ||||||
FedEx | 94,849 | 3.5 | % | 6,872 | 3.5 | % | 794,674 | 4.4 | % | 14 | S&P: BBB | ||||||
Hillshire Brands Company | 97,500 | 3.6 | % | 6,221 | 3.1 | % | 233,869 | 1.3 | % | 1 | S&P: BBB | ||||||
Allstate Insurance | 85,143 | 3.2 | % | 5,949 | 3.0 | % | 458,338 | 2.5 | % | 1 | S&P: A- | ||||||
Church & Dwight Co. | 86,500 | 3.2 | % | 5,752 | 2.9 | % | 250,086 | 1.4 | % | 1 | S&P: BBB+ | ||||||
PNC Bank | 74,650 | 2.8 | % | 5,555 | 2.8 | % | 441,000 | 2.4 | % | 1 | S&P: A | ||||||
Restoration Hardware | 74,100 | 2.8 | % | 5,285 | 2.7 | % | 1,194,744 | 6.5 | % | 1 | Not Rated | ||||||
Top 10 Tenants Sub-Total | $ | 1,177,863 | 43.9 | % | $ | 81,308 | 41.0 | % | 7,836,520 | 42.9 | % | 26 | |||||
Sanofi US | $ | 72,315 | 2.7 | % | $ | 5,119 | 2.6 | % | 205,439 | 1.1 | % | 1 | S&P: AA | ||||
Primerica | 73,150 | 2.7 | % | 5,035 | 2.5 | % | 344,476 | 1.9 | % | 1 | S&P: A- | ||||||
ServiceNow | 63,278 | 2.4 | % | 4,626 | 2.3 | % | 148,866 | 0.8 | % | 2 | Not Rated | ||||||
Compass Group USA | 33,652 | 1.3 | % | 4,131 | 2.1 | % | 226,657 | 1.2 | % | 2 | Not Rated | ||||||
American Tire Distributors | 46,574 | 1.7 | % | 4,058 | 2.0 | % | 693,880 | 3.8 | % | 5 | S&P: B | ||||||
BJ's Wholesale Club | 48,673 | 1.8 | % | 3,922 | 2.0 | % | 633,836 | 3.5 | % | 1 | S&P: B- | ||||||
Evonik | 32,352 | 1.2 | % | 3,903 | 2.0 | % | 150,500 | 0.8 | % | 1 | Not Rated | ||||||
CSG International | 45,300 | 1.7 | % | 3,900 | 2.0 | % | 202,566 | 1.1 | % | 1 | S&P: BB | ||||||
Express Scripts | 51,267 | 1.9 | % | 3,896 | 2.0 | % | 219,644 | 1.2 | % | 1 | S&P: BBB+ | ||||||
Arris Enterprises Inc. | 46,587 | 1.8 | % | 3,674 | 1.8 | % | 131,680 | 0.7 | % | 1 | S&P: BB- | ||||||
Men's Wearhouse | 51,250 | 1.9 | % | 3,638 | 1.8 | % | 206,362 | 1.1 | % | 1 | Not Rated | ||||||
Advance Bionics | 44,000 | 1.6 | % | 3,477 | 1.7 | % | 146,385 | 0.8 | % | 1 | Not Rated | ||||||
Magellan Health | 45,800 | 1.7 | % | 3,454 | 1.7 | % | 232,521 | 1.3 | % | 1 | S&P: BBB- | ||||||
DuPont Pioneer | 44,685 | 1.7 | % | 3,222 | 1.6 | % | 198,554 | 1.1 | % | 1 | S&P: A | ||||||
Red Hat | 44,700 | 1.7 | % | 3,180 | 1.6 | % | 175,000 | 1.0 | % | 1 | S&P: BBB | ||||||
Energizer Holdings/Exel | 43,250 | 1.6 | % | 3,025 | 1.5 | % | 945,023 | 5.2 | % | 1 | S&P: BBB- | ||||||
AT&T | 40,017 | 1.5 | % | 2,875 | 1.4 | % | 425,224 | 2.3 | % | 2 | S&P: A- | ||||||
MiniMed | 32,850 | 1.2 | % | 2,755 | 1.4 | % | 145,025 | 0.8 | % | 1 | S&P: AA- | ||||||
Avnet | 36,180 | 1.4 | % | 2,629 | 1.3 | % | 581,678 | 3.3 | % | 1 | S&P: BBB- | ||||||
United Launch Alliance | 32,550 | 1.2 | % | 2,486 | 1.3 | % | 167,917 | 0.9 | % | 1 | Not Rated | ||||||
Acxiom Corporation | 36,125 | 1.4 | % | 2,464 | 1.2 | % | 62,721 | 0.3 | % | 1 | S&P: BB | ||||||
Lattice Semiconductor | 33,000 | 1.2 | % | 2,446 | 1.2 | % | 98,874 | 0.5 | % | 1 | Not Rated | ||||||
Duke University Health System | 32,700 | 1.2 | % | 2,418 | 1.2 | % | 126,225 | 0.7 | % | 1 | S&P: AA | ||||||
General Mills | 26,260 | 1.0 | % | 2,179 | 1.1 | % | 158,497 | 0.9 | % | 1 | S&P: BBB+ | ||||||
Secret Service | 29,700 | 1.1 | % | 2,164 | 1.1 | % | 78,634 | 0.4 | % | 1 | S&P: AA+ | ||||||
TGS-NOPEC | 29,937 | 1.1 | % | 2,148 | 1.1 | % | 97,295 | 0.5 | % | 1 | Not Rated | ||||||
McKesson Corporation | 27,700 | 1.0 | % | 1,866 | 0.9 | % | 450,163 | 2.5 | % | 1 | S&P: BBB+ | ||||||
Elizabeth Arden | 23,500 | 0.9 | % | 1,840 | 0.9 | % | 399,182 | 2.2 | % | 1 | S&P: BB- | ||||||
SkinMedica | 23,500 | 0.9 | % | 1,767 | 0.9 | % | 81,712 | 0.4 | % | 1 | S&P: A+ | ||||||
DeVry University | 23,030 | 0.9 | % | 1,719 | 0.9 | % | 122,646 | 0.7 | % | 1 | Not Rated | ||||||
Harvard Vanguard | 24,366 | 0.9 | % | 1,710 | 0.9 | % | 49,250 | 0.3 | % | 1 | Not Rated | ||||||
Toro | 22,470 | 0.9 | % | 1,593 | 0.8 | % | 450,139 | 2.5 | % | 1 | S&P: BBB | ||||||
Orchard Supply | 18,700 | 0.7 | % | 1,590 | 0.8 | % | 75,621 | 0.4 | % | 1 | Not Rated | ||||||
AON | 22,572 | 0.8 | % | 1,574 | 0.8 | % | 222,717 | 1.2 | % | 1 | S&P: A- | ||||||
Caremark | 18,880 | 0.7 | % | 1,387 | 0.7 | % | 99,734 | 0.5 | % | 1 | S&P: BBB+ | ||||||
HCA Patient Account Services | 15,483 | 0.6 | % | 1,371 | 0.7 | % | 94,137 | 0.5 | % | 1 | S&P: B+ | ||||||
1. See the Definitions section beginning on page 20. | ||||
COLE CORPORATE INCOME TRUST, INC. (CCIT) | WWW.COLECAPITAL.COM | 11
| Q3 2014 SUPPLEMENTAL INFORMATION |
Portfolio Composition by Tenant (cont.) | |||||||||||||||||
(dollars in thousands, sorted by rental revenue) | |||||||||||||||||
% of Total | Annualized | % of Total | % of Total | ||||||||||||||
Purchase | Purchase | Straight Line | Rental | Square | Square | # of | Credit | ||||||||||
Tenant | Price | Price | Rental Revenue1 | Revenue | Feet | Feet | Leases | Rating1 | |||||||||
Boise Paper Holdings | $ | 18,390 | 0.7 | % | $ | 1,328 | 0.7 | % | 393,971 | 2.2 | % | 1 | S&P: BB | ||||
Trex | 16,100 | 0.6 | % | 1,261 | 0.6 | % | 337,500 | 1.8 | % | 1 | Not Rated | ||||||
C.R. Bard | 14,420 | 0.5 | % | 1,183 | 0.6 | % | 82,257 | 0.5 | % | 1 | S&P: A | ||||||
HD Supply | 11,250 | 0.4 | % | 1,060 | 0.5 | % | 62,812 | 0.3 | % | 1 | S&P: B | ||||||
L-3 Communications | 14,050 | 0.5 | % | 1,028 | 0.5 | % | 182,630 | 1.0 | % | 1 | S&P: BBB- | ||||||
Lonza America, Inc. | 9,315 | 0.3 | % | 1,019 | 0.5 | % | 63,659 | 0.3 | % | 1 | Not Rated | ||||||
Beltone | 12,750 | 0.5 | % | 932 | 0.5 | % | 48,911 | 0.3 | % | 1 | Not Rated | ||||||
Holy Spirit Hospital | 11,650 | 0.4 | % | 905 | 0.5 | % | 30,408 | 0.2 | % | 1 | S&P: BBB+ | ||||||
Lend Lease | 5,927 | 0.2 | % | 889 | 0.4 | % | 39,921 | 0.2 | % | 1 | Not Rated | ||||||
Honeywell | 10,400 | 0.4 | % | 754 | 0.4 | % | 60,044 | 0.3 | % | 1 | S&P: A | ||||||
Fresenius Medical Care | 8,472 | 0.3 | % | 730 | 0.4 | % | 40,575 | 0.2 | % | 6 | S&P: BB+ | ||||||
Bestronics | 8,000 | 0.3 | % | 615 | 0.3 | % | 71,750 | 0.4 | % | 1 | Not Rated | ||||||
PPG | 4,435 | 0.2 | % | 469 | 0.2 | % | 30,304 | 0.2 | % | 1 | Not Rated | ||||||
Safelite AutoGlass | 4,700 | 0.2 | % | 432 | 0.2 | % | 41,792 | 0.2 | % | 1 | Not Rated | ||||||
United States Postal Service | 2,592 | 0.1 | % | 419 | 0.2 | % | 17,461 | 0.1 | % | 1 | Not Rated | ||||||
Texas Health Presbyterian | 5,500 | 0.2 | % | 418 | 0.2 | % | 16,605 | 0.1 | % | 1 | Not Rated | ||||||
Stantec | 3,500 | 0.1 | % | 316 | 0.2 | % | 19,001 | 0.1 | % | 1 | Not Rated | ||||||
Dr. Pepper/Snapple | 3,896 | 0.1 | % | 304 | 0.2 | % | 40,410 | 0.2 | % | 1 | S&P: BBB+ | ||||||
Davita Dialysis | 2,047 | 0.1 | % | 165 | 0.1 | % | 6,849 | 0.1 | % | 1 | Not Rated | ||||||
Total | $ | 2,681,609 | 100 | % | $ | 198,779 | 100 | % | 18,272,160 | 100 | % | 93 | |||||
Tenant Composition as a % of Total Rental | Tenant Investment Grade Rating Composition | ||||
Revenue | as a % of Total Revenue | ||||
 |  | ||||
1. See the Definitions section beginning on page 20. | |||||
COLE CORPORATE INCOME TRUST, INC. (CCIT) | WWW.COLECAPITAL.COM | 12
| Q3 2014 SUPPLEMENTAL INFORMATION |
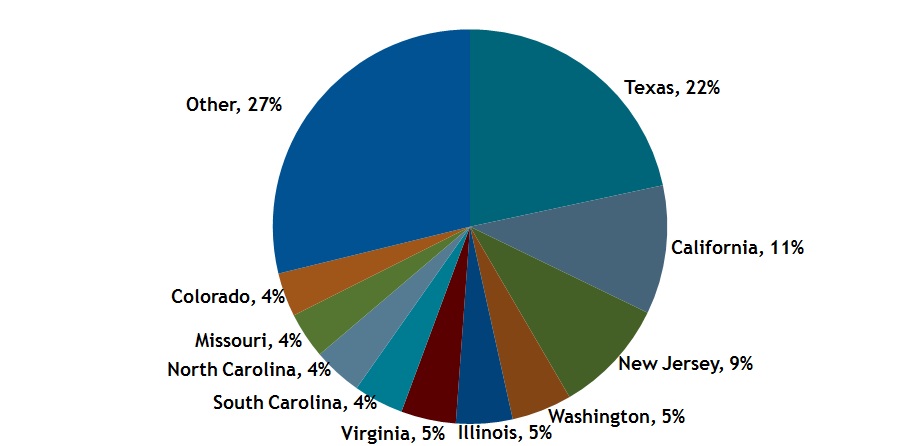
Portfolio Composition by State | ||||||||||||||
(dollars in thousands, sorted by rental revenue) | ||||||||||||||
% of Total | Annualized | % of Total | % of Total | |||||||||||
Purchase | Purchase | Straight Line | Rental | Square | Square | |||||||||
State | Price | Price | Rental Revenue1 | Revenue | Feet | Feet | ||||||||
Texas | $ | 596,594 | 22.2 | % | $ | 42,995 | 21.6 | % | 2,810,771 | 15.4 | % | |||
California | 276,689 | 10.3 | % | 20,976 | 10.6 | % | 836,610 | 4.6 | % | |||||
New Jersey | 239,840 | 8.9 | % | 18,697 | 9.4 | % | 1,239,861 | 6.8 | % | |||||
Washington | 142,500 | 5.3 | % | 9,814 | 4.9 | % | 299,643 | 1.6 | % | |||||
Illinois | 139,018 | 5.2 | % | 9,204 | 4.6 | % | 584,267 | 3.2 | % | |||||
Virginia | 132,450 | 4.9 | % | 8,943 | 4.5 | % | 1,865,626 | 10.2 | % | |||||
South Carolina | 116,903 | 4.4 | % | 8,149 | 4.1 | % | 2,021,177 | 11.1 | % | |||||
North Carolina | 77,021 | 2.9 | % | 8,036 | 4.0 | % | 442,863 | 2.4 | % | |||||
Missouri | 99,426 | 3.7 | % | 7,522 | 3.8 | % | 468,262 | 2.6 | % | |||||
Colorado | 95,701 | 3.6 | % | 7,151 | 3.6 | % | 896,955 | 4.9 | % | |||||
Top 10 States Sub-Total | $ | 1,916,143 | 71.4 | % | $ | 141,487 | 71.1 | % | 11,466,035 | 62.8 | % | |||
Georgia | $ | 86,900 | 3.2 | % | $ | 6,523 | 3.3 | % | 438,439 | 2.4 | % | |||
Pennsylvania | 86,300 | 3.2 | % | 6,460 | 3.2 | % | 471,408 | 2.6 | % | |||||
Maryland | 74,100 | 2.8 | % | 5,285 | 2.7 | % | 1,194,744 | 6.5 | % | |||||
Massachusetts | 69,066 | 2.6 | % | 4,890 | 2.5 | % | 224,250 | 1.2 | % | |||||
Nebraska | 56,300 | 2.1 | % | 4,849 | 2.4 | % | 396,326 | 2.2 | % | |||||
Iowa | 67,155 | 2.5 | % | 4,814 | 2.4 | % | 648,693 | 3.6 | % | |||||
Tennessee | 69,050 | 2.6 | % | 4,666 | 2.3 | % | 1,016,281 | 5.6 | % | |||||
Ohio | 60,665 | 2.3 | % | 4,628 | 2.4 | % | 867,616 | 4.7 | % | |||||
Arizona | 56,330 | 2.1 | % | 4,289 | 2.2 | % | 304,637 | 1.7 | % | |||||
Michigan | 26,260 | 0.9 | % | 2,179 | 1.1 | % | 158,497 | 0.9 | % | |||||
Florida | 29,700 | 1.1 | % | 2,164 | 1.1 | % | 78,634 | 0.4 | % | |||||
Louisiana | 24,477 | 0.9 | % | 2,059 | 1.0 | % | 225,910 | 1.2 | % | |||||
Nevada | 16,100 | 0.6 | % | 1,261 | 0.6 | % | 337,500 | 1.8 | % | |||||
Utah | 12,750 | 0.5 | % | 906 | 0.5 | % | 150,300 | 0.8 | % | |||||
New York | 9,639 | 0.4 | % | 835 | 0.4 | % | 125,000 | 0.7 | % | |||||
Arkansas | 5,888 | 0.2 | % | 421 | 0.2 | % | 64,211 | 0.4 | % | |||||
Idaho | 5,170 | 0.2 | % | 370 | 0.2 | % | 33,394 | 0.2 | % | |||||
North Dakota | 4,308 | 0.2 | % | 310 | 0.2 | % | 24,310 | 0.1 | % | |||||
Oklahoma | 2,800 | 0.1 | % | 200 | 0.1 | % | 24,313 | 0.1 | % | |||||
Minnesota | 2,508 | 0.1 | % | 183 | 0.1 | % | 21,662 | 0.1 | % | |||||
Totals | $ | 2,681,609 | 100.0 | % | $ | 198,779 | 100.0 | % | 18,272,160 | 100.0 | % | |||
Portfolio Composition by State | |||||
as % of Total Revenue | |||||
 | |||||
1. See the Definitions section beginning on page 20. | |||||
COLE CORPORATE INCOME TRUST, INC. (CCIT) | WWW.COLECAPITAL.COM | 13
| Q3 2014 SUPPLEMENTAL INFORMATION |
Portfolio Composition by Tenant Industry | ||||||||||||||||
(dollars in thousands, sorted by rental revenue) | ||||||||||||||||
% of Total | Annualized | % of Total | ||||||||||||||
Purchase | Purchase | Straight Line | Rental | Square | % of Total | # of | ||||||||||
Tenant Industry | Price | Price | Rental Revenue1 | Revenue | Feet | Square Feet | Leases | |||||||||
Manufacturing | $ | 427,575 | 15.9 | % | $ | 32,316 | 16.3 | % | 2,412,424 | 13.2 | % | 11 | ||||
Healthcare | 401,748 | 15.0 | % | 30,677 | 15.4 | % | 1,919,855 | 10.5 | % | 23 | ||||||
Mining and natural resources | 339,004 | 12.6 | % | 23,737 | 11.9 | % | 1,212,789 | 6.6 | % | 3 | ||||||
Technology | 264,204 | 9.9 | % | 18,631 | 9.4 | % | 805,458 | 4.4 | % | 5 | ||||||
Retail - Wholesale | 236,023 | 8.8 | % | 15,865 | 8.0 | % | 3,498,811 | 19.1 | % | 4 | ||||||
Professional services - Other | 155,399 | 5.8 | % | 13,905 | 7.0 | % | 846,014 | 4.6 | % | 9 | ||||||
Professional services - Financial | 147,800 | 5.5 | % | 10,590 | 5.3 | % | 785,476 | 4.3 | % | 2 | ||||||
Shipping/delivery/warehousing | 109,995 | 4.1 | % | 8,236 | 4.1 | % | 897,896 | 4.9 | % | 16 | ||||||
Professional services - Insurance | 85,143 | 3.2 | % | 5,949 | 3.0 | % | 458,338 | 2.5 | % | 1 | ||||||
Retail - Home furnishings | 74,100 | 2.8 | % | 5,285 | 2.7 | % | 1,194,744 | 6.5 | % | 1 | ||||||
Retail - Vehicle sales/parts/svc | 51,274 | 1.9 | % | 4,490 | 2.3 | % | 735,672 | 4.0 | % | 6 | ||||||
Retail - Warehouse clubs | 48,673 | 1.8 | % | 3,922 | 2.0 | % | 633,836 | 3.5 | % | 1 | ||||||
Retail - Drugstores and pharmacies | 51,267 | 1.9 | % | 3,896 | 2.0 | % | 219,644 | 1.2 | % | 1 | ||||||
Retail - Clothing and accessories | 51,250 | 1.9 | % | 3,638 | 1.8 | % | 206,362 | 1.1 | % | 1 | ||||||
Agriculture | 44,685 | 1.7 | % | 3,222 | 1.6 | % | 198,554 | 1.1 | % | 1 | ||||||
Retail - Specialty | 43,250 | 1.6 | % | 3,025 | 1.5 | % | 945,023 | 5.2 | % | 1 | ||||||
Information and communications | 40,017 | 1.5 | % | 2,874 | 1.4 | % | 425,224 | 2.3 | % | 2 | ||||||
Retail - Electronics | 36,180 | 1.3 | % | 2,629 | 1.3 | % | 581,678 | 3.2 | % | 1 | ||||||
Government and non-profit | 32,292 | 1.2 | % | 2,583 | 1.3 | % | 96,095 | 0.5 | % | 2 | ||||||
Education | 23,030 | 0.9 | % | 1,719 | 0.9 | % | 122,646 | 0.7 | % | 1 | ||||||
Retail - Home improvement/garden | 18,700 | 0.7 | % | 1,590 | 0.8 | % | 75,621 | 0.4 | % | 1 | ||||||
Total | $ | 2,681,609 | 100.0% | $ | 198,779 | 100.0% | 18,272,160 | 100% | 93 | |||||||
Tenant Industry as a % of Total Rental Revenue | |||||
 | |||||
1. See the Definitions section beginning on page 20. | |||||
COLE CORPORATE INCOME TRUST, INC. (CCIT) | WWW.COLECAPITAL.COM | 14
| Q3 2014 SUPPLEMENTAL INFORMATION |
Lease Expiration Schedule | ||||||||||||||||||||||||||||||||||||
(dollars in thousands) | ||||||||||||||||||||||||||||||||||||
Expiration Year | ||||||||||||||||||||||||||||||||||||
Total | 2014 | 2015 | 2016 | 2017 | 2018 | 2019 | 2020 | 2021 | 2022 | 2023 | Thereafter | |||||||||||||||||||||||||
OFFICE | ||||||||||||||||||||||||||||||||||||
Number of leases | 59 | 1 | 1 | 1 | 1 | 1 | 2 | 1 | — | 11 | 6 | 34 | ||||||||||||||||||||||||
Annualized rental income | $ | 147,898 | $ | 16 | $ | 469 | $ | 419 | $ | 889 | $ | 1,387 | $ | 1,798 | $ | 2,755 | $ | — | $ | 15,571 | $ | 9,701 | $ | 114,892 | ||||||||||||
INDUSTRIAL | ||||||||||||||||||||||||||||||||||||
Number of leases | 34 | — | — | — | — | — | 1 | 2 | — | 6 | 12 | 13 | ||||||||||||||||||||||||
Annualized rental income | $ | 50,881 | $ | — | $ | — | $ | — | $ | — | $ | — | $ | 180 | $ | 1,839 | $ | — | $ | 3,584 | $ | 9,249 | $ | 36,029 | ||||||||||||
TOTAL NUMBER OF LEASES | 93 | 1 | 1 | 1 | 1 | 1 | 3 | 3 | — | 17 | 18 | 47 | ||||||||||||||||||||||||
TOTAL RENTAL INCOME | $ | 198,779 | $ | 16 | $ | 469 | $ | 419 | $ | 889 | $ | 1,387 | $ | 1,978 | $ | 4,594 | $ | — | $ | 19,155 | $ | 18,950 | $ | 150,921 | ||||||||||||
% of Total | 100.0% | 0.0% | 0.2% | 0.2 | % | 0.5 | % | 0.7 | % | 1.0 | % | 2.4 | % | — | % | 9.6 | % | 9.5 | % | 75.9 | % | |||||||||||||||
Cumulative Total | 0.0% | 0.2% | 0.4 | % | 0.9 | % | 1.6 | % | 2.6 | % | 5.0 | % | 5.0 | % | 14.6 | % | 24.1 | % | 100 | % | ||||||||||||||||
Lease Expiration Schedule as a % of Total Rental | |||||
Revenue | |||||
 | |||||
COLE CORPORATE INCOME TRUST, INC. (CCIT) | WWW.COLECAPITAL.COM | 15
| Q3 2014 SUPPLEMENTAL INFORMATION |
Portfolio Composition by Property Type | ||||||||||||||||||
(dollars in thousands, sorted by acquisition date) | ||||||||||||||||||
Total | % of Total | Square Feet | Remaining | Annualized | ||||||||||||||
Property | Acquisition | Number of | Purchase | Purchase | Year | Lease Term | Straight Line | |||||||||||
Property Name | Type | State | Date | Properties | Price | Price | Occupancy | Built | (Years) | Rental Revenue1 | ||||||||
Office: | ||||||||||||||||||
MiniMed | Office | Texas | 6/30/2011 | 1 | $ | 32,850 | 1.2 | % | 145,025 | 100% | 2009 | 6.1 | $ | 2,755 | ||||
Safelite AutoGlass | Office | Ohio | 4/30/2012 | 1 | 4,700 | 0.2 | % | 41,792 | 100% | 1999 | 7.7 | 432 | ||||||
United Launch Alliance | Office | Colorado | 7/31/2012 | 1 | 32,550 | 1.2 | % | 167,917 | 100% | 2000 | 7.9 | 2,486 | ||||||
HCA Patient Account Services | Office | Texas | 9/27/2012 | 1 | 15,483 | 0.6 | % | 94,137 | 100% | 1999 | 7.4 | 1,371 | ||||||
Honeywell | Office | South Carolina | 11/30/2012 | 1 | 10,400 | 0.4 | % | 60,044 | 100% | 2007 | 8.0 | 754 | ||||||
Coliseum Centre | Office | North Carolina | 12/19/2012 | 1 | 42,171 | 1.6 | % | 284,039 | 100% | 1990 | 8.0 | 5,439 | ||||||
Fresenius Medical Care | Office | Louisiana | 1/18/2013 | 1 | 1,112 | — | % | 5,900 | 100% | 2001 | 8.3 | 96 | ||||||
Fresenius Medical Care | Office | Louisiana | 1/18/2013 | 1 | 1,008 | — | % | 6,083 | 100% | 2002 | 8.3 | 90 | ||||||
Fresenius Medical Care | Office | Louisiana | 1/18/2013 | 1 | 1,218 | — | % | 7,350 | 100% | 2005 | 8.3 | 103 | ||||||
Fresenius Medical Care | Office | Louisiana | 1/18/2013 | 1 | 1,536 | 0.1 | % | 8,000 | 100% | 2000 | 8.3 | 132 | ||||||
Fresenius Medical Care | Office | Louisiana | 1/18/2013 | 1 | 1,432 | 0.1 | % | 5,882 | 100% | 2000 | 8.3 | 124 | ||||||
Fresenius Medical Care | Office | Louisiana | 1/18/2013 | 1 | 2,167 | 0.1 | % | 7,360 | 100% | 2007 | 8.3 | 184 | ||||||
PNC Bank | Office | Pennsylvania | 3/13/2013 | 1 | 74,650 | 2.8 | % | 441,000 | 100% | 2000 | 10.3 | 5,555 | ||||||
F5 | Office | Washington | 4/8/2013 | 1 | 142,500 | 5.3 | % | 299,643 | 100% | 2000 | 7.8 | 9,814 | ||||||
Evonik | Office | New Jersey | 4/23/2013 | 1 | 32,352 | 1.2 | % | 150,500 | 100% | 1985 | 9.2 | 3,903 | ||||||
Sanofi US | Office | New Jersey | 4/26/2013 | 1 | 72,315 | 2.7 | % | 205,439 | 100% | 2011 | 11.8 | 5,119 | ||||||
Stantec | Office | California | 4/30/2013 | 1 | 3,500 | 0.1 | % | 19,001 | 100% | 1991 | 8.4 | 316 | ||||||
Hillshire Brands Company | Office | Illinois | 5/17/2013 | 1 | 97,500 | 3.6 | % | 233,869 | 100% | 1947 | 13.4 | 6,221 | ||||||
HD Supply | Office | Texas | 5/21/2013 | 1 | 11,250 | 0.4 | % | 62,812 | 100% | 2005 | 10.8 | 1,060 | ||||||
Harvard Vanguard | Office | Massachusetts | 6/12/2013 | 1 | 24,366 | 0.9 | % | 49,250 | 100% | 2013 | 15.8 | 1,710 | ||||||
Men's Wearhouse | Office | Texas | 6/24/2013 | 1 | 51,250 | 1.9 | % | 206,362 | 100% | 2006 | 12.9 | 3,638 | ||||||
Texas Health Presbyterian | Office | Texas | 6/27/2013 | 1 | 5,500 | 0.2 | % | 16,605 | 100% | 2013 | 8.8 | 418 | ||||||
Allstate Insurance | Office | Texas | 6/27/2013 | 1 | 85,143 | 3.2 | % | 458,338 | 100% | 1990 | 10.8 | 5,949 | ||||||
Duke University Health System | Office | North Carolina | 8/5/2013 | 1 | 32,700 | 1.2 | % | 126,225 | 100% | 2010 | 9.9 | 2,418 | ||||||
AT&T | Office | Texas | 8/8/2013 | 1 | 19,500 | 0.7 | % | 190,690 | 100% | 1998 | 10.9 | 1,401 | ||||||
Bestronics | Office | California | 9/10/2013 | 1 | 8,000 | 0.3 | % | 71,750 | 100% | 1996 | 4.4 | 615 | ||||||
Acxiom Corporation | Office | California | 9/10/2013 | 1 | 36,125 | 1.3 | % | 62,721 | 100% | 2008 | 11.2 | 2,464 | ||||||
Devry University | Office | Arizona | 9/10/2013 | 1 | 23,030 | 0.9 | % | 122,646 | 100% | 1983 | 9.7 | 1,719 | ||||||
Caremark | Office | Arizona | 9/10/2013 | 1 | 18,880 | 0.7 | % | 99,734 | 100% | 2000 | 4.3 | 1,387 | ||||||
C.R. Bard | Office | Arizona | 9/10/2013 | 1 | 14,420 | 0.5 | % | 82,257 | 100% | 1981 | 4.5 | 1,183 | ||||||
Orchard Supply | Office | California | 9/20/2013 | 1 | 18,700 | 0.7 | % | 75,621 | 100% | 1984 | 12.1 | 1,590 | ||||||
CSG International | Office | Nebraska | 9/30/2013 | 1 | 45,300 | 1.7 | % | 202,566 | 100% | 2012 | 10.0 | 3,900 | ||||||
Davita Dialysis | Office | Texas | 9/30/2013 | 1 | 2,047 | 0.1 | % | 6,849 | 100% | 1977 | 11.8 | 165 | ||||||
Noble Energy | Office | Texas | 10/11/2013 | 1 | 114,750 | 4.3 | % | 497,477 | 100% | 1998 | 13.6 | 7,871 | ||||||
FedEx | Office | Colorado | 11/1/2013 | 1 | 30,050 | 1.1 | % | 155,808 | 100% | 2001 | 10.1 | 2,156 | ||||||
TGS-NOPEC | Office | Texas | 11/1/2013 | 1 | 29,937 | 1.1 | % | 97,295 | 100% | 2013 | 11.0 | 2,148 | ||||||
Lattice Semiconductor | Office | California | 11/8/2013 | 1 | 33,000 | 1.2 | % | 98,874 | 100% | 1985 | 12.0 | 2,446 | ||||||
Beltone | Office | Illinois | 11/12/2013 | 1 | 12,750 | 0.6 | % | 48,911 | 100% | 2005 | 9.3 | 932 | ||||||
Magellan Health | Office | Missouri | 11/13/2013 | 1 | 45,800 | 1.8 | % | 232,521 | 100% | 2003 | 10.4 | 3,454 | ||||||
ServiceNow | Office | California | 11/15/2013 | 1 | 63,278 | 2.4 | % | 148,866 | 100% | 1982 | 9.6 | 4,626 | ||||||
Tesoro | Office | Texas | 12/9/2013 | 1 | 194,318 | 7.2 | % | 618,017 | 100% | 2008 | 14.7 | 13,717 | ||||||
SkinMedica | Office | California | 12/17/2013 | 1 | 23,500 | 0.9 | % | 81,712 | 100% | 1998 | 12.6 | 1,767 | ||||||
Primerica | Office | Georgia | 12/19/2013 | 1 | 73,150 | 2.7 | % | 344,476 | 100% | 2013 | 13.8 | 5,035 | ||||||
Holy Spirit Hospital | Office | Pennsylvania | 12/19/2013 | 1 | 11,650 | 0.4 | % | 30,408 | 100% | 2013 | 13.5 | 905 | ||||||
DuPont Pioneer | Office | Iowa | 12/19/2013 | 1 | 44,685 | 1.7 | % | 198,554 | 100% | 2011 | 12.3 | 3,222 | ||||||
Church & Dwight Co. | Office | New Jersey | 12/23/2013 | 1 | 86,500 | 3.2 | % | 250,086 | 100% | 2012 | 18.7 | 5,752 | ||||||
Red Hat | Office | Massachusetts | 12/26/2013 | 1 | 44,700 | 1.7 | % | 175,000 | 100% | 2008 | 10.7 | 3,180 | ||||||
Secret Service | Office | Florida | 1/10/2014 | 1 | 29,700 | 1.1 | % | 78,634 | 100% | 2003 | 10.3 | 2,164 | ||||||
Advance Bionics | Office | California | 1/15/2014 | 1 | 44,000 | 1.6 | % | 146,385 | 100% | 2008 | 10.1 | 3,477 | ||||||
Lonza America, Inc. | Office | Georgia | 2/25/2014 | 1 | 13,750 | 0.5 | % | 93,963 | 100% | 2001 | 11.1 | 1,488 | ||||||
AT&T | Office | Texas | 4/15/2014 | 1 | 20,517 | 0.8 | % | 234,534 | 100% | 1994 | 11.6 | 1,474 | ||||||
Arris Enterprises Inc. | Office | California | 5/30/2014 | 1 | 46,587 | 1.7 | % | 131,680 | 100% | 1981 | 9.8 | 3,674 | ||||||
Express Scripts | Office | Missouri | 6/30/2014 | 1 | 51,267 | 1.9 | % | 219,644 | 100% | 2014 | 9.7 | 3,896 | ||||||
Office Total / Weighted Average Remaining Lease Term | 53 | $ | 1,979,541 | 73.8 | % | 7,900,252 | 100% | 11.1 | $ | 147,898 | ||||||||
1. See the Definitions section beginning on page 20. | ||||||||||||||||||
COLE CORPORATE INCOME TRUST, INC. (CCIT) | WWW.COLECAPITAL.COM | 16
| Q3 2014 SUPPLEMENTAL INFORMATION |
Portfolio Summary by Property Type (cont.) | ||||||||||||||||||||
(dollars in thousands, sorted by acquisition date) | ||||||||||||||||||||
Total | % of Total | Remaining | Annualized | |||||||||||||||||
Property | Property | Acquisition | Number of | Purchase | Purchase | Square Feet | Year | Lease Term | Straight Line | |||||||||||
Name | Type | State | Date | Properties | Price | Price | Occupancy | Built | (Years) | Rental Revenue1 | ||||||||||
Industrial: | ||||||||||||||||||||
Dr. Pepper/Snapple | Industrial | Illinois | 4/5/2012 | 1 | $ | 3,896 | 0.1 | % | 40,410 | 100 | % | 2004 | 9.5 | $ | 304 | |||||
American Tire Distributors | Industrial | Colorado | 9/28/2012 | 1 | 8,311 | 0.3 | % | 125,060 | 100 | % | 2012 | 9.0 | 715 | |||||||
Elizabeth Arden | Industrial | Virginia | 11/9/2012 | 1 | 23,500 | 0.9 | % | 399,182 | 100 | % | 1991 | 9.3 | 1,840 | |||||||
Toro | Industrial | Iowa | 12/17/2012 | 1 | 22,470 | 0.8 | % | 450,139 | 100 | % | 2012 | 13.3 | 1,593 | |||||||
Amazon | Industrial | South Carolina | 12/17/2012 | 1 | 63,253 | 2.4 | % | 1,016,110 | 100 | % | 2012 | 13.0 | 4,370 | |||||||
AON | Industrial | Illinois | 12/21/2012 | 1 | 22,572 | 0.8 | % | 222,717 | 100 | % | 2000 | 8.3 | 1,574 | |||||||
FedEx | Industrial | Utah | 12/27/2012 | 1 | 12,750 | 0.5 | % | 150,300 | 100 | % | 2012 | 8.0 | 906 | |||||||
FedEx | Industrial | North Carolina | 3/12/2013 | 1 | 2,150 | 0.1 | % | 32,599 | 100 | % | 1987 | 5.2 | 180 | |||||||
FedEx | Industrial | Oklahoma | 4/5/2013 | 1 | 2,800 | 0.1 | % | 24,313 | 100 | % | 2012 | 7.9 | 200 | |||||||
FedEx | Industrial | Idaho | 5/20/2013 | 1 | 5,170 | 0.2 | % | 33,394 | 100 | % | 2006 | 8.0 | 370 | |||||||
FedEx | Industrial | Ohio | 5/20/2013 | 1 | 5,062 | 0.2 | % | 43,824 | 100 | % | 2006 | 8.0 | 362 | |||||||
FedEx | Industrial | Illinois | 6/10/2013 | 1 | 2,300 | 0.1 | % | 38,360 | 100 | % | 1996 | 8.8 | 173 | |||||||
FedEx | Industrial | Missouri | 7/2/2013 | 1 | 2,359 | 0.1 | % | 16,097 | 100 | % | 2012 | 7.8 | 172 | |||||||
FedEx | Industrial | Ohio | 7/3/2013 | 1 | 6,423 | 0.2 | % | 75,262 | 100 | % | 2013 | 8.4 | 462 | |||||||
FedEx | Industrial | Colorado | 7/30/2013 | 1 | 6,400 | 0.2 | % | 54,199 | 100 | % | 2013 | 8.7 | 465 | |||||||
BJ's Wholesale Club | Industrial | New Jersey | 7/30/2013 | 1 | 48,672 | 1.8 | % | 633,836 | 100 | % | 2001 | 18.9 | 3,922 | |||||||
Amazon | Industrial | Virginia | 7/31/2013 | 1 | 81,250 | 3.0 | % | 1,016,281 | 100 | % | 2012 | 13.0 | 5,236 | |||||||
Amazon | Industrial | Tennessee | 7/31/2013 | 1 | 69,050 | 2.6 | % | 1,016,281 | 100 | % | 2012 | 13.0 | 4,666 | |||||||
Trex | Industrial | Nevada | 8/16/2013 | 1 | 16,100 | 0.6 | % | 337,500 | 100 | % | 2007 | 10.7 | 1,261 | |||||||
FedEx | Industrial | North Dakota | 8/27/2013 | 1 | 4,308 | 0.2 | % | 24,310 | 100 | % | 2013 | 8.7 | 310 | |||||||
American Tire Distributors | Industrial | New York | 9/6/2013 | 1 | 9,639 | 0.4 | % | 125,000 | 100 | % | 2013 | 8.8 | 835 | |||||||
Boise Paper Holdings | Industrial | Colorado | 9/10/2013 | 1 | 18,390 | 0.7 | % | 393,971 | 100 | % | 1974 | 5.8 | 1,328 | |||||||
FedEx | Industrial | Minnesota | 9/16/2013 | 1 | 2,508 | 0.1 | % | 21,662 | 100 | % | 2013 | 8.7 | 183 | |||||||
L-3 Communications | Industrial | Texas | 11/25/2013 | 1 | 14,050 | 0.5 | % | 182,630 | 100 | % | 1988 | 8.9 | 1,028 | |||||||
FedEx | Industrial | Arkansas | 11/27/2013 | 1 | 5,888 | 0.2 | % | 64,211 | 100 | % | 2013 | 8.8 | 421 | |||||||
American Tire Distributors | Industrial | Nebraska | 12/12/2013 | 1 | 11,000 | 0.4 | % | 193,760 | 100 | % | 1971 | 8.8 | 949 | |||||||
Restoration Hardware | Industrial | Maryland | 12/18/2013 | 1 | 74,100 | 2.8 | % | 1,194,744 | 100 | % | 2008 | 13.4 | 5,285 | |||||||
McKesson Corporation | Industrial | Virginia | 12/18/2013 | 1 | 27,700 | 1.0 | % | 450,163 | 100 | % | 2013 | 8.7 | 1,866 | |||||||
American Tire Distributors | Industrial | Ohio | 12/20/2013 | 1 | 8,300 | 0.3 | % | 125,060 | 100 | % | 2013 | 10.3 | 740 | |||||||
FedEx | Industrial | Louisiana | 12/20/2013 | 1 | 6,680 | 0.2 | % | 60,335 | 100 | % | 2010 | 5.9 | 511 | |||||||
General Mills | Industrial | Michigan | 2/28/2014 | 1 | 26,260 | 1.1 | % | 158,497 | 100 | % | 2014 | 9.9 | 2,179 | |||||||
American Tire Distributors | Industrial | Louisiana | 3/31/2014 | 1 | 9,324 | 0.3 | % | 125,000 | 100 | % | 2014 | 9.4 | 818 | |||||||
Energizer Holdings/Exel | Industrial | South Carolina | 6/26/2014 | 1 | 43,250 | 1.6 | % | 945,023 | 100 | % | 2014 | 9.8 | 3,025 | |||||||
Avnet | Industrial | Ohio | 9/30/2014 | 1 | 36,180 | 1.4 | % | 581,678 | 100 | % | 2014 | 12.0 | 2,629 | |||||||
Industrial Total/Weighted Average Remaining Lease Term | 34 | $ | 702,068 | 26.2 | % | 10,371,908 | 100 | % | 11.6 | $ | 50,881 | |||||||||
Total/Weighted Average Remaining Lease Term | 87 | $ | 2,681,609 | 100 | % | 18,272,160 | 100 | % | 11.3 | $ | 198,779 | |||||||||
1. See the Definitions section beginning on page 20. | ||||||||||||||||||||
COLE CORPORATE INCOME TRUST, INC. (CCIT) | WWW.COLECAPITAL.COM | 17
| Q3 2014 SUPPLEMENTAL INFORMATION |
Top Tenant Descriptions |
AMAZON | |||||||||
Amazon.com, Inc. is a Seattle, Washington-based internet retailer that offers thousands of goods and services through an online marketplace. The company serves four customer buckets: consumers, sellers, enterprises, and content creators. Revenue is earned from vendor-purchased goods, services, and fees from third-party retailer sales. Service-based revenues are derived from Amazon Web Services, fulfillment, publishing, digital content subscriptions, advertising, and co-branded credit cards. | Acquisition Dates: | December-12 | |||||||
July-13 | |||||||||
Square Feet: | 3,048,672 | ||||||||
Percent of Total Rental Revenue: | 7.2 | % | |||||||
Tenant Credit Rating:1 | AA- | ||||||||
TESORO | |||||||||
Tesoro refines and markets petroleum products, and provides transporting services. The company operates refineries, as well as a network of retail and refueling stations in the western United States.Tesoro also markets gasoline and diesel fuel to independent marketers and commercial end users. Tesoro is a public company and trades on the New York Stock Exchange under the symbol 'TSO'. | Acquisition Date: | December-13 | |||||||
Square Feet: | 618,017 | ||||||||
Percent of Total Rental Revenue: | 6.9 | % | |||||||
Tenant Credit Rating:1 | BB+ | ||||||||
F5 NETWORKS | |||||||||
F5 Networks, Inc. provides application delivery networking technology that secures and optimizes the delivery of network-based applications. The company sells its products to enterprise customers and service providers through various channels, including distributors, value-added resellers, and system integrators. F5 Networks, Inc. was founded in 1996 and is headquartered in Seattle, Washington. | Acquisition Date: | April-13 | |||||||
Square Feet: | 299,643 | ||||||||
Percent of Total Rental Revenue: | 4.9 | % | |||||||
Tenant Credit Rating:1 | Not Rated | ||||||||
NOBLE ENERGY | |||||||||
Noble Energy, Inc. is a leading independent energy company engaged in worldwide oil and gas exploration and production. Noble searches for crude oil and natural gas both onshore and offshore, and seeks to acquire exploration rights and conduct exploration activities on an international scale. The company’s activities include geophysical and geological evaluation and exploratory drilling. Properties consist of primary interests in developed and undeveloped crude oil and natural gas leases and concessions. The company also owns natural gas processing plants and natural gas gathering and other crude oil and natural gas-related pipeline systems which are primarily used in the processing and transportation of crude oil, natural gas and NGL (natural gas liquids). | Acquisition Date: | October-13 | |||||||
Square Feet: | 497,477 | ||||||||
Percent of Total Rental Revenue: | 4.0 | % | |||||||
Tenant Credit Rating:1 | BBB | ||||||||
FEDEX | ||||||||
FedEx Corporation provides a broad portfolio of transportation, e-commerce and business services. The company segregates its operations into four business units: (i) FedEx Express is the world's largest express transportation company; (ii) FedEx Ground is a leading North American provider of small-package ground delivery services; (iii) FedEx Freight is a leading North American provider of less-than-truckload freight services; and (iv) FedEx Services provides the other three segments with sales, marketing, IT, communication and back-office support. | Acquisition Dates: | Various | ||||||
Square Feet: | 794,674 | |||||||
Percent of Total Rental Revenue: | 3.5% | |||||||
Tenant Credit Rating:1 | BBB | |||||||
1. See the Definitions section beginning on page 20. | ||||
COLE CORPORATE INCOME TRUST, INC. (CCIT) | WWW.COLECAPITAL.COM | 18
| Q3 2014 SUPPLEMENTAL INFORMATION |
Top Tenant Descriptions (cont.) |
HILLSHIRE BRANDS COMPANY | |||||||||
The Hillshire Brands Company is a leader in various meat products sold within the retail and foodservice markets. The company was formerly known as The Sara Lee Corporation, and adopted its current name in June 2012 concurrent with a transformation of its business whereby it spun-off its international coffee and tea business into an independent, publicly traded Dutch company named D.E Master Blenders. Immediately after the spin-off, the company changed its name to The Hillshire Brands Company. | Acquisition Date: | May-13 | |||||||
Square Feet: | 233,869 | ||||||||
Percent of Total Rental Revenue: | 3.1 | % | |||||||
Tenant Credit Rating:1 | BBB | ||||||||
ALLSTATE INSURANCE | |||||||||
The Allstate Corporation serves as the holding company for Allstate Insurance Company. Allstate’s business is conducted principally through the tenant, Allstate Life Insurance Company, and their affiliates. The company is primarily engaged in the personal property and casualty insurance business and the life insurance, retirement and investment products business. The vast majority of operations are conducted in the United States. | Acquisition Date: | June-13 | |||||||
Square Feet: | 458,338 | ||||||||
Percent of Total Rental Revenue: | 3.0 | % | |||||||
Tenant Credit Rating:1 | A- | ||||||||
CHURCH & DWIGHT CO. | |||||||||
Church & Dwight Co., Inc. develops, manufactures and markets a broad range of household, personal care and specialty products. The company sells its consumer products under a variety of brands through a broad distribution platform that includes supermarkets, mass merchandisers, wholesale clubs, drugstores, convenience stores, dollar, pet and other specialty stores and websites, all of which sell the products to retail consumers. The company also sells specialty products to industrial customers and distributors. Among the company’s most recognized brands are: Arm & Hammer; Trojan condoms; XTRA laundry detergent; Oxiclean stain removers; Nair depilatories; First Response home pregnancy kits; Orajel analgesics; and Spinbrush battery-operated toothbrushes. | Acquisition Date: | December-13 | |||||||
Square Feet: | 250,086 | ||||||||
Percent of Total Rental Revenue: | 2.9 | % | |||||||
Tenant Credit Rating:1 | BBB+ | ||||||||
PNC BANK | |||||||||
PNC Bank operates as a diversified financial services company in the United States and internationally. PNC serves corporations, government and not-for-profit entities, middle-market companies, and institutional and retail clients through its branch network, call centers and online banking channels. PNC is headquartered in Pittsburgh, Pennsylvania and the company is listed on the New York Stock Exchange under the ticker symbol 'PNC'. | Acquisition Date: | March-13 | |||||||
Square Feet: | 441,000 | ||||||||
Percent of Total Rental Revenue: | 2.8 | % | |||||||
Tenant Credit Rating:1 | A | ||||||||
RESTORATION HARDWARE | ||||||||
Restoration Hardware Holdings, Inc. sells furniture and related home goods across multiple channels of distribution, consisting of stores, catalogs and a website. As of August 2, 2014, the company operated 59 galleries, 6 full line design galleries and 3 baby & child galleries, as well as 17 outlet stores throughout the United States and Canada. | Acquisition Date: | December-13 | ||||||
Square Feet: | 1,194,744 | |||||||
Percent of Total Rental Revenue: | 2.7% | |||||||
Tenant Credit Rating:1 | Not Rated | |||||||
1. See the Definitions section beginning on page 20. | ||||
COLE CORPORATE INCOME TRUST, INC. (CCIT) | WWW.COLECAPITAL.COM | 19
| Q3 2014 SUPPLEMENTAL INFORMATION |
Definitions |
NON-GAAP FINANCIAL AND OTHER DISCLOSURES | ||
FFO, MFFO and AFFO | ||
For all of these reasons, the Company believes FFO, MFFO, and AFFO, | ||
Funds From Operations (“FFO”) is a non-GAAP financial performance | in addition to net income and cash flows from operating activities, as | |
measure defined by the National Association of Real Estate | defined by GAAP, are helpful supplemental performance measures | |
Investment Trusts (“NAREIT”) and widely recognized by investors as | and useful in understanding the various ways in which the Company’s | |
one measure of operating performance of a real estate company. The | management evaluates the performance of the Company over time. | |
FFO calculation excludes items such as real estate depreciation and | However, not all REITs calculate FFO, MFFO and AFFO the same way, | |
amortization. Depreciation and amortization as applied in accordance | so comparisons with other REITs may not be meaningful. FFO, MFFO | |
with GAAP implicitly assumes that the value of real estate assets | and AFFO should not be considered as alternatives to net income or to | |
diminishes predictably over time. Since real estate values have | cash flows from operating activities, and are not intended to be used | |
historically risen or fallen with market conditions, it is management’s | as a liquidity measure indicative of cash flow available to fund the | |
view, and the Company believes the view of many industry investors, | Company’s cash needs. | |
that the presentation of operating results for real estate companies | ||
by using the historical cost accounting method alone is insufficient. | MFFO and AFFO may provide investors with a view of the Company’s | |
The Company computes FFO in accordance with NAREIT’s definition. | future performance and of the sustainability of the Company’s | |
current distributions policy. However, because MFFO and AFFO | ||
The Company uses Modified Funds from Operations (“MFFO”) as a | exclude items that are an important component in an analysis of the | |
non-GAAP supplemental financial performance measure to evaluate | historical performance of a property, MFFO and AFFO should not be | |
the operating performance of the Company. MFFO, as defined by the | construed as historic performance measures. None of the Securities | |
Company, excludes from FFO acquisition related costs that are | and Exchange Commission, NAREIT, or any other regulatory body has | |
required to be expensed in accordance with GAAP. The Company’s | evaluated the acceptability of the exclusions contemplated to adjust | |
management believes that excluding these costs from FFO provides | FFO in order to calculate MFFO and AFFO and their use as non-GAAP | |
investors with supplemental performance information that is | financial performance measures. | |
consistent with the performance models and analysis used by | ||
management, and provides investors a view of the performance of the | EBITDA | |
Company’s portfolio over time. | EBITDA as disclosed represents earnings before interest, taxes, | |
depreciation and amortization, modified to include other adjustments | ||
In addition to FFO and MFFO, the Company uses Adjusted Funds from | to GAAP net income for acquisition related expenses which are | |
Operations (“AFFO”) as a non-GAAP supplemental financial | considered non-recurring. The Company excludes these items from | |
performance measure to evaluate the operating performance of the | EBITDA as they are not the primary drivers in the Company’s decision | |
Company. AFFO, as defined by the Company, excludes from MFFO | making process. In addition, the Company’s assessment of the | |
items such as straight-line rental revenue and certain charges such as | Company’s operations is focused on long-term sustainability and not | |
amortization of intangibles. The Company’s management believes | on such non-cash items, which may cause short term fluctuations in | |
that excluding these costs from MFFO provides investors with | net income but have no impact on cash flows. The Company believes | |
supplemental performance information that is consistent with the | that EBITDA is a useful supplemental measure to investors for | |
performance models and analysis used by management, and provides | assessing the performance of the Company’s business segments, | |
investors a view of the performance of the Company’s portfolio over | although it does not represent net income that is computed in | |
time, including after the Company ceases to acquire properties on a | accordance with GAAP. Therefore, EBITDA should not be considered | |
frequent and regular basis. AFFO also allows for a comparison of the | as an alternative to net income or as an indicator of the Company’s | |
performance of the Company’s operations with traded REITs that are | financial performance. The Company uses EBITDA as one measure of | |
not currently engaging in acquisitions and mergers, as well as a | its operating performance when formulating corporate goals and | |
comparison of the Company’s performance with that of other non- | evaluating the effectiveness of the Company’s strategies. EBITDA may | |
traded REITs, as AFFO, or an equivalent measure, is routinely | not be comparable to similarly titled measures of other companies. | |
reported by traded and non-traded REITs, and the Company believes | ||
often used by investors for comparison purposes. | ||
COLE CORPORATE INCOME TRUST, INC. (CCIT) | WWW.COLECAPITAL.COM | 20
| Q3 2014 SUPPLEMENTAL INFORMATION |
Definitions (cont.) |
Annualized Straight-Line Rental Revenue | is a useful measure for evaluating the operating performance of its | |
Annualized straight-line rental revenue is the sum of the contractual rent | real estate assets and to make decisions about resource allocations. | |
over the term of the lease, including escalations and free rent, | Further, the Company believes NOI is useful to investors as a | |
divided by the number of months in the lease term, and annualized. | performance measure because, when compared across periods, NOI | |
Annualized straight-line rental revenue excludes contingent rental | reflects the impact on operations from trends in occupancy rates, | |
payments, as applicable, that may be collected from certain tenants | rental rates, operating costs, and acquisition activity on an unleveraged | |
based on provisions related to sales thresholds and increases in annual | basis, providing perspective not immediately apparent from net | |
rent based on exceeding certain economic indexes among other items. | income. NOI excludes certain components from net income in order to | |
provide results that are more closely related to a property’s results of | ||
Credit Rating | operations. For example, interest expense is not necessarily linked to | |
S&P credit rating may reflect the credit rating of the parent company | the operating performance of a real estate asset and is often incurred | |
or a guarantor. The weighted average credit rating is calculated by | at the corporate level as opposed to the property level. In addition, | |
purchase price of all S&P rated tenants in the portfolio. | depreciation and amortization, because of historical cost accounting | |
and useful life estimates, may distort operating performance at the | ||
Net Operating Income | operating level. NOI presented by the Company may not be | |
Net operating income (“NOI”) is a non-GAAP financial measure equal | comparable to NOI reported by other REITs that define NOI | |
to net income attributable to the Company, the most directly | differently. The Company believes that in order to facilitate a clear | |
comparable GAAP financial measure, plus corporate general and | understanding of its operating results, NOI should be examined in | |
administrative expense, acquisition, and transaction costs, | conjunction with net income as presented in the Company’s | |
depreciation and amortization and interest expense, and interest and | consolidated financial statements. NOI should not be considered as an | |
other income. The Company uses NOI internally as a performance | alternative to net income as an indication of the Company’s | |
measure and believes NOI provides useful information to investors | performance or to cash flows as a measure of the Company’s liquidity | |
regarding the Company’s financial condition and results of operations | or ability to make distributions. | |
because it reflects only those income and expense items that are | ||
incurred at the property level. Therefore, the Company believes NOI | ||
 | |||||
 | |||||