Attached files
| file | filename |
|---|---|
| EX-23.1 - CONSENT OF PRICEWATERHOUSECOOPERS LLP - Viacom Inc. | exhibit231.htm |
| EX-21.1 - SUBSIDIARIES OF VIACOM INC. - Viacom Inc. | exhibit211.htm |
| EX-32.2 - CERTIFICATION OF THE CFO OF VIACOM INC. PURSUANT TO 18 USC SECTION 1350 - Viacom Inc. | via-20140930x10kexhibit322.htm |
| EX-31.2 - CERTIFICATION OF THE CFO OF VIACOM INC. PURSUANT TO RULE 13A-14(A) OR 15D-14(A) - Viacom Inc. | via-20140930x10kexhibit312.htm |
| EX-32.1 - CERTIFICATION OF THE CEO OF VIACOM INC. PURSUANT TO 18 USC SECTION 1350 - Viacom Inc. | via-20140930x10kexhibit321.htm |
| EXCEL - IDEA: XBRL DOCUMENT - Viacom Inc. | Financial_Report.xls |
| EX-24.1 - POWERS OF ATTORNEY - Viacom Inc. | exhibit241.htm |
| EX-31.1 - CERTIFICATION OF THE CEO OF VIACOM INC. PURSUANT TO RULE 13A-14(A) OR 15D-14(A) - Viacom Inc. | via-20140930x10kexhibit311.htm |
UNITED STATES
SECURITIES AND EXCHANGE COMMISSION
Washington, D.C. 20549
FORM 10-K | ||||
ý | ANNUAL REPORT PURSUANT TO SECTION 13 OR 15(d) OF THE SECURITIES EXCHANGE ACT OF 1934 |
For the fiscal year ended September 30, 2014 | |
OR
¨ | TRANSITION REPORT PURSUANT TO SECTION 13 OR 15(d) OF THE SECURITIES EXCHANGE ACT OF 1934 |
For the transition period from ______ to _______ | |
Commission File Number 001-32686
VIACOM INC.
(Exact name of registrant as specified in its charter)
DELAWARE | 20-3515052 | |
(State or other jurisdiction of incorporation or organization) | (I.R.S. Employer Identification Number) | |
1515 Broadway New York, NY 10036 (212) 258-6000 (Address, including zip code, and telephone number, including area code, of registrant’s principal executive offices) | ||||
Securities Registered Pursuant to Section 12(b) of the Act:
Title of Each Class | Name of Each Exchange on Which Registered | |
Class A Common Stock, $0.001 par value | NASDAQ Global Select Market | |
Class B Common Stock, $0.001 par value | NASDAQ Global Select Market | |
Securities Registered Pursuant to Section 12(g) of the Act:
None
(Title Of Class)
Indicate by check mark if the registrant is a well-known seasoned issuer, as defined in Rule 405 of the Securities Act. Yes ý No ¨
Indicate by check mark if the registrant is not required to file reports pursuant to Section 13 or Section 15(d) of the Act. Yes ¨ No ý
Indicate by check mark whether the registrant (1) has filed all reports required to be filed by Section 13 or 15(d) of the Securities Exchange Act of 1934 during the preceding 12 months (or for such shorter period that the registrant was required to file such reports), and (2) has been subject to such filing requirements for the past 90 days. Yes ý No ¨
Indicate by check mark whether the registrant has submitted electronically and posted on its corporate Web site, if any, every Interactive Data File required to be submitted and posted pursuant to Rule 405 of Regulation S-T during the preceding 12 months (or such shorter period that the registrant was required to submit and post such files). Yes ý No ¨
Indicate by check mark if disclosure of delinquent filers pursuant to Item 405 of Regulation S-K is not contained herein, and will not be contained, to the best of the registrant’s knowledge, in definitive proxy or information statements incorporated by reference in Part III of this Form 10-K or any amendment to this Form 10-K. ý
Indicate by check mark whether the registrant is a large accelerated filer, an accelerated filer, a non-accelerated filer, or a smaller reporting company. See definitions of “large accelerated filer,” “accelerated filer” and “smaller reporting company” in Rule 12b-2 of the Exchange Act. (Check one):
Large accelerated filer x | Accelerated filer ¨ | Non-accelerated filer ¨ | Smaller reporting company ¨ | |||
Indicate by check mark whether the registrant is a shell company (as defined in Rule 12b-2 of the Act). Yes ¨ No ý
As of the close of business on March 31, 2014, the last business day of the registrant’s most recently completed second fiscal quarter, there were 50,975,288 shares of the registrant’s Class A common stock, par value $0.001 per share, and 380,363,277 shares of its Class B common stock, par value $0.001 per share, outstanding. The aggregate market value of Class A common stock held by non-affiliates as of March 31, 2014 was approximately $898.8 million (based upon the closing price of $85.26 per share as reported by the NASDAQ Global Select Market on March 31, 2014, the last trading day of the quarter). The aggregate market value of Class B common stock held by non-affiliates as of March 31, 2014 was approximately $32.1 billion (based upon the closing price of $84.99 per share as reported by the NASDAQ Global Select Market on March 31, 2014, the last trading day of the quarter).
As of November 5, 2014, 50,875,550 shares of our Class A common stock and 359,591,362 shares of our Class B common stock were outstanding.
DOCUMENTS INCORPORATED BY REFERENCE
Portions of Viacom Inc.’s Notice of 2015 Annual Meeting of Stockholders and Proxy Statement to be filed with the Securities and Exchange Commission pursuant to Regulation 14A of the Securities Exchange Act of 1934, as amended, are incorporated by reference into this Annual Report on Form 10-K (Portion of Item 5; Part III).
TABLE OF CONTENTS
Item 1. | ||
Item 1A. | ||
Item 1B. | ||
Item 2. | ||
Item 3. | ||
Item 4. | ||
Item 5. | ||
Item 6. | ||
Item 7. | ||
Item 7A. | ||
Item 8. | ||
Item 9. | ||
Item 9A. | ||
Item 9B. | ||
Item 10. | ||
Item 11. | ||
Item 12. | ||
Item 13. | ||
Item 14. | ||
Item 15. | ||
PART I
Item 1. Business.
OVERVIEW
Viacom is a leading global entertainment content company that connects with audiences in more than 165 countries and territories and creates compelling television programs, motion pictures, short-form video, applications (“apps”), games, brands for consumer products, social media and other entertainment content. We operate through two reporting segments: Media Networks and Filmed Entertainment. References in this document to “Viacom,” “Company,” “we,” “us” and “our” mean Viacom Inc. and our consolidated subsidiaries, unless the context requires otherwise.
Media Networks
Our Media Networks segment provides entertainment content and related branded products for consumers in targeted demographics attractive to advertisers, content distributors and retailers. We create, acquire and distribute programming and other content to our audiences across multiple platforms, which allows our audiences to engage and interact with our content in a variety of ways: through traditional cable and satellite distribution, on connected TVs, PCs, tablets and other mobile devices, and using apps, browsers and other interfaces.
Viacom Media Networks operates our media networks businesses through four brand groups: Music, Nickelodeon, Entertainment and BET Networks. Viacom Media Networks and its international operations reach approximately 700 million households in more than 165 countries and territories worldwide via more than 230 locally programmed and operated TV channels which include MTV®, VH1®, CMT®, Logo®, BET®, CENTRIC®, Nickelodeon®, Nick Jr.®, TeenNick®, Nicktoons®, Nick at Nite®, Comedy Central®, TV Land®, SPIKE®, Channel 5® (UK), Tr3s®, Paramount Channel™ and VIVA™, among others. Viacom Media Networks also provides extensive online, mobile and app experiences.
Our Media Networks segment generates revenues from advertising sales, affiliate fees and ancillary revenues. Revenues from the Media Networks segment accounted for 73%, 69% and 65% of our revenues for the fiscal years 2014, 2013 and 2012, respectively, after the elimination of intercompany revenues.
Filmed Entertainment
Our Filmed Entertainment segment produces, finances, acquires and distributes motion pictures, television programming and other entertainment content under the Paramount Pictures®, Paramount Vantage®, Paramount Classics®, Insurge Pictures®, MTV Films®, Nickelodeon MoviesTM and Paramount TelevisionTM brands. Paramount Pictures, which celebrated its 100th anniversary in 2012, is a major global producer and distributor of filmed entertainment and has a library consisting of approximately 3,400 motion pictures and a small number of television programs. Paramount distributes motion pictures theatrically and on DVDs and Blu-ray discs, television, digital and other platforms in the United States and internationally for itself and for third parties. Paramount TelevisionTM, a new television production division, is focused on developing programming for television and digital platforms.
Our Filmed Entertainment segment generates revenues primarily from the release and/or distribution of motion pictures theatrically, through home entertainment, and through television and digital licensing and ancillary activities. Revenues from the Filmed Entertainment segment accounted for 27%, 31% and 35% of our revenues for fiscal years 2014, 2013 and 2012, respectively, after the elimination of intercompany revenues.
Business Strategy
We develop and distribute television programming, motion pictures and other creative entertainment content to serve diverse audiences worldwide. We manage our global portfolio of brands with creativity, expertise and discipline to produce and distribute entertainment experiences across a wide variety of media platforms and engage consumers in many facets of their lives. With a strategic focus on content, we aim to:
• | expand, enhance and evolve our brands worldwide by creating and acquiring popular content and other interactive experiences, building new networks and digital properties and innovating in other forms of entertainment; |
• | foster a creative, dynamic and diverse corporate culture that reflects the diverse audiences we serve and strengthens our position as a leader in entertainment for consumers around the world; |
1
• | deepen our connection with audiences by investing wisely in content that fits our core businesses and brand portfolios and resonates with targeted audiences, leveraging our proprietary audience research to increase the level of original programming, building our content library, driving multi-platform engagement, and expanding our relationships with our advertising, distribution, licensing and production and talent partners; |
• | continue to develop and refine innovative ways to distribute our content, capitalizing on and optimizing opportunities for content delivery through authenticated and free models, supported by subscription, transaction-based and/or advertising revenues, via cable, satellite and Internet delivery systems; |
• | fuel organic growth and expansion of our Media Networks and Filmed Entertainment businesses internationally by developing new brands and properties and launching new channels, connected experiences and consumer products with local, regional and multinational appeal; |
• | continue our focus on a film slate that emphasizes key branded and franchise films, including animated films, complemented by smaller productions and acquisitions, and that is guided by financial discipline and driven by innovative promotion and marketing while developing television production operations capitalizing on our strong creative relationships and our film properties; |
• | limit the impact of intellectual property theft by providing compelling, legitimate offerings, as well as through technology solutions, communications, legal enforcement and other activities; |
• | drive efficiencies, execute strategies and maintain a strong financial position through operational discipline; and |
• | thereby generate significant long-term value for our stockholders. |
Corporate Information
We were organized as a Delaware corporation in 2005 in connection with our separation from CBS Corporation, which was effective January 1, 2006. Our principal offices are located at 1515 Broadway, New York, New York 10036. Our telephone number is (212) 258-6000 and our website is www.viacom.com. Information included on or accessible through our website is not intended to be incorporated into this report.
MEDIA NETWORKS
Viacom Media Networks operates our media networks businesses in the United States and internationally. The Media Networks segment is comprised of four brand groups – Music, Nickelodeon, Entertainment and BET Networks – that operate as Viacom Media Networks.
Media Networks Revenues
Our Media Networks segment generates revenues in three categories: (i) the sale of advertising and marketing services related to our content, (ii) affiliate fees from multichannel television service providers, including cable television operators, direct-to-home satellite television operators and telecommunications operators, subscription and advertising supported video-on-demand services, and other distributors of our programming and program services, and (iii) ancillary revenues, which include consumer products licensing, brand licensing, sale of content on DVDs and Blu-ray discs, licensing of our content for download-to-own and download-to-rent services and television syndication. In fiscal year 2014, advertising revenues, affiliate fees and ancillary revenues were approximately 49%, 46% and 5%, respectively, of total revenues for the Media Networks segment.
Advertising Revenues
The advertising revenues generated by our program services depend on the number of viewers and viewership demographics. For television, ratings and demographic information for advertising purposes are determined by third party research companies such as The Nielsen Company (US), LLC (“Nielsen”). For digital offerings, reach and demographic information for advertising purposes are derived from a combination of third- and first-party data.
Our media networks properties target key audiences attractive to advertisers. For example, MTV targets teen and young adult demographics, Nickelodeon targets kids and their families and BET targets African-American audiences. Demand and pricing for our advertising depend on our ratings and overall market conditions. We also drive additional demand through integrated sales of digital advertising inventory and through our marketing services, providing unique branded entertainment and custom sponsorship opportunities to our advertisers.
Domestically, we sell a certain amount of our advertising inventory in advance each year in the upfront market, and other inventory in the scatter market closer to the time a program airs. Upfront sales and pricing for each new cable broadcast year are largely established in our third fiscal quarter and reflected in advertising revenue principally beginning in the first quarter of our subsequent fiscal year as marketing plans are finalized and orders are fulfilled to deliver advertising across various
2
programs and dayparts. Pricing for advertising within our program services is generally established based on projected impression delivery, which may be guaranteed on a fixed price per unit basis. For advertising sold based on impression guarantees, audience deficiency may result in an obligation to deliver additional units, reducing inventory available for scatter sales. Scatter advertising is sold throughout the year at pricing reflecting market conditions at the time of sale. Most scatter advertising is also sold based on impression guarantees. To the extent we do not satisfy contracted audience ratings, we record deferred revenue until such time that the audience rating has been satisfied. Internationally, advertising markets vary from jurisdiction to jurisdiction, however we do not typically sell our inventory in advance in an upfront market. The majority of our inventory is sold in the equivalent of the U.S. scatter market, and in a number of markets we are represented by third party sales houses. The terms of these relationships vary.
Our advertising revenues may be affected by the strength of advertising markets and general economic conditions and may fluctuate depending on the success of our programming, as measured by viewership, at any given time. Audience measurement ratings may vary due to the timing of availability of new episodes of popular programming, success of our programming and performance of competing programs and other entertainment alternatives for viewers, as well as variations related to the methods used by third parties to measure ratings. Advertising revenues may also fluctuate due to seasonal variations, the timing of holidays and significant programming events such as awards shows or premieres. Typically, advertising revenues are highest in the first and fourth quarters of our fiscal year.
Affiliate Revenues
Our agreements with multichannel television service providers are generally multi-year carriage agreements with set rate increases that provide us with a reasonably stable source of revenues. The amount of the fees we receive is generally a function of the number of subscribers and the rates we receive per subscriber. Expirations of these affiliate agreements are staggered. Certain other distribution agreements include multiple programs made available for distribution on one or more dates and revenue under such arrangements fluctuates depending on the initial availability of the programs licensed. We continue to create ways to build stronger and more expansive multimedia partnerships with the various distributors of our content in order to maximize the value of our content for us, our audience and our affiliate and digital partners, such as customized content offerings for authenticated apps and for subscription video-on-demand services.
Ancillary Revenues
Our ancillary revenues are principally derived from (i) consumer products and brand licensing, including the licensing of popular characters from our programs and digital properties for consumer products (such as toys and apparel), interactive games and publishing across all platforms including mobile and console, and recreation experiences (such as hotels, theme parks, cruises and live entertainment), (ii) distribution of our programming in the home entertainment market through the licensing of content for download-to-own and download-to-rent services and the sale of copies of content on DVDs and Blu-ray discs and (iii) television syndication. Our ancillary revenues vary based on consumer spending, the popularity of our programming, volume of content available for sale during a particular period and acceptance of our or our partners’ products.
Media Networks Properties
Viacom Media Networks operates our media networks businesses through four brand groups based on target audience, similarity of programming and other factors: Music, Nickelodeon, Entertainment and BET Networks. Our core media networks experiences are generally delivered via linear networks, video-on-demand, streaming and other connected experiences delivered over cable, satellite, mobile networks and the Internet by a variety of distribution partners.
Worldwide, Viacom Media Networks’ program services reached approximately 700 million households in more than 165 countries and territories via more than 230 locally programmed and operated TV channels and hundreds of online, mobile and app experiences in September 2014. Viacom Media Networks’ online properties collectively averaged approximately 62 million unique visitors per month domestically during the quarter ended September 30, 2014.
Viacom Media Networks operates the international extensions of our multimedia brands MTV, VH1, Nickelodeon, Comedy Central, BET and SPIKE, as well as certain program services created specifically for international and/or non-English speaking audiences, such as the Paramount Channel and Colors in India through Viacom International Media Networks (“VIMN”). In September 2014, VIMN acquired British public service broadcaster Channel 5, one of UK broadcasting’s premier brands, significantly increasing our investment in the UK content marketplace and benefiting our existing UK pay television channel portfolio.
Our most important media networks properties are discussed below. Unless otherwise indicated, the domestic television household numbers are according to Nielsen and the Internet user and video stream data is according to comScore Media/Video
3
Metrix (U.S. data only unless otherwise indicated). International reach statistics are derived from internal data coupled with external sources when available.
Music
The Music group includes our music, youth and young adult-oriented brands, content and services, which generally target varying portions of the 12-34 demographic, and Logo, our property for adult gays, lesbians and their families and friends. Our principal properties in this group include:
 | MTV | |
• | MTV is a leading global brand, multimedia destination and content producer targeting the millennial generation. MTV offers content built around compelling reality and scripted storytelling, music discovery and activism across television and social media, and connected and second screen experiences, including through the MTV app which features short-form videos and full episodes. In fiscal year 2014, VIMN launched MTV-related channels in several international markets, such as Hungary, Czech Republic and the Philippines. | |
• | Programming highlights in fiscal year 2014 included the premiere of the scripted series Finding Carter and Faking It, new reality series such as Are You the One?, returning hits such as Teen Wolf, Teen Mom 2, Catfish: the TV Show, Awkward and The Real World; and tentpole events such as the 2014 MTV Video Music Awards, which were watched by approximately 13.7 million viewers domestically across all airings, had 6.5 million live video streams, and nearly 63 million social interactions during the night of the show, and the 2014 MTV Movie Awards, which were watched by approximately 4.8 million viewers domestically across all airings the night it premiered. | |
• | MTV reached approximately 95 million domestic television households in September 2014 and approximately 400 million households in more than 160 territories worldwide via over 70 MTV-branded channels. The MTV brand reaches many more households through branded programming blocks on third party broadcasters and through apps, streaming and downloads. | |
• | MTV’s online, mobile and app experiences feature a diverse array of music, entertainment and pop culture content, including exclusive music performances, news, interviews and series. Each digital and mobile platform complements MTV’s television programming and enhances audience engagement, including through social media interactions with cast members and access to exclusive content. MTV also has a number of branded apps, including MTV, MTV News and MTV Artists. In the quarter ended September 30, 2014, MTV.com averaged approximately 20.7 million monthly unique visitors and 61.8 million content video streams each month. As of September 30, 2014, MTV had a social footprint of approximately 202 million followers, with 177 million fans across all MTV Facebook pages and approximately 25 million followers across all MTV accounts on Twitter, Instagram, FourSquare, Tumblr, Vine, Pinterest and Snapchat. MTV-branded apps had been downloaded approximately 6.4 million times. | |
 | MTV2 | |
• | MTV2, MTV2.com and the MTV2 mobile app offer music and lifestyle destinations and experiences with content targeting male “millennials” aged 12 to 34 and featuring original music, live-action sports and irreverent lifestyle programming. | |
• | Programming highlights included the new weekly series Off the Bat from the MLB Fan Cave, born out of a partnership with Major League Baseball, returning favorites Guy Code and Nick Cannon Presents: Wild 'N Out, and action sports and lifestyle programming such as Nitro Circus Live. | |
• | MTV2 reached approximately 80.2 million domestic television households in September 2014. | |
• | In the quarter ended September 30, 2014, MTV2.com averaged approximately 400,000 monthly unique visitors and 1.7 million content video streams each month. MTV2's social media footprint more than doubled in fiscal year 2014. As of September 30, 2014, MTV2 had approximately 6.6 million Facebook fans and more than 500,000 Twitter followers. | |
4
 | VH1 | |
• | VH1 features music and pop culture-driven content targeting adults aged 18-49, including a variety of original programming primarily focused on music artists, real life stories and celebrities. | |
• | Programming highlights included the premiere of the reality series Dating Naked, the Love & Hip Hop franchise, Basketball Wives LA, Mob Wives, Crazy Sexy Cool: The TLC Story and the scripted series Hit the Floor; tentpoles such as the You Oughta Know Concert; and core music offerings such as VH1 Top 20 Countdown. | |
• | VH1 reached approximately 94.5 million domestic television households in September 2014. | |
• | VH1’s online, mobile and app experiences feature a diverse array of content centered on VH1 shows, music, pop culture and celebrities, including original series, exclusive events, music videos, live performances and news, and include VH1.com, VH1Classic.com and m.VH1.com. In fiscal year 2014, VH1 launched a "TV Everywhere" app. In the quarter ended September 30, 2014, VH1.com averaged approximately 6.1 million monthly unique visitors and 5.7 million content video streams each month. As of September 30, 2014, the "TV Everywhere" app had been downloaded approximately 1.5 million times. | |
 | VH1 Classic | |
• | Classic-themed network featuring music videos, documentaries, movies and concert footage from the 1960s, 1970s, 1980s and 1990s, as well as other music-themed programs. | |
• | Programming highlights included That Metal Show and Behind the Music: Remastered. | |
• | VH1 Classic reached approximately 58.9 million domestic television households in September 2014. | |
 | CMT | |
• | CMT is the leading television and digital destination for country music, culture and related entertainment. CMT and its website, CMT.com, offer an unparalleled mix of music, news, awards, live concerts and series and is the top resource for country music on demand. | |
• | Programming highlights included Party Down South, Dog & Beth: On The Hunt, Steve Austin's Broken Skull Challenge, Dallas Cowboys Cheerleaders: Making the Team, Cops Reloaded, Swamp Pawn and My Big Redneck Family; tentpole events such as the annual CMT Music Awards, CMT Crossroads and CMT Artists of the Year; and CMT’s weekly franchise CMT Insider. | |
• | CMT reached approximately 88.8 million domestic television households in September 2014. | |
• | CMT’s online, mobile and app experiences include the 24-hour music channel CMT Pure Country, CMT Mobile and CMT VOD, as well as apps such as CMT Ultimate Fan and CMT Insider, and in fiscal year 2014, CMT launched a "TV Everywhere" app. In the quarter ended September 30, 2014, CMT.com averaged approximately 1.8 million monthly unique visitors and 1.6 million content video streams each month. As of September 30, 2014, the "TV Everywhere" app had been downloaded approximately 364,000 times. | |
Logo TV | ||
• | Logo TV is a leading entertainment brand inspired by the LGBT community present across television, digital and social platforms. Logo features one-of-a-kind personalities, shows, specials, and unique stories. | |
• | Programming highlights included original programs such as RuPaul’s Drag Race and Secrets to Fabulous, tentpoles such as The Trailblazer Awards, as well as acquired programs such as Will and Grace and Roseanne. | |
• | Logo reached approximately 51.1 million domestic television households in September 2014. | |
• | Logo’s online, mobile and app experiences include LogoTV.com, the Backlot.com and NewNowNext.com. The LogoTV app is a 24/7 hub for content that appeals to the LGBT community and their families and friends and includes, among other content, full episodes of Logo programming. In the quarter ended September 30, 2014, Logo's online properties averaged approximately 2.0 million monthly unique visitors and 606,000 content video streams each month. As of September 30, 2014, the app had been downloaded approximately 224,000 times. | |
Other key Music properties include mtvU, our on-air, online and on-campus network created by and for the college audience; MTV Films, MTV’s motion picture brand; and PalladiaHD, a music-centric high definition television channel.
5
Nickelodeon
The Nickelodeon group provides high-quality entertainment and educational brands, content and services targeted to kids ages 2-17 and their families. Our principal properties in this group include:
  | Nickelodeon and Nick at Nite | |
• | Nickelodeon, now in its 35th year, is a diverse, global business and the destination for all things kids. The Nickelodeon cable television network has been the number-one-rated basic cable network for 19 consecutive years, featuring both original and licensed experiences for kids. Nick at Nite, which airs on the same cable channel as the Nickelodeon cable television network in the evening hours, primarily features licensed contemporary family comedies. Nickelodeon produces and distributes television programming worldwide, has a global consumer products licensing business and offers a number of premium apps through the Nickelodeon Games Group (described further below) featuring its popular characters such as Teenage Mutant Ninja Turtles, Dora the Explorer and SpongeBob SquarePants. | |
• | Nickelodeon programming highlights in fiscal year 2014 included hits such as SpongeBob SquarePants, Sam & Cat, Sanjay & Craig, Teenage Mutant Ninja Turtles and Fairly Odd Parents; tentpoles such as The Kids Choice Awards, Worldwide Day of Play and The HALO Awards; Kids' Choice Sports 2014, Nickelodeon's first annual sports awards show celebrating kids' favorites in the sports world; and game shows such as Figure It Out. Nick at Nite programming highlights included Friends, Full House, George Lopez, My Wife and Kids, Yes Dear and The Nanny. | |
• | Nickelodeon and Nick at Nite reached approximately 96.4 million domestic television households in September 2014. Nickelodeon’s brands are seen globally in more than 550 million households across approximately 140 territories, via more than 80 locally programmed channels and branded blocks. | |
• | Nick’s online, mobile and app experiences include, among others, Nick.com, the online destination for all things Nickelodeon, featuring video streaming of Nick content and games. In fiscal year 2013, Nickelodeon launched a "TV Everywhere" app that has won a number of awards, including the Emmy Award in 2013 for "Outstanding Creative Achievement in Interactive Media - User Experience and Visual Design" and "Best App or Website" at the UK's 2014 Broadcast Digital Awards. The Nick App features short-form videos, games and full episodes through “TV Everywhere” authentication, as well as popular interactive features like the “Do Not Touch button.” In the quarter ended September 30, 2014, Nick.com averaged 6.5 million monthly unique visitors and 8.7 million content video streams each month. As of September 30, 2014, the Nick App had been downloaded approximately 11 million times. | |
  | Nick Jr. and NickMom | |
• | Nick Jr. seeks to educate and entertain preschoolers, providing kids an opportunity to engage with characters they love while building their imaginations, gaining key cognitive and social-emotional skills and learning about the world around them. Nick Jr. offers parents and their kids entertaining and enriching activities geared toward their interests, ages and developmental levels. | |
• | My Nick Jr., a novel TV-delivery approach launched in fiscal 2014, is a customizable children’s TV channel that combines both scheduled programming and on-demand options that can be programmed according to parents’ tastes. My Nick Jr. provides access to hundreds of episodes of shows in Nick Jr.’s library. | |
• | NickMom is a primetime comedy block for moms on the Nick Jr. channel featuring a mix of original long- and short-form programming, including talk shows, stand-up and sketch comedy and docu-series, delivered via a linear cable television network, video-on-demand, streaming and other connected experiences. NickMom.com is a comedy and entertainment site featuring short-form video, photos, editorial pieces and games just for moms. | |
• | Nick Jr. programming highlights included Bubble Guppies, Dora the Explorer, Team Umizoomi, Peppa Pig and Wallykazam! | |
• | Nick Jr. reached approximately 75.8 million domestic television households in September 2014. | |
• | In the quarter ended September 30, 2014, NickJr.com averaged 3.2 million monthly unique visitors and NickMom.com averaged 2.1 million monthly unique visitors. NickJr.com had an average of 25 million content video streams each month. | |
6
 | TeenNick | |
• | TeenNick includes a linear cable television network, video-on-demand, streaming and other connected experiences exclusively for and about teens and tweens, and features original programming and award-winning series, with a focus on presenting an authentic teen experience. | |
• | Programming highlights included series and events such as Degrassi: The Next Generation, Drake & Josh, House of Anubis and Zoey 101, as well as other Nickelodeon original hits like Big Time Rush, iCarly and Victorious. | |
• | TeenNick reached approximately 72.8 million domestic television households in September 2014. | |
• | TeenNick.com features the best episodes and clips of TeenNick shows, as well as games, quizzes and a vibrant user community. In the quarter ended September 30, 2014, TeenNick.com averaged 890,000 monthly unique visitors and had an average of 345,000 content video streams each month. | |
 | Nicktoons | |
• | Nicktoons is a leading cartoon destination targeting boys and featuring signature franchises such as Dragon Ball Z Kai and Avatar: The Last Airbender, as well as fan favorites such as The Fairly OddParents and SpongeBob SquarePants. | |
• | Programming highlights included the series premiere of Digimon Fusion and new episode premieres of Yu-Gi-Oh! ZEXAL, as well as returning hits such as NFL Rush Zone and Wild Grinders. | |
• | Nicktoons reached approximately 67.1 million domestic television households in September 2014. | |
| Nickelodeon Games Group | |
• | Nickelodeon develops and publishes mobile apps for its kids and family audiences, including apps distributed on Apple and Android platforms. Nickelodeon apps include top apps for preschoolers, leading the education category with the award-winning Nick Jr. Draw and Play, as well as Umizoomi: Zoom Into Numbers, Dora Appisode: Perrito’s Big Surprise and Bubble Guppies: Animal School Day; hit game apps based on our hit shows like SpongeBob Moves In and TMNT: Rooftop Run; and apps based on original game characters such as Scribble Hero. As of September 30, 2014, Nickelodeon apps had been downloaded approximately 52 million times. | |
Other Nickelodeon properties include Nickelodeon Movies, Nickelodeon’s motion picture brand, under which Paramount released Teenage Mutant Ninja Turtles in fiscal year 2014, and the Nickelodeon Animation Studio. In addition, Nickelodeon licenses its brands for recreation experiences such as hotels, cruises, theme parks and live tours.
Entertainment
The Entertainment group includes brands, content and services that generally target adult and male audiences. Our principal properties in this group include:
 | COMEDY CENTRAL | |
• | Comedy Central is the destination for all things comedy, featuring award-winning “fake news” programs, stand-up and sketch comedy, sitcoms and animated programming. Comedy Central also operates a live comedy touring business. | |
• | Programming highlights in fiscal year 2014 included the premiere of @midnight, where top comedians battle for the funniest take on the day's social media and pop culture, Emmy® and Peabody® Award-winning series The Daily Show with Jon Stewart, The Colbert Report, Tosh.0, Workaholics, Inside Amy Schumer, South Park, Key & Peele, Futurama, Brickleberry, Drunk History and Nathan For You. | |
• | Comedy Central reached approximately 95.6 million domestic television households in September 2014. | |
7
• | Comedy Central’s online, mobile and app experiences include Comedycentral.com, a leading online video platform featuring exclusive Comedy Central content; thedailyshow.com and Colbertnation.com, the official fan sites of The Daily Show with Jon Stewart and The Colbert Report; our interest in the official South Park website southparkstudios.com, which features the latest in South Park news and content; Jokes.com; and a number of apps such as CC: Stand Up. The Comedy Central "TV Everywhere" app, launched in fiscal year 2014, offers full episodes of its shows the day after they air, as well as stand-up specials, among other content. In the quarter ended September 30, 2014, the Comedy Central online properties averaged 10.2 million monthly unique visitors and approximately 23.4 million content video streams each month. As of September 30, 2014, the Comedy Central "TV Everywhere" app had been downloaded approximately 1.7 million times. | |
 | SPIKE | |
• | SPIKE is a primarily male-oriented general entertainment brand featuring a mix of original and acquired programming, sports series, specials, live events and movies delivered on a linear cable television network, on demand, online and via other connected experiences. | |
• | SPIKE programming highlights included favorites such as Bar Rescue, Ink Master, Tattoo Nightmares, Catch a Contractor and Bellator MMA; and tentpoles such as Spike’s Guys Choice Awards and One Night Only. | |
• | SPIKE reached approximately 95.1 million domestic television households in September 2014. | |
• | SPIKE’s online properties include SPIKE.com, the online destination featuring SPIKE content, and apps such as Bellator. In the quarter ended September 30, 2014, Spike.com averaged approximately 1.4 million monthly unique visitors and 2.7 million content video streams each month. As of September 30, 2014, Spike-branded apps had been downloaded approximately 217,000 times. | |
 | TV Land | |
• | TV Land features a mix of original programming, classic and contemporary TV shows, specials and iconic movies designed to appeal to the entertainment needs and attitudes of adults in their 40s and 50s. | |
• | Programming highlights included returning original favorites such as Emmy-nominated Hot in Cleveland and The Exes, Jennifer Falls, Candid Camera and The Soul Man, as well as acquisition favorites such as Everybody Loves Raymond and The King of Queens. | |
• | TV Land reached approximately 94.3 million domestic television households in September 2014. | |
• | TV Land’s online properties include TVLand.com, TV Land’s premiere destination for consumers in their 40s and 50s. In the quarter ended September 30, 2014, TVLand.com averaged approximately 260,000 monthly unique visitors and, according to internal data, 1.8 million content video streams each month. | |
Other Entertainment properties include a variety of additional apps and online services.
BET Networks
BET Networks is a leading provider of entertainment brands, content and services targeted to African-American audiences and consumers of Black culture worldwide. Our principal properties in this group include the flagship BET channel, CENTRIC, BET Gospel and BET Hip Hop.
8
   | BET | |
• | BET is the nation’s leading television network providing entertainment, music, news and public affairs programming to African-American audiences. BET is a leading consumer brand in the urban marketplace with a diverse group of branded businesses, including BET, its core channel which focuses on young Black adults; BET Gospel, which features gospel music and spiritual programming; and BET Hip Hop, which spotlights hip hop music programming and performances. | |
• | BET programming highlights in fiscal year 2014 included the premiere of Being Mary Jane; returning favorites such as Real Husbands of Hollywood, The Game, 106 & Park and Sunday Best; and tentpoles such as the BET Awards ‘14, which was part of the second annual BET Experience, BET’s three-day weekend celebration of music, entertainment and Black culture, which was attended by more than 150,000 people, BET Honors Awards, Black Girls Rock, BET Hip Hop Awards, Soul Train Awards and the Celebration of Gospel. | |
• | BET reached approximately 89.5 million domestic television households in September 2014. According to internal data, BET Gospel and BET Hip Hop reached approximately 24.5 million and 2.9 domestic television households, respectively. | |
• | BET.com is a leading online destination for African-American audiences and offers users content and interactive features for news, music, community, culture and other areas tailored to the unique interests and issues of African-Americans. BET.com also provides interactive entertainment content for BET Networks’ program services. In the quarter ended September 30, 2014, BET.com averaged approximately 8.3 million monthly unique visitors. | |
• | The BET Now app, launched in fiscal year 2014, provides fans access to a library of full episodes of current BET shows and classics. As of September 30, 2014, BET-branded apps had been downloaded approximately 3.5 million times. | |
 | CENTRIC | |
• | CENTRIC is the first network designed for black women, reflecting the lifestyle of today’s African-American and multicultural adult viewer and delivering a variety of music artists, along with culturally relevant movies, series, live performances, specials and reality programming. | |
• | CENTRIC programming highlights in fiscal year 2014 included the Soul Train Awards, Being and the Centric Live Concert series. | |
• | CENTRIC reached approximately 50.7 million domestic television households in September 2014. | |
Other BET Networks properties include BET Mobile, which delivers music, gaming and video content to its target audiences on mobile devices and digital services across all major service providers.
International
Viacom Media Networks operates the international extensions of our multimedia brands, as well as certain program services created specifically for international and/or non-English speaking audiences, through Viacom International Media Networks.
 | Paramount Channel | |
• | Paramount Channel is a free-to-air, 24-hour movie channel available in Spain, France, Hungary, Russia and Romania. VIMN continues to manage Paramount Channel’s ongoing international expansion. | |
• | Programming highlights in fiscal year 2014 included Star Trek, Paranormal Activity, American Beauty, A Beautiful Mind, Zoolander, Ferris Bueller’s Day Off and The Godfather. | |
 | Channel 5 | |
• | Channel 5, a UK public service broadcaster, and its sister channels air a broad mix of popular content, including factual programming, entertainment, reality, sports, acquired and original drama, and preschool programming through its award-winning Milkshake brand. | |
• | Programming highlights will include a new animated series, Nella the Knight, a co-production of Nickelodeon and Milkshake, and a new entertainment series, 10,000 BC, a co-production of Channel 5 and MTV UK. | |
9
  | Colors and Rishtey | |
• | Colors is a highly-rated Hindi-language general entertainment channel operated by our Viacom 18 joint venture. Colors is available in India, the UK and Ireland, as well as in Canada and the U.S. as Aapka Colors. In fiscal year 2014, Viacom 18 launched Rishtey, its second general entertainment channel, in India. | |
• | Colors programming highlights included scripted series such as Balika Vadhu, Uttaran and Madhubala and other programs such as Comedy Nights with Kapil, Bigg Boss and Jhalak Dikhhla Jaa. Rishtey programming highlights included 24, Bani and The Anupam Kher Show. | |
 | J-One | |
• | In October 2013, VIMN launched J-One, a new channel broadcasting the best in Japanese animated programming, in France, one of the world's biggest consumers of manga animation. | |
• | Programming highlights included the Shibuhara Girls, J-Pop and K-Pop music videos, Japanese MTV Unplugged concerts and award ceremonies such as the VMAJs, in partnership with MTV Asia. | |
Media Networks Competition
Our media networks generally compete with other widely distributed cable networks, the broadcast television networks and digital programming services and platforms. Our media networks compete for advertising revenue with other cable and broadcast television networks, connected outlets such as websites, apps, social media and other online experiences, radio programming and print media. Each programming service also competes for audience share with competitors’ programming services that target or include the same audience. For example, Nickelodeon’s programming and services compete with other entertainment services and platforms for younger viewers; and BET competes with African-American oriented content on cable and broadcast networks, content delivered by digital distributors and other content and platforms that include African-Americans in their audiences. We also compete with other cable networks for affiliate fees and distribution. Our networks compete with other content creators for directors, actors, writers, producers and other creative talent and for new program ideas and the acquisition of popular programming. Competition from these sources, other entertainment offerings and/or audience leisure time may affect our revenues.
FILMED ENTERTAINMENT
Our Filmed Entertainment segment produces, finances, acquires and distributes motion pictures, television programing and other entertainment content under the Paramount Pictures, Paramount Vantage, Paramount Classics, Insurge Pictures, MTV Films, Nickelodeon Movies and Paramount Television brands. Motion pictures produced, acquired and/or distributed by the Filmed Entertainment segment are exhibited theatrically domestically and internationally, followed by their release in various windows, through download-to-own, DVDs and Blu-ray discs, transactional video-on-demand, pay television and subscription video-on-demand, basic cable television, broadcast television, and syndicated television and, in some cases, by other exhibitors such as airlines and hotels (the “distribution windows”).
In fiscal year 2014, the Filmed Entertainment segment released 11 films in the domestic theatrical market. Paramount’s film strategy focuses on releases that represent a mix of key branded and franchise films and smaller productions, acquired films and distribution arrangements. Paramount releases certain of its films, including library product, in 3D format. Paramount’s film slate is designed to represent a variety of genres, styles and levels of investment and risk – with the goal of creating entertainment for both worldwide appeal and niche audiences. Paramount’s in-house animation division is focused on producing high quality animated films and expects to release its first two theatrical films in fiscal year 2015 and one or two theatrical films per year thereafter. Paramount Television™, Paramount's new television production division, draws on Paramount’s extensive library of film franchises as well as develops original programming for television and digital platforms. Paramount also focuses on developing innovative promotion and marketing approaches for its releases.
Filmed Entertainment Revenues
Our Filmed Entertainment segment generates revenues worldwide principally from: (i) the theatrical release and/or distribution of motion pictures, (ii) home entertainment, which includes sales of DVDs and Blu-ray discs relating to the motion pictures we release theatrically and direct-to-DVD, as well as content we distribute on behalf of Viacom and third parties, (iii) licensing of film exhibition rights to television services, including transactional video-on-demand, pay and basic cable television, broadcast television and syndicated television and (iv) ancillary revenues from licensing of film exhibition rights to digital platforms through download-to-own, digital transactional video-on-demand, subscription video-on-demand, providing production services to third parties, primarily at Paramount’s studio lot, licensing of its brands for consumer products and theme parks, and distribution of content specifically developed for digital platforms and game distribution. In fiscal year 2014, theatrical
10
revenues, home entertainment revenues, television license fees and ancillary revenues were approximately 32%, 23%, 29% and 15%, respectively, of total revenues for the Filmed Entertainment segment.
Theatrical
Paramount releases films theatrically in domestic and international markets and generates revenues from audience ticket sales. In addition to the traditional 2D format, certain of Paramount’s theatrical releases are made available in 3D and/or formatted for viewing on IMAX screens, tickets for which are generally sold at premium pricing. Each motion picture is a separate and distinct product with its revenues, and ultimate profitability, dependent upon many factors, among which audience response is of fundamental importance. Theatrical revenues may be also affected by the number, timing and mix of competitive releases in any given period, consumer tastes and consumption habits, and overall economic conditions, including trends in discretionary spending. The theatrical success of a motion picture is a significant factor in determining the revenues it is likely to generate in home entertainment sales and licensing fees during the various other distribution windows. Revenues from motion picture theatrical releases tend to be cyclical with increases around the holidays that fall during the first quarter of our fiscal year, and in the summer months during our fourth quarter.
Home Entertainment
Home entertainment revenues are derived from the worldwide sales, marketing and distribution of DVDs and Blu-ray discs for filmed entertainment produced by Paramount and other Viacom brands, as well as content we distribute on behalf of third parties. Our home entertainment revenues may be affected by the number, timing and mix of home entertainment releases in any given period, consumer tastes and consumption habits, the prominence given by distributors and retailers to our releases compared to those of our competitors, and overall economic conditions, including consumer preference for rental or purchase and trends in discretionary spending. The mix of our revenues from home entertainment is shifting away from physical home entertainment toward digital forms of consumption.
Television License Fees
Films produced, acquired or distributed by Paramount or our subsidiary DW Studios L.L.C. (“DW Studios”) are licensed around the world on a territory by territory basis, for a fee or on a revenue-sharing basis, to transactional video-on-demand, subscription video-on-demand, pay and basic cable television, broadcast television and syndicated television. Our joint venture with Metro-Goldwyn-Mayer Studios Inc. (“MGM Studios”) and Lions Gate Films, Inc. (“Lionsgate”) provides a multi-platform premium entertainment service named EPIX™ that offers Paramount, Lionsgate, MGM Studios and certain third party films, as well as original content, to cable, satellite, subscription video-on-demand and other subscribers through a premium pay television channel and television and digital subscription video-on-demand services.
Revenue from the licensing of films for exhibition in television markets is recognized upon availability for airing by the licensee. Revenue for video-on-demand and similar arrangements are recognized as the films are exhibited based on end-customer purchases as reported by the distributor.
Ancillary
Films produced, acquired or distributed by Paramount or DW Studios are also licensed around the world on a territory by territory basis, for a fee or on a revenue-sharing basis, to download-to-own and digital transactional video-on-demand, subscription video-on-demand and other digital platforms, including Amazon, Netflix, iTunes and Google Play. Revenue from digital license fees is recognized upon program availability and will fluctuate depending on the number and mix of available titles in any given territory.
Paramount provides production services to third parties, primarily at Paramount’s studio lot. Paramount also licenses its brands for consumer products, themed restaurants, hotels and resorts, live stage plays, film clips and theme parks. Licensing revenues are typically derived from royalties based on the licensee’s revenues, with an advance and/or guarantee against future expected royalties, and may vary based on the popularity of the brand or licensed product with consumers.
Paramount also develops original content for launch on digital distribution platforms worldwide, including made-for-digital content offered for sale and rent through third party online destinations and apps.
11
Motion Picture Production and Distribution
 |  |  |  |  |  |
Paramount produces many of the motion pictures it releases. It also acquires films for distribution from third parties and distributes films on behalf of third parties. In some cases, Paramount co-finances or co-distributes certain motion pictures with third parties, including other studios. Paramount distributes some motion pictures worldwide, and for others, a third party may distribute a picture in certain territories. Paramount also enters into film financing arrangements from time to time under which third parties participate in the financing of the production costs of a film or slate of films, typically in exchange for a partial copyright interest.
For domestic distribution, Paramount generally performs its own marketing and distribution services for theatrical releases, and its own sales and marketing services for home entertainment releases. Warner Home Video, a division of Warner Bros. Home Entertainment Inc. (“WHV”), distributes certain physical DVD and Blu-ray discs relating to certain Paramount catalog titles and an affiliate of Universal Studios, Inc. ("Universal") handles certain back-office and distribution services of physical DVD and Blu-ray discs. In the first domestic pay television distribution window, Paramount’s feature films initially theatrically released in the United States are generally exhibited on EPIX. Paramount also distributes films domestically in the other distribution windows and on various digital platforms.
In international markets, Paramount, through its international affiliates, generally distributes its motion pictures for theatrical release through its own distribution operations or, in some countries, through United International Pictures, a company that we and an affiliate of Universal own jointly. Paramount, through its international affiliates, generally distributes its home entertainment product through its own distribution operations or, in some territories, though licensees. Paramount distributes its home entertainment product in four territories through a joint venture with Twentieth Century Fox. Paramount’s home entertainment group continues to assess other possibilities for further efficiencies in international markets.
Producing, marketing and distributing a motion picture can involve significant costs, and can also cause our financial results to vary depending on the timing of a motion picture’s release. For example, marketing costs are generally incurred before and throughout the theatrical release of a film and, to a lesser extent, other distribution windows, and are expensed as incurred. Therefore, we typically incur losses with respect to a particular film prior to and during the film’s theatrical exhibition, and profitability for the film may not be realized until well after its theatrical release. Therefore, the results of the Filmed Entertainment segment can be volatile as films work their way through the various distribution windows.
Paramount’s key 2014 releases are discussed below:
• | Theatrical Releases. In fiscal year 2014, the Filmed Entertainment segment theatrically released in domestic and/or international markets Transformers: Age of Extinction, Teenage Mutant Ninja Turtles, The Wolf of Wall Street, Noah, Hercules, Anchorman 2: The Legend Continues, Jackass Presents: Bad Grandpa, Jack Ryan: Shadow Recruit and Paranormal Activity: The Marked Ones, among others. Paramount’s fiscal year 2015 slate is expected to include Interstellar, SpongeBob: Sponge Out of Water, Monster Trucks, Project Almanac, and Paranormal Activity 5, among others. | |
• | Film Library. Paramount has an extensive library consisting of approximately 1,200 motion picture titles produced by Paramount and acquired rights to approximately 2,200 additional motion pictures and a small number of television programs. The library includes many Academy Award winners such as Titanic, Braveheart, Forrest Gump, An Inconvenient Truth and There Will Be Blood and such classics as The Ten Commandments, Breakfast at Tiffany’s and Sunset Boulevard, as well as successful franchises such as Transformers, Star Trek, Mission: Impossible, Indiana Jones, Paranormal Activity and The Godfather. | |
• | Home Entertainment Releases. Key home entertainment releases in fiscal year 2014 included Transformers: Age of Extinction, Noah, The Wolf of Wall Street, Jackass Presents: Bad Grandpa, Anchorman 2: The Legend Continues, Jack Ryan: Shadow Recruit and Paranormal Activity: The Marked Ones, among others. Paramount also distributes home entertainment products for Nickelodeon, MTV, Comedy Central, BET and CBS. | |
• | Television Licensing. Key titles in fiscal year 2014 included G.I. Joe: Retaliation, Pain & Gain, Star Trek Into Darkness, World War Z, Guilt Trip, Footloose, Mission: Impossible - Ghost Protocol and Transformers: Dark of the Moon. | |
• | Digital Licensing and Entertainment. Paramount licenses its films worldwide to digital platforms such as Netflix, Amazon, iTunes and Google Play. Paramount also develops and distributes original content for launch on digital distribution platforms worldwide. | |
12
Key Agreements
In April 2013, Paramount and CBS extended the agreement under which Paramount distributes CBS’s library of television and other content on DVD and Blu-ray disc on a worldwide basis until June 2015. The parties have the option to further extend the term under certain circumstances.
Effective January 1, 2013, Paramount entered into an agreement with WHV for exclusive rights to physical DVD and Blu-ray disc distribution in North America of approximately 700 catalog titles from the Paramount film library, for which Paramount receives guaranteed and performance-based compensation. The initial term of the agreement is three years with extensions obtainable under certain circumstances. In addition, the agreement makes Paramount’s UltraViolet film offerings available on a non-exclusive basis through Flixster, the Warner Brothers movie streaming and discovery service. Paramount retains all digital rights for its titles, including electronic sell-through, video-on-demand and subscription video-on-demand.
In December 2012, the six-year output term under the agreements among Paramount, DreamWorks Animation, and certain of their affiliates, pursuant to which Paramount obtained certain exclusive distribution and home video fulfillment servicing rights to the animated films produced by DreamWorks Animation, expired. Paramount theatrically released a total of 14 DreamWorks Animation films under the applicable distribution agreement. In June 2014, Paramount sold to DreamWorks Animation the theatrical, non-theatrical, home video fulfillment and transactional digital rights to those films licensed to Paramount. Generally, Paramount continues to retain subscription and television licensing rights to those films.
Filmed Entertainment Competition
Our Filmed Entertainment segment competes for audiences for its motion pictures and other entertainment content with the motion pictures and content released by other major motion picture studios and independent film producers, as well as with other forms of entertainment and consumer spending outlets. Our competitive position primarily depends on the number and quality of the films produced, their distribution and marketing success and public response. We also compete for creative talent, including producers, actors, directors and writers, and scripts for motion pictures, all of which are essential to our success. Our motion picture brands also compete with these studios and other producers of entertainment content for distribution of motion pictures through the various distribution windows (such as television and home video) and on digital platforms.
SOCIAL RESPONSIBILITY
Viacom is deeply committed to leveraging its global stage and audience connections to improve its communities and positively impact the people the Company serves. Our social responsibility is an integral part of our day-to-day operations and is inextricably linked to our core business. Through volunteerism, philanthropic investments, initiatives and strategic partners, we drive action on the issues that are most important to our partners, employees, audiences, shareholders and communities. Viacom’s social responsibility initiatives are overseen by Viacommunity, Viacom’s social action umbrella. Community efforts are driven by the Viacom Corporate Responsibility Council (VCRC), comprised of leaders across every brand and business who shape the Company’s social efforts and numerous pro-social partnerships around the globe.
Viacom educates, engages and empowers audiences with a vast array of programs in the areas of education, health and wellness, the environment and citizenship. A full list of and detailed information about each of our social responsibility initiatives is available at www.viacommunity.com. Following are just a few examples:
 | Get Schooled | |
• | In partnership with Viacom, Get Schooled leverages the power of pop culture to inspire and empower students to graduate from high school and succeed in college. | |
 | MTV Staying Alive Foundation | |
• | Viacom International Media Networks’ Emmy Award-winning MTV Staying Alive Foundation engages in fighting the stigma, spread and threat of the HIV and AIDS epidemic through inspiring grantee projects around the world. | |
 | MTV Look Different | |
• | MTV’s “Look Different” campaign helps America’s youth better recognize and challenge hidden racial, gender and anti-LGBT biases, empowering them to create a more equal future. | |
 | VH1 Save The Music Foundation | |
• | The VH1 Save the Music Foundation is a non-profit organization dedicated to restoring instrumental music education in America's public schools, and raising awareness about the importance of music as part of each child's complete education. | |
13
 | CMT One Country | |
• | CMT One Country harnesses the collective power of individual actions, promoting civic partnership and inspiring CMT viewers to bring about important change in their communities. | |
 | CMT Empowering Education | |
• | CMT Empowering Education provides viewers with a multitude of tools to aid them in tackling and overcoming the most common perceived obstacles to education. | |
 | Nickelodeon’s The Big Help | |
• | Nickelodeon’s The Big Help engages kids to make a difference in the world by moving their bodies and minds to impact their communities and planet, through events such as its annual Worldwide Day of Play. | |
 | Veterans Operation Wellness (VOW) | |
• | VOW is a campaign driven by Spike to inspire veterans to make the same commitment to their health and wellness that they have made to their country. VOW will use the multi-platform resources of Spike to positively impact the lives of veterans with the goal of inspiring veterans - and the larger public that wants to support them - to make VOWs: commitments to lead a healthier life through physical fitness, healthier diet and veteran community activities. | |
 | Rap-It-Up | |
• | BET’s Emmy Award-winning Rap-It-Up informs, educates and empowers African-American men and women about HIV/AIDS. | |
 | Green. It’s Paramount to Us. | |
• | Paramount’s Green. It’s Paramount to Us. encourages eco-friendly behavior and business practices in the workplace. | |
 | Paramount’s Kindergarten to Cap & Gown | |
• | Paramount Pictures’ signature program supports students through their educational experience, targeting three partner schools in Paramount's Los Angeles neighborhood. | |
REGULATION AND PROTECTION OF OUR INTELLECTUAL PROPERTY
We are fundamentally a media content company, so the trademark, copyright, patent and other intellectual property laws that protect our brands and entertainment content are of paramount importance to us. See the section entitled “INTELLECTUAL PROPERTY” below for more information on our brands. Our businesses and the intellectual property they create or acquire are subject to and affected by laws and regulations of U.S. federal, state and local governmental authorities, and our international rights and operations are subject to laws and regulations of local countries and pan-national bodies such as the European Union (“EU”). The laws and regulations affecting our businesses are constantly subject to change as are the protections that those laws and regulations afford us. The discussion below does not describe all present and proposed laws and regulations affecting our businesses and other factors could arise or increase in importance.
Certain Regulations Affecting Our Business
Net Neutrality
In May 2014, the Federal Communications Commission (the “FCC”) proposed “net neutrality” rules that, subject to certain exceptions, would prohibit broadband Internet Service Providers (“ISPs”) from blocking lawful content, applications, services and devices as well as certain kinds of commercially unreasonable practices, including some discriminatory behavior. The FCC also proposed "transparency" rules that would require ISPs to disclose their network management practices. However, the FCC tentatively concluded that ISPs would not be prohibited from taking action to address unlawful activity such as copyright theft (see more on copyright theft below). The proposed rules follow a January 2014 decision by the United States Court of Appeals for the District of Columbia Circuit largely invalidating similar rules promulgated by the FCC in 2010. The failure to prohibit all forms of broadband discrimination could affect the market for streaming content to consumers, as cable programmers and other "last mile" ISPs could increase the cost for the use of bandwidth.
Children’s Programming
Since 1990, federal legislation and FCC rules have limited the amount and content of commercial matter that may be shown on cable channels during programming designed for children 12 years of age and younger. In 2006, the FCC amended its rules to limit the display of certain commercial website addresses during children’s programming. Some U.S. policymakers have sought
14
limitations on food and beverage marketing in media popular with children and teens. In April 2011, the federal Interagency Working Group on Food Marketed to Children requested comment on proposed nutritional restrictions for food and beverage marketing directed to children and teens. The proposed guidelines were not finalized. In 2013, the White House hosted a summit to encourage voluntary efforts to limit food marketing to children. If these or other similar guidelines are implemented by food and beverage marketers, they could have a negative impact on our Media Networks advertising revenues, particularly for our networks with programming targeted to children and teens. OFCOM, the independent regulator and competition authority for the United Kingdom (UK) communications industries, has restricted television advertising for foods and drinks high in fat, salt and sugar in and around programming of significant appeal to children and teens ages 15 years and under. Other governments are considering or have already implemented restrictions similar to those in the UK, including Ireland, Peru, Chile, Brazil, Mexico, Singapore and Australia.
Children’s Privacy
Various other laws and regulations intended to protect the interests of children are applicable to our businesses, including measures designed to protect the privacy of minors online. The U.S. Children’s Online Privacy Protection Act (“COPPA”) limits the collection of personal information online from children under 13 years of age by operators of websites or online services. Effective July 1, 2013, the Federal Trade Commission adopted revisions to regulations under COPPA to further expand the scope of the regulations. We have been required to limit some functionality on our websites and apps as a result of these regulations. Such regulations also limit the types of advertising we are able to sell on these sites and apps and impose strict liability for certain actions of advertisers, which could affect advertising demand and pricing. State and federal policymakers are also considering regulatory and legislative methods to protect consumer privacy on the Internet, and these efforts have focused particular attention on children and teens.
Program Access
Under the U.S. Communications Act of 1934, as amended (the “Communications Act”), vertically integrated cable programmers are generally prohibited from entering into exclusive distribution arrangements or offering different prices, terms or conditions to competing multichannel video programming distributors unless the differential is justified by certain permissible factors set forth in the regulations promulgated by the FCC. Our wholly-owned program services are not currently subject to the program access rules. Because we and CBS Corporation are under common control, each company’s businesses, as well as the businesses of any other commonly controlled company, may be attributable to the other companies for purposes of the program access rules, and therefore the businesses and conduct of CBS Corporation could have the effect of making us subject to the rules. If we were to become subject to the program access rules, our flexibility to negotiate the most favorable terms available for our content and our ability to offer cable television operators exclusive programming could be adversely affected.
Territorial Licensing in the European Union, and Consultation on EU Copyright Directive Review
In October 2011, the Court of Justice of the European Union (“CJEU”) found that the UK Football Association Premier League’s exclusive territorial licenses granted to broadcasters were contrary to EU law (including the EU competition rules) because they contained clauses that partitioned national markets by conferring absolute territorial protection. While the decision was limited to the live broadcast of sports programming (soccer games), which the CJEU held not to be copyrightable matter, the case has led European regulators to examine European territorial copyright licensing practices in greater detail. In that regard, the European Commission announced on January 13, 2014 that it had opened a formal antitrust investigation to examine certain clauses in the pay-TV licensing agreements between several major U.S. film studios, including Paramount, and the largest European pay-TV broadcasters, namely BSkyB, Canal Plus, Sky Italia, Sky Deutschland and DTS Distribuidora de Television Digital. The investigation focuses on clauses that may prevent the broadcasters from providing their services across borders within the European Economic Area (EEA). The investigation remains at an early stage but could ultimately impact the way our Filmed Entertainment and Media Networks segments license content in the EU.
Separately, in February 2013, the European Commission began a review of licensing practices among the media and telecommunications industries – known as the “Licences for Europe Consultation” – in an effort to stimulate discussion and proposed alternatives in several areas, including cross-border access and the portability of services. Viacom participated in these discussions. The European Commission’s review concluded at the end of 2013, but specific legislative proposals have been held back until the new team of European Commissioners under Commission President Juncker is confirmed by the EU Parliament later this year. These legislative proposals could ultimately affect our European businesses.
UK Private Copying Exception
In April 2014, the UK published its new private copying exception, which went into effect October 1, 2014. Under this new exception, individuals may make copies of copyrighted works for personal use without permission from copyright owners. To qualify, the copier must be an individual, must have lawfully acquired on a permanent basis the copy from which further copies are made, and the copy must be made for the individual’s private use rather than for commercial ends. The regulation permits the use of technical protection measures by copyright owners and does not generally authorize the circumvention of technical
15
protection measures. It is not yet clear what impact this regulation will have on the audio-visual industry in the UK, but both our Media Networks and Filmed Entertainment segments could be affected by this change in law.
UK Regulations Affecting Channel 5 Business
As a public service broadcaster (“PSB”) in the UK, Channel 5 is subject to certain OFCOM broadcasting regulations that impose detailed obligations including the proportion of total programming and programming during peak hours that must be original productions; the hours devoted to news and current affairs; and the proportion of commissioned programming that must be made by independent producers. Channel 5 has also undertaken to air a minimum amount of UK-originated children’s programming. Like all UK broadcasters, Channel 5 has to abide by the OFCOM Broadcasting Code, which contains content and scheduling regulations surrounding such issues as harm and offense, protection of individuals under the age of 18, privacy, fairness and product placement; and by OFCOM’s Code on the Scheduling of Television Advertising, which contains regulations surrounding the amount and scheduling of advertising. In addition, as a PSB, Channel 5 has faced threats related to the unauthorized internet re-transmission of linear programming, but the applicable law in this area remains unsettled.
Restrictions on Film Distribution
In addition to the regulations regarding territorial licensing in the EU discussed above, numerous countries around the world impose restrictions on the number and nature of films that may be distributed in that country. Such regulations in China have the greatest impact, as only 34 foreign films can be distributed annually on a revenue share basis based on box office performance. Those films are selected by relevant authorities in China (the quota was raised in 2012 from 20 films to 34 films as part of a settlement ruling by the World Trade Organization).
Protecting our Content from Copyright Theft
The unauthorized reproduction, distribution or exhibition of copyrighted material interferes with the market for copyrighted works and disrupts our ability to create, distribute and monetize our content. The theft of motion pictures, television and other entertainment content presents a significant challenge to our industry, and we take a number of steps to address this concern. Where possible, we make use of technological protection tools, such as encryption, to protect our content. We are actively engaged in enforcement and other activities to protect our intellectual property, including monitoring online destinations that distribute our content and sending takedown notices in appropriate circumstances; using filtering technologies employed by some user-generated content sites; and pursuing litigation and referrals to law enforcement against websites and online services that distribute or facilitate the distribution of our content without authorization. We also are actively engaged in educational outreach to the creative community, labor unions, state and federal government officials and other stake holders in an effort to marshal greater resources to combat copyright theft. Additionally, we participate in various industry-wide enforcement initiatives, public relations programs and legislative activity on a worldwide basis.
Notwithstanding these efforts and the many legal protections that exist to combat piracy, the proliferation of content theft and technological tools with which to carry it out continue to escalate. The failure to obtain enhanced legal protections and enforcement tools could make it more difficult for us to adequately protect our intellectual property, which could negatively impact its value and further increase the costs of enforcing our rights as we continue to expend substantial resources to protect our content.
INTELLECTUAL PROPERTY
We create, own and distribute intellectual property worldwide. It is our practice to protect our motion pictures, programs, content, brands, characters, games, publications and other original and acquired works, and ancillary goods and services. The following brands, logos, trade names, trademarks and related trademark families are a few of those strongly identified with the product lines they represent and are significant assets of the Company: Viacom®, MTV®, MTV2®, mtvU®, VH1®, VH1 Classic™, CMT®, Palladia®, Logo®, Nickelodeon®, Nick Jr.®, TeenNick®, Nicktoons®, Nick at Nite®, NickMom®, Comedy Central®, TV Land®, SPIKE®, Channel 5® (UK), BET Networks®, BET®, CENTRIC®, BET Gospel®, BET Hip Hop®, BET.com®, BET Mobile®, Tr3s®, VIVA™, Paramount Channel™, Paramount Pictures®, Paramount Vantage®, Paramount Classics®, Insurge Pictures®, MTV Films®, Nickelodeon Movies™, Paramount Animation™, Paramount Television™ and other domestic and international program services and digital properties.
EMPLOYEES AND LABOR MATTERS
As of September 30, 2014, we employed approximately 9,900 full-time and part-time employees worldwide, and had approximately 480 additional project-based staff on our payroll. We also use many other temporary employees in the ordinary course of our business.
Through in-house, affiliated and third-party production services companies, we engage the services of writers, directors, performers, various crew members and musicians who are subject to certain industry-wide and/or specially negotiated
16
collective bargaining agreements. The Alliance of Motion Picture and Television Producers (the "AMPTP"), which represents hundreds of motion picture and television producers, including Paramount Pictures, has agreements with the American guilds and unions representing writers, performers and directors and other guild-covered classifications, all of which expire in 2017. Negotiations have been scheduled with the American unions representing crew members for the agreements that expire in July 2015, as well as with the Canadian unions representing writers, performers, directors and crew, for agreements that all expire in March 2015. The AMPTP’s contract with the union that represents musicians expired in February 2013, and the parties are expected to resume negotiations in January 2015. Certain collective bargaining agreements that apply to specific companies will be negotiated in the coming years. Any labor dispute with the organizations that represent these parties could disrupt our operations and reduce our revenues.
FINANCIAL INFORMATION ABOUT SEGMENTS AND FOREIGN AND DOMESTIC OPERATIONS
Financial and other information by reporting segment and revenues by geographic area for fiscal years 2014, 2013 and 2012 are set forth in Note 21 to our Consolidated Financial Statements.
AVAILABLE INFORMATION
We file annual, quarterly and current reports, proxy and information statements and other information with the Securities and Exchange Commission (the “SEC”). Our annual reports on Form 10-K, quarterly reports on Form 10-Q, current reports on Form 8-K and any amendments to such reports filed with or furnished to the SEC pursuant to the Securities Exchange Act of 1934, as amended, will be available free of charge on our website at www.viacom.com (under “Investor Relations”) as soon as reasonably practicable after the reports are filed with the SEC. These documents are also available on the SEC’s website at www.sec.gov.
CAUTIONARY STATEMENT CONCERNING FORWARD-LOOKING STATEMENTS
This Annual Report on Form 10-K, including “Item 7. Management’s Discussion and Analysis of Results of Operations and Financial Condition,” contains both historical and forward-looking statements. All statements that are not statements of historical fact are, or may be deemed to be, forward-looking statements. Forward-looking statements reflect our current expectations concerning future results, objectives, plans and goals, and involve known and unknown risks, uncertainties and other factors that are difficult to predict and which may cause future results, performance or achievements to differ. These risks, uncertainties and other factors are discussed in “Item 1A. Risk Factors” below. Other risks, or updates to the risks discussed below, may be described in our news releases and filings with the SEC, including but not limited to our reports on Form 10-Q and Form 8-K. The forward-looking statements included in this document are made only as of the date of this document, and we do not have any obligation to publicly update any forward-looking statements to reflect subsequent events or circumstances.
Item 1A. Risk Factors.
A wide range of risks may affect our business and financial condition and results of operations, now and in the future. We consider the risks described below to be the most significant. There may be other currently unknown or unpredictable economic, business, competitive, regulatory or other factors that could have material adverse effects on our future results.
Our Success is Dependent upon Measured Audience Acceptance of our Brands, Programming, Motion Pictures and Other Entertainment Content, which is Difficult to Predict
Consumer acceptance of our brands, entertainment content and retail offerings is key to the success of our business and our ability to generate revenues. The production and distribution of programming, motion pictures and other entertainment content is inherently risky because the revenues we derive from various sources primarily depend on our content’s acceptance by the public, which is difficult to predict. Audience tastes change frequently and it is a challenge to anticipate what offerings will be successful at a certain point in time. Consumer acceptance of our content is affected by the quality and acceptance of competing entertainment content, and the availability of alternative forms of entertainment and leisure time activities, including online, mobile and other app offerings. In addition, piracy and general economic conditions affect the audience for our content.
In our Media Networks business, our advertising revenues typically are a product of measured audience size and pricing, which reflect market conditions and measurement difficulties. Depending on the success of our programming at any given time, one or more of our cable networks can experience ratings fluctuations that negatively affect our advertising revenues. Low audience ratings can also negatively affect the affiliate fees we receive and/or limit a network’s distribution potential. In addition, consumer acceptance of our brands and programming has a significant impact on the revenues we are able to generate from consumer products, home entertainment and other licensing activities. Similarly, the acceptance of our brands and programs internationally impacts our success, including our ability to expand our presence abroad.
17
In our Filmed Entertainment business, the theatrical performance of a motion picture affects not only the theatrical revenues we receive but also those from other distribution channels, such as home entertainment, television, digital and licensed consumer products.
Changes in Consumer Behavior Resulting from New Technologies and Distribution Platforms May Affect Our Viewership and Profitability in Unpredictable Ways
Technology and business models in our industry continue to evolve rapidly. Consumer behavior related to changes in content distribution and technological innovation affect our economic model and viewership in ways that are not entirely predictable.
Consumers are increasingly viewing content on a time-delayed or on-demand basis from traditional distributors, and from connected apps and websites and on a wide variety of screens, such as televisions, tablets, mobile phones and other devices. There is increased demand for short-form, user-generated and interactive content, which have different economic models than our traditional content offerings. Digital downloads, rights lockers, rentals and subscription services are competing for consumer preferences with each other and with traditional physical distribution of DVDs and Blu-ray discs. Each distribution model has different risks and economic consequences for us so the rapid evolution of consumer preferences may have an economic impact that is not completely predictable. Distribution windows are also evolving, potentially affecting revenues from other windows.
New technologies and distribution platforms are having other effects on the marketplace. For example, some of our largest distributors are combining and have gained, or may gain, market power, which could affect our ability to maximize the value of our content through those platforms. Some distributors have taken steps to limit our direct access to consumers or taken positions that they have more expansive rights than we believe we have granted, which, if they prevail, could limit our revenue opportunities and our ability to control distribution to maximize our revenue and profitability. All of these factors create uncertainty in the marketplace, and there can be no assurance that the strategies we develop to address them will be effective.
Our Businesses Operate in Highly Competitive Industries
Companies in the cable network, motion picture and digital industries depend on audience acceptance of content, appeal to advertisers and solid distribution relationships. Competition for content, audiences, advertising and distribution is intense and comes from broadcast television, other cable networks (including our own), online and mobile properties, movie studios and independent film producers and distributors, other entertainment outlets and platforms, as well as from search, social networks, program guides and “second screen” applications. Competition also comes from pirated content.
Our ability to compete successfully depends on a number of factors, including our ability to create or acquire high quality and popular programs and films, adapt to new technologies and distribution platforms, and achieve widespread distribution for our content. More content consumption options increase competition for viewers as well as for programming and creative talent which can decrease our audience ratings, and therefore potentially our advertising revenues, as well as increase our costs. In addition, our competitors include market participants with interests in multiple media businesses which are often vertically integrated, whereas our Media Networks businesses generally rely on distribution relationships with third parties. As more cable and satellite operators, ISPs, other content distributors, aggregators and search providers create or acquire their own content, they may have significant competitive advantages, which could adversely affect our ability to negotiate favorable terms or otherwise compete effectively in the delivery marketplace. Our competitors could also have preferential access to important technologies, customer data or other competitive information. There can be no assurance that we will be able to compete successfully in the future against existing or potential competitors, or that competition will not have a material adverse effect on our business, financial condition or results of operations.
Theft of Our Content, Including Digital Copyright Theft and Other Unauthorized Exhibitions of Our Content, May Decrease Revenue Received from Our Programming, Motion Pictures and Other Entertainment Content and Adversely Affect Our Businesses and Profitability
The success of our businesses depends in part on our ability to maintain and monetize our intellectual property rights to our entertainment content. We are fundamentally a content company and theft of our brands, motion pictures and home entertainment product, television programming, digital content and other intellectual property affects us and the value of our content. Copyright theft is particularly prevalent in many parts of the world that lack effective copyright and technical protective measures similar to those existing in the United States and Europe and/or that lack effective enforcement of such measures. The interpretation of copyright, piracy and other laws as applied to our content, and our piracy detection and enforcement efforts, remain in flux, and some methods of copyright enforcement have encountered political opposition. The
18
failure to strengthen and/or the weakening of existing intellectual property laws could make it more difficult for us to adequately protect our intellectual property and negatively affect its value.
Content theft is made easier by the wide availability of higher bandwidth and reduced storage costs, as well as tools that undermine encryption and other security features and enable infringers to cloak their identities online. In addition, we and our numerous production and distribution partners operate various technology systems in connection with the production and distribution of our programming and motion pictures, and intentional or unintentional acts could result in unauthorized access to our content. The increasing use of digital formats and technologies heightens this risk. Unauthorized access to our content could result in the premature release of motion pictures or television shows as well as a reduction in legitimate audiences, which would likely have significant adverse effects on the value of the affected programming.
Copyright theft has an adverse effect on our business because it reduces the revenue that we are able to receive from the legitimate sale and distribution of our content, undermines lawful distribution channels, reduces the public's perceived value of our content and inhibits our ability to recoup or profit from the costs incurred to create such works. We are actively engaged in enforcement and other activities to protect our intellectual property, and it is likely that we will continue to expend substantial resources in connection with these efforts. Efforts to prevent the unauthorized reproduction, distribution and exhibition of our content may affect our profitability and may not be successful in preventing harm to our business.
Advertising Market Conditions Could Cause Our Revenues and Operating Results to Decline Significantly in Any Given Period or in Specific Markets
We derive substantial revenues from the sale of advertising on a variety of platforms, and a decline in advertising expenditures could have a significant adverse effect on our revenues and operating results in any given period. The strength of the advertising market can fluctuate in response to the economic prospects of specific advertisers or industries, advertisers’ current spending priorities and the economy in general, and this may adversely affect our advertising revenues. In addition, the pricing and volume of advertising may be affected by shifts in spending toward online and mobile offerings from more traditional media, or toward new ways of purchasing advertising, such as through automated purchasing, dynamic advertising insertion, third parties selling local advertising spots and advertising exchanges, some or all of which may not be as advantageous to the Company as current advertising methods.
Advertising sales are dependent on audience measurement, and the results of audience measurement techniques can vary independent of the size of the audience for a variety of reasons, including variations in the employed statistical sampling methods. While Nielsen’s statistical sampling method is the primary measurement technique used in our television advertising sales, we measure and monetize our campaign reach and frequency on and across digital platforms based on other third-party data using a variety of methods including the number of impressions served and demographics, as well as upon Nielsen information. In addition, multi-platform campaign verification is in its infancy, and viewership on tablets and smartphones, which is growing rapidly, is presently not measured by any one consistently applied method. These variations and changes could have a significant effect on advertising revenues.
Advertising expenditures may also be affected by political, social or technological change. For example, Federal legislators and regulators have proposed voluntary guidelines on advertising to children in an effort to combat unhealthy eating and childhood obesity, and have considered imposing limitations on the marketing of certain movies and regulating product placement and other program sponsorship arrangements. In addition, privacy regulations make it difficult to measure viewership by children. The threat of regulatory action or increased scrutiny that deters certain advertisers from advertising could adversely affect advertising sales and revenue.
Global Economic Conditions May Have an Adverse Effect on Our Businesses
Economic conditions affect a number of aspects of our businesses worldwide, in particular revenues in both domestic and international markets derived from advertising sales, theatrical releases, home entertainment sales, television licensing and sales of consumer products. Economic conditions can impact the businesses of our partners who purchase advertising on our networks and reduce their spending on advertising. They can also negatively affect the ability of those with whom we do business to satisfy their obligations to us. In addition, increased unemployment and declines in consumer spending can reduce sales of our retail products. General worsening of global economic conditions could adversely affect our business, financial condition or results of operations, and worsening of economic conditions in certain parts of the world, specifically, could impact the expansion and success of our businesses in such areas.
19
Increased Costs for Programming, Motion Pictures and Other Rights, as Well as Judgments We Make on the Potential Performance of our Content, May Adversely Affect Our Profits and Balance Sheet
In our Media Networks segment, we have historically produced a significant amount of original programming and other content and continue to increase our investment in this area. The Filmed Entertainment segment’s core business involves the production, marketing and distribution of motion pictures, the costs of which are significant. We also acquire programming, motion pictures and television series, as well as a variety of digital content and other ancillary rights such as consumer and home entertainment product offerings from other companies, and we pay license fees, royalties or contingent compensation in connection with these acquired rights. Our investments in original and acquired programming are significant and involve complex negotiations with numerous third parties. These costs may not be recouped when the content is broadcast or distributed and higher costs may lead to decreased profitability or potential write-downs. Further, rapid changes in consumer behavior have increased the risk associated with all kinds of programming. In addition, increased competition from new entrants into the market for development and production of new content and for acquisitions is making these markets more competitive and could increase costs.
The accounting for the expenses we incur in connection with our programming, motion pictures and other content requires that we make judgments about the potential success and useful life of the program or motion picture. If our estimates prove to be incorrect, we may be forced to accelerate our recognition of the expense and/or write down the value of the asset. For example, we estimate the ultimate revenues of a motion picture before it is released based on a number of factors. Upon a film’s initial domestic theatrical release and performance, we update our estimate of ultimate revenues based on actual results. If a film is not received favorably, we may reduce our estimate of ultimate revenues, thereby accelerating the amortization of capitalized film costs. Similarly, if we determine it is no longer advantageous for us to air a program on our networks, we would accelerate our amortization of the program costs.
An increase in content acquisition costs could also affect our profits. For example, we license various music rights from the major record companies and music publishers, performing rights organizations and others. Some of these sources of music are highly consolidated and certain music costs are subject to adjudicatory procedures in courts or administrative agencies. There can be no assurance that our cost-containment efforts will be as effective as we would like or that we will recoup our investments in programming or motion pictures, which may negatively affect our profitability.
Our Revenues, Expenses and Operating Results May Vary Based on the Timing, Mix, Number and Availability of Our Motion Pictures and Other Programming and on Seasonal Factors
Our revenues, expenses and operating results fluctuate due to the timing, mix, number and availability of our theatrical motion pictures, home entertainment releases and programs for licensing. For example, our operating results may increase or decrease during a particular period due to differences in the number and/or mix of films released compared to the corresponding period in the prior year and the timing of delivery of programming to television and digital distributors. Our operating results also fluctuate due to the timing of the recognition of marketing expenses, which are typically largely incurred prior to the release of motion pictures and home entertainment product, with the recognition of related revenues in later periods.
Our business also has experienced and is expected to continue to experience seasonality due to, among other things, seasonal advertising patterns and seasonal influences on audiences’ viewing habits and attendance. Typically, our revenue from advertising increases in the first quarter of our fiscal year due to the holiday season, among other factors, and revenue from motion pictures increases in the summer and around holidays. The effects of these variances make it difficult to estimate future operating results based on the results of any specific quarter.
The Loss of Affiliation Agreements, Renewal on Less Favorable Terms or Adverse Interpretations Could Cause Our Revenues to Decline in Any Given Period or in Specific Markets
We are dependent upon our agreements with cable television, direct-to-home satellite television and telecommunications operators, subscription and advertising supported video-on-demand services, and other distributors of our programming and program services. We have agreements in place with the major cable and satellite distributors and several online content distributors, but there can be no assurance that these agreements will be renewed in the future on terms, including pricing, acceptable to us. While many consumers have a choice of distributors from which to access our content, the loss of carriage on the most widely available cable and satellite programming tiers could reduce the distribution of our programming and program services and decrease the potential audience for our programs, thereby negatively affecting our growth prospects and revenues from advertising and affiliate fees. In addition, as these affiliate agreements have grown in complexity, the number of disputes regarding the interpretation, and even validity, of the agreements has grown, resulting in greater uncertainty and, from time to
20
time, litigation seeking to circumscribe enforcement of our rights or to seek damages under competition and other laws. For more information about one such lawsuit, see “Item 3. Legal Proceedings.”
Changes in U.S. or Foreign Communications Laws, Laws Affecting Intellectual Property Rights or Other Regulations May Have an Adverse Effect on Our Business
Our program services and online, mobile and app properties are subject to a variety of laws and regulations, including those relating to intellectual property, content regulation, user privacy, data protection and consumer protection, among others. For example, there are various laws and regulations intended to protect the interests of children, including limits on the amount and content of advertising that may be shown during children’s programming and measures designed to protect the privacy of minors, which affect our Nickelodeon businesses in particular. In addition, the U.S. Congress, the FCC and foreign governments currently have under consideration, and may in the future adopt, new laws, regulations and policies regarding a wide variety of matters that could directly or indirectly affect the operations or ownership of our media properties. For example, Canada is considering "pick-and-pay" regulations. If the U.S. were to demand that our programming services be offered on an “á la carte” or tiered basis, we could experience high costs, reduced distribution of our program services, perhaps significantly, and loss of viewers on some or all of our channels. Further, Congress has initiated hearings to consider significant changes in copyright law. Our businesses could be adversely affected by any such new laws and regulations, or the threat that additional laws or regulations may be forthcoming.
In addition, the interpretation of existing laws by courts and regulators can have a significant effect on our business. Our businesses are also impacted by the laws and regulations of the foreign jurisdictions in which we, or our partners, operate, including quotas, tax regimes and currency restrictions. We could incur substantial costs to comply with new laws and regulations or substantial penalties or other liabilities if we fail to comply. We could also be required to change or limit certain of our business practices, which could impact our ability to generate revenues. Laws in some non-U.S. jurisdictions differ in significant respects from those in the United States, and the enforcement of such laws can be inconsistent and unpredictable. This could impact our ability to expand our operations and undertake activities that we believe are beneficial to our business.
We Could Be Adversely Affected by Strikes and Other Union Activity
We and our suppliers engage the services of writers, directors, actors and other talent, trade employees and others who are subject to collective bargaining agreements. Any labor disputes may disrupt our operations and reduce our revenues, and we may not be able to negotiate favorable terms for a renewal, which could increase our costs.
The Loss of Key Talent Could Disrupt Our Business and Adversely Affect Our Revenues
Our business depends upon the continued efforts, abilities and expertise of not only our corporate and divisional executive teams, but also the various creative talent and entertainment personalities we engage. For example, we employ or contract with several entertainment personalities with loyal audiences and we produce motion pictures with highly regarded directors, producers, writers, actors and other talent. These individuals are important to achieving the success of our programs, motion pictures and other content. There can be no assurance that these individuals will remain with us or will retain their current appeal, or that the costs associated with retaining talent will be reasonable. If we fail to retain these individuals on current terms or if our entertainment personalities lose their current appeal, our revenues and profitability could be adversely affected.
We Face Continually Evolving Cybersecurity and Similar Risks, Which Could Result in the Disclosure of Confidential Information, Disruption of Our Programming and Motion Picture Services, Damage to Our Brands and Reputation, Legal Exposure and Financial Losses
Our online, mobile and app offerings, as well as our internal and certain partners’ systems, involve the storage and transmission of our and our users’ proprietary and personal information, and we and our partners rely on various technology systems in connection with the production and distribution of our programming and motion pictures. Although we monitor our security measures regularly, they may be breached due to employee error, computer malware, viruses, hacking and phishing attacks, or otherwise. Additionally, outside parties may attempt to fraudulently induce employees or users to disclose sensitive or confidential information in order to gain access to our data or our users’ data. Because the techniques used to obtain unauthorized access, disable or degrade service, or sabotage systems change frequently and often are not recognized until launched against a target, we may be unable to anticipate these techniques or to implement adequate preventative measures. Any such breach or unauthorized access could result in a loss of our or our users’ proprietary information, a disruption of our services or a reduction of the revenues we are able to generate from such services, damage to our brands and reputation, a loss of confidence in the security of our offerings and services, and significant legal and financial exposure, including from
21
regulatory or consumer actions related to consumer data collection and other data privacy concerns, each of which could potentially have an adverse effect on our business.
International Political and Economic Risks Could Harm Our Financial Condition
Our businesses operate and have customers and partners worldwide, and we are focused on expanding our international operations in key markets, some of which are emerging markets. Inherent risks of doing business in international markets include, among other risks, changes in the economic and regulatory environment, export and market access restrictions, censorship, restrictions on foreign ownership or investment, currency exchange controls and/or fluctuations, regulations regarding repatriation of profits, taxation rules and procedures, tariffs or other trade barriers, permit requirements, longer payment cycles, corruption and, in some markets, increased risk of political instability, conflict and sanctions preventing us from accessing those markets. In particular, foreign currency fluctuations against the U.S. Dollar affect our results both positively and negatively, which may cause results to fluctuate. Furthermore, some foreign markets where we and our partners operate may have weaker economic conditions than the United States. For example, certain European countries have experienced significant economic downturns and related political turmoil in recent years and our operations in those regions could be significantly impacted by, among other things, reduced sales of our retail products and sharp foreign exchange movements. We also may incur substantial costs as a result of changes in the existing economic or political environment in the regions where we do business, including the imposition of new restrictions and sanctions. In addition, acts of terrorism or other hostilities, or other financial, political, economic or other uncertainties, could lead to a reduction in revenue or loss of investment, which could adversely affect our business, financial condition or results of operations.
The Failure, Destruction and/or Breach of Satellites and Facilities that We Depend Upon to Distribute Our Programming Could Adversely Affect Our Business and Results of Operations
We use satellite systems to transmit our program services to cable television operators and other distributors worldwide. The distribution facilities include uplinks, communications satellites and downlinks. Notwithstanding certain back-up and redundant systems, transmissions may be disrupted as a result of local events, such as extreme weather, that impair on-ground uplinks or downlinks, or as a result of an impairment of a satellite. Currently, there are a limited number of communications satellites available for the transmission of programming. If a disruption occurs, we may not be able to secure alternate distribution facilities in a timely manner. Failure to do so could have a material adverse effect on our business and results of operations. There can be no assurance that such failure or breach would not have an adverse effect on our financial condition.
Our Obligations Related to Guarantees, Litigation and Joint Ventures Could Adversely Impact Our Financial Condition
We have both recorded and potential liabilities and costs related to discontinued operations and former businesses, including, among other things, potential liabilities to landlords if Famous Players Inc. defaults on certain theater leases. We have also made certain investments in joint ventures and have future funding obligations, which may not be recouped until well after our initial investment, if at all. We are also involved in pending and threatened legal proceedings from time to time, the outcome of which is inherently uncertain and difficult to predict. It is uncertain at what point any of these or new liabilities may affect us, and there can be no assurance that our reserves are sufficient to cover these liabilities in their entirety or any one of these liabilities when it becomes due. Therefore, there can be no assurance that these liabilities will not have an adverse effect on our financial condition.
Through NAI’s Voting Control of Viacom and CBS Corporation, Certain Members of Management, Directors and Stockholders May Face Actual or Potential Conflicts of Interest, and NAI is in a Position to Control Actions that Require Stockholder Approval
Mr. Redstone, the controlling stockholder, Chairman and Chief Executive Officer of NAI, serves as our Executive Chairman and Founder. Shari Redstone, Mr. Redstone’s daughter, is the President and a director of NAI and serves as the non-executive Vice Chair of our Board of Directors. Philippe Dauman, our President and Chief Executive Officer, is a director of NAI, and George Abrams, one of our directors, is a director of NAI. NAI also controls CBS Corporation, with Mr. Redstone serving as its Executive Chairman and Founder and Ms. Redstone serving as its non-executive Vice Chair. Frederic Salerno, one of our directors, is also a director of CBS Corporation.
The NAI ownership structure and the common directors could create, or appear to create, potential conflicts of interest when the management, directors and controlling stockholder of the commonly controlled entities face decisions that could have different implications for each entity. For example, potential conflicts of interest could arise in connection with the resolution of any dispute between us and CBS Corporation. Potential conflicts of interest, or the appearance thereof, could also arise when we and CBS Corporation enter into any commercial arrangements with each other, despite review by our directors not affiliated
22
with CBS Corporation. Our certificate of incorporation and the CBS Corporation certificate of incorporation both contain provisions related to corporate opportunities that may be of interest to us and to CBS Corporation, and these provisions create the possibility that a corporate opportunity of one company may be used for the benefit of the other company.
In addition, NAI’s voting control of us allows it to control the outcome of corporate actions that require stockholder approval, including the election of directors and transactions involving a change in control. For so long as NAI retains voting control of us, our stockholders other than NAI will be unable to affect the outcome of our corporate actions. The interests of NAI may not be the same as the interests of our other stockholders, who must rely on our independent directors to represent their interests.
We, NAI and CBS Corporation, and our Respective Businesses, Are Attributable to Each Other for Certain Regulatory Purposes Which May Limit Business Opportunities or Impose Additional Costs
So long as we, NAI and CBS Corporation are under common control, each company’s businesses, as well as the businesses of any other commonly controlled company, may be attributable to the other companies for purposes of U.S. and non-U.S. antitrust rules and regulations, certain rules and regulations of the FCC, certain rules under the Employee Retirement Income Security Act of 1974 and certain rules regarding political campaign contributions in the United States, among others. The businesses of each company may continue to be attributable to the other companies for FCC and other purposes even after the companies cease to be commonly controlled, if the companies share common officers, directors, or attributable stockholders. As a result, the businesses and conduct of any of these other companies may have the effect of limiting the activities or strategic business alternatives available to us, including limitations to which we contractually agreed in connection with our separation from CBS Corporation, or may impose additional costs on us.
Item 1B. Unresolved Staff Comments.
Not applicable.
Item 2. Properties.
In addition to the properties described below, we own and lease office, studio, production and warehouse space and broadcast, antenna and satellite transmission facilities throughout the United States and around the world for our businesses. We consider our properties adequate for our present needs.
Viacom
• | Our world headquarters is located at 1515 Broadway, New York, New York, where we lease approximately 1.4 million square feet for executive, administrative and business offices for the Company and certain of our operating divisions. The lease runs through June 2031, with two renewal options based on market rates at the time of renewal for ten years each thereafter. |
Viacom Media Networks
• | In addition to occupying space at 1515 Broadway in New York, we lease the following major office facilities: (a) approximately 400,000 square feet at 345 Hudson Street, New York, New York, through 2022, (b) approximately 175,000 square feet at two facilities in Santa Monica, California, under leases that expire between 2016 and 2017 and (c) approximately 278,000 square feet at 1540 Broadway, New York, New York, through 2021. Viacom Media Networks’ Network Operations Center in Hauppauge, New York contains approximately 65,000 square feet of floor space on approximately 9 acres of land, and its Global Business Services Center in Franklin, Tennessee contains approximately 23,000 square feet of office space under a lease that expires in 2017. |
• | The Nickelodeon Animation Studio in Burbank, California contains approximately 140,000 square feet of studio and office space, under leases that expire between 2015 and 2018. |
• | CMT’s headquarters in Nashville, Tennessee occupies approximately 86,000 square feet of space for its executive, administrative and business offices and its studios, under leases expiring in 2020. |
• | BET's headquarters at One BET Plaza in Washington, D.C. contains approximately 192,000 square feet of office and studio space, the majority of which is leased pursuant to ground leases which we expect will be extended through 2024 (with renewal options for an additional 35 years), and the balance of which is owned. |
• | Internationally, VIMN (i) leases approximately 84,000 square feet of space in Berlin through a lease expiring in 2017 and (ii) occupies approximately 115,000 square feet of space at its owned and leased Hawley Crescent facilities in London. |
23
Filmed Entertainment
• | Paramount owns the Paramount Pictures Studio situated at 5555 Melrose Avenue, Los Angeles, California, located on approximately 62 acres of land, and containing approximately 1.85 million square feet of floor space used for executive, administrative and business offices, sound stages, production facilities, theatres, equipment facilities and other ancillary uses. Paramount has embarked on a planned 25-year expansion and revitalization project for its studio. |
• | Paramount Pictures International has offices in Chiswick, West London, where it leases approximately 45,000 square feet of space used for executive, administrative and business offices and a viewing cinema through 2017. |
Item 3. Legal Proceedings.
Litigation is inherently uncertain and always difficult to predict. However, based on our understanding and evaluation of the relevant facts and circumstances, we believe that the legal matters described below and other litigation to which we are a party are not likely, in the aggregate, to have a material adverse effect on our results of continuing operations, financial position or operating cash flows.
In February 2013, Cablevision Systems Corporation filed a lawsuit in the United States District Court for the Southern District of New York alleging that Viacom’s industry standard practice of offering discounts for additional network distribution constituted a “tying” arrangement in violation of federal and New York state antitrust laws. Similar arrangements have been upheld by numerous federal and state courts, including in a federal case in which Cablevision itself advocated for the legality of such arrangements. We believe the lawsuit is without merit. In July 2014, Viacom answered the amended complaint and asserted counterclaims against Cablevision for having fraudulently induced Viacom to renew their affiliate agreement at the end of 2012 on terms which Cablevision intended to challenge in the courts. Cablevision answered the counterclaims in September 2014.
In August 2012, a complaint was filed in the United States District Court for the District of Delaware by a Viacom Class B stockholder against us and each member of our Board of Directors. The complaint purported to be a derivative action alleging that, between 2008 and 2011, we violated the terms of our 2007 Senior Executive Short-Term Incentive Plan (the “2007 Plan”) by improperly using subjective criteria to increase the bonuses paid to Messrs. Redstone, Dauman and Dooley in each of those years. The plaintiff alleged that during this period Messrs. Redstone, Dauman and Dooley were paid more than the 2007 Plan permitted and the plaintiff sought to recover the amount of the claimed overpayment, plus interest, for the Company. The plaintiff also alleged that adoption of the Viacom 2012 Senior Executive Short-Term Incentive Plan (the “2012 Plan”) required the vote of all Viacom stockholders and not just holders of our voting Class A common stock. Accordingly, the plaintiff sought to enjoin any payment under the 2012 Plan until a new vote on that plan that included Class B stockholders occurred. In July 2013, the District Court granted our motion to dismiss the complaint. In June 2014, the United States Court of Appeals for the Third Circuit affirmed the decision of the District Court to dismiss the case, and the matter is now fully resolved.
Item 4. Mine Safety Disclosures.
Not applicable.
OUR EXECUTIVE OFFICERS
The following table sets forth the name, age and position of each person who serves as a Viacom executive officer.
Name | Age | Position |
Sumner M. Redstone | 91 | Executive Chairman of the Board and Founder |
Philippe P. Dauman | 60 | President and Chief Executive Officer; Director |
Wade Davis | 42 | Executive Vice President, Chief Financial Officer |
Thomas E. Dooley | 58 | Senior Executive Vice President and Chief Operating Officer; Director |
Carl D. Folta | 57 | Executive Vice President, Corporate Communications |
Michael D. Fricklas | 54 | Executive Vice President, General Counsel and Secretary |
Katherine Gill-Charest | 50 | Senior Vice President, Controller |
DeDe Lea | 50 | Executive Vice President, Government Relations |
Scott Mills | 46 | Executive Vice President, Human Resources and Administration |
24
Information about each of our executive officers is set forth below.
Sumner M. Redstone | Mr. Redstone has been our Executive Chairman of the Board of Directors and Founder since January 1, 2006. He has also served as Executive Chairman and Founder of CBS Corporation since January 1, 2006. He was Chairman of the Board of former Viacom Inc. (“Former Viacom”), which is now known as CBS Corporation, beginning in 1987 and Chief Executive Officer of Former Viacom from 1996 to 2005. He has been Chairman of the Board of National Amusements, Inc., our controlling stockholder, since 1986, its Chief Executive Officer since 1967 and also served as its President from 1967 through 1999. Mr. Redstone served as the first Chairman of the Board of the National Association of Theatre Owners and is currently a member of its Executive Committee. He has been a frequent lecturer at universities, including Harvard Law School, Boston University Law School and Brandeis University. Mr. Redstone graduated from Harvard University in 1944 and received an LL.B. from Harvard University School of Law in 1947. Upon graduation, he served as law secretary with the U.S. Court of Appeals and then as a special assistant to the U.S. Attorney General. Mr. Redstone served in the Military Intelligence Division during World War II. While a student at Harvard, he was selected to join a special intelligence group whose mission was to break Japan’s high-level military and diplomatic codes. Mr. Redstone received, among other honors, two commendations from the Military Intelligence Division in recognition of his service, contribution and devotion to duty, and the Army Commendation Award. |
Philippe P. Dauman | Mr. Dauman has been our President and Chief Executive Officer since September 2006 and a member of our Board of Directors since January 1, 2006, having previously served as a director of Former Viacom since 1987. Mr. Dauman was Co-Chairman and Chief Executive Officer of DND Capital Partners, L.L.C., a private equity firm specializing in media and telecommunications investments that he co-founded with Mr. Dooley, from May 2000 until September 2006. Prior to that, Mr. Dauman held several positions at Former Viacom, which he first joined in 1993, including Deputy Chairman and member of its Executive Committee. Mr. Dauman is also a director of National Amusements, Inc. and has served as a director of Lafarge S.A. since 2007. |
Wade Davis | Mr. Davis has been our Executive Vice President, Chief Financial Officer since November 27, 2012. Prior to that, he served as Executive Vice President, Strategy and Corporate Development beginning in August 2009, as Senior Vice President, Mergers & Acquisitions and Strategic Planning from January 2007 to August 2009 and as Senior Vice President of Mergers & Acquisitions beginning January 1, 2006. Prior to joining Viacom, Mr. Davis was an investment banker in the technology and media sectors for more than a decade. |
Thomas E. Dooley | Mr. Dooley has been our Senior Executive Vice President since September 2006, our Chief Operating Officer since May 2010 and a member of our Board of Directors since January 1, 2006. He served as our Chief Administrative Officer from September 2006 to May 2010 and as our Chief Financial Officer from January 2007 to September 2010. Mr. Dooley was Co-Chairman and Chief Executive Officer of DND Capital Partners, L.L.C., a private equity firm specializing in media and telecommunications investments that he co-founded with Mr. Dauman, from May 2000 until September 2006. Before that, Mr. Dooley held various corporate and divisional positions at Former Viacom, which he first joined in 1980, including Deputy Chairman and member of its Executive Committee. Mr. Dooley served as a director of Sapphire Industrials Corp. from 2007 to 2010. |
25
Carl D. Folta | Mr. Folta has been our Executive Vice President, Corporate Communications since November 2006. Prior to that, he served as Executive Vice President, Office of the Chairman beginning January 1, 2006. He has served in senior communications positions with the Company since April 1994 and was appointed Executive Vice President, Corporate Relations, of Former Viacom in November 2004. Mr. Folta held various communications positions at Paramount Communications Inc., a predecessor, from 1984 to 1994. |
Michael D. Fricklas | Mr. Fricklas has been our Executive Vice President, General Counsel and Secretary since January 1, 2006. Prior to that, he was Executive Vice President, General Counsel and Secretary of Former Viacom beginning in May 2000 and Senior Vice President, General Counsel and Secretary from October 1998 to May 2000. He first joined Former Viacom in July 1993, serving as Vice President and Deputy General Counsel and assuming the title of Senior Vice President in July 1994. |
Katherine Gill-Charest | Ms. Gill-Charest has been our Senior Vice President, Controller and Chief Accounting Officer since October 1, 2010. Prior to that, she was Senior Vice President, Deputy Controller beginning in April 2010 and Vice President, Deputy Controller from May 2007 to April 2010. Prior to joining Viacom, Ms. Gill-Charest served as Chief Accounting Officer of WPP Group USA from November 2005 to May 2007 and as its Vice President, Group Reporting from February 2001 to November 2005. |
DeDe Lea | Ms. Lea has been our Executive Vice President, Government Relations since January 1, 2006. Previously, she was Senior Vice President, Government Relations of Former Viacom beginning in September 2005. Prior to that, she served as Vice President of Government Affairs at Belo Corp. from 2004 to 2005 and as Vice President, Government Affairs of Former Viacom from 1997 to 2004. |
Scott Mills | Mr. Mills has been our Executive Vice President, Human Resources and Administration since October 1, 2012. Previously, he was President and Chief Operating Officer of BET Networks beginning in July 2007. Prior to that, he served as President of Digital Media for BET Networks from August 2006 to July 2007 and as Chief Financial Officer of BET Networks beginning in 2003. He first joined BET Networks in 1997, serving as Senior Vice President of Strategy & Business Development, and served as Executive Vice President and Chief Operating Officer of BET Interactive from 1999 to 2003. |
26
PART II
Item 5. Market for Viacom Inc.’s Common Equity, Related Stockholder Matters and Issuer Purchases of Equity Securities.
Our voting Class A common stock and non-voting Class B common stock are listed and traded on The NASDAQ Global Select Market under the symbols “VIA” and “VIAB”, respectively.
The table below shows, for the periods indicated, the high and low sales prices per share of our Class A and Class B common stock as reported in Thomson Financial markets services.
Sales Price | |||||||
Low | High | ||||||
Class A common stock – Fiscal 2014 | |||||||
4th Quarter | $ | 76.65 | $ | 89.64 | |||
3rd Quarter | $ | 81.35 | $ | 88.47 | |||
2nd Quarter | $ | 78.70 | $ | 89.30 | |||
1st Quarter | $ | 79.01 | $ | 88.20 | |||
Class A common stock – Fiscal 2013 | |||||||
4th Quarter | $ | 67.44 | $ | 85.44 | |||
3rd Quarter | $ | 62.10 | $ | 71.58 | |||
2nd Quarter | $ | 55.20 | $ | 66.73 | |||
1st Quarter | $ | 48.12 | $ | 57.56 | |||
Class B common stock – Fiscal 2014 | |||||||
4th Quarter | $ | 76.52 | $ | 89.76 | |||
3rd Quarter | $ | 81.19 | $ | 88.50 | |||
2nd Quarter | $ | 78.43 | $ | 89.27 | |||
1st Quarter | $ | 78.83 | $ | 87.84 | |||
Class B common stock – Fiscal 2013 | |||||||
4th Quarter | $ | 66.82 | $ | 85.22 | |||
3rd Quarter | $ | 60.82 | $ | 70.91 | |||
2nd Quarter | $ | 53.86 | $ | 64.71 | |||
1st Quarter | $ | 47.61 | $ | 56.91 | |||
During fiscal 2014 and 2013, our Board of Directors declared the following cash dividends to stockholders of record on both our voting Class A common stock and non-voting Class B common stock:
Declaration Date | Dividend per Share | Record Date | Payment Date | ||
July 22, 2014 | $0.330 | September 15, 2014 | October 1, 2014 | ||
May 21, 2014 | $0.330 | June 13, 2014 | July 1, 2014 | ||
January 16, 2014 | $0.300 | March 14, 2014 | April 1, 2014 | ||
November 13, 2013 | $0.300 | December 13, 2013 | December 31, 2013 | ||
July 23, 2013 | $0.300 | September 13, 2013 | October 1, 2013 | ||
May 22, 2013 | $0.300 | June 14, 2013 | July 1, 2013 | ||
January 17, 2013 | $0.275 | March 15, 2013 | April 1, 2013 | ||
November 14, 2012 | $0.275 | December 15, 2012 | December 31, 2012 | ||
As of November 5, 2014, there were 1,504 record holders of our Class A common stock and 23,042 record holders of our Class B common stock.
27
Performance Graph
The following graph compares the cumulative total stockholder return of our Class A common stock and our Class B common stock with the cumulative total stockholder return of the companies listed in the Standard & Poor’s 500 Index and a peer group of companies comprised of The Walt Disney Company, Twenty-First Century Fox Inc. (News Corporation prior to June 2013), Time Warner Inc., CBS Corporation, Discovery Communications, Inc. and Scripps Network Interactive Inc.
The performance graph assumes $100 invested on December 31, 2009 in each of our Class A common stock, our Class B common stock, the S&P 500 Index and the stock of our peer group companies, including reinvestment of dividends, for the nine months ended September 30, 2010, and the years ended September 30, 2011, 2012, 2013 and 2014.
Total Cumulative Stockholder Return
For the Nine Months Ended September 30, 2010
and the Years Ended September 30, 2011, 2012, 2013 and 2014
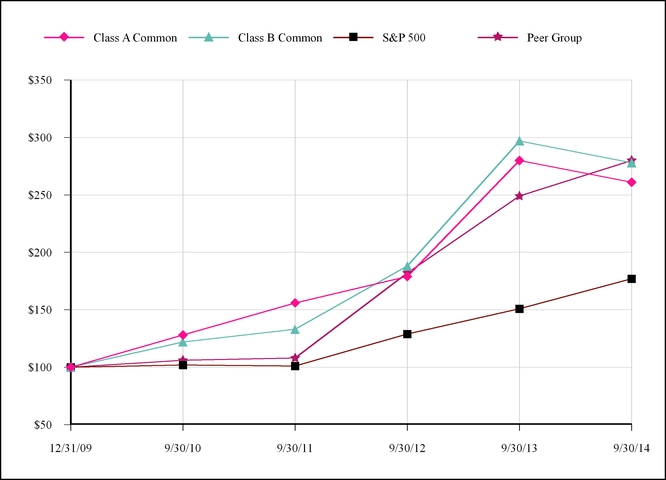
12/31/09 | 9/30/10 | 9/30/11 | 9/30/12 | 9/30/13 | 9/30/14 | |||||||
Class A Common | $100 | $128 | $156 | $179 | $280 | $261 | ||||||
Class B Common | $100 | $122 | $133 | $188 | $297 | $278 | ||||||
S&P 500 | $100 | $102 | $101 | $129 | $151 | $177 | ||||||
Peer Group | $100 | $106 | $108 | $182 | $249 | $280 | ||||||
28
Share Repurchases
The following table provides information about our purchases of Viacom Class B common stock during the quarter ended September 30, 2014 under our publicly announced stock repurchase program.
Open Market Purchases | Total Number of Shares Purchased (thousands) | Average Price Paid per Share (dollars) | Total Number of Shares Purchased as Part of Publicly Announced Plans or Programs (1) (thousands) | Approximate Dollar Value of Shares that May Yet Be Purchased Under Program (millions) | |||||
Month ended July 31, 2014 | 2,307 | $86.67 | 2,307 | $7,150 | |||||
Month ended August 31, 2014 | 4,330 | $80.75 | 4,330 | $6,800 | |||||
Month ended September 30, 2014 | 3,783 | $79.40 | 3,783 | $6,500 | |||||
Total | 10,420 | 10,420 | |||||||
(1) There is no expiration date for the program.
Equity Compensation Plan Information
Information required by this item will be contained in the Proxy Statement for our 2015 Annual Meeting of Stockholders under the heading “Equity Compensation Plan Information,” which information is incorporated herein by reference.
Item 6. Selected Financial Data.
The selected Consolidated Statement of Earnings data for the years ended September 30, 2014, 2013 and 2012 and the Consolidated Balance Sheet data as of September 30, 2014 and 2013 should be read in conjunction with the audited financial statements, Management’s Discussion and Analysis of Results of Operations and Financial Condition and other financial information presented elsewhere in this report. The selected Consolidated Statement of Earnings data for the year ended September 30, 2011 and the nine months ended September 30, 2010 and the Consolidated Balance Sheet data as of September 30, 2012, 2011 and 2010 have been derived from audited financial statements not included herein.
CONSOLIDATED STATEMENT OF EARNINGS DATA
Year Ended September 30, | Nine Months Ended September 30, 2010 | ||||||||||||||||||
(in millions, except per share amounts) | 2014 | 2013 | 2012 | 2011 | |||||||||||||||
Revenues | $ | 13,783 | $ | 13,794 | $ | 13,887 | $ | 14,914 | $ | 9,337 | |||||||||
Operating income | $ | 4,082 | $ | 3,836 | $ | 3,901 | $ | 3,710 | $ | 2,207 | |||||||||
Net earnings from continuing operations (Viacom and noncontrolling interests) | $ | 2,464 | $ | 2,449 | $ | 2,385 | $ | 2,183 | $ | 1,185 | |||||||||
Net earnings from continuing operations attributable to Viacom | $ | 2,392 | $ | 2,407 | $ | 2,345 | $ | 2,146 | $ | 1,175 | |||||||||
Net earnings from continuing operations per share attributable to Viacom: | |||||||||||||||||||
Basic | $ | 5.54 | $ | 4.95 | $ | 4.42 | $ | 3.65 | $ | 1.93 | |||||||||
Diluted | $ | 5.43 | $ | 4.86 | $ | 4.36 | $ | 3.61 | $ | 1.92 | |||||||||
Weighted average number of common shares outstanding: | |||||||||||||||||||
Basic | 432.1 | 486.2 | 530.7 | 587.3 | 608.0 | ||||||||||||||
Diluted | 440.2 | 494.8 | 537.5 | 594.3 | 610.7 | ||||||||||||||
Dividends declared per share of Class A and Class B common stock | $ | 1.26 | $ | 1.15 | $ | 1.05 | $ | 0.80 | $ | 0.30 | |||||||||
29
CONSOLIDATED BALANCE SHEET DATA
September 30, | |||||||||||||||||||
(in millions) | 2014 | 2013 | 2012 | 2011 | 2010 | ||||||||||||||
Total assets | $ | 23,117 | $ | 23,829 | $ | 22,250 | $ | 22,801 | $ | 22,096 | |||||||||
Total debt | $ | 12,769 | $ | 11,885 | $ | 8,149 | $ | 7,365 | $ | 6,752 | |||||||||
Total Viacom stockholders' equity | $ | 3,719 | $ | 5,193 | $ | 7,448 | $ | 8,644 | $ | 9,283 | |||||||||
Total equity | $ | 3,747 | $ | 5,190 | $ | 7,439 | $ | 8,633 | $ | 9,259 | |||||||||
Item 7. Management’s Discussion and Analysis of Results of Operations and Financial Condition.
Management’s discussion and analysis of results of operations and financial condition is provided as a supplement to and should be read in conjunction with the consolidated financial statements and related notes to enhance the understanding of our results of operations, financial condition and cash flows. References in this document to “Viacom,” “Company,” “we,” “us” and “our” mean Viacom Inc. and our consolidated subsidiaries, unless the context requires otherwise.
Significant components of the management’s discussion and analysis of results of operations and financial condition section include:
Page | ||
• | Overview: The overview section provides a summary of Viacom and our reportable business segments and the principal factors affecting our results of operations. | |
• | Results of Operations: The results of operations section provides an analysis of our results on a consolidated and reportable segment basis for the three years ended September 30, 2014. In addition, we provide a discussion of items affecting the comparability of our results of operations. | |
• | Liquidity and Capital Resources: The liquidity and capital resources section provides a discussion of our cash flows for the three years ended September 30, 2014, and of our outstanding debt, commitments and contingencies existing as of September 30, 2014. | |
• | Market Risk: The market risk section discusses how we manage exposure to market and interest rate risks. | |
• | Critical Accounting Policies and Estimates: The critical accounting policies and estimates section provides detail with respect to accounting policies that are considered by management to require significant judgment and use of estimates and that could have a significant impact on our financial statements. | |
• | Other Matters: The other matters section provides a discussion of related party transactions and agreements. | |
OVERVIEW
Summary
We are a leading global entertainment content company that connects with audiences in more than 165 countries and territories and creates compelling television programs, motion pictures, short-form video, apps, games, brands for consumer products, social media and other entertainment content.
We operate through two reporting segments: Media Networks and Filmed Entertainment. Our measure of segment performance is adjusted operating income (loss). We define adjusted operating income (loss) for our segments as operating income (loss), before equity-based compensation and certain other items identified as affecting comparability, including restructuring, asset impairments and other charges, when applicable. Equity-based compensation is excluded from our segment measure of performance since it is set and approved by the Compensation Committee of Viacom’s Board of Directors in consultation with corporate executive management, and is included as a component of consolidated adjusted operating income.
When applicable, we use consolidated adjusted operating income, adjusted net earnings from continuing operations attributable to Viacom and adjusted diluted earnings per share (“EPS”) from continuing operations, among other measures, to evaluate our actual operating performance and for planning and forecasting of future periods. We believe that the adjusted results provide
30
Management’s Discussion and Analysis
of Results of Operations and Financial Condition
(continued)
relevant and useful information for investors because they clarify our actual operating performance, make it easier to compare our results with those of other companies and allow investors to review performance in the same way as our management. Since these are not measures of performance calculated in accordance with accounting principles generally accepted in the United States of America (“GAAP”), they should not be considered in isolation of, or as a substitute for, operating income, net earnings from continuing operations attributable to Viacom and diluted EPS as indicators of operating performance and they may not be comparable to similarly titled measures employed by other companies. For a reconciliation of our adjusted measures and discussion of the items affecting comparability, refer to the section entitled “Factors Affecting Comparability”.
Media Networks
Our Media Networks segment, which includes brands such as MTV, VH1, CMT, Logo, BET, CENTRIC, Nickelodeon, Nick Jr., TeenNick, Nicktoons, Nick at Nite, Comedy Central, TV Land, SPIKE, Channel 5 (UK), Tr3s, the Paramount Channel and VIVA, among others, provides entertainment content and related branded products for consumers in targeted demographics attractive to advertisers, content distributors and retailers. We create, acquire and distribute programming and other content to our audiences across multiple platforms, which allows our audiences to engage and interact with our content in a variety of ways: through traditional cable and satellite distribution, on connected TVs, PCs, tablets and other mobile devices, and using apps, browsers and other interfaces.
Our Media Networks segment generates revenues in three categories: (i) the sale of advertising and marketing services related to our content, (ii) affiliate fees from multichannel television service providers, including cable television operators, direct-to-home satellite television operators and telecommunications operators, subscription and advertising supported video-on-demand services, and other distributors of our programming and program services, and (iii) ancillary revenues, which include consumer products licensing, brand licensing, sale of content on DVDs and Blu-ray discs, licensing of our content for download-to-own and download-to-rent services and television syndication.
Demand and pricing for our advertising depend on our ratings and overall market conditions. We also drive additional demand through integrated sales of digital advertising inventory and through our marketing services, providing unique branded entertainment and custom sponsorship opportunities to our advertisers. Our advertising revenues may be affected by the strength of advertising markets and general economic conditions and may fluctuate depending on the success of our programming, as measured by viewership, at any given time. Audience measurement ratings may vary due to the timing of availability of new episodes of popular programming, success of our programming and performance of competing programs and other entertainment alternatives for viewers, as well as variations related to the methods used by third parties to measure ratings. Advertising revenues may also fluctuate due to seasonal variations, the timing of holidays and significant programming events such as awards shows or premieres. Typically, advertising revenues are highest in the first and fourth quarters of our fiscal year.
Affiliate revenue agreements with multichannel television service providers are generally multi-year carriage agreements with set rate increases that provide us with a reasonably stable source of revenues. The amount of the fees we receive is generally a function of the number of subscribers and the rates we receive per subscriber. Expirations of these affiliate agreements are staggered. Certain other distribution agreements include multiple programs made available for distribution on one or more dates and revenue under such arrangements fluctuates depending on the initial availability of the programs licensed.
Our ancillary revenues vary based on consumer spending, the popularity of our programming, volume of content available for sale during a particular period and acceptance of our or our partners’ products.
Media Networks segment expenses consist of operating expenses, selling, general and administrative (“SG&A”) expenses and depreciation and amortization. Operating expenses are comprised of costs related to original and acquired programming, including programming amortization, expenses associated with the distribution of home entertainment products and consumer products licensing, participation fees, integrated marketing expenses and other costs of sales. SG&A expenses consist primarily of employee compensation, marketing, research and professional service fees and facility and occupancy costs. Depreciation and amortization expenses reflect depreciation of fixed assets, including transponders financed under capital leases, and amortization of finite-lived intangible assets.
Filmed Entertainment
Our Filmed Entertainment segment produces, finances, acquires and distributes motion pictures, television programming and other entertainment content under the Paramount Pictures, Paramount Vantage, Paramount Classics, Insurge Pictures, MTV Films, Nickelodeon Movies and Paramount Television brands. Paramount Television, a new television production division, is focused on developing programming for television and digital platforms.
31
Management’s Discussion and Analysis
of Results of Operations and Financial Condition
(continued)
Motion pictures produced, acquired and/or distributed by the Filmed Entertainment segment are exhibited theatrically domestically and internationally, followed by their release in various windows, through download-to-own, DVDs and Blu-ray discs, transactional video-on-demand, pay television and subscription video-on-demand, basic cable television, broadcast television, and syndicated television and, in some cases, by other exhibitors such as airlines and hotels (the “distribution windows”).
Our Filmed Entertainment segment generates revenues worldwide principally from: (i) the theatrical release and/or distribution of motion pictures, (ii) home entertainment, which includes sales of DVDs and Blu-ray discs relating to the motion pictures we release theatrically and direct-to-DVD, as well as content distributed on behalf of Viacom and third parties, (iii) licensing of film exhibition rights to television services, including transactional video-on-demand, pay and basic cable television, broadcast television and syndicated television and (iv) ancillary revenues from licensing of film exhibition rights to digital platforms through subscription video-on-demand, download-to-own, digital transactional video-on-demand, providing production services to third parties, primarily at Paramount’s studio lot, licensing of its brands for consumer products and theme parks, and distribution of content specifically developed for digital platforms and game distribution.
Paramount releases films theatrically in domestic and international markets and generates revenues from audience ticket sales. Each motion picture is a separate and distinct product with its revenues, and ultimate profitability, dependent upon many factors, among which audience response is of fundamental importance. Theatrical revenues may be also affected by the number, timing and mix of competitive releases in any given period, consumer tastes and consumption habits, and overall economic conditions, including trends in discretionary spending. The theatrical success of a motion picture is a significant factor in determining the revenues it is likely to generate in home entertainment sales and licensing fees during the various other distribution windows. Revenues from motion picture theatrical releases tend to be cyclical with increases around the holidays that fall during the first quarter of our fiscal year, and in the summer months during our fourth quarter. Our home entertainment revenues may be affected by the number, timing and mix of home entertainment releases in any given period, consumer tastes and consumption habits, the prominence given by distributors and retailers to our releases compared to those of our competitors, and overall economic conditions, including consumer preference for rental or purchase and trends in discretionary spending. The mix of our revenues from home entertainment is shifting away from physical home entertainment toward digital forms of consumption.
Filmed Entertainment segment expenses consist of operating expenses, SG&A expenses and depreciation and amortization. Operating expenses principally include the amortization of film costs of our released feature films (including participations and residuals), print and advertising expenses and other distribution costs. We incur marketing costs before and throughout the theatrical release of a film and, to a lesser extent, other distribution windows. Such costs are incurred to generate public interest in our films and are expensed as incurred; therefore, we typically incur losses with respect to a particular film prior to and during the film’s theatrical exhibition and profitability may not be realized until well after a film’s theatrical release. Therefore, the results of the Filmed Entertainment segment can be volatile as films work their way through the various distribution windows. SG&A expenses include employee compensation, facility and occupancy costs, professional service fees and other overhead costs. Depreciation and amortization expense principally consists of depreciation of fixed assets.
RESULTS OF OPERATIONS
YEAR ENDED SEPTEMBER 30, 2014 vs. 2013
Consolidated Results of Operations
Our summary consolidated results of operations are presented below for the years ended September 30, 2014 and 2013.
Year Ended September 30, | Better/(Worse) | |||||||||||||
(in millions, except per share amounts) | 2014 | 2013 | $ | % | ||||||||||
Revenues | $ | 13,783 | $ | 13,794 | $ | (11 | ) | — | % | |||||
Operating income | 4,082 | 3,836 | 246 | 6 | ||||||||||
Adjusted operating income | 4,125 | 3,942 | 183 | 5 | ||||||||||
Net earnings from continuing operations attributable to Viacom | 2,392 | 2,407 | (15 | ) | (1 | ) | ||||||||
Adjusted net earnings from continuing operations attributable to Viacom | 2,376 | 2,316 | 60 | 3 | ||||||||||
Diluted EPS from continuing operations | 5.43 | 4.86 | 0.57 | 12 | ||||||||||
Adjusted diluted EPS from continuing operations | $ | 5.40 | $ | 4.68 | $ | 0.72 | 15 | % | ||||||
32
Management’s Discussion and Analysis
of Results of Operations and Financial Condition
(continued)
See the section entitled “Factors Affecting Comparability” for a reconciliation of our adjusted measures to our reported results.
Revenues
Worldwide revenues were substantially flat at $13.783 billion in the year ended September 30, 2014. Filmed Entertainment revenues decreased $557 million, principally due to lower revenues across the distribution windows reflecting the number and mix of films. Media Networks contributed a partially offsetting increase in revenues of $515 million principally reflecting higher affiliate fees and advertising revenues.
Operating Income
Adjusted operating income increased $183 million, or 5%, to $4.125 billion in the year ended September 30, 2014. Media Networks adjusted operating income increased $175 million, reflecting higher revenues, partially offset by an increase in expenses. Filmed Entertainment adjusted operating income decreased $29 million, reflecting the benefit of Marvel distribution rights sales in the prior year. Corporate expenses decreased 10% in the period, primarily due to lower deferred compensation costs. Adjusted results exclude the impact of a $43 million non-cash impairment charge in 2014 and the impact of $106 million of restructuring, asset impairment and other charges in 2013. Including these items in both years, operating income increased $246 million, or 6%.
See the section entitled “Segment Results of Operations” for a more in-depth discussion of the revenues, expenses and adjusted operating income for each of the Media Networks and Filmed Entertainment segments.
Net Earnings from Continuing Operations Attributable to Viacom
Adjusted net earnings from continuing operations attributable to Viacom increased $60 million, or 3%, to $2.376 billion in the year ended September 30, 2014. The increase in tax-effected adjusted operating income described above, higher equity in net earnings of investee companies and a lower effective income tax rate were partially offset by an increase in interest expense, reflecting higher levels of debt outstanding, and higher net earnings attributable to noncontrolling interests, which includes the renewal of a content distribution arrangement at a consolidated majority-owned joint venture.
Our effective income tax rate was 31.4% in 2014, as compared with 32.9% in 2013, excluding the impact of discrete tax items. The decrease in the effective income tax rate is principally due to incremental tax benefits associated with qualified production activities, as well as a change in the mix of domestic and international income.
Adjusted diluted EPS from continuing operations increased $0.72 per diluted share to $5.40, reflecting fewer outstanding shares and the impact of higher tax-effected adjusted operating income, partially offset by an increase in interest expense.
In addition to the operating items mentioned above, adjusted net earnings from continuing operations attributable to Viacom exclude a loss on the extinguishment of debt in 2014 and gains from the sales of our 20% interest in HBO Pacific Partners, V.O.F. (“HBO Pacific Partners”) and our 22.5% interest in LAPTV, LLC (“LAPTV”) in 2013, as well as discrete taxes in both years.
Including these items in both years, net earnings from continuing operations attributable to Viacom decreased $15 million, or 1%, and diluted EPS from continuing operations increased $0.57 per diluted share to $5.43.
Segment Results of Operations
Transactions between reportable segments are accounted for as third-party arrangements for the purposes of presenting segment results of operations. Typical intersegment transactions include the purchase of advertising by the Filmed Entertainment segment on Media Networks’ properties and the purchase of Filmed Entertainment’s feature films exhibition rights by Media Networks.
33
Management’s Discussion and Analysis
of Results of Operations and Financial Condition
(continued)
Media Networks
Year Ended September 30, | Better/(Worse) | |||||||||||||
(in millions) | 2014 | 2013 | $ | % | ||||||||||
Revenues by Component | ||||||||||||||
Advertising | $ | 4,953 | $ | 4,855 | $ | 98 | 2 | % | ||||||
Affiliate fees | 4,660 | 4,245 | 415 | 10 | ||||||||||
Ancillary | 558 | 556 | 2 | — | ||||||||||
Total revenues by component | $ | 10,171 | $ | 9,656 | $ | 515 | 5 | % | ||||||
Expenses | ||||||||||||||
Operating | $ | 3,622 | $ | 3,405 | $ | (217 | ) | (6 | )% | |||||
Selling, general and administrative | 2,130 | 2,011 | (119 | ) | (6 | ) | ||||||||
Depreciation and amortization | 148 | 144 | (4 | ) | (3 | ) | ||||||||
Total expenses | $ | 5,900 | $ | 5,560 | $ | (340 | ) | (6 | ) | |||||
Adjusted Operating Income | $ | 4,271 | $ | 4,096 | $ | 175 | 4 | % | ||||||
Revenues
Worldwide revenues increased $515 million, or 5%, to $10.171 billion in the year ended September 30, 2014, driven primarily by higher affiliate fees and advertising revenues. Domestic revenues were $8.625 billion, an increase of $361 million, or 4%. International revenues were $1.546 billion, an increase of $154 million, or 11%, with foreign exchange having a 2-percentage point favorable impact.
Advertising
Worldwide advertising revenues increased $98 million, or 2%, to $4.953 billion in the year ended September 30, 2014. Domestic advertising revenues were flat. International advertising revenues increased 20%, including the acquisition of Channel 5 Broadcasting Limited ("Channel 5"), which contributed 6 percentage points. The remaining increase was driven by new channels, including MTV Italy, and European market improvements. Foreign exchange had a 3-percentage point favorable impact on international advertising revenues.
Affiliate Fees
Worldwide affiliate fees increased $415 million, or 10%, to $4.660 billion in the year ended September 30, 2014, primarily driven by rate increases, as well as the benefit of distribution arrangements which are affected by the timing of available programming. Domestic affiliate revenues increased 10% and international revenues increased 9%. Foreign exchange had a 2-percentage point favorable impact on international affiliate revenues.
Expenses
Media Networks segment expenses increased $340 million, or 6%, to $5.900 billion in the year ended September 30, 2014, driven by higher operating and SG&A expenses.
Operating
Operating expenses increased $217 million, or 6%, to $3.622 billion in the year ended September 30, 2014. Due to our continuing investment in original content, programming costs increased $179 million, or 6%. Distribution and other expenses increased $38 million, or 10%, primarily driven by higher participations expense and costs from new channels in international markets.
Selling, General and Administrative
SG&A expenses increased $119 million, or 6%, to $2.130 billion in the year ended September 30, 2014, principally driven by higher advertising and promotional expenses related to marketing original programming, as well as increased expenses resulting from new channels in international markets.
Adjusted Operating Income
Adjusted operating income increased $175 million, or 4%, to $4.271 billion in the year ended September 30, 2014, reflecting higher revenues partially offset by higher expenses as discussed above.
34
Management’s Discussion and Analysis
of Results of Operations and Financial Condition
(continued)
Filmed Entertainment
Year Ended September 30, | Better/(Worse) | |||||||||||||
(in millions) | 2014 | 2013 | $ | % | ||||||||||
Revenues by Component | ||||||||||||||
Theatrical | $ | 1,209 | $ | 1,239 | $ | (30 | ) | (2 | )% | |||||
Home entertainment | 872 | 1,300 | (428 | ) | (33 | ) | ||||||||
Television license fees | 1,092 | 1,203 | (111 | ) | (9 | ) | ||||||||
Ancillary | 552 | 540 | 12 | 2 | ||||||||||
Total revenues by component | $ | 3,725 | $ | 4,282 | $ | (557 | ) | (13 | )% | |||||
Expenses | ||||||||||||||
Operating | $ | 3,031 | $ | 3,516 | $ | 485 | 14 | % | ||||||
Selling, general and administrative | 425 | 443 | 18 | 4 | % | |||||||||
Depreciation and amortization | 64 | 89 | 25 | 28 | % | |||||||||
Total expenses | $ | 3,520 | $ | 4,048 | $ | 528 | 13 | % | ||||||
Adjusted Operating Income | $ | 205 | $ | 234 | $ | (29 | ) | (12 | )% | |||||
Revenues
Worldwide revenues decreased $557 million, or 13%, to $3.725 billion in the year ended September 30, 2014, principally due to lower revenues across the distribution windows reflecting the number and mix of films. Domestic revenues were $1.721 billion, a decrease of $300 million, or 15%. International revenues were $2.004 billion, a decrease of $257 million, or 11%, with 1-percentage point of decline resulting from foreign exchange.
Theatrical
Worldwide theatrical revenues decreased $30 million, or 2%, to $1.209 billion in the year ended September 30, 2014. Carryover revenues from the prior period were $55 million lower. Revenues from our current year releases were $25 million higher than the prior year, driven by the mix of titles released. During the year, we released eleven films, including Transformers: Age of Extinction, Teenage Mutant Ninja Turtles, Noah, Hercules, Anchorman 2: The Legend Continues, Jackass: Bad Grandpa, The Wolf of Wall Street, Jack Ryan: Shadow Recruit, and Paranormal Activity: The Marked Ones, compared to thirteen films in the prior year. The prior year included the release of World War Z, Star Trek into Darkness and G.I. Joe: Retaliation. Domestic theatrical revenues increased 2% due to the strength of our current year releases, while international revenues decreased 6%. Foreign exchange had a 2-percentage point unfavorable impact on international theatrical revenues.
Home Entertainment
Worldwide home entertainment revenues decreased $428 million, or 33%, to $872 million in the year ended September 30, 2014, driven by lower revenues from our current year releases of $330 million due to the number and mix of titles released and lower carryover and catalog revenues of $98 million. In the current year, we released nine titles, including Transformers: Age of Extinction, Noah, The Wolf of Wall Street, Jackass: Bad Grandpa, Anchorman 2: The Legend Continues, Jack Ryan: Shadow Recruit and Paranormal Activity: The Marked Ones. In the prior year period, we released fourteen titles, including Madagascar 3: Europe’s Most Wanted, Star Trek into Darkness, Rise of the Guardians, G.I. Joe: Retaliation and World War Z. Domestic and international home entertainment revenues decreased 41% and 23%, respectively. Foreign exchange had a 1-percentage point unfavorable impact on international home entertainment revenues.
Television License Fees
Television license fees decreased $111 million, or 9%, to $1.092 billion in the year ended September 30, 2014, primarily driven by lower international syndication revenues due to mix of available titles.
Ancillary
Ancillary revenues increased $12 million, or 2%, to $552 million in the year ended September 30, 2014, reflecting higher revenues from licensing films through digital platforms and consumer products, partially offset by the benefit of Marvel distribution rights sales in the prior year.
Expenses
Filmed Entertainment segment expenses decreased $528 million, or 13%, to $3.520 billion in the year ended September 30, 2014, primarily driven by lower operating expenses.
35
Management’s Discussion and Analysis
of Results of Operations and Financial Condition
(continued)
Operating
Operating expenses decreased $485 million, or 14%, to $3.031 billion in the year ended September 30, 2014, as a result of the number and mix of films. Distribution and other costs, principally print and advertising expenses, decreased $262 million, or 16%, primarily driven by the number and mix of current year theatrical and home entertainment releases. Film costs decreased $223 million, or 12%, reflecting lower participation costs on third-party distribution arrangements.
Selling, General and Administrative
SG&A expenses decreased $18 million, or 4%, to $425 million in the year ended September 30, 2014, principally driven by lower employee costs.
Adjusted Operating Income
Adjusted operating income was $205 million in the year ended September 30, 2014, compared with $234 million in 2013. The prior year results included the benefit of Marvel distribution rights sales.
YEAR ENDED SEPTEMBER 30, 2013 vs. 2012
Consolidated Results of Operations
Our summary consolidated results of operations are presented below for the years ended September 30, 2013 and 2012.
Year Ended September 30, | Better/(Worse) | |||||||||||||
(in millions, except per share amounts) | 2013 | 2012 | $ | % | ||||||||||
Revenues | $ | 13,794 | $ | 13,887 | $ | (93 | ) | (1 | )% | |||||
Operating income | 3,836 | 3,901 | (65 | ) | (2 | ) | ||||||||
Adjusted operating income | 3,942 | 3,901 | 41 | 1 | ||||||||||
Net earnings from continuing operations attributable to Viacom | 2,407 | 2,345 | 62 | 3 | ||||||||||
Adjusted net earnings from continuing operations attributable to Viacom | 2,316 | 2,264 | 52 | 2 | ||||||||||
Diluted EPS from continuing operations | 4.86 | 4.36 | 0.50 | 11 | ||||||||||
Adjusted diluted EPS from continuing operations | $ | 4.68 | $ | 4.21 | $ | 0.47 | 11 | % | ||||||
See the section entitled “Factors Affecting Comparability” for a reconciliation of our adjusted measures to our reported results.
Revenues
Worldwide revenues decreased $93 million, or 1%, to $13.794 billion in the year ended September 30, 2013. Filmed Entertainment revenues decreased $538 million, principally due to lower revenues across the distribution windows reflecting the number and mix of films, partially offset by higher ancillary revenues. Media Networks contributed a partially offsetting increase in revenues of $462 million principally reflecting higher affiliate fees and advertising revenues.
Operating Income
Adjusted operating income increased $41 million, or 1%, to $3.942 billion in the year ended September 30, 2013. Media Networks adjusted operating income increased $207 million, reflecting higher revenues, partially offset by our continuing investment in original content. Filmed Entertainment adjusted operating income decreased $91 million, reflecting lower contribution from prior period releases and catalog, partially offset by higher ancillary revenues. Corporate expenses increased 31% in 2013, primarily due to higher deferred compensation costs reflecting our increased stock price, as well as higher incentive compensation costs and professional fees. Adjusted results for 2013 exclude the impact of $106 million of restructuring and other charges. Including the impact of the restructuring and other charges, operating income decreased $65 million, or 2%.
See the section entitled “Segment Results of Operations” for a more in-depth discussion of the revenues, expenses and adjusted operating income for each of the Media Networks and Filmed Entertainment segments.
Net Earnings from Continuing Operations Attributable to Viacom
Adjusted net earnings from continuing operations attributable to Viacom increased $52 million, or 2%, to $2.316 billion in the year ended September 30, 2013, principally due to the increase in tax-effected adjusted operating income described above and a lower effective income tax rate.
Our effective income tax rate was 32.9% in 2013, as compared with 34.0% in 2012, excluding the impact of discrete tax items. The decrease in the effective income tax rate is principally due to a change in the mix of domestic and international income.
36
Management’s Discussion and Analysis
of Results of Operations and Financial Condition
(continued)
Adjusted diluted EPS from continuing operations increased $0.47 per diluted share to $4.68, principally reflecting fewer outstanding shares and the increase in earnings described above.
In addition to the operating items mentioned above, adjusted net earnings from continuing operations attributable to Viacom exclude the gains from the sales of our 20% interest in HBO Pacific Partners and our 22.5% interest in LAPTV in 2013 and a loss on extinguishment of debt in 2012, as well as discrete taxes in both years.
Including these items in both years, net earnings from continuing operations attributable to Viacom increased $62 million, or 3%, and diluted EPS from continuing operations increased $0.50 per diluted share to $4.86.
Discontinued Operations, Net of Tax
The $12 million loss from discontinued operations in 2013 primarily reflects interest on the earn-out dispute with the former shareholders of Harmonix Music Systems Inc., a developer of music-based games, and the $364 million loss in 2012 principally reflects a $383 million pre-tax charge related to the dispute.
Segment Results of Operations
Transactions between reportable segments are accounted for as third-party arrangements for the purposes of presenting segment results of operations. Typical intersegment transactions include the purchase of advertising by the Filmed Entertainment segment on Media Networks’ properties and the purchase of Filmed Entertainment’s feature films exhibition rights by Media Networks.
Media Networks
Year Ended September 30, | Better/(Worse) | |||||||||||||
(in millions) | 2013 | 2012 | $ | % | ||||||||||
Revenues by Component | ||||||||||||||
Advertising | $ | 4,855 | $ | 4,756 | $ | 99 | 2 | % | ||||||
Affiliate fees | 4,245 | 3,889 | 356 | 9 | ||||||||||
Ancillary | 556 | 549 | 7 | 1 | ||||||||||
Total revenues by component | $ | 9,656 | $ | 9,194 | $ | 462 | 5 | % | ||||||
Expenses | ||||||||||||||
Operating | $ | 3,405 | $ | 3,186 | $ | (219 | ) | (7 | )% | |||||
Selling, general and administrative | 2,011 | 1,975 | (36 | ) | (2 | ) | ||||||||
Depreciation and amortization | 144 | 144 | — | — | ||||||||||
Total expenses | $ | 5,560 | $ | 5,305 | $ | (255 | ) | (5 | )% | |||||
Adjusted Operating Income | $ | 4,096 | $ | 3,889 | $ | 207 | 5 | % | ||||||
Revenues
Worldwide revenues increased $462 million, or 5%, to $9.656 billion in the year ended September 30, 2013, driven primarily by higher affiliate fees and advertising revenues. Domestic revenues were $8.264 billion, an increase of $473 million, or 6%. International revenues were $1.392 billion, a decrease of $11 million, or 1%, with 1 percentage point of decline resulting from foreign exchange.
Advertising
Worldwide advertising revenues increased $99 million, or 2%, to $4.855 billion in the year ended September 30, 2013. Domestic advertising revenues increased 3%, as ratings trends and strong marketplace demand in the second half of fiscal 2013 drove an increase in the volume of commercial units. International advertising revenues decreased 4%, reflecting economic conditions in Europe earlier in fiscal 2013 and lower revenues from production and promotional events, with 1 percentage point of the decline resulting from foreign exchange.
Affiliate Fees
Worldwide affiliate fees increased $356 million, or 9%, to $4.245 billion in the year ended September 30, 2013. Domestic affiliate revenues increased 10%, principally reflecting rate increases, and including the benefits of digital distribution arrangements. International revenues increased 4%, primarily driven by growth in subscribers and rate increases. Foreign exchange had a 1-percentage point unfavorable impact on international revenues in the year ended September 30, 2013.
37
Management’s Discussion and Analysis
of Results of Operations and Financial Condition
(continued)
Expenses
Media Networks segment expenses increased $255 million, or 5%, to $5.560 billion in the year ended September 30, 2013, principally driven by higher operating expenses.
Operating
Operating expenses increased $219 million, or 7%, to $3.405 billion in the year ended September 30, 2013. Due to our continuing investment in original content, programming costs increased $194 million, or 7%. Distribution and other expenses, including participations related to digital distribution arrangements, increased $25 million, or 7%.
Selling, General and Administrative
SG&A expenses increased $36 million, or 2%, to $2.011 billion in the year ended September 30, 2013, principally driven by higher incentive compensation costs.
Adjusted Operating Income
Adjusted operating income increased $207 million, or 5%, to $4.096 billion in the year ended September 30, 2013, principally reflecting higher revenues partially offset by higher operating expenses as discussed above.
Filmed Entertainment
Year Ended September 30, | Better/(Worse) | |||||||||||||
(in millions) | 2013 | 2012 | $ | % | ||||||||||
Revenues by Component | ||||||||||||||
Theatrical | $ | 1,239 | $ | 1,310 | $ | (71 | ) | (5 | )% | |||||
Home entertainment | 1,300 | 1,662 | (362 | ) | (22 | ) | ||||||||
Television license fees | 1,203 | 1,394 | (191 | ) | (14 | ) | ||||||||
Ancillary | 540 | 454 | 86 | 19 | ||||||||||
Total revenues by component | $ | 4,282 | $ | 4,820 | $ | (538 | ) | (11 | )% | |||||
Expenses | ||||||||||||||
Operating | $ | 3,516 | $ | 3,935 | $ | 419 | 11 | % | ||||||
Selling, general and administrative | 443 | 473 | 30 | 6 | ||||||||||
Depreciation and amortization | 89 | 87 | (2 | ) | (2 | ) | ||||||||
Total expenses | $ | 4,048 | $ | 4,495 | $ | 447 | 10 | % | ||||||
Adjusted Operating Income | $ | 234 | $ | 325 | $ | (91 | ) | (28 | )% | |||||
Revenues
Worldwide revenues decreased $538 million, or 11%, to $4.282 billion in the year ended September 30, 2013, principally due to lower revenues across the distribution windows reflecting the number and mix of films, partially offset by higher ancillary revenues. Domestic revenues were $2.021 billion, a decrease of $114 million, or 5%. International revenues were $2.261 billion, a decrease of $424 million, or 16%, with 1 percentage point of decline resulting from foreign exchange.
Theatrical
Worldwide theatrical revenues decreased $71 million, or 5%, to $1.239 billion in the year ended September 30, 2013. Revenues from our 2013 releases were $115 million lower than 2012. During 2013, we released thirteen films, including World War Z, Star Trek into Darkness, G.I. Joe: Retaliation, DreamWorks Animation’s Rise of the Guardians, Hansel and Gretel: Witch Hunters, Jack Reacher, Flight and Paranormal Activity 4, compared to fifteen films in 2012. 2012 releases included Mission Impossible – Ghost Protocol and DreamWorks Animation’s Madagascar 3: Europe’s Most Wanted. The decline in revenues from our 2013 releases was partially offset by higher carryover revenues from prior periods of $44 million, principally attributable to Madagascar 3: Europe’s Most Wanted. Domestic and international theatrical revenues decreased 6% and 5%, respectively. Foreign exchange had a 1-percentage point unfavorable impact on international theatrical revenues.
Home Entertainment
Worldwide home entertainment revenues decreased $362 million, or 22%, to $1.300 billion in the year ended September 30, 2013, driven by lower carryover and catalog revenues of $284 million, reflecting the prior period release of Transformers: Dark of the Moon and lower revenues from our 2013 releases of $78 million due to the number and mix of titles released. In 2013, we released fourteen titles, including Madagascar 3: Europe’s Most Wanted, Star Trek into Darkness, Rise of the Guardians, G.I. Joe: Retaliation, World War Z, Jack Reacher, Hansel and Gretel: Witch Hunters and Flight. In 2012, we released eighteen
38
Management’s Discussion and Analysis
of Results of Operations and Financial Condition
(continued)
titles, including Marvel’s Captain America: The First Avenger, DreamWorks Animation’s Puss in Boots and Kung Fu Panda 2, Mission Impossible – Ghost Protocol and Super 8. Domestic and international home entertainment revenues decreased 12% and 32%, respectively. Foreign exchange had a 1-percentage point unfavorable impact on international home entertainment revenues.
Television License Fees
Television license fees decreased $191 million, or 14%, to $1.203 billion in the year ended September 30, 2013, driven by the number and mix of available titles.
Ancillary
Ancillary revenues increased $86 million, or 19%, to $540 million in the year ended September 30, 2013, principally driven by Marvel distribution rights sales.
Expenses
Filmed Entertainment segment expenses decreased $447 million, or 10%, to $4.048 billion in the year ended September 30, 2013, primarily driven by lower operating expenses.
Operating
Operating expenses decreased $419 million, or 11%, to $3.516 billion in the year ended September 30, 2013, principally due to the number and mix of our home entertainment and theatrical releases. Film costs decreased $236 million, or 11%. Distribution and other costs, principally print and advertising expenses, decreased $183 million, or 10%.
Selling, General and Administrative
SG&A expenses decreased $30 million, or 6%, to $443 million in the year ended September 30, 2013, principally driven by lower overhead costs.
Adjusted Operating Income
Adjusted operating income decreased $91 million, or 28%, to $234 million in the year ended September 30, 2013, principally reflecting lower contributions from prior period releases and catalog, partially offset by higher ancillary revenues.
Factors Affecting Comparability
The Consolidated Financial Statements as of and for the three years ended September 30, 2014 reflect our results of operations, financial position and cash flows reported in accordance with GAAP. Results for the aforementioned periods, as discussed in the section entitled “Overview”, have been affected by certain items identified as affecting comparability. Accordingly, when applicable, we use adjusted measures to evaluate our actual operating performance.
The following tables reconcile our adjusted measures to our reported results for the three years ended September 30, 2014. The tax impacts included in the tables have been calculated using the rates applicable to the adjustments presented.
2014
Year Ended September 30, 2014 | |||||||||||||||
(in millions, except per share amounts) | Operating Income | Pre-tax Earnings from Continuing Operations | Net Earnings from Continuing Operations Attributable to Viacom | Diluted EPS from Continuing Operations | |||||||||||
Reported results | $ | 4,082 | $ | 3,514 | $ | 2,392 | $ | 5.43 | |||||||
Factors Affecting Comparability: | |||||||||||||||
Asset impairment | 43 | 43 | 26 | 0.06 | |||||||||||
Loss on extinguishment of debt | — | 11 | 7 | 0.02 | |||||||||||
Discrete tax benefits | — | — | (49 | ) | (0.11 | ) | |||||||||
Adjusted results | $ | 4,125 | $ | 3,568 | $ | 2,376 | $ | 5.40 | |||||||
Asset impairment: As a result of strategic decisions made by us resulting in channel realignment in several international markets, we recorded a non-cash pre-tax impairment charge of $43 million related to an international trade name at Media Networks.
39
Management’s Discussion and Analysis
of Results of Operations and Financial Condition
(continued)
Loss on extinguishment of debt: In April 2014, we redeemed all $600 million of our outstanding 4.375% Senior Notes due September 2014 (the "2014 Notes") at a redemption price equal to the sum of the principal amount and a make-whole amount, together totaling $611 million, and accrued and unpaid interest of $1 million. As a result of the redemption, we recognized a pre-tax extinguishment loss of $11 million.
Discrete tax benefits: Our discrete tax benefits are principally related to the reversal of deferred taxes on earnings deemed permanently reinvested and the recognition of capital loss carryforwards. Our effective income tax rate was 31.4% in 2014, excluding the impact of discrete tax items. Discrete tax benefits of $49 million, taken together with the impact of the asset impairment and the loss on extinguishment of debt, contributed 1.5 percentage points of benefit to the effective tax rate, which reconciles to the reported effective rate of 29.9%.
2013
Year Ended September 30, 2013 | |||||||||||||||
(in millions, except per share amounts) | Operating Income | Pre-tax Earnings from Continuing Operations | Net Earnings from Continuing Operations Attributable to Viacom | Diluted EPS from Continuing Operations | |||||||||||
Reported results | $ | 3,836 | $ | 3,519 | $ | 2,407 | $ | 4.86 | |||||||
Factors Affecting Comparability: | |||||||||||||||
Restructuring, asset impairment and other charges | 106 | 106 | 74 | 0.15 | |||||||||||
Gain on sale of HBO Pacific Partners and LAPTV | — | (111 | ) | (111 | ) | (0.22 | ) | ||||||||
Discrete tax benefits | — | — | (54 | ) | (0.11 | ) | |||||||||
Adjusted results | $ | 3,942 | $ | 3,514 | $ | 2,316 | $ | 4.68 | |||||||
Restructuring, asset impairment and other charges: During 2013, we engaged in a global business transformation initiative, which included the migration of certain financial processing systems to an enterprise-wide general ledger system. As a result, we approved a restructuring plan which included severance charges of $86 million ($61 million at Media Networks and $25 million at Filmed Entertainment). We also undertook a strategic review of some of our brands and incurred a $7 million intangible asset impairment charge resulting from the decision to abandon the asset and $13 million of charges related to management’s decision to cease use of certain original and acquired programming on one of our Media Networks channels.
Gain on sale of HBO Pacific Partners and LAPTV: In 2013, we completed the sales of our 20% interest in HBO Pacific Partners and our 22.5% interest in LAPTV, partnerships that own pay television channels under various brand names and that were accounted for under the equity method. The sales resulted in aggregate total proceeds of $124 million and gain of $111 million. The tax provision associated with the gains was offset by the reversal of a valuation allowance on capital loss carryforwards.
Discrete tax benefits: Our discrete tax benefits principally reflect the release of tax reserves with respect to certain effectively settled tax positions, as well as the recognition of certain capital loss carryforward and tax credit benefits. Our effective income tax rate was 32.9% in 2013, excluding the impact of discrete tax items. Discrete tax benefits of $54 million, taken together with the effective income tax rate impact of the restructuring, asset impairment and other charges and the gain on sale of HBO Pacific Partners and LAPTV investments, contributed 2.5 percentage points of benefit to the effective tax rate, which reconciles to the reported effective tax rate of 30.4%.
40
Management’s Discussion and Analysis
of Results of Operations and Financial Condition
(continued)
2012
Year Ended September 30, 2012 | |||||||||||||||
(in millions, except per share amounts) | Operating Income | Pre-tax Earnings from Continuing Operations | Net Earnings from Continuing Operations Attributable to Viacom | Diluted EPS from Continuing Operations | |||||||||||
Reported results | $ | 3,901 | $ | 3,470 | $ | 2,345 | $ | 4.36 | |||||||
Factors Affecting Comparability: | |||||||||||||||
Loss on extinguishment of debt | — | 21 | 13 | 0.02 | |||||||||||
Discrete tax benefits | — | — | (94 | ) | (0.17 | ) | |||||||||
Adjusted results | $ | 3,901 | $ | 3,491 | $ | 2,264 | $ | 4.21 | |||||||
Loss on extinguishment of debt: We redeemed all $750 million of our outstanding 6.850% Senior Notes due December 2055 (the “2055 Notes”) at a redemption price equal to 100% of the principal amount of each 2055 Notes, plus accrued interest thereon. As a result of the redemption, we expensed the unamortized issuance costs associated with the 2055 Notes, which resulted in a pre-tax extinguishment loss of $21 million.
Discrete tax benefits: Our discrete tax benefits include certain operating and capital loss carryforward benefits, as well as the release of tax reserves with respect to certain effectively settled tax positions. Our effective income tax rate was 34.0% in 2012, excluding the impact of discrete tax items. Discrete tax benefits of $94 million, taken together with the impact of the loss on extinguishment of debt, contributed 2.7 percentage points of benefit to the effective tax rate, which reconciles to the reported effective rate of 31.3%.
LIQUIDITY AND CAPITAL RESOURCES
Liquidity
Sources and Uses of Cash
Our primary source of liquidity is cash provided through the operations of our businesses. We have access to external financing sources such as our $2.5 billion five-year revolving credit facility and the capital markets. Our principal uses of cash from operations include the creation of new programming and film content, acquisitions of third-party content, and interest and income tax payments. We also use cash for discretionary share repurchases under our stock repurchase program, as deemed appropriate, as well as quarterly cash dividends, capital expenditures and acquisitions of businesses.
The Media Networks segment consistently generates a significant percentage of our cash flow from operating activities. Advertising is generally purchased by large media buying agencies and our affiliate fees are principally earned from cable and satellite television operators. The Filmed Entertainment segment’s operational results and ability to generate cash flow from operations substantially depend on the number and timing of films in development and production, the level and timing of print and advertising costs and the public’s response to our theatrical film and home entertainment releases. In general, our segments require relatively low levels of capital expenditures in relation to our annual cash flow from operations. This contributes to our ability to generate cash flow for future investment in our content and business operations, which we expect to be able to maintain over time.
We use commercial paper borrowings, backstopped by our credit facility, to fund short-term domestic liquidity needs principally driven by the timing of our domestic operating cash flows and the amount of share repurchases in the period. Our cash and cash equivalents totaled $1.0 billion as of September 30, 2014, of which $715 million was held by our foreign subsidiaries and is substantially all deemed permanently reinvested in our foreign operations. While we currently do not intend or foresee a need for repatriating funds held in our foreign subsidiaries, should we require additional capital in the United States (“U.S.”), we could elect to repatriate these funds or access external financing. Repatriating funds could result in a higher effective tax rate and cash taxes paid.
We believe that our cash flows from operating activities together with our credit facility provide us with adequate resources to fund our anticipated ongoing cash requirements. We anticipate that future debt maturities will be funded with cash and cash equivalents, cash flows from operating activities and future access to capital markets, including our credit facility.
41
Management’s Discussion and Analysis
of Results of Operations and Financial Condition
(continued)
We may continue to access external financing from time to time depending on our cash requirements, assessments of current and anticipated market conditions and after-tax cost of capital. Our access to capital markets can be impacted by factors outside our control, including economic conditions; however, we believe that our strong cash flows and balance sheet, our credit facility and our credit rating will provide us with adequate access to funding given our expected cash needs. Any new borrowing cost would be affected by market conditions and short and long-term debt ratings assigned by independent rating agencies, and there can be no assurance that we will be able to access capital markets on terms and conditions that will be favorable to us.
Cash Flows
The net change in cash and cash equivalents for each of the years ended September 30, 2014, 2013 and 2012 is detailed below:
Cash Flows (in millions) | Year Ended September 30, | ||||||||||
2014 | 2013 | 2012 | |||||||||
Cash provided by operations | $ | 2,597 | $ | 3,083 | $ | 2,498 | |||||
Net cash flow used in investing activities | (855 | ) | (335 | ) | (256 | ) | |||||
Net cash flow used in financing activities | (3,100 | ) | (1,159 | ) | (2,413 | ) | |||||
Effect of exchange rate changes on cash and cash equivalents | (45 | ) | (34 | ) | (2 | ) | |||||
Net change in cash and cash equivalents | $ | (1,403 | ) | $ | 1,555 | $ | (173 | ) | |||
Operating Activities
Cash provided by operations was $2.597 billion in 2014, a decrease of $486 million compared with 2013. The decrease is primarily driven by higher income tax payments.
Cash provided by operations was $3.083 billion in 2013, an increase of $585 million compared with 2012. The increase reflects favorable working capital, principally driven by lower income tax payments.
See Note 19 of the Consolidated Financial Statements for more information regarding income tax payments.
Investing Activities
Cash used in investing activities was $855 million in 2014, principally reflecting the purchase price for the acquisition of Channel 5 and capital expenditures.
Cash used in investing activities was $335 million in 2013, which included payments related to the earn-out dispute with the former shareholders of Harmonix and capital expenditures, partially offset by $124 million of proceeds received from the sales of our investments in HBO Pacific Partners and LAPTV.
Cash used in investing activities of $256 million in 2012, included a payment related to the earn-out dispute with the former shareholders of Harmonix.
Financing Activities
Cash used in financing activities was $3.100 billion in 2014, primarily driven by the settlement of share repurchases totaling $3.529 billion and dividend payments of $541 million, partially offset by net proceeds of $884 million from debt transactions. Proceeds of $1.484 billion from the issuance of senior notes and debentures with an aggregate face value of $1.5 billion were partially offset by the debt extinguishment payment of $600 million.
Cash used in financing activities was $1.159 billion in 2013, driven by the settlement of share repurchases totaling $4.664 billion and dividends of $555 million, partially offset by the issuance of senior notes and debentures, for aggregate net cash proceeds of $3.732 billion and stock option proceeds of $403 million and $97 million from excess tax benefits, which represents the actual tax deductions in excess of amounts previously recognized.
Cash used in financing activities was $2.413 billion in 2012, driven by the settlement of share repurchases totaling $2.809 billion and dividends of $554 million, partially offset by the net impact of our senior notes and debentures issuances and debt repayments.
In May 2014, we increased our quarterly dividend to $0.33 per share of Class A and Class B common stock from $0.30 per share, beginning with the dividend paid on July 1, 2014.
42
Management’s Discussion and Analysis
of Results of Operations and Financial Condition
(continued)
Capital Resources
Capital Structure and Debt
At September 30, 2014, total debt was $12.769 billion, an increase of $884 million from $11.885 billion at September 30, 2013.
The increase in debt reflects the impact of new issuances of senior notes and debentures.
Debt (in millions) | September 30, | ||||||
2014 | 2013 | ||||||
Senior notes and debentures | $ | 12,601 | $ | 11,695 | |||
Capital leases and other obligations | 168 | 190 | |||||
Total debt | $ | 12,769 | $ | 11,885 | |||
Amounts classified in the current portion of debt consist of the portion of capital leases payable in the next twelve months. Our Senior Notes due in February 2015 and September 2015 are classified as long-term debt as we have the intent as well as the ability, through utilization of our $2.5 billion revolving credit facility, to refinance this debt.
Senior Notes and Debentures
In March 2014, we issued a total of $1.5 billion of senior notes and debentures as follows:
• | 2.200% Senior Notes due April 2019 with an aggregate principal amount of $400 million at a price equal to 99.947% of the principal amount. |
• | 3.875% Senior Notes due April 2024 with an aggregate principal amount of $550 million at a price equal to 99.192% of the principal amount. |
• | 5.250% Senior Debentures due April 2044 with an aggregate principal amount of $550 million at a price equal to 99.831% of the principal amount. |
The proceeds, net of the discount and other issuance fees and expenses, from the issuance of the senior notes and debentures were $1.484 billion. We utilized a portion of the proceeds to redeem our Senior Notes due September 2014 as detailed below. We used the remaining proceeds for general corporate purposes, including the repurchase of shares under our stock repurchase program.
In April 2014, we redeemed all $600 million of our outstanding 2014 Notes at a redemption price equal to the sum of the principal amount and a make-whole amount, together totaling $611 million, and accrued and unpaid interest of $1 million. As a result of the redemption, we recognized a pre-tax extinguishment loss of $11 million.
Our outstanding senior notes and debentures provide for certain covenant packages typical for an investment grade company. There is one acceleration trigger for certain of the senior notes and debentures in the event of a change in control under certain specified circumstances coupled with ratings downgrades due to the change in control.
At September 30, 2014 and 2013, the total unamortized net discount related to the fixed rate senior notes and debentures was $419 million and $425 million, respectively.
Credit Facility: At September 30, 2014 and 2013, there were no amounts outstanding under our $2.5 billion revolving credit facility. The credit facility, with a maturity date of November 2017, is used for general corporate purposes and to support commercial paper outstanding, if any. The borrowing rate under the credit facility is LIBOR plus a margin ranging from 0.75% to 1.75% based on our current public debt rating. The credit facility has one principal financial covenant that requires our interest coverage for the most recent four consecutive fiscal quarters to be at least 3.0x, which we met at September 30, 2014.
Commercial Paper: At September 30, 2014 and 2013 there was no commercial paper outstanding. The average commercial paper outstanding for the twelve months ending September 30, 2014, was $563 million, which had a weighted average interest rate of 0.23%.
Stock Repurchase Program: During 2014, we repurchased 40.7 million shares of Class B common stock for an aggregate price of $3.4 billion. From October 1, 2014 through November 12, 2014, we repurchased an additional 3.6 million shares for an aggregate purchase price of $260 million, leaving $6.24 billion of remaining capacity under our program. Share repurchases under the program are expected to be funded through a combination of debt and cash generated by operations, as deemed
43
Management’s Discussion and Analysis
of Results of Operations and Financial Condition
(continued)
appropriate. During 2013 and 2012, we repurchased 69.2 million and 59.9 million shares for an aggregate price of $4.8 billion and $2.8 billion, respectively.
Commitments and Contingencies
Our commitments primarily consist of programming and talent commitments, operating and capital lease arrangements, and purchase obligations for goods and services. These arrangements result from our normal course of business and represent obligations that may be payable over several years. Additionally, we are subject to a redeemable put option (see Note 10 to our Consolidated Financial Statements).
Guarantees: In the course of our business, we both provide and receive the benefit of indemnities that are intended to allocate certain risks associated with business transactions. Similarly, we may remain contingently liable for various obligations of a business that has been divested in the event that a third party does not live up to its obligations under an indemnification agreement.
Leases - We have certain indemnification obligations with respect to leases primarily associated with the previously discontinued operations of Famous Players Inc. (“Famous Players”). In addition, we have certain indemnities provided by the acquirer of Famous Players.
Other - We have indemnification obligations with respect to letters of credit and surety bonds primarily used as security against non-performance in the normal course of business. We and our venture partner each have a commitment to guarantee up to approximately $86 million of bank debt of Viacom 18. There were no borrowings outstanding at September 30, 2014 subject to this guarantee.
Legal Matters: Litigation is inherently uncertain and always difficult to predict. However, based on our understanding and evaluation of the relevant facts and circumstances, we believe that our litigation to which we are a party is not likely, in the aggregate, to have a material adverse effect on our results of continuing operations, financial position or operating cash flows.
See Note 11 of the Consolidated Financial Statements for additional information related to our guarantees and legal matters.
Film Financing Arrangements: From time to time we enter into film financing arrangements that involve the sale of a partial copyright interest in a film to third-party investors. Since the investors typically have the risks and rewards of ownership proportionate to their ownership in the film, we generally record the amounts received for the sale of copyright interest as a reduction of the cost of the film and related cash flows are reflected in net cash flow from operating activities. We also enter into collaborative arrangements with other studios to jointly finance and distribute theatrical productions (“co-financing arrangements”). A co-financing arrangement typically involves joint ownership of the film asset with each partner responsible for distribution of the film in specific territories. The partners share in the profits and losses of the film in accordance with their respective ownership interest.
Contractual Obligations
Our contractual obligations include amounts reflected on our balance sheet, as well as off-balance sheet arrangements. At September 30, 2014, our significant contractual obligations, including payments due for the next five fiscal years and thereafter, were as follows:
Contractual Obligations (in millions) | Total | 1 year | 2-3 years | 4-5 years | After 5 years | ||||||||||||||
Off-balance Sheet Arrangements | |||||||||||||||||||
Programming and talent commitments (1) | $ | 1,873 | $ | 631 | $ | 830 | $ | 307 | $ | 105 | |||||||||
Operating leases (2) | 1,876 | 247 | 430 | 245 | 954 | ||||||||||||||
Purchase obligations (3) | 1,177 | 497 | 345 | 273 | 62 | ||||||||||||||
On-Balance Sheet Arrangements | |||||||||||||||||||
Capital lease obligations (4) | 140 | 23 | 50 | 50 | 17 | ||||||||||||||
Debt | 13,068 | 898 | 1,818 | 1,950 | 8,402 | ||||||||||||||
Interest payments | 8,940 | 590 | 1,088 | 922 | 6,340 | ||||||||||||||
Other long-term obligations (5) | $ | 2,559 | $ | 1,697 | $ | 706 | $ | 156 | $ | — | |||||||||
(1) | Programming and talent commitments include $1.6 billion relating to media networks programming and $273 million for talent contracts. |
(2) | Operating leases include long-term non-cancelable operating lease commitments for office space, equipment, transponders, studio facilities and vehicles. |
44
Management’s Discussion and Analysis
of Results of Operations and Financial Condition
(continued)
(3) | Purchase obligations include agreements to purchase goods or services that are enforceable and legally binding and that specify all significant terms, including open purchase orders. |
(4) | Capital lease obligations include capital leases for satellite transponders. |
(5) | Other long-term obligations principally consist of participations, residuals and programming obligations for content that is available for airing. |
Note: Not included in the amounts above are payments which may result from our defined benefit pension plans of $404 million, unrecognized tax benefits of $225 million, including interest and penalties, interest payments to be made under our credit facility, $216 million of redeemable noncontrolling interest and lease indemnification obligations of approximately $381 million. The amount and timing of payments with respect to these items are subject to a number of uncertainties such that we are unable to make sufficiently reliable estimations of future payments.
MARKET RISK
We are exposed to market risk related to foreign currency exchange rates and interest rates. We use or expect to use derivative financial instruments to modify exposure to risks from fluctuations in foreign currency exchange rates and interest rates. In accordance with our policy, we do not use derivative instruments unless there is an underlying exposure, and we do not hold or enter into financial instruments for speculative trading purposes.
Foreign Exchange Risk
We conduct business in various countries outside the United States, resulting in exposure to movements in foreign exchange rates when translating from the foreign local currency to the U.S. Dollar.
We use foreign currency forward contracts to economically hedge anticipated cash flows and foreign currency balances in such currencies as the British Pound, the Indian Rupee, the Euro, the Brazilian Real, the Japanese Yen, the Australian Dollar, the Singapore Dollar and the Canadian Dollar. We also enter into forward contracts to hedge future production costs or programming obligations. The change in fair value of non-designated foreign exchange contracts is included in current period earnings as part of Other items, net in the Consolidated Statements of Earnings. We manage the use of foreign exchange derivatives centrally.
At September 30, 2014 and 2013, the notional value of all foreign exchange contracts was $628 million and $196 million, respectively. In 2014, $390 million related to our foreign currency balances, $154 million related to anticipated investing cash flows and $84 million related to future production costs. In 2013, $178 million related to our foreign currency balances and $18 million related to future production costs and programming obligations.
Interest Rate Risk
A portion of our interest expense is exposed to movements in short-term rates. Also, interest expense for future long-term debt issues is exposed to movements in long-term rates. Interest rate hedges may be used to modify both of these exposures at our discretion. There were no interest rates hedges outstanding at September 30, 2014 and 2013. Since the majority of our debt is fixed rate, we do not expect that a 1% increase or decrease in the level of interest rates would have a material impact on our Consolidated Financial Statements.
Viacom has issued senior notes and debentures that, at September 30, 2014, had an outstanding balance of $12.6 billion and an estimated fair value of $13.7 billion. A 1% increase or decrease in the level of interest rates would decrease or increase the fair value of the senior notes and debentures by approximately $1.0 billion and $1.2 billion, respectively.
Credit Risk
We continually monitor our positions with, and credit quality of, our customers and the financial institutions, which are counterparties to our financial instrument agreements. We are exposed to credit loss in the event of nonpayment by our customers and nonperformance by the counterparties to our financial instrument agreements. However, we do not anticipate nonperformance by the counterparties to our financial instrument agreements and we believe our allowance for doubtful accounts is sufficient to cover any anticipated nonpayment by our customers.
CRITICAL ACCOUNTING POLICIES AND ESTIMATES
The preparation of our financial statements in conformity with GAAP requires management to make estimates, judgments and assumptions that affect the amounts reported in the consolidated financial statements and accompanying notes. On an ongoing basis, we evaluate our estimates, which are based on historical experience and on various other assumptions that we believe are reasonable under the circumstances. The result of these evaluations forms the basis for making judgments about the carrying
45
Management’s Discussion and Analysis
of Results of Operations and Financial Condition
(continued)
values of assets and liabilities and the reported amount of expenses that are not readily apparent from other sources. Actual results may differ from these estimates.
Our critical accounting policies are those that are considered by management to require significant judgment and use of estimates and that could have a significant impact on our financial statements. An understanding of our critical accounting policies is necessary to analyze our financial results. Our critical accounting policies include our accounting for original production costs, acquired programming rights, multiple-element arrangements, revenue allowances, income taxes and goodwill and other intangible assets. The risks and uncertainties involved in applying our critical accounting policies are provided below. Unless otherwise noted, we applied our critical accounting policies and estimation methods consistently in all material respects and for all periods presented, and have discussed such policies with our Audit Committee. For a summary of our significant accounting policies see Note 2 of the Consolidated Financial Statements.
Original Production Costs
We capitalize original programming and feature film costs, on a title-specific basis, as Inventory, net in the Consolidated Balance Sheets. We use an individual-film-forecast-computation method to amortize original production costs and to accrue estimated liabilities for residuals and participations over the applicable title’s life cycle based upon the ratio of current period to estimated remaining total gross revenues (“ultimate revenues”) for each title. The estimate of ultimate revenues impacts the timing of amortization and accrual of residuals and participations.
Our estimate of ultimate revenues for feature films includes revenues from all sources that are estimated to be earned within ten years from the date of a film’s initial theatrical release. For acquired film libraries, our estimate of ultimate revenues is for a period within 20 years from the date of acquisition. Prior to the release of a feature film and throughout its life, we estimate the ultimate revenues based on the historical performance of similar content, as well as incorporating factors of the content itself, including, but not limited to, the expected number of theaters and markets in which the original content will be released, the genre of the original content and the past box office performance of the lead actors and actresses. We believe the most sensitive factor affecting our estimate of ultimate revenues for films intended for theatrical release is domestic theatrical exhibition, as subsequent markets have historically exhibited a high correlation to domestic theatrical performance. Upon a film’s release and determination of domestic theatrical performance, our estimates of revenues from succeeding windows and markets are revised based on historical relationships and an analysis of current market trends. The most sensitive factor affecting our estimates for films subsequent to their initial release is the extent of home entertainment sales achieved. In addition to theatrical performance, home entertainment sales vary based on a variety of factors including demand for our titles, the volume and quality of competing home entertainment products, marketing and promotional strategies, as well as economic conditions.
Upon a film’s initial release we update our estimate of ultimate revenues based on expected future and actual results. We also review and revise estimates of ultimate revenue and participation costs as of each reporting date to reflect the most current available information. If estimates for a film are revised, the difference between amortization expense determined using the new estimate and any amounts previously expensed during that fiscal year are charged or credited to our Consolidated Statement of Earnings in the quarter in which the estimates are revised.
For original programming, capitalized program costs are amortized over the projected useful life of the programming, depending on genre and historical experience, beginning with the month of initial exhibition. The most sensitive factor affecting ultimate revenues is ratings, which are an indication of audience acceptance and directly impact the level of advertising revenues we will be able to generate during the airing of the programming. Poor ratings may result in abandonment of a program, which would require the immediate write-off of any unamortized production costs.
If we believe that the release of our content will not be or has not been favorably received, then we would assess whether the fair value of such content is less than the unamortized portion of its capitalized costs and, if need be, recognize an impairment charge for the amount by which the unamortized capitalized costs exceed the fair value. We utilize the individual-film-forecast-computation method (adjusted to incorporate revenue and related costs, including future exploitation costs, if any, expected to occur in periods beyond 10 years from the date of a film’s initial release) to develop the cash flows which are subsequently discounted to compute the fair value of a title that is being assessed for impairment. The discount rate utilized takes into account the time value of money as well as a risk premium. The risk premium reflects the uncertainties of realizing the expected cash flows of a title which is impacted by the title’s position within its product life cycle.
46
Management’s Discussion and Analysis
of Results of Operations and Financial Condition
(continued)
Acquired Programming Rights
We report an asset and liability for the rights acquired and obligations incurred at the commencement of the licensing period when the cost of the programming is known or reasonably determinable, the program material has been accepted and the programming is available for airing. The asset is amortized to operating expenses over the license period or projected useful life of the programming, if shorter, commencing upon availability, based on estimated future airings. If initial airings are expected to generate higher revenues an accelerated method of amortization is used. Determining factors used in estimating the useful life of programming include the expected number of future airings, which may differ from the contracted number of airings, the length of the license period and expected future revenues to be generated from the programming. The cost basis of acquired programming is the capitalized cost of each program and is equal to the cost of the programming pursuant to the license agreement less the cumulative amortization recorded for the program. Capitalized costs of rights to program materials are reported in our Consolidated Balance Sheets at the lower of unamortized cost or estimated net realizable value. We evaluate net realizable value of acquired rights programming quarterly on a daypart basis. A daypart is defined as an aggregation of programs broadcast during a particular time of day or an aggregation of programs of a similar type. We aggregate similar programming based on the specific demographic targeted by each respective program service. Net realizable value is determined by estimating advertising revenues to be derived from the future airing of the programming within the daypart as well as an allocation of affiliate fee revenue to programming. An impairment charge may be necessary if our estimates of future cash flows of similar programming are insufficient or if programming is abandoned.
Multiple-Element Arrangements
We enter into arrangements under which we perform multiple revenue-generating activities. We must allocate consideration to separate units of account in the arrangement, which could impact the timing of revenue recognition.
Advertising revenues are principally generated from the sale of advertising time comprised of multiple commercial units. Each advertising spot comprises a deliverable for accounting purposes. Consideration for these arrangements is allocated among the individual advertising spots based on relative fair value using Viacom-specific prices.
Certain distributors include multiple programs made available for distribution on one or more dates for a fixed fee. Consideration for such arrangements is allocated among the programs based on relative fair value using management’s best estimate considering viewing performance and other factors.
Revenue Allowances
In accordance with the accounting guidance related to revenue recognition when a right of return exists, revenue allowances are recorded to adjust amounts originally invoiced to the estimated net realizable value of a particular product. Upon the sale of home entertainment products to wholesalers and retailers, we record a reduction of revenue for the impact of estimated future returns, rebates and other incentives (“estimated returns”). In determining estimated returns, we consider numerous sources of qualitative and quantitative evidence including forecasted sales data, customers’ rights of return, units shipped and units remaining at retail, historical return rates for similar product, current economic trends, competitive environment, promotions and sales strategies.
Forecasted sales data is determined by comparing a particular release to product that has similar characteristics where applicable, such as franchise, genre, box office levels and release patterns, using regression analysis, decay rates and other tools. Based on the results of this analysis and the sales strategies to be used for the release, we reserve an appropriate percentage of each dollar of product revenue on a title taking into consideration the qualitative and quantitative factors described above. Forecasted sales data is reviewed and updated throughout each quarter and is consistent with the projections of ultimate revenues used in applying the individual-film-forecast-computation method to amortize our film costs. Accordingly, a change in forecasted sales affects both the revenue allowance and related expenses. Actual sell-through data is reviewed as it becomes available against the forecasted sales data to ensure that estimates continue to be consistent with actual sales performance.
Our estimate of future returns affects reported revenue and operating income. If we underestimate the impact of future returns in a particular period, then we may record less revenue and related expenses in later periods when returns exceed the estimated amounts. If we overestimate the impact of future returns in a particular period, then we may record additional revenue and related expenses in later periods when returns are less than estimated. An incremental change of 1% in our estimated sales returns rate (i.e., provisions for returns divided by gross sales of related product) for home entertainment products would have a $14 million impact on our total revenue for the year ended September 30, 2014. This revenue impact would be partially offset by a corresponding impact on related expenses depending on the margin associated with a specific film and other factors.
47
Management’s Discussion and Analysis
of Results of Operations and Financial Condition
(continued)
We also continually evaluate accounts receivable and establish judgments as to their ultimate collectability. Judgments and estimates involved include an analysis of specific risks on a customer-by-customer basis for larger accounts and an analysis of actual historical write-off experience in conjunction with the length of time the receivables are past due. Using this information, management reserves an amount that is estimated to be uncollectible. An incremental change of 1% in our allowance for uncollectible accounts relative to our trade accounts receivables would have a $27 million impact on our operating results for the year ended September 30, 2014.
Income Taxes
Significant judgment is required in determining our annual provision for income taxes and evaluating our income tax positions. Our tax rates are impacted by the tax laws, regulations and policies in federal, state and local and international territories where our businesses operate. Changes to these laws and regulations and uncertainty generated by the prospect of future tax legislation may also affect our income tax positions, in addition to other factors, including our global mix of earnings, acquisitions and dispositions, as well as the tax characteristics of our income. In determining our income tax provisions on a jurisdiction basis, we are required to make judgments on the need to record deferred tax assets and liabilities, including the realizability of deferred tax assets. A valuation allowance for deferred tax assets is established if it is more likely than not that a deferred tax asset will not be realized. In evaluating uncertain tax positions, we make determinations of the application of complex tax rules, regulations and practices. We evaluate our uncertain tax positions quarterly based on many factors including, but not limited to, new facts, changes in tax law and information received from regulators. A change in any one of these factors could change our evaluation of an existing uncertain tax position, resulting in the recognition of an additional charge or benefit to our income tax provision in the period and may result in fluctuations in our effective income tax rate. Additionally, our income tax returns are routinely audited and settlements of issues raised in these audits sometimes affect our income tax provisions. The resolution of audit issues and income tax positions taken may take extended periods of time due to the length of examinations by tax authorities and the possible extension of statutes of limitations.
A 1% change in our effective income tax rate, excluding discrete items, would result in additional income tax expense of approximately $35 million for the year ended September 30, 2014.
We permanently reinvest the earnings of substantially all of our foreign subsidiaries outside the United States. We do not provide for U.S. taxes on earnings of our foreign subsidiaries for which the earnings are permanently reinvested.
Goodwill
Goodwill at September 30, 2014 relates to our reporting units Music ($2.0 billion), Nickelodeon ($2.9 billion), Entertainment ($2.3 billion), BET Networks ($2.7 billion) and Paramount ($1.6 billion).
A qualitative assessment (elected for our impairment test as of August 31, 2014) to determine whether it is more likely than not that the fair value of a reporting unit is less than its carrying value includes, but is not limited to, consideration of the results of our most recent quantitative impairment test, consideration of macroeconomic conditions, industry and market conditions, cost factors, cash flows, changes in key Company personnel and our share price. Based on this assessment, we concluded that it is more likely than not that goodwill is not impaired.
A quantitative goodwill impairment test, when performed, requires estimating fair value of a reporting unit based on a discounted cash flow analysis. A discounted cash flow analysis requires us to make various judgmental assumptions, including assumptions about the timing and amount of future cash flows, growth rates and discount rates. Given the inherent uncertainty in determining these assumptions, actual results may differ from those used in our valuations.
Other Intangible Assets
The impairment test employed for finite-lived intangible assets (e.g., broadcast license, trade names and customer lists) is based on whether the intent is to hold the asset for continued use or to hold the asset for sale. If the intent is to hold the asset for continued use, first a comparison of undiscounted future cash flows against the carrying value of the asset is performed. If the carrying value exceeds the undiscounted cash flows, the asset would be written down to its fair value. If the intent is to hold the asset for sale, to the extent the carrying value is greater than the asset’s fair value, an impairment loss is recognized for the difference.
Significant judgments in this area involve determining whether a triggering event has occurred, the determination of the cash flows for the assets involved and the discount rate to be applied in determining fair value. See Notes 14 and 20 of the Consolidated Financial Statements for information on asset impairments in 2014 and 2013.
48
Management’s Discussion and Analysis
of Results of Operations and Financial Condition
(continued)
OTHER MATTERS
Related Parties
In the ordinary course of business we enter into transactions with related parties, including National Amusements, Inc., CBS, their respective subsidiaries and affiliates, and companies that we account for under the equity method of accounting. See Note 22 to the Consolidated Financial Statements for details regarding the related party transactions and their impact on the Financial Statements.
Agreements with CBS Corporation
In connection with our separation from CBS, effective as of January 1, 2006 (the “separation”), we and CBS entered into a Separation Agreement, a Transition Services Agreement and a Tax Matters Agreement, as well as certain other agreements to govern the terms of the separation and certain of the ongoing relationships between CBS and us after the separation. These related party arrangements are more fully described below.
Pursuant to the Separation Agreement, each company is obligated to indemnify the other company and the other company’s officers, directors and employees for any losses arising out of its failure to perform or discharge any of the liabilities it assumed pursuant to the Separation Agreement, including with respect to certain legal matters, its businesses as conducted as of the date of the separation and its breaches of shared contracts.
Subject to limited exceptions, the Separation Agreement provides that none of Viacom, any subsidiary of Viacom or any person that is controlled by Viacom after the separation will own or acquire an interest in a radio or television broadcast station, television broadcast network or daily newspaper, if such ownership or acquisition would (i) cause CBS, any subsidiary of CBS or any entity controlled by CBS after the date of the separation to be in violation of U.S. federal laws limiting the ownership or control of radio broadcast stations, television broadcast stations and/or television broadcast networks or (ii) limit in any manner at any time under such laws CBS’s ability to acquire additional interests in a radio or television broadcast station and/or television broadcast network. These restrictions will terminate when none of Mr. Redstone, NAI, NAIRI Inc. or any of their successors, assigns or transferees are deemed to have interests in both CBS and Viacom that are attributable under applicable U.S. federal laws.
The Separation Agreement also provides that neither Viacom, any subsidiary of Viacom or any person controlled by Viacom nor CBS, any subsidiary of CBS or any person controlled by CBS will acquire any asset, enter into any agreement or accept or agree to any condition that purports to bind, or subjects to a legal order, the other company, its subsidiaries or any person it controls without such other party’s written consent.
The Tax Matters Agreement sets forth Viacom’s responsibilities with respect to, among other things, liabilities for federal, state, local and foreign income taxes for periods before and including the merger, the preparation and filing of income tax returns for such periods, disputes with taxing authorities regarding income taxes for such periods and indemnification for income taxes that would become due if the merger were taxable. Viacom is generally responsible for federal, state and local, and foreign income taxes for periods before the merger relating to Viacom’s respective businesses. Income tax liabilities relating to discontinued operations and previously disposed businesses have been allocated in accordance with the principles applicable under the Separation Agreement for liabilities relating to those operations and businesses. Other income tax liabilities, including items that do not specifically relate to either business, will be shared equally. Viacom and CBS will generally be jointly responsible for managing any dispute relating to income taxes for which both parties may be responsible.
Item 7A. Quantitative and Qualitative Disclosures About Market Risk.
Disclosures on our market risk are included in “Management’s Discussion and Analysis of Results of Operations and Financial Condition – Market Risk.”
49
Item 8. Financial Statements and Supplementary Data.
Index to financial statements and supplementary data: | |
Consolidated Statements of Comprehensive Income for the years ended September 30, 2014, 2013 and 2012 | |
Consolidated Statements of Stockholders Equity for the years ended September 30, 2014, 2013 and 2012 | |
50
MANAGEMENT’S REPORT ON INTERNAL CONTROL OVER FINANCIAL REPORTING
Management has prepared and is responsible for our consolidated financial statements and related notes. Management is also responsible for establishing and maintaining adequate internal control over financial reporting as defined in Rules 13a-15(f) and 15d-15(f) under the Securities Exchange Act of 1934, as amended. Viacom Inc. and its subsidiaries' (the “Company”) internal control over financial reporting includes those policies and procedures that (i) pertain to the maintenance of records that, in reasonable detail, accurately and fairly reflect the transactions and dispositions of the assets of the Company; (ii) provide reasonable assurance that transactions are recorded as necessary to permit preparation of financial statements in accordance with generally accepted accounting principles, and that receipts and expenditures of the Company are being made only in accordance with the authorizations of management and directors of the Company; and (iii) provide reasonable assurance regarding prevention or timely detection of unauthorized acquisition, use, or disposition of the Company’s assets that could have a material effect on the financial statements.
Internal control over financial reporting is designed to provide reasonable assurance regarding the reliability of financial reporting and the preparation of financial statements prepared for external purposes in accordance with generally accepted accounting principles. Because of its inherent limitations, internal control over financial reporting may not prevent or detect misstatements. Also, projections of any evaluation of effectiveness to future periods are subject to the risks that controls may become inadequate because of changes in conditions, or that the degree of compliance with the policies or procedures may deteriorate.
Under the supervision and with the participation of management, including our personal participation, we conducted an assessment of the effectiveness of internal control over financial reporting based on the framework in Internal Control – Integrated Framework (2013) as issued by the Committee of Sponsoring Organizations of the Treadway Commission. Based on this assessment, management determined that as of September 30, 2014, Viacom maintained effective internal control over financial reporting.
The effectiveness of our internal control over financial reporting as of September 30, 2014 has been audited by PricewaterhouseCoopers LLP, an independent registered public accounting firm, as stated in their report included herein.
VIACOM INC. | |
By: | /S/ PHILIPPE P. DAUMAN |
Philippe P. Dauman | |
President and Chief Executive Officer | |
By: | /S/ WADE DAVIS |
Wade Davis | |
Executive Vice President, Chief Financial Officer | |
By: | /S/ KATHERINE GILL-CHAREST |
Katherine Gill-Charest | |
Senior Vice President, Controller (Chief Accounting Officer) | |
51
REPORT OF INDEPENDENT REGISTERED PUBLIC ACCOUNTING FIRM
To the Board of Directors and Stockholders of Viacom Inc.
November 13, 2014
In our opinion, the consolidated financial statements listed in the index appearing under Item 8 present fairly, in all material respects, the financial position of Viacom Inc. and its subsidiaries (the “Company”) at September 30, 2014 and 2013 and the results of their operations and their cash flows for each of the three years in the period ended September 30, 2014, in conformity with accounting principles generally accepted in the United States of America. In addition, in our opinion, the financial statement schedule listed in the index appearing under Item 8 presents fairly, in all material respects, the information set forth therein when read in conjunction with the related consolidated financial statements. Also in our opinion, the Company maintained, in all material respects, effective internal control over financial reporting as of September 30, 2014, based on criteria established in Internal Control - Integrated Framework (2013) issued by the Committee of Sponsoring Organizations of the Treadway Commission (COSO). The Company’s management is responsible for these financial statements and financial statement schedule, for maintaining effective internal control over financial reporting and for its assessment of the effectiveness of internal control over financial reporting, included in Management’s Report on Internal Control over Financial Reporting appearing under Item 8. Our responsibility is to express opinions on these financial statements, on the financial statement schedule, and on the Company’s internal control over financial reporting based on our integrated audits. We conducted our audits in accordance with the standards of the Public Company Accounting Oversight Board (United States). Those standards require that we plan and perform the audits to obtain reasonable assurance about whether the financial statements are free of material misstatement and whether effective internal control over financial reporting was maintained in all material respects. Our audits of the financial statements included examining, on a test basis, evidence supporting the amounts and disclosures in the financial statements, assessing the accounting principles used and significant estimates made by management, and evaluating the overall financial statement presentation. Our audit of internal control over financial reporting included obtaining an understanding of internal control over financial reporting, assessing the risk that a material weakness exists, and testing and evaluating the design and operating effectiveness of internal control based on the assessed risk. Our audits also included performing such other procedures as we considered necessary in the circumstances. We believe that our audits provide a reasonable basis for our opinions.
A company’s internal control over financial reporting is a process designed to provide reasonable assurance regarding the reliability of financial reporting and the preparation of financial statements for external purposes in accordance with generally accepted accounting principles. A company’s internal control over financial reporting includes those policies and procedures that (i) pertain to the maintenance of records that, in reasonable detail, accurately and fairly reflect the transactions and dispositions of the assets of the company; (ii) provide reasonable assurance that transactions are recorded as necessary to permit preparation of financial statements in accordance with generally accepted accounting principles, and that receipts and expenditures of the company are being made only in accordance with authorizations of management and directors of the company; and (iii) provide reasonable assurance regarding prevention or timely detection of unauthorized acquisition, use, or disposition of the company’s assets that could have a material effect on the financial statements.
Because of its inherent limitations, internal control over financial reporting may not prevent or detect misstatements. Also, projections of any evaluation of effectiveness to future periods are subject to the risk that controls may become inadequate because of changes in conditions, or that the degree of compliance with the policies or procedures may deteriorate.
/s/ PricewaterhouseCoopers LLP
New York, New York
52
VIACOM INC.
CONSOLIDATED STATEMENTS OF EARNINGS
Year Ended September 30, | |||||||||||
(in millions, except per share amounts) | 2014 | 2013 | 2012 | ||||||||
Revenues | $ | 13,783 | $ | 13,794 | $ | 13,887 | |||||
Expenses: | |||||||||||
Operating | 6,542 | 6,799 | 6,993 | ||||||||
Selling, general and administrative | 2,899 | 2,829 | 2,757 | ||||||||
Depreciation and amortization | 217 | 237 | 236 | ||||||||
Asset impairment | 43 | 7 | — | ||||||||
Restructuring | — | 86 | — | ||||||||
Total expenses | 9,701 | 9,958 | 9,986 | ||||||||
Operating income | 4,082 | 3,836 | 3,901 | ||||||||
Interest expense, net | (615 | ) | (464 | ) | (417 | ) | |||||
Equity in net earnings of investee companies | 69 | 41 | 12 | ||||||||
Loss on extinguishment of debt | (11 | ) | — | (21 | ) | ||||||
Other items, net | (11 | ) | 106 | (5 | ) | ||||||
Earnings from continuing operations before provision for income taxes | 3,514 | 3,519 | 3,470 | ||||||||
Provision for income taxes | (1,050 | ) | (1,070 | ) | (1,085 | ) | |||||
Net earnings from continuing operations | 2,464 | 2,449 | 2,385 | ||||||||
Discontinued operations, net of tax | (1 | ) | (12 | ) | (364 | ) | |||||
Net earnings (Viacom and noncontrolling interests) | 2,463 | 2,437 | 2,021 | ||||||||
Net earnings attributable to noncontrolling interests | (72 | ) | (42 | ) | (40 | ) | |||||
Net earnings attributable to Viacom | $ | 2,391 | $ | 2,395 | $ | 1,981 | |||||
Amounts attributable to Viacom: | |||||||||||
Net earnings from continuing operations | $ | 2,392 | $ | 2,407 | $ | 2,345 | |||||
Discontinued operations, net of tax | (1 | ) | (12 | ) | (364 | ) | |||||
Net earnings attributable to Viacom | $ | 2,391 | $ | 2,395 | $ | 1,981 | |||||
Basic earnings per share attributable to Viacom: | |||||||||||
Continuing operations | $ | 5.54 | $ | 4.95 | $ | 4.42 | |||||
Discontinued operations | (0.01 | ) | (0.02 | ) | (0.69 | ) | |||||
Net earnings | $ | 5.53 | $ | 4.93 | $ | 3.73 | |||||
Diluted earnings per share attributable to Viacom: | |||||||||||
Continuing operations | $ | 5.43 | $ | 4.86 | $ | 4.36 | |||||
Discontinued operations | — | (0.02 | ) | (0.67 | ) | ||||||
Net earnings | $ | 5.43 | $ | 4.84 | $ | 3.69 | |||||
Weighted average number of common shares outstanding: | |||||||||||
Basic | 432.1 | 486.2 | 530.7 | ||||||||
Diluted | 440.2 | 494.8 | 537.5 | ||||||||
Dividends declared per share of Class A and Class B common stock | $ | 1.26 | $ | 1.15 | $ | 1.05 | |||||
See accompanying notes to Consolidated Financial Statements
53
VIACOM INC.
CONSOLIDATED STATEMENTS OF COMPREHENSIVE INCOME
Year Ended September 30, | |||||||||||
(in millions) | 2014 | 2013 | 2012 | ||||||||
Net earnings (Viacom and noncontrolling interests) | $ | 2,463 | $ | 2,437 | $ | 2,021 | |||||
Other comprehensive income (loss), net of tax: | |||||||||||
Foreign currency translation adjustments | (85 | ) | (42 | ) | (41 | ) | |||||
Defined benefit pension plans | (104 | ) | 190 | (63 | ) | ||||||
Cash flow hedges | (2 | ) | 9 | 6 | |||||||
Available for sale securities | — | 3 | (1 | ) | |||||||
Other comprehensive income (loss) (Viacom and noncontrolling interests) | (191 | ) | 160 | (99 | ) | ||||||
Comprehensive income | 2,272 | 2,597 | 1,922 | ||||||||
Less: Comprehensive income attributable to noncontrolling interests | 73 | 39 | 41 | ||||||||
Comprehensive income attributable to Viacom | $ | 2,199 | $ | 2,558 | $ | 1,881 | |||||
See accompanying notes to Consolidated Financial Statements
54
VIACOM INC.
CONSOLIDATED BALANCE SHEETS
September 30, | |||||||
(in millions, except par value) | 2014 | 2013 | |||||
ASSETS | |||||||
Current assets: | |||||||
Cash and cash equivalents | $ | 1,000 | $ | 2,403 | |||
Receivables, net | 3,066 | 2,987 | |||||
Inventory, net | 846 | 770 | |||||
Prepaid and other assets | 340 | 566 | |||||
Total current assets | 5,252 | 6,726 | |||||
Property and equipment, net | 1,016 | 1,040 | |||||
Inventory, net | 3,897 | 3,945 | |||||
Goodwill | 11,535 | 11,079 | |||||
Intangibles, net | 399 | 279 | |||||
Other assets | 1,018 | 760 | |||||
Total assets | $ | 23,117 | $ | 23,829 | |||
LIABILITIES AND EQUITY | |||||||
Current liabilities: | |||||||
Accounts payable | $ | 475 | $ | 316 | |||
Accrued expenses | 969 | 1,074 | |||||
Participants' share and residuals | 993 | 1,110 | |||||
Program obligations | 703 | 576 | |||||
Deferred revenue | 259 | 230 | |||||
Current portion of debt | 18 | 18 | |||||
Other liabilities | 518 | 466 | |||||
Total current liabilities | 3,935 | 3,790 | |||||
Noncurrent portion of debt | 12,751 | 11,867 | |||||
Participants' share and residuals | 403 | 437 | |||||
Program obligations | 459 | 527 | |||||
Deferred tax liabilities, net | 266 | 649 | |||||
Other liabilities | 1,340 | 1,169 | |||||
Redeemable noncontrolling interest | 216 | 200 | |||||
Commitments and contingencies (Note 11) | |||||||
Viacom stockholders' equity: | |||||||
Class A common stock, par value $0.001, 375.0 authorized; 50.9 and 51.1 outstanding, respectively | — | — | |||||
Class B common stock, par value $0.001, 5,000.0 authorized; 363.3 and 398.2 outstanding, respectively | — | — | |||||
Additional paid-in capital | 9,772 | 9,490 | |||||
Treasury stock, 377.0 and 336.3 common shares held in treasury, respectively | (19,225 | ) | (15,825 | ) | |||
Retained earnings | 13,465 | 11,629 | |||||
Accumulated other comprehensive loss | (293 | ) | (101 | ) | |||
Total Viacom stockholders' equity | 3,719 | 5,193 | |||||
Noncontrolling interests | 28 | (3 | ) | ||||
Total equity | 3,747 | 5,190 | |||||
Total liabilities and equity | $ | 23,117 | $ | 23,829 | |||
See accompanying notes to Consolidated Financial Statements
55
VIACOM INC.
CONSOLIDATED STATEMENTS OF CASH FLOWS
Year Ended September 30, | |||||||||||
(in millions) | 2014 | 2013 | 2012 | ||||||||
OPERATING ACTIVITIES | |||||||||||
Net earnings (Viacom and noncontrolling interests) | $ | 2,463 | $ | 2,437 | $ | 2,021 | |||||
Discontinued operations, net of tax | 1 | 12 | 364 | ||||||||
Net earnings from continuing operations | 2,464 | 2,449 | 2,385 | ||||||||
Reconciling items: | |||||||||||
Depreciation and amortization | 217 | 237 | 236 | ||||||||
Asset impairment | 43 | 7 | — | ||||||||
Feature film and program amortization | 4,206 | 4,371 | 4,380 | ||||||||
Equity-based compensation | 122 | 128 | 122 | ||||||||
Equity in net earnings and distributions from investee companies | (39 | ) | 15 | (6 | ) | ||||||
Gain on sale of HBO Pacific Partners and LAPTV | — | (111 | ) | — | |||||||
Deferred income taxes | (290 | ) | 494 | (87 | ) | ||||||
Operating assets and liabilities, net of acquisitions: | |||||||||||
Receivables | (106 | ) | (423 | ) | 209 | ||||||
Inventory, program rights and participations | (4,245 | ) | (4,063 | ) | (4,492 | ) | |||||
Accounts payable and other current liabilities | 252 | (31 | ) | (306 | ) | ||||||
Other, net | (27 | ) | 41 | 56 | |||||||
Discontinued operations, net | — | (31 | ) | 1 | |||||||
Cash provided by operations | 2,597 | 3,083 | 2,498 | ||||||||
INVESTING ACTIVITIES | |||||||||||
Acquisitions and investments, net | (732 | ) | 124 | (18 | ) | ||||||
Capital expenditures | (123 | ) | (160 | ) | (154 | ) | |||||
Discontinued operations, net | — | (299 | ) | (84 | ) | ||||||
Net cash flow used in investing activities | (855 | ) | (335 | ) | (256 | ) | |||||
FINANCING ACTIVITIES | |||||||||||
Borrowings | 1,484 | 3,732 | 2,116 | ||||||||
Debt repayments | (600 | ) | — | (892 | ) | ||||||
Commercial paper | — | — | (423 | ) | |||||||
Purchase of treasury stock | (3,529 | ) | (4,664 | ) | (2,809 | ) | |||||
Dividends paid | (541 | ) | (555 | ) | (554 | ) | |||||
Excess tax benefits on equity-based compensation awards | 84 | 97 | 37 | ||||||||
Exercise of stock options | 173 | 403 | 268 | ||||||||
Other, net | (171 | ) | (172 | ) | (156 | ) | |||||
Net cash flow used in financing activities | (3,100 | ) | (1,159 | ) | (2,413 | ) | |||||
Effect of exchange rate changes on cash and cash equivalents | (45 | ) | (34 | ) | (2 | ) | |||||
Net change in cash and cash equivalents | (1,403 | ) | 1,555 | (173 | ) | ||||||
Cash and cash equivalents at beginning of period | 2,403 | 848 | 1,021 | ||||||||
Cash and cash equivalents at end of period | $ | 1,000 | $ | 2,403 | $ | 848 | |||||
See accompanying notes to Consolidated Financial Statements
56
VIACOM INC.
CONSOLIDATED STATEMENTS OF STOCKHOLDERS’ EQUITY
(in millions) | Common Stock (shares) | Common Stock/ Additional Paid-In Capital | Treasury Stock | Retained Earnings | Accumulated Other Comprehensive Income (Loss) | Total Viacom Stockholders’ Equity | Noncontrolling Interests | Total Equity | ||||||||||||||||||||||
September 30, 2011 | 558.3 | $ | 8,615 | $ | (8,225 | ) | $ | 8,418 | $ | (164 | ) | $ | 8,644 | $ | (11 | ) | $ | 8,633 | ||||||||||||
Net earnings | — | — | — | 1,981 | — | 1,981 | 40 | 2,021 | ||||||||||||||||||||||
Other comprehensive income (loss), net of income tax benefit of $36 | — | — | — | — | (100 | ) | (100 | ) | 1 | (99 | ) | |||||||||||||||||||
Noncontrolling interests | — | — | — | (20 | ) | — | (20 | ) | (39 | ) | (59 | ) | ||||||||||||||||||
Dividends declared | — | — | — | (559 | ) | — | (559 | ) | — | (559 | ) | |||||||||||||||||||
Purchase of treasury stock | (59.9 | ) | — | (2,800 | ) | — | — | (2,800 | ) | — | (2,800 | ) | ||||||||||||||||||
Equity-based compensation and other | 8.6 | 302 | — | — | — | 302 | — | 302 | ||||||||||||||||||||||
September 30, 2012 | 507.0 | 8,917 | (11,025 | ) | 9,820 | (264 | ) | 7,448 | (9 | ) | 7,439 | |||||||||||||||||||
Net earnings | — | — | — | 2,395 | — | 2,395 | 42 | 2,437 | ||||||||||||||||||||||
Other comprehensive income (loss), net of income tax expense of $119 | — | — | — | — | 163 | 163 | (3 | ) | 160 | |||||||||||||||||||||
Noncontrolling interests | — | — | — | (24 | ) | — | (24 | ) | (33 | ) | (57 | ) | ||||||||||||||||||
Dividends declared | — | — | — | (562 | ) | — | (562 | ) | — | (562 | ) | |||||||||||||||||||
Purchase of treasury stock | (69.2 | ) | — | (4,800 | ) | — | — | (4,800 | ) | — | (4,800 | ) | ||||||||||||||||||
Equity-based compensation and other | 11.5 | 573 | — | — | — | 573 | — | 573 | ||||||||||||||||||||||
September 30, 2013 | 449.3 | 9,490 | (15,825 | ) | 11,629 | (101 | ) | 5,193 | (3 | ) | 5,190 | |||||||||||||||||||
Net earnings | — | — | — | 2,391 | — | 2,391 | 72 | 2,463 | ||||||||||||||||||||||
Other comprehensive income (loss), net of income tax benefit of $68 | — | — | — | — | (192 | ) | (192 | ) | 1 | (191 | ) | |||||||||||||||||||
Noncontrolling interests | — | — | — | (8 | ) | — | (8 | ) | (42 | ) | (50 | ) | ||||||||||||||||||
Dividends declared | — | — | — | (547 | ) | — | (547 | ) | — | (547 | ) | |||||||||||||||||||
Purchase of treasury stock | (40.7 | ) | — | (3,400 | ) | — | — | (3,400 | ) | — | (3,400 | ) | ||||||||||||||||||
Equity-based compensation and other | 5.6 | 282 | — | — | — | 282 | — | 282 | ||||||||||||||||||||||
September 30, 2014 | 414.2 | $ | 9,772 | $ | (19,225 | ) | $ | 13,465 | $ | (293 | ) | $ | 3,719 | $ | 28 | $ | 3,747 | |||||||||||||
See accompanying notes to Consolidated Financial Statements
57
VIACOM INC.
NOTES TO CONSOLIDATED FINANCIAL STATEMENTS
NOTE 1. BASIS OF PRESENTATION
Description of Business
Viacom Inc. is a leading global entertainment content company that connects with audiences in more than 165 countries and territories and creates compelling television programming, motion pictures, short-form videos, apps, games, brands for consumer products, social media and other entertainment content. Viacom operates through two reporting segments: Media Networks, which includes Music, Nickelodeon, Entertainment and BET Networks, and Filmed Entertainment. The Media Networks segment provides entertainment content and related branded products for consumers in targeted demographics attractive to advertisers, content distributors and retailers. The Filmed Entertainment segment produces, finances, acquires and distributes motion pictures, television programming and other entertainment content under the Paramount Pictures, Paramount Vantage, Paramount Classics, Insurge Pictures, MTV Films, Nickelodeon Movies and Paramount Television brands. References in this document to “Viacom”, “Company”, “we”, “us”, or “our” mean Viacom Inc. and our consolidated subsidiaries, unless the context requires otherwise.
The consolidated financial statements present the Company’s financial results for the years ended September 30, 2014 (“2014”), September 30, 2013 (“2013”) and September 30, 2012 (“2012”).
Use of Estimates
Preparing financial statements in conformity with generally accepted accounting principles requires management to make estimates, judgments and assumptions that affect the reported amounts of assets and liabilities as of the dates presented and the reported amounts of revenues and expenses during the periods presented. Significant estimates inherent in the preparation of the accompanying Consolidated Financial Statements include estimates of film ultimate revenues, product returns, allowance for doubtful accounts, potential outcome of uncertain tax positions, fair value of acquired assets and liabilities, fair value of equity-based compensation and pension benefit assumptions. Estimates are based on past experience and other considerations reasonable under the circumstances. Actual results may differ from these estimates.
Reclassifications
Certain prior year amounts have been reclassified to conform to the 2014 presentation.
Recent Accounting Pronouncements
In May 2014, the Financial Accounting Standards Board issued Accounting Standards Update (“ASU”) 2014-09 - Revenue from Contracts with Customers (“ASU 2014-09”), a comprehensive revenue recognition model that supersedes the current revenue recognition requirements and most industry-specific guidance. The underlying core principle of ASU 2014-09 is that a company should recognize revenue to depict the transfer of goods or services to customers in an amount that reflects the consideration it expects to be entitled to in exchange for those goods or services. ASU 2014-09 will be effective for the first interim period within annual reporting periods beginning after December 15, 2016, and allows adoption either under a full retrospective or a modified retrospective approach. Early adoption is not permitted. We will adopt ASU 2014-09 during the first quarter of fiscal 2018. We are currently evaluating the impact of the new standard.
NOTE 2. SUMMARY OF SIGNIFICANT ACCOUNTING POLICIES
Principles of Consolidation
Our consolidated financial statements include the accounts of Viacom Inc., its subsidiaries and variable interest entities (“VIEs”) where we are considered the primary beneficiary, after elimination of intercompany accounts and transactions. Investments in business entities in which Viacom lacks control but does have the ability to exercise significant influence over operating and financial policies are accounted for using the equity method. Our proportionate share of net income or loss of the entity is recorded in Equity in net earnings of investee companies in the Consolidated Statements of Earnings. Related party transactions between the Company and CBS Corporation (“CBS”) and National Amusements Inc. (“NAI”) have not been eliminated.
Business Combinations
We account for business combinations using the acquisition method of accounting. Under the acquisition method, once control is obtained of a business, 100% of the assets, liabilities and certain contingent liabilities acquired, including amounts attributed to noncontrolling interests, are recorded at fair value. Any transaction costs are expensed as incurred.
58
Foreign Currency Translation
Assets and liabilities of subsidiaries with a functional currency other than the United States (“U.S.”) Dollar are translated into U.S. Dollars using period-end exchange rates, while results of operations are translated at average exchange rates during the period. Foreign currency translation gains and losses are included as a component of Accumulated other comprehensive loss in the Consolidated Balance Sheets. Substantially all of our foreign operations use the local currency as the functional currency. Foreign subsidiaries using the U.S. Dollar as the functional currency include remeasurement adjustments in earnings, which are reflected within Other items, net in the Consolidated Statements of Earnings.
Revenue Recognition
We recognize revenue when it is realized or realizable and earned. We consider revenue realized or realizable and earned when there is persuasive evidence of an arrangement, delivery has occurred, the sales price is fixed or determinable, and collectability is reasonably assured. Determining whether some or all of these criteria have been met involves assumptions and judgments that can have a significant impact on the timing and amount of revenue we report. This includes the evaluation of multiple element arrangements for bundled advertising sales and content licenses, which involves allocating the consideration among individual deliverables within the bundled arrangement.
Advertising Revenues: Revenues from the sale of advertising earned by the Media Networks segment is recognized, net of agency commissions, when the advertisement is aired and the contracted audience rating is met. For advertising sold based on impression guarantees, audience deficiency may result in an obligation to deliver additional units. To the extent we do not satisfy contracted audience ratings, we record deferred revenue until such time that the audience rating has been satisfied.
Feature Film Revenues: Revenue is recognized from theatrical distribution of motion pictures upon exhibition. For home entertainment product revenue, including sales to wholesalers and retailers, revenue is recognized upon the later of delivery or the date that those products are made widely available for sale by retailers. Revenue from the licensing of feature films for exhibition in television markets is recognized upon availability for airing by the licensee. Revenue for digital transactional video-on-demand and download-to-own arrangements are recognized as the feature films are exhibited based on end-customer purchases as reported by the distributor.
Affiliate Fees: Affiliate fees from cable television, satellite and telecommunications operators are recognized by the Media Networks segment as the service is provided to the distributor. Fees associated with certain distribution arrangements are recognized upon program availability.
Ancillary Revenues: Revenue associated with consumer products and brand licensing is typically recognized utilizing contractual royalty rates applied to sales amounts reported by licensees. Revenue from licensing of our content for download-to-own and download-to-rent services is recognized when we are notified by the multi-platform retailer that the product has been downloaded and all other revenue recognition criteria are met.
Gross versus Net Revenue: We earn and recognize revenues as a distributor on behalf of third parties and through outsourced agency agreements. In such cases, determining whether revenue should be reported on a gross or net basis is based on management’s assessment of whether we act as the principal or agent in the transaction. To the extent we act as the principal in a transaction, revenues are reported on a gross basis. Determining whether we act as principal or agent in a transaction involves judgment and is based on an evaluation of whether we have the substantial risks and rewards of ownership under the terms of an arrangement.
Revenue Allowances: We record a provision for sales returns and allowances at the time of sale based upon an estimate of future returns, rebates and other incentives (“estimated returns”). In determining estimated returns, we consider numerous sources of qualitative and quantitative evidence including forecasted sales data, customers’ rights of return, units shipped and units remaining at retail, historical return rates for similar product, current economic trends, competitive environment, promotions and sales strategies. Reserves for accounts receivable are based on amounts estimated to be uncollectible. Our reserve for sales returns and allowances was $199 million and $261 million at September 30, 2014 and 2013, respectively. Our allowance for doubtful accounts was $30 million and $33 million at September 30, 2014 and 2013, respectively.
Advertising Expense
We expense advertising costs as they are incurred. We incurred total advertising expenses of $1.020 billion in 2014, $1.117 billion in 2013 and $1.205 billion in 2012.
59
Equity-Based Compensation
We measure the cost of employee services received in exchange for an award of equity instruments based on the grant date fair value of the award. The fair value received is recognized in earnings over the period during which an employee is required to provide service.
Income Taxes
Our provision for income taxes includes the current tax owed on the current period earnings, as well as a deferred provision which reflects the future tax consequences attributable to differences between the financial statement carrying amounts of existing assets and liabilities and their respective income tax bases. Deferred tax assets and liabilities are measured using enacted tax rates expected to apply to taxable income in the years in which those temporary differences are expected to be recovered or settled. Changes in existing tax laws and rates, their related interpretations, as well as the uncertainty generated by the prospect of tax legislation in the future may affect the amounts of deferred tax liabilities or the realizability of deferred tax assets.
For tax positions we have taken or expect to take in a tax return, we apply a more likely than not assessment (i.e., there is a greater than 50 percent chance) about whether the tax position will be sustained upon examination by the appropriate tax authority with full knowledge of all relevant information. Amounts recorded for uncertain tax positions are periodically assessed, including the evaluation of new facts and circumstances, to ensure sustainability of the position. Interest and penalties related to uncertain tax positions are included in the Provision for income taxes in the Consolidated Statements of Earnings. Liabilities for uncertain tax positions are classified as Other liabilities – noncurrent in the Consolidated Balance Sheets.
Earnings per Common Share
Basic earnings per common share is computed by dividing Net earnings attributable to Viacom by the weighted average number of common shares outstanding during the period. The determination of diluted earnings per common share includes the weighted average number of common shares plus the dilutive effect of equity awards based upon the application of the treasury stock method. Anti-dilutive common shares are excluded from the calculation of diluted earnings per common share.
Comprehensive Income
Comprehensive income includes net earnings, foreign currency translation adjustments, amortization of amounts related to defined benefit plans, unrealized gains and losses on certain derivative financial instruments, and unrealized gains and losses on investments in equity securities which are publicly traded.
Cash and Cash Equivalents
All highly liquid investments with maturities of three months or less at the date of purchase are considered to be cash equivalents.
Inventory
Inventories related to film and original media network programming content (which include direct production costs, production overhead, acquisition costs and development costs) are stated at the lower of amortized cost or fair value. Acquired program rights and obligations are recorded based on the gross amount of the liability when the license period has begun, and when the program is accepted and available for airing. Acquired programming is stated at the lower of unamortized cost or net realizable value. Film and programming inventories are included as a component of Inventory, net, in the Consolidated Balance Sheets. Film and programming costs, including inventory amortization, development costs, participations and residuals and impairment charges, if any, are included within Operating expenses in the Consolidated Statements of Earnings.
Film inventory: Film inventories are amortized and estimated liabilities for residuals and participations are accrued using an individual-film-forecast-computation method based on the ratio of current period to estimated remaining total revenues (“ultimate revenues”). Ultimate revenues for feature films include revenues from all sources that are estimated to be earned within 10 years from the date of a film’s initial theatrical release. For acquired film libraries, our estimate of ultimate revenues is for a period within 20 years from the date of acquisition. These estimates are periodically reviewed and adjustments, if any, will result in changes to inventory amortization rates, estimated accruals for participations and residuals or possibly the recognition of an impairment charge to operating income. Film development costs that have not been set for production are expensed within three years unless they are abandoned earlier, in which case these projects are written down to their estimated fair value in the period the decision to abandon the project is determined. We have a rigorous greenlight process designed to manage the risk of loss or abandonment. We have entered into film financing arrangements that involve the sale of a partial copyright interest in a film. Amounts received under these arrangements are deducted from the film’s cost.
60
Original programming: Capitalized original program costs are amortized utilizing an individual-film-forecast-computation method over the applicable title’s life cycle based upon the ratio of current period to estimated remaining total gross revenues (“ultimate revenues”) for each title. Original programming development costs that have not been greenlit for production are expensed. An impairment charge is recorded when the fair value of the original programming is less than the unamortized production cost or the programming is abandoned.
Acquired programming: The costs incurred in acquiring programs are capitalized and amortized over the license period or projected useful life of the programming if shorter, commencing upon availability, based on estimated future airings. If initial airings are expected to generate higher revenues an accelerated method of amortization is used. Net realizable value of acquired rights programming is evaluated quarterly by us on a daypart basis, which is defined as an aggregation of programs broadcast during a particular time of day or an aggregation of programs of a similar type. We aggregate similar programming based on the specific demographic targeted by each respective program service. Net realizable value is determined by estimating advertising revenues to be derived from the future airing of the programming within the daypart as well as an allocation of affiliate fee revenue to the programming. An impairment charge may be necessary if our estimates of future cash flows of similar programming are insufficient or if programming is abandoned.
Home entertainment inventory: Home entertainment inventory is valued at the lower of cost or net realizable value. Cost is determined using the average cost method.
Property and Equipment
Property and equipment is stated at cost. Depreciation is calculated using the straight-line method. Leasehold improvements are amortized using the straight-line method over the shorter of their useful lives or the life of the lease. Costs associated with repairs and maintenance of property and equipment are expensed as incurred.
Goodwill, Intangible Assets and Other Long-Lived Assets
Goodwill represents the residual difference between the fair value of consideration paid for a business and the net assets acquired. Goodwill is not amortized, but rather is tested annually for impairment, on August 31 each year, or sooner when circumstances indicate impairment may exist. Goodwill is tested for impairment at the reporting unit level, which is an operating segment, or a business which is one level below that operating segment.
Identifiable intangible assets with finite lives are amortized over their estimated useful lives, which range up to 20 years, and identifiable intangible assets with indefinite lives are not amortized, but rather are tested annually for impairment, or sooner when circumstances indicate impairment may exist. Amortizable intangible assets and other long-lived assets are tested for impairment utilizing an income approach based on undiscounted cash flows upon the occurrence of certain triggering events and, if impaired, are written down to fair value.
Investments
Our investments primarily consist of investments in equity. Investments in which we have a significant influence, but not a controlling interest, are accounted for using the equity method. Other investments are carried at fair value, to the extent publicly traded, with unrealized gains and losses recorded in other comprehensive income, or at cost. We monitor our investments for impairment at least annually and make appropriate reductions in carrying values if we determine that an impairment charge is required based on qualitative and quantitative information. Our investments are included in Other assets – noncurrent in the Consolidated Balance Sheets.
Guarantees
At the inception of a guarantee, we recognize a liability for the fair value of an obligation assumed by issuing the guarantee. The related liability is subsequently reduced as utilized or extinguished and increased if there is a probable loss associated with the guarantee which exceeds the value of the recorded liability.
Treasury Stock
Treasury stock is accounted for using the cost method.
Fair Value Measurements
Fair value is defined as the price that would be received to sell an asset or paid to transfer a liability in an orderly transaction between market participants. The framework for measuring fair value provides a hierarchy that prioritizes the inputs to valuation techniques used in measuring fair value. The hierarchy gives the highest priority to unadjusted quoted prices in active markets for identical assets or liabilities (Level 1 measurement) and the lowest priority to unobservable inputs (Level 3 measurement). The three levels of the fair value hierarchy are as follows:
61
• | Level 1 – Inputs to the valuation methodology are unadjusted quoted prices for identical assets or liabilities in active markets. |
• | Level 2 – Inputs to the valuation methodology include: quoted prices for similar assets or liabilities in active markets; quoted prices for identical or similar assets or liabilities in inactive markets; inputs other than quoted prices that are observable for the asset or liability; inputs that are derived principally from or corroborated by observable market data by correlation or other means. |
• | Level 3 – Inputs to the valuation methodology are unobservable and significant to the fair value measurement. |
Our recurring fair value measures include marketable securities and derivative instruments and our non-recurring fair value measures include goodwill and intangible assets.
Derivative Financial Instruments
Derivative financial instruments are recorded on the Consolidated Balance Sheets as assets or liabilities and measured at fair value. For derivatives designated as hedges of the fair value of assets or liabilities, the changes in fair value of both the derivatives and the hedged items are recorded in current earnings as part of Other items, net in the Consolidated Statements of Earnings. For derivatives designated as cash flow hedges, the effective portion of the changes in fair value of the derivatives is recorded in Accumulated other comprehensive loss in the Consolidated Balance Sheets and subsequently recognized in earnings when the hedged items impact income. The fair value of derivative financial instruments is included in Prepaid and other assets and Other liabilities – current in the Consolidated Balance Sheets. Changes in the fair value of derivatives not designated as hedges and the ineffective portion of cash flow hedges are recorded in earnings. We do not hold or enter into financial instruments for speculative trading purposes.
Pension Benefits
Our defined benefit pension plans principally consist of both funded and unfunded noncontributory plans covering the majority of domestic employees and retirees. The funded defined benefit pension plan and unfunded pension plans are currently frozen to future benefit accruals. The expense we recognize is determined using certain assumptions, including the expected long-term rate of return and discount rate, among others. We recognize the funded status of our defined benefit plans (other than a multiemployer plan) as an asset or liability in the Consolidated Balance Sheets and recognize the changes in the funded status in the year in which the changes occur through Accumulated other comprehensive loss in the Consolidated Balance Sheets.
NOTE 3. ACCOUNTS RECEIVABLE
We had $482 million and $379 million of noncurrent trade receivables as of September 30, 2014 and 2013, respectively. The accounts receivable were primarily in the Filmed Entertainment segment, included within Other assets in our Consolidated Balance Sheets, and principally related to long-term television license arrangements. Such amounts are due in accordance with the underlying terms of the respective agreements and are principally from investment grade companies with which we have historically done business under similar terms, for which credit loss allowances are generally not considered necessary.
NOTE 4. ACQUISITION & INVESTMENTS
Acquisition
On September 10, 2014, we completed the acquisition of Channel 5 Broadcasting Limited ("Channel 5"), a UK television public service broadcaster, for £450 million. The acquisition will complement our pay television networks and increase our investment in content produced in the UK.
62
The following table summarizes our estimated allocation of the purchase price as of the acquisition date:
Purchase Price Allocation (in millions) | |||||
Inventory, net | $ | 161 | |||
Other current assets | 102 | ||||
Goodwill | 474 | ||||
Intangibles, net | 211 | ||||
Other assets | 69 | ||||
Total assets acquired | 1,017 | ||||
Program obligations and other current liabilities | 106 | ||||
Program obligations | 64 | ||||
Other liabilities | 100 | ||||
Total liabilities assumed | 270 | ||||
$ | 747 | ||||
The goodwill, which is not deductible for tax purposes, reflects the Company-specific synergies arising from the acquisition, as well as the value of the workforce. Intangible assets primarily consist of a broadcast license with a useful life of 20 years and trade names with useful lives ranging from 4 to 20 years.
The operating results of Channel 5 in the current and prior year are not material.
Investments
We had equity method investments totaling $207 million and $164 million, as of September 30, 2014 and 2013, respectively. We hold an equity interest of approximately 50% in EPIX, a joint venture formed with Lionsgate and Metro-Goldwyn-Mayer to exhibit certain motion pictures on behalf of the equity partners’ movie studios through a premium pay television channel and video-on-demand services available on multiple platforms. We also hold an equity interest of 50% in Viacom 18, a joint venture in India with Network 18 Media and Investments Limited. In addition, we had cost method investments totaling $81 million and $61 million as of September 30, 2014 and 2013, respectively.
Variable Interest Entities
In the normal course of business, we enter into joint ventures or make investments with business partners that support our underlying business strategy and provide us the ability to enter new markets to expand the reach of our brands, develop new programming and/or distribute our existing content. In certain instances, an entity in which we make an investment may qualify as a VIE. In determining whether we are the primary beneficiary of a VIE, we assess whether we have the power to direct matters that most significantly impact the activities of the VIE and have the obligation to absorb losses or the right to receive benefits from the VIE that could potentially be significant to the VIE.
Unconsolidated Variable Interest Entities: Our investment in Viacom 18 qualifies as a VIE. In connection with our investment, we do not have the power to direct matters that most significantly impact the activities of Viacom 18 and therefore we do not qualify as the primary beneficiary. Our carrying value in Viacom 18 was $68 million and $54 million as of September 30, 2014 and 2013, respectively. We and our venture partner each have a commitment to guarantee up to approximately $86 million of bank debt of Viacom 18. There were no borrowings outstanding at September 30, 2014 subject to this guarantee. Our risk of loss is limited to our carrying value and the aforementioned commitment.
Consolidated Variable Interest Entities: Our Consolidated Balance Sheets include amounts related to consolidated VIEs totaling $138 million in assets and $54 million in liabilities as of September 30, 2014, and $77 million in assets and $56 million in liabilities as of September 30, 2013. We have certain rights and obligations related to our investments, including the guarantee of certain third-party bank debt. The consolidated VIEs’ revenues, expenses and operating income were not significant for all periods presented.
63
NOTE 5. PROPERTY AND EQUIPMENT
Property and Equipment, net (in millions) | September 30, | Estimated Life (in years) | ||||||||
2014 | 2013 | |||||||||
Land | $ | 248 | $ | 248 | — | |||||
Buildings | 435 | 431 | up to 40 | |||||||
Capital leases | 266 | 277 | up to 15 | |||||||
Equipment and other | 1,852 | 1,773 | up to 15 | |||||||
Property and equipment | 2,801 | 2,729 | ||||||||
Less: Accumulated depreciation | (1,785 | ) | (1,689 | ) | ||||||
Property and equipment, net | $ | 1,016 | $ | 1,040 | ||||||
Depreciation expense, including assets under capital leases, was $177 million in 2014, $174 million in 2013 and $171 million in 2012. Depreciation expense related to capital leases was $21 million in 2014, $21 million in 2013 and $25 million in 2012. Accumulated depreciation of capital leases was $156 million and $148 million at September 30, 2014 and 2013, respectively.
NOTE 6. INVENTORY
Inventory (in millions) | September 30, | ||||||
2014 | 2013 | ||||||
Film inventory: | |||||||
Released, net of amortization | $ | 664 | $ | 570 | |||
Completed, not yet released | 131 | 40 | |||||
In process and other | 436 | 653 | |||||
Total film inventory, net of amortization | 1,231 | 1,263 | |||||
Original programming: | |||||||
Released, net of amortization | 1,409 | 1,343 | |||||
In process and other | 631 | 590 | |||||
Total original programming, net of amortization | 2,040 | 1,933 | |||||
Acquired program rights, net of amortization | 1,367 | 1,391 | |||||
Home entertainment inventory | 105 | 128 | |||||
Total inventory, net | 4,743 | 4,715 | |||||
Less current portion | (846 | ) | (770 | ) | |||
Total inventory-noncurrent, net | $ | 3,897 | $ | 3,945 | |||
We expect to amortize approximately $1.4 billion of original programming and film inventory, including released and completed, not yet released, during the fiscal year ending September 30, 2015 using the individual-film-forecast-computation method. In addition, we expect to amortize 87% of unamortized released original programming and film inventory, excluding acquired film libraries, at September 30, 2014, within the next three years. As of September 30, 2014, unamortized film libraries of $39 million remain to be amortized based on the respective film ultimates, where available, or on a straight-line basis over a remaining life of two years.
64
NOTE 7. GOODWILL AND INTANGIBLES
Goodwill
The following table details the change in goodwill by segment for 2014 and 2013:
Goodwill (in millions) | Media Networks | Filmed Entertainment | Total | ||||||||
Balance at September 30, 2012 | $ | 9,452 | $ | 1,593 | $ | 11,045 | |||||
Acquisitions | 54 | — | 54 | ||||||||
Foreign currency translation | (20 | ) | — | (20 | ) | ||||||
Balance at September 30, 2013 | 9,486 | 1,593 | 11,079 | ||||||||
Acquisitions | 479 | — | 479 | ||||||||
Dispositions | (5 | ) | — | (5 | ) | ||||||
Foreign currency translation | (18 | ) | — | (18 | ) | ||||||
Balance at September 30, 2014 | $ | 9,942 | $ | 1,593 | $ | 11,535 | |||||
Intangibles
The following table details our intangible asset balances by major asset classes:
Intangibles (in millions) | September 30, | ||||||
2014 | 2013 | ||||||
Finite-lived intangible assets: | |||||||
Subscriber agreements | $ | 57 | $ | 58 | |||
Film distribution and fulfillment services | — | 280 | |||||
Trade names, licenses and other intangible assets | 484 | 438 | |||||
Total finite-lived intangible assets | 541 | 776 | |||||
Accumulated amortization on finite-lived intangible assets: | |||||||
Subscriber agreements | (38 | ) | (35 | ) | |||
Film distribution and fulfillment services | — | (268 | ) | ||||
Trade names, licenses and other intangible assets | (159 | ) | (249 | ) | |||
Total accumulated amortization on finite-lived intangible assets | (197 | ) | (552 | ) | |||
Finite-lived intangible assets, net | $ | 344 | $ | 224 | |||
Indefinite-lived intangible assets | 55 | 55 | |||||
Total intangibles, net | $ | 399 | $ | 279 | |||
See Note 14 for information regarding an impairment of a trade name in 2014.
Amortization expense relating to intangible assets was $40 million for 2014 and $63 million for 2013 and 2012. We expect our aggregate annual amortization expense for existing intangible assets subject to amortization at September 30, 2014 to be as follows for each of the next five fiscal years:
Amortization of Intangibles (in millions) | |||||||||
2015 | 2016 | 2017 | 2018 | 2019 | |||||
Amortization expense | $33 | $31 | $30 | $27 | $24 | ||||
65
NOTE 8. DEBT
Our total debt consists of the following:
Debt (in millions) | September 30, | ||||||
2014 | 2013 | ||||||
Senior Notes and Debentures: | |||||||
Senior notes due September 2014, 4.375% | $ | — | $ | 599 | |||
Senior notes due February 2015, 1.250% | 600 | 600 | |||||
Senior notes due September 2015, 4.250% | 250 | 250 | |||||
Senior notes due April 2016, 6.250% | 917 | 917 | |||||
Senior notes due December 2016, 2.500% | 399 | 398 | |||||
Senior notes due April 2017, 3.500% | 498 | 497 | |||||
Senior notes due October 2017, 6.125% | 499 | 499 | |||||
Senior notes due September 2018, 2.500% | 498 | 497 | |||||
Senior notes due April 2019, 2.200% | 400 | — | |||||
Senior notes due September 2019, 5.625% | 552 | 552 | |||||
Senior notes due March 2021, 4.500% | 495 | 494 | |||||
Senior notes due December 2021, 3.875% | 593 | 592 | |||||
Senior notes due June 2022, 3.125% | 296 | 296 | |||||
Senior notes due March 2023, 3.250% | 298 | 298 | |||||
Senior notes due September 2023, 4.250% | 1,238 | 1,237 | |||||
Senior notes due April 2024, 3.875% | 546 | — | |||||
Senior debentures due April 2036, 6.875% | 1,072 | 1,072 | |||||
Senior debentures due October 2037, 6.750% | 76 | 76 | |||||
Senior debentures due February 2042, 4.500% | 245 | 245 | |||||
Senior debentures due March 2043, 4.375% | 1,089 | 1,085 | |||||
Senior debentures due June 2043, 4.875% | 249 | 249 | |||||
Senior debentures due September 2043, 5.850% | 1,242 | 1,242 | |||||
Senior debentures due April 2044, 5.250% | 549 | — | |||||
Capital lease and other obligations | 168 | 190 | |||||
Total debt | 12,769 | 11,885 | |||||
Less current portion | (18 | ) | (18 | ) | |||
Total noncurrent portion of debt | $ | 12,751 | $ | 11,867 | |||
The amounts classified in the current portion of debt consist of the portion of capital leases payable in the next twelve months. The Senior Notes due in February 2015 and September 2015 are classified as long-term debt as we have the intent as well as the ability, through utilization of our $2.5 billion revolving credit facility, to refinance this debt.
Senior Notes and Debentures
In March 2014, we issued a total of $1.5 billion of senior notes and debentures as follows:
• | 2.200% Senior Notes due April 2019 with an aggregate principal amount of $400 million at a price equal to 99.947% of the principal amount. |
• | 3.875% Senior Notes due April 2024 with an aggregate principal amount of $550 million at a price equal to 99.192% of the principal amount. |
• | 5.250% Senior Debentures due April 2044 with an aggregate principal amount of $550 million at a price equal to 99.831% of the principal amount. |
The proceeds, net of discount and other issuance fees and expenses, from the issuance of the senior notes and debentures were $1.484 billion.
66
In April 2014, we redeemed all $600 million of our outstanding Senior Notes due September 2014 at a redemption price equal to the sum of the principal amount and a make-whole amount, together totaling $611 million, and accrued and unpaid interest of $1 million. As a result of the redemption, we recognized a pre-tax extinguishment loss of $11 million.
Our outstanding senior notes and debentures provide for certain covenant packages typical for an investment grade company. There is one acceleration trigger for certain of the senior notes and debentures in the event of a change in control under certain specified circumstances coupled with ratings downgrades due to the change in control.
At September 30, 2014 and 2013, the total unamortized net discount related to the fixed rate senior notes and debentures was $419 million and $425 million, respectively.
The fair value of our senior notes and debentures was approximately $13.7 billion and $12.3 billion as of September 30, 2014 and 2013, respectively. The valuation of our publicly traded debt is based on quoted prices in active markets.
Credit Facility
We have a revolving credit agreement in the amount of $2.5 billion with a maturity date of November 2017. The credit facility is used for general corporate purposes and to support commercial paper outstanding, if any. The borrowing rate under the credit facility is LIBOR plus a margin ranging from 0.75% to 1.75% based on our current public debt rating. The credit facility has one principal financial covenant that requires our interest coverage for the most recent four consecutive fiscal quarters to be at least 3.0x, which we met as of September 30, 2014.
At September 30, 2014 and 2013, there were no amounts outstanding under our credit facility.
Commercial Paper
At September 30, 2014 and 2013, there was no commercial paper outstanding.
Scheduled Debt Maturities
Our scheduled maturities of debt at face value for each of the next five fiscal years and thereafter, excluding capital leases, outstanding at September 30, 2014 are as follows:
Maturities of Debt Excluding Capital Leases (in millions) | Year 1 | Year 2 | Year 3 | Year 4 | Year 5 | After 5 Years | ||||||
Debt | $898 | $918 | $900 | $1,000 | $950 | $8,402 | ||||||
NOTE 9. PENSION AND OTHER POSTRETIREMENT BENEFITS
Our defined benefit pension plans principally consist of both funded and unfunded noncontributory plans covering the majority of domestic employees and retirees. The funded plan provides a defined benefit based on a percentage of eligible compensation for periods of service. The funded defined benefit pension plan and unfunded pension plans are currently frozen to future benefit accruals.
The following tables summarize changes in the benefit obligation, the plan assets and the funded status of our pension plans utilizing a measurement date as of September 30, 2014 and 2013, respectively:
Change in Benefit Obligation (in millions) | Year Ended September 30, | ||||||
2014 | 2013 | ||||||
Benefit obligation, beginning of period | $ | 893 | $ | 1,139 | |||
Service cost | — | 8 | |||||
Interest cost | 46 | 43 | |||||
Actuarial loss/ (gain) | 159 | (203 | ) | ||||
Curtailment gain | — | (65 | ) | ||||
Benefits paid | (38 | ) | (29 | ) | |||
Benefit obligation, end of period | $ | 1,060 | $ | 893 | |||
67
Change in Plan Assets (in millions) | Year Ended September 30, | ||||||
2014 | 2013 | ||||||
Fair value of plan assets, beginning of period | $ | 638 | $ | 576 | |||
Actual return on plan assets | 46 | 85 | |||||
Employer contributions | 10 | 6 | |||||
Benefits paid | (38 | ) | (29 | ) | |||
Fair value of plan assets, end of period | $ | 656 | $ | 638 | |||
Funded status (in millions) | September 30, | ||||||
2014 | 2013 | ||||||
Funded status* | $ | (404 | ) | $ | (255 | ) | |
* These unfunded amounts are included in Other liabilities – noncurrent in the Consolidated Balance Sheets.
Accumulated Benefit Obligation
The accumulated benefit obligation includes no assumption about future compensation levels since our plans are frozen. Included in the change in benefit obligation table above are the following funded and unfunded plans with an accumulated benefit obligation equal to or in excess of plan assets at the end of the fiscal year.
Funded Plans | Unfunded Plans | Total Plans | |||||||||||||||||||||
Accumulated Benefit Obligation (in millions) | September 30, | September 30, | September 30, | ||||||||||||||||||||
2014 | 2013 | 2014 | 2013 | 2014 | 2013 | ||||||||||||||||||
Accumulated benefit obligation | $ | 761 | $ | 641 | $ | 299 | $ | 252 | $ | 1,060 | $ | 893 | |||||||||||
Fair value of plan assets | 656 | 638 | — | — | 656 | 638 | |||||||||||||||||
Funded Status | $ | (105 | ) | $ | (3 | ) | $ | (299 | ) | $ | (252 | ) | $ | (404 | ) | $ | (255 | ) | |||||
Net Periodic Benefit Costs
Our net periodic benefit cost under Viacom’s pension plans consists of the following:
Net Periodic Benefit Costs (in millions) | Year Ended September 30, | ||||||||||
2014 | 2013 | 2012 | |||||||||
Service cost | $ | — | $ | 8 | $ | 32 | |||||
Interest cost | 46 | 43 | 47 | ||||||||
Expected return on plan assets | (50 | ) | (45 | ) | (37 | ) | |||||
Recognized actuarial loss | 2 | 9 | 19 | ||||||||
Prior service cost | — | 1 | — | ||||||||
Net periodic benefit costs | $ | (2 | ) | $ | 16 | $ | 61 | ||||
The items reflected in Accumulated other comprehensive loss in the Consolidated Balance Sheets and not yet recognized as a component of net periodic benefit cost are:
Unrecognized Benefit Cost (in millions) | Year Ended September 30, | ||||||
2014 | 2013 | ||||||
Unrecognized actuarial loss | $ | 271 | $ | 110 | |||
68
The amounts recognized in other comprehensive income during the year are:
Other Comprehensive Income (in millions) | Year Ended September 30, | |||
Net actuarial loss | $ | 163 | ||
Recognized actuarial loss | (2 | ) | ||
Total pretax loss | $ | 161 | ||
Year Ended September 30, | |||||
Key Assumptions | 2014 | 2013 | |||
Weighted-average assumptions - benefit obligations | |||||
Discount rate | 4.50 | % | 5.25 | % | |
Weighted-average assumptions - net periodic costs | |||||
Discount rate | 5.25 | % | 3.91 | % | |
Expected long-term return on plan assets | 8.00 | % | 8.00 | % | |
Rate of compensation increase* | N/A | 4.00 | % | ||
* The rate of increase in compensation level assumption is not applicable due to the freeze of the pension plans.
Two key assumptions used in accounting for pension liabilities and expenses are the discount rate and expected rate of return on plan assets. The discount rate reflects the estimated rate at which the pension benefit obligations could effectively be settled. We used investment grade corporate bond yields to support our discount rate assumption. The expected long-term returns on plan assets were based upon the target asset allocation and return estimates for equity and debt securities. The expected rate of return for equities was based upon the risk-free rate plus a premium for equity securities. The expected return on debt securities was based upon an analysis of current and historical yields on portfolios of similar quality and duration.
Investment Policies and Strategies
The Viacom Investments Committee is responsible for managing the investment of assets under the funded pension plan in a prudent manner with regard to preserving principal while providing reasonable returns. The Viacom Investments Committee has established an investment policy through careful study of the returns and risks associated with alternative investment strategies in relation to the current and projected liabilities of the plan, after consulting with an outside investment advisor as it deems appropriate. The investment advisor’s role is to provide guidance to the Viacom Investments Committee on matters pertaining to the investment of plan assets including investment policy, investment selection, monitoring the plan’s performance and compliance with the plan’s investment policies.
The investment policy establishes target asset allocations based upon an analysis of the timing and amount of projected benefit payments, the expected returns and risk of the asset classes and the correlation of those returns. Our practice is to review asset allocations regularly with our investment advisor and rebalance as necessary. The range of target asset allocations under our investment policy are 55-75% domestic and non-U.S. equity securities, 25-40% domestic and non-U.S. debt securities and 0-10% in cash and other instruments.
The investment advisor implements the investment policy through investments in mutual funds and other pooled asset portfolios. Investments will be diversified within asset classes with the intent to minimize the risk of large losses to the plan.
The percentage of asset allocations of our funded pension plan at September 30, 2014 and 2013, by asset category were as follows:
September 30, | |||||
Asset Allocations of Funded Pension Plan | 2014 | 2013 | |||
Equity securities | 65 | % | 71 | % | |
Debt securities | 30 | 29 | |||
Cash and Cash Equivalents | 5 | — | |||
Total | 100 | % | 100 | % | |
Viacom Class B common stock represents approximately 3% of the plan assets fair values at September 30, 2014 and 2013.
69
Fair Value Measurement of Plan Assets
The following table sets forth the plan’s assets at fair value as of September 30, 2014 and 2013. For investments held at the end of the reporting period that are measured at fair value on a recurring basis, there were no transfers between levels from 2013 to 2014. The funded pension plan has no investments classified within level 3 of the valuation hierarchy.
Total | Level 1 | Level 2 | |||||||||||||||||||||
Fair Value of Plan Assets (in millions) | September 30, | September 30, | September 30, | ||||||||||||||||||||
2014 | 2013 | 2014 | 2013 | 2014 | 2013 | ||||||||||||||||||
Cash and Cash Equivalents (1) | $ | 32 | $ | — | $ | 2 | $ | — | $ | 30 | $ | — | |||||||||||
Equity Securities | |||||||||||||||||||||||
Common and preferred stock | 48 | 22 | 48 | 22 | — | — | |||||||||||||||||
U.S. large cap funds (2) | — | 201 | — | 201 | — | — | |||||||||||||||||
U.S. small / mid cap funds (2) | — | 80 | — | 80 | — | — | |||||||||||||||||
World ex-U.S. funds (2) | — | 148 | — | 148 | — | — | |||||||||||||||||
World funds (3) | 304 | — | — | — | 304 | — | |||||||||||||||||
Emerging markets funds (3) | 73 | — | — | — | 73 | — | |||||||||||||||||
Debt Securities | |||||||||||||||||||||||
U.S. treasury securities | 14 | — | — | — | 14 | — | |||||||||||||||||
Municipal & government issued bonds | 1 | — | — | — | 1 | — | |||||||||||||||||
Corporate bonds | 46 | — | — | — | 46 | — | |||||||||||||||||
Mortgage-backed & asset-backed securities | 44 | — | — | — | 44 | — | |||||||||||||||||
Emerging markets funds(2) | 27 | 26 | 27 | 26 | — | — | |||||||||||||||||
High yield funds (2) | — | 52 | — | 52 | — | — | |||||||||||||||||
Core fixed income funds (2) | — | 109 | — | 109 | — | — | |||||||||||||||||
Multi-strategy funds (4) | 67 | — | — | — | 67 | — | |||||||||||||||||
Total | $ | 656 | $ | 638 | $ | 77 | $ | 638 | $ | 579 | $ | — | |||||||||||
(1) Assets categorized as Level 2 reflect investments in money market funds.
(2) Assets reflect mutual funds.
(3) Assets reflect common/collective trust funds.
(4) Reflects investments in common/collective trust funds and limited partnerships
Money market funds are carried at amortized cost which approximates fair value due to the short-term maturity of these investments. Common and preferred stocks are reported at fair value based on quoted market prices on national securities exchanges. Investments in registered investment companies (mutual funds) are stated at the respective funds’ net asset value ("NAV"), which is determined based on market values at the closing price on the last business day of the year and is a quoted price in an active market. The fair value of common/ collective trust funds are based on their NAV at period-end. The fair value of U.S. Treasury securities and bonds is determined based on quoted market prices on national security exchanges, when available, or using valuation models which include certain other observable inputs including recent trading activity and broker quoted prices. Corporate bonds include securities of diverse industries, substantially all investment grade. Mortgage-backed and asset-backed securities are valued using valuation models which incorporate available dealer quotes and market information. The fair value of limited partnerships is valued at period-end based on its underlying investments.
Future Benefit Payments
The estimated future benefit payments for the next ten fiscal years are as follows:
Future Benefit Payments (in millions) | |||||||||||
2015 | 2016 | 2017 | 2018 | 2019 | 2020-2024 | ||||||
Pension benefits | $36 | $39 | $42 | $45 | $48 | $275 | |||||
Postretirement Health Care and Life Insurance Plans
Eligible employees participate in Viacom-sponsored health and welfare plans that provide certain postretirement health care and life insurance benefits to retired employees and their covered dependents. Most of the health and welfare plans are contributory and contain cost-sharing features such as deductibles and coinsurance which are adjusted annually. Claims are paid either through certain trusts funded by Viacom or by our own funds. The amounts related to these plans were not material for all periods presented.
70
401(k) Plans
Viacom has defined contribution (401(k)) plans for the benefit of substantially all our employees meeting certain eligibility requirements. Our costs recognized for such plans were $47 million in 2014, $42 million in 2013 and $23 million in 2012. In 2013, we increased the employer matching contribution and introduced a discretionary profit sharing contribution.
Multiemployer Benefit Plans
We contribute to various multiemployer pension plans under the terms of collective bargaining agreements that cover its union-represented employees. The risks of participating in these multiemployer plans are different from single-employer plans such that (i) contributions made by us to these plans may be used to provide benefits to employees of other participating employers; (ii) if a participating employer stops contributing to the plan, the unfunded obligations of the plan may be borne by the remaining participating employers; and (iii) if we choose to stop participating in some of our multiemployer plans, we may be required to pay those plans an amount based on the underfunded status of the plan, referred to as a withdrawal liability.
While no multiemployer pension plan that we contributed to is considered individually significant to us, we were listed on two Form 5500s as providing more than 5% of total contributions to each plan based on current information available. The most recent filed zone status (which denotes the financial health of a plan) under the Pension Protection Act of 2006 for these two plans is green, indicating that the plans are at least 80% funded. Total contributions that we made to multiemployer pension plans were $52 million in 2014, $43 million in 2013 and $42 million in 2012.
We also contribute to various other multiemployer benefit plans that provide health and welfare benefits to active and retired participants. Total contributions that we made to these non-pension multiemployer benefit plans were $74 million in 2014, $69 million in 2013 and $70 million in 2012.
NOTE 10. REDEEMABLE NONCONTROLLING INTEREST
We are subject to a redeemable put option, payable in a foreign currency, with respect to an international subsidiary. The put option expires in January 2016 and is classified as Redeemable noncontrolling interest in the Consolidated Balance Sheets. The activity reflected within redeemable noncontrolling interest for the fiscal years 2014, 2013 and 2012 is presented below.
Redeemable Noncontrolling Interest (in millions) | Year Ended September 30, | ||||||||||
2014 | 2013 | 2012 | |||||||||
Beginning balance | $ | 200 | $ | 179 | $ | 152 | |||||
Net earnings | 20 | 14 | 16 | ||||||||
Distributions | (17 | ) | (13 | ) | (16 | ) | |||||
Translation adjustment | 5 | (4 | ) | 7 | |||||||
Redemption value adjustment | 8 | 24 | 20 | ||||||||
Ending balance | $ | 216 | $ | 200 | $ | 179 | |||||
NOTE 11. COMMITMENTS AND CONTINGENCIES
Commitments
Our commitments primarily consist of programming and talent commitments, operating and capital lease arrangements, and purchase obligations for goods and services. These arrangements result from our normal course of business and represent obligations that may be payable over several years.
Our programming and talent commitments that are not recorded on the balance sheet, which aggregated to approximately $1.873 billion as of September 30, 2014, included $1.6 billion relating to media networks programming and $273 million for talent contracts. At September 30, 2014, we have recorded, on the balance sheet, programming commitments of $1.162 billion. Amounts expected to be paid over the next five fiscal years, beginning with fiscal year 2015, are as follows: $703 million, $283 million, $119 million, $48 million and $9 million.
We have long-term noncancelable operating and capital lease commitments for office space, equipment, transponders, studio facilities and vehicles.
71
At September 30, 2014, minimum rental payments under noncancelable leases by fiscal year are as follows:
Noncancelable Lease Commitments (in millions) | Capital | Operating | |||||
2015 | $ | 23 | $ | 247 | |||
2016 | 25 | 228 | |||||
2017 | 25 | 202 | |||||
2018 | 25 | 173 | |||||
2019 | 25 | 72 | |||||
2020 and thereafter | 17 | 954 | |||||
Total minimum payments | $ | 140 | $ | 1,876 | |||
Amounts representing interest | (20 | ) | |||||
Total | $ | 120 | |||||
Future minimum operating lease payments have been reduced by future minimum sublease income of $37 million. Rent expense amounted to $227 million in 2014, $205 million in 2013 and $201 million in 2012.
We also have purchase obligations which include agreements to purchase goods or services in the future that totaled $1.177 billion as of September 30, 2014.
Our collaborative arrangements principally relate to contractual arrangements with other studios to jointly finance and distribute theatrical productions (“co-financing arrangements”). A co-financing arrangement typically involves joint ownership of the film asset with each partner responsible for distribution of the film in specific territories. The partners share in the profits and losses of the film in accordance with their respective ownership interest. The amounts recorded in the Consolidated Statements of Earnings related to collaborative arrangements were not material.
Contingencies
Guarantees: In the course of our business, we both provide and receive the benefit of indemnities that are intended to allocate certain risks associated with business transactions.
Leases - We have certain indemnification obligations with respect to leases primarily associated with the previously discontinued operations of Famous Players Inc. (“Famous Players”). In addition, we have certain indemnities provided by the acquirer of Famous Players. These lease commitments amounted to approximately $381 million as of September 30, 2014. The amount of lease commitments varies over time depending on expiration or termination of individual underlying leases, or of the related indemnification obligation, and foreign exchange rates, among other things. We may also have exposure for certain other expenses related to the leases, such as property taxes and common area maintenance. We have recorded a liability of $192 million with respect to such obligations as of September 30, 2014. We believe our accrual is sufficient to meet any future obligations based on our consideration of available financial information, the lessees’ historical performance in meeting their lease obligations and the underlying economic factors impacting the lessees’ business models.
Other - We have indemnification obligations with respect to letters of credit and surety bonds primarily used as security against non-performance in the normal course of business. The outstanding letters of credit and surety bonds at September 30, 2014 were $36 million and are not recorded on our Consolidated Balance Sheet.
See Note 4 for information regarding our guarantee of the debt of Viacom 18.
Legal Matters: Litigation is inherently uncertain and always difficult to predict. However, based on our understanding and evaluation of the relevant facts and circumstances, we believe that the legal matters described below and other litigation to which we are a party are not likely, in the aggregate, to have a material adverse effect on our results of continuing operations, financial position or operating cash flows.
In February 2013, Cablevision Systems Corporation filed a lawsuit in the United States District Court for the Southern District of New York alleging that Viacom’s industry standard practice of offering discounts for additional network distribution constituted a “tying” arrangement in violation of federal and New York state antitrust laws. Similar arrangements have been upheld by numerous federal and state courts, including in a federal case in which Cablevision itself advocated for the legality of such arrangements. We believe the lawsuit is without merit. In July 2014, Viacom answered the amended complaint and asserted counterclaims against Cablevision for having fraudulently induced Viacom to renew their affiliate agreement at the end
72
of 2012 on terms which Cablevision intended to challenge in the courts. Cablevision answered the counterclaims in September 2014.
In August 2012, a complaint was filed in the United States District Court for the District of Delaware by a Viacom Class B stockholder against us and each member of our Board of Directors. The complaint purported to be a derivative action alleging that, between 2008 and 2011, we violated the terms of our 2007 Senior Executive Short-Term Incentive Plan (the “2007 Plan”) by improperly using subjective criteria to increase the bonuses paid to Messrs. Redstone, Dauman and Dooley in each of those years. The plaintiff alleged that during this period Messrs. Redstone, Dauman and Dooley were paid more than the 2007 Plan permitted and the plaintiff sought to recover the amount of the claimed overpayment, plus interest, for the Company. The plaintiff also alleged that adoption of the Viacom 2012 Senior Executive Short-Term Incentive Plan (the “2012 Plan”) required the vote of all Viacom stockholders and not just holders of our voting Class A common stock. Accordingly, the plaintiff sought to enjoin any payment under the 2012 Plan until a new vote on that plan that included Class B stockholders occurred. In July 2013, the District Court granted our motion to dismiss the complaint. In June 2014, the United States Court of Appeals for the Third Circuit affirmed the decision of the District Court to dismiss the case, and the matter is now fully resolved.
NOTE 12. STOCKHOLDERS’ EQUITY
Common Stock
The Viacom Board of Directors has the power to issue shares of authorized but unissued Class A common stock and Class B common stock without further stockholder action, subject to the requirements of applicable law and stock exchanges. Viacom’s certificate of incorporation authorizes 375 million shares of Class A common stock and 5 billion shares of Class B common stock. The number of authorized shares of Class A common stock and Class B common stock could be increased with the approval of the stockholders of a majority of the outstanding shares of Class A common stock and without any action by the holders of shares of Class B common stock.
The following is a description of the material terms of Viacom’s capital stock. The following description is not meant to be complete and is qualified by reference to Viacom’s certificate of incorporation and bylaws and Delaware General Corporation Law.
Voting Rights: Holders of Class A common stock are entitled to one vote per share. Holders of Class B common stock do not have any voting rights, except as required by Delaware law. Generally, all matters to be voted on by Viacom stockholders must be approved by a majority of the aggregate voting power of the shares of Class A common stock present in person or represented by proxy at a meeting of stockholders, except in certain limited circumstances and as required by Delaware law.
Dividends: Stockholders of Class A common stock and Class B common stock will share ratably in any cash dividend declared by the Board of Directors, subject to any preferential rights of any outstanding preferred stock.
Conversion: So long as there are 5,000 shares of Class A common stock outstanding, each share of Class A common stock will be convertible at the option of the holder of such share into one share of Class B common stock.
Liquidation Rights: In the event of liquidation, dissolution or winding-up of Viacom, all stockholders of common stock, regardless of class, will be entitled to share ratably in any assets available for distributions to stockholders of shares of Viacom common stock subject to the preferential rights of any outstanding preferred stock.
Split, Subdivisions or Combination: In the event of a split, subdivision or combination of the outstanding shares of Class A common stock or Class B common stock, the outstanding shares of the other class of common stock will be divided proportionally.
Preemptive Rights: Shares of Class A common stock and Class B common stock do not entitle a stockholder to any preemptive rights enabling a stockholder to subscribe for or receive shares of stock of any class or any other securities convertible into shares of stock of any class of Viacom.
Preferred Stock
Our capital stock includes 25 million authorized shares of preferred stock with a par value of $0.001 per share. At September 30, 2014 and 2013, none of the 25 million authorized shares of the preferred stock were issued and outstanding.
73
Stock Repurchase Program
During 2014, we repurchased 40.7 million shares for an aggregate price of $3.4 billion. From October 1, 2014 through November 12, 2014, we repurchased an additional 3.6 million shares for an aggregate price of $260 million. As of November 12, 2014, we had $6.24 billion of remaining capacity in our $20.0 billion stock repurchase program. During 2013 and 2012, we repurchased 69.2 million and 59.9 million shares under the program for an aggregate price of $4.8 billion and $2.8 billion, respectively.
Accumulated Other Comprehensive Loss
The components of Accumulated other comprehensive loss are as follows:
Accumulated Other Comprehensive Loss (in millions) | September 30, | ||||||||||
2014 | 2013 | 2012 | |||||||||
Foreign currency translation adjustments | $ | (106 | ) | $ | (20 | ) | $ | 19 | |||
Defined benefit pension plans | (186 | ) | (82 | ) | (272 | ) | |||||
Cash flow hedges | (1 | ) | 1 | (8 | ) | ||||||
Available for sale securities | — | — | (3 | ) | |||||||
Total | $ | (293 | ) | $ | (101 | ) | $ | (264 | ) | ||
NOTE 13. EQUITY-BASED COMPENSATION
Our 2006 Long-Term Management Incentive Plan, as amended and restated effective January 1, 2011 (the “LTMIP”), provides for various types of equity awards, including stock options, stock appreciation rights, restricted shares, restricted share units (“RSUs”), unrestricted shares of Class B common stock, phantom shares, dividend equivalents, performance share units (“PSUs”), performance-based RSUs (“PRSUs”) and other awards, or a combination of any of the above. In addition, our equity plans for outside directors provide for an annual grant of RSUs. We have primarily granted stock options and RSUs to employees. Certain senior executives have also received PSUs and PRSUs.
Stock options generally vest ratably over a four-year period from the date of grant and expire eight to ten years after the date of grant. Employee RSUs typically vest ratably over a four-year period from the date of the grant. Director RSUs typically vest one year from the date of grant. The target number of PSUs granted to an executive representing the right to receive a corresponding number of shares of Class B common stock, subject to adjustment depending on the total shareholder return (“TSR”) of our Class B common stock measured against the TSR of the common stock of the companies comprising the S&P 500 Index at the start of the measurement period. The measurement period is at least three years. The number of shares of Class B common stock an executive is entitled to receive at the end of the applicable measurement period ranges from 0% to 300% of the target PSU award. If Viacom’s percentile rank of TSR relative to the TSR for the companies in the S&P 500 Index is less than the 25th percentile, the target grant is forfeited unless we have achieved a specified level of earnings per share set in advance for the measurement period, in which case the executive would receive a percentage of the target award. The PRSUs vest in four equal annual installments and will deliver, at the time of vesting, 75% to 125% of the target number of shares of Class B common stock underlying the PRSUs, depending on our achievement of certain financial targets over specified periods. RSUs, PSUs and PRSUs accrue dividends each time we declare a quarterly cash dividend while the award is outstanding, which are paid upon vesting on the number of shares delivered and are forfeited if the award does not vest.
Upon the exercise of a stock option award or the vesting of RSUs, PSUs or PRSUs, shares of Class B common stock are issued from authorized but unissued shares or from treasury stock. At September 30, 2014, we had 377.0 million shares in treasury. The aggregate number of equity awards authorized and available under the LTMIP for future grants as of September 30, 2014 was approximately 24.0 million, assuming that outstanding PSU and PRSU awards are paid at target except for those awards for which the measurement period has been completed.
74
Presented below is a summary of the compensation cost we recognized in the accompanying Consolidated Statements of Earnings:
Equity-Based Compensation Expense (in millions) | Year Ended September 30, | ||||||||||
2014 | 2013 | 2012 | |||||||||
Recognized in earnings: | |||||||||||
Stock options | $ | 37 | $ | 42 | $ | 41 | |||||
RSUs, PSUs and PRSUs | 85 | 86 | 81 | ||||||||
Total compensation cost in earnings | $ | 122 | $ | 128 | $ | 122 | |||||
Tax benefit recognized | $ | 40 | $ | 41 | $ | 39 | |||||
Capitalized equity-based compensation expense | $ | 6 | $ | 6 | $ | 10 | |||||
Stock Options
The fair value of each option grant is estimated on the date of grant using the Black-Scholes option-pricing model. The determination of volatility is principally based upon implied volatilities from traded options. The expected term, representing the period of time that options granted are expected to be outstanding, is estimated using a lattice-based model incorporating historical post vest exercise and employee termination behavior. The risk-free rate assumed in valuing the options is based on the U.S. Treasury Yield curve in effect applied against the expected term of the option at the time of the grant. The expected dividend yield is estimated by dividing the expected annual dividend by the market price of our common stock at the date of grant. Below are the weighted average fair value of awards granted in the periods presented and the weighted average of the applicable assumptions used to value stock options at grant date.
Year Ended September 30, | |||||||||||
Key Assumptions | 2014 | 2013 | 2012 | ||||||||
Weighted average fair value of grants | $ | 16.52 | $ | 13.02 | $ | 10.17 | |||||
Weighted average assumptions: | |||||||||||
Expected stock price volatility | 25.0 | % | 25.7 | % | 30.7 | % | |||||
Expected term of options (in years) | 4.6 | 4.7 | 5.0 | ||||||||
Risk-free interest rate | 1.5 | % | 0.8 | % | 0.8 | % | |||||
Expected dividend yield | 1.6 | % | 1.7 | % | 2.3 | % | |||||
The following table summarizes information about our stock option transactions:
Year Ended September 30, 2014 | Year Ended September 30, 2013 | Year Ended September 30, 2012 | ||||||||||||||||||
Stock Options (number of options in thousands) | Options | Weighted average exercise price | Options | Weighted average exercise price | Options | Weighted average exercise price | ||||||||||||||
Outstanding at the beginning of the period | 21,441.9 | $ | 42.85 | 29,269.5 | $ | 40.22 | 35,375.7 | $ | 40.91 | |||||||||||
Granted | 2,040.7 | 84.46 | 2,363.3 | 69.56 | 3,110.0 | 47.37 | ||||||||||||||
Exercised | (4,233.2 | ) | 40.71 | (9,792.1 | ) | 41.23 | (6,398.8 | ) | 41.94 | |||||||||||
Forfeited or expired | (190.9 | ) | 54.21 | (398.8 | ) | 47.61 | (2,817.4 | ) | 52.94 | |||||||||||
Outstanding at the end of the period | 19,058.5 | $ | 47.67 | 21,441.9 | $ | 42.85 | 29,269.5 | $ | 40.22 | |||||||||||
Exercisable at the end of the period | 12,656.1 | $ | 38.75 | 13,024.6 | $ | 37.43 | 19,004.6 | $ | 39.32 | |||||||||||
The weighted average remaining contractual life of stock options outstanding and exercisable at September 30, 2014 was 4 years and 3 years, respectively. The aggregate intrinsic value of stock options outstanding and exercisable at September 30, 2014 was $573 million and $483 million, respectively.
75
The following table summarizes information relating to stock option exercises during the periods presented:
Year Ended September 30, | |||||||||||
Stock Option Exercises (in millions) | 2014 | 2013 | 2012 | ||||||||
Proceeds from stock option exercises | $ | 173 | $ | 403 | $ | 268 | |||||
Intrinsic value | $ | 182 | $ | 270 | $ | 51 | |||||
Excess Tax benefit | $ | 53 | $ | 77 | $ | — | |||||
Total unrecognized compensation cost related to unvested stock option awards at September 30, 2014 was approximately $65 million and is expected to be recognized on a straight-line basis over a weighted-average period of 3 years.
Other Equity-Based Awards
The grant date fair value for RSUs and PRSUs is based on our stock price on the date of the grant. The grant date fair value for the PSUs subject to the market and performance condition indicated earlier in this note is computed using a Monte Carlo model to estimate the total return ranking of Viacom among the S&P 500 Index companies on the date of grant over the measurement periods. Compensation cost assumes all performance goals will be met and is being recognized as the requisite service period is fulfilled.
The following table summarizes activity relating to our RSUs, PSUs and PRSUs:
Year Ended September 30, 2014 | Year Ended September 30, 2013 | Year Ended September 30, 2012 | ||||||||||||||||||
RSUs, PSUs and PRSUs (number of shares in thousands) | Number of shares | Weighted average grant date fair value | Number of shares | Weighted average grant date fair value | Number of shares | Weighted average grant date fair value | ||||||||||||||
Unvested at the beginning of the period | 4,311.4 | $ | 53.54 | 5,721.5 | $ | 44.22 | 7,200.7 | $ | 38.58 | |||||||||||
Granted* | 1,570.8 | 81.86 | 1,750.2 | 62.51 | 2,846.5 | 45.02 | ||||||||||||||
Vested | (2,593.8 | ) | 53.88 | (3,005.2 | ) | 41.49 | (4,028.4 | ) | 35.27 | |||||||||||
Forfeited | (150.1 | ) | 55.20 | (155.1 | ) | 44.33 | (297.3 | ) | 36.62 | |||||||||||
Unvested at the end of the period | 3,138.3 | $ | 67.35 | 4,311.4 | $ | 53.54 | 5,721.5 | $ | 44.22 | |||||||||||
* Grant activity includes 0.2 million, 0.2 million and 0.3 million of performance-based share units at target for 2014, 2013 and 2012, respectively.
The total weighted average remaining contractual life and aggregate intrinsic value of unvested RSUs, PSUs and PRSUs at September 30, 2014 was 1 year and $241 million, respectively.
The fair value of RSUs, PSUs and PRSUs vested was $212 million in 2014, $175 million in 2013 and $187 million in 2012. Total unrecognized compensation cost related to these awards at September 30, 2014 was approximately $135 million and is expected to be recognized over a weighted-average period of 3 years.
NOTE 14. RESTRUCTURING, ASSET IMPAIRMENT & OTHER CHARGES
In 2014, we made strategic decisions to realign certain channels in several international markets, resulting in a non-cash impairment charge of $43 million related to an international trade name at Media Networks. See Note 20 for additional information regarding the impairment.
In 2013 we engaged in a global business transformation initiative, which included the migration of certain financial processing systems to an enterprise-wide general ledger system, as well as undertook a strategic review of some of our brands. This resulted in restructuring, asset impairment and other charges of $106 million that included severance charges of $86 million ($61 million at Media Networks and $25 million at Filmed Entertainment), a $7 million impairment charge resulting from the decision to abandon an intangible asset and $13 million of charges related to management’s decision to cease use of certain original and acquired programming on one of our Media Networks channels. The programming charge represented the acceleration of amortization of such programming into the 2013 fiscal fourth quarter and was included within Operating expenses in the Consolidated Statement of Earnings.
76
The restructuring charges gave rise to certain future liabilities, the components of which are detailed below for 2014, 2013 and 2012. The payments during 2014 reflected in the table below are related to the 2013 restructuring plan. The remaining liability at September 30, 2014 relates predominantly to severance payments yet to be paid out with respect to the 2013 plan pursuant to the respective underlying contractual arrangements. We expect the balance of the severance will be paid in fiscal 2015.
Restructuring Liability (in millions) | Media Networks | Filmed Entertainment | Total | |||||||||
September 30, 2011 | $ | 80 | $ | 44 | $ | 124 | ||||||
Severance payments | (39 | ) | (31 | ) | (70 | ) | ||||||
Lease payments | (3 | ) | (4 | ) | (7 | ) | ||||||
September 30, 2012 | 38 | 9 | 47 | |||||||||
Additions | 61 | 25 | 86 | |||||||||
Severance payments | (20 | ) | (7 | ) | (27 | ) | ||||||
Lease payments | (3 | ) | — | (3 | ) | |||||||
September 30, 2013 | 76 | 27 | 103 | |||||||||
Severance payments | (36 | ) | (16 | ) | (52 | ) | ||||||
Lease payments | (1 | ) | — | (1 | ) | |||||||
Revisions to initial estimates | (9 | ) | — | (9 | ) | |||||||
September 30, 2014 | $ | 30 | $ | 11 | $ | 41 | ||||||
NOTE 15. OTHER ITEMS, NET
The items included in other items, net are as follows:
Other Items, net (in millions) | Year Ended September 30, | ||||||||||
2014 | 2013 | 2012 | |||||||||
Gain on sale of HBO Pacific Partners and LAPTV | $ | — | $ | 111 | $ | — | |||||
Other investment gains | — | 46 | — | ||||||||
Impairment of investment | — | (23 | ) | — | |||||||
Foreign exchange loss | (14 | ) | (23 | ) | (8 | ) | |||||
Other gains/(losses) | 3 | (5 | ) | 3 | |||||||
Other items, net | $ | (11 | ) | $ | 106 | $ | (5 | ) | |||
In 2013, we completed the sales of our 20% interest in HBO Pacific Partners, V.O.F. (“HBO Pacific Partners”) and our 22.5% interest in LAPTV, LLC (“LAPTV”), partnerships that own pay television channels under various brand names and that were accounted for under the equity method. The sales resulted in aggregate total proceeds of $124 million and a gain of $111 million.
NOTE 16. INCOME TAXES
Earnings from continuing operations before provision for income taxes consist of the following:
Earnings from Continuing Operations before Provision for Income Taxes (in millions) | Year Ended September 30, | ||||||||||
2014 | 2013 | 2012 | |||||||||
United States | $ | 2,924 | $ | 3,040 | $ | 2,984 | |||||
International | 590 | 479 | 486 | ||||||||
Pre-tax earnings from continuing operations | $ | 3,514 | $ | 3,519 | $ | 3,470 | |||||
77
The provision for income taxes from continuing operations consists of the following:
Provision for Income Taxes from Continuing Operations (in millions) | Year Ended September 30, | ||||||||||
2014 | 2013 | 2012 | |||||||||
Current provision for income taxes: | |||||||||||
Federal | $ | 1,049 | $ | 401 | $ | 872 | |||||
State and local | 122 | 23 | 117 | ||||||||
International | 169 | 152 | 183 | ||||||||
Total current provision for income taxes | 1,340 | 576 | 1,172 | ||||||||
Deferred provision for income taxes | (290 | ) | 494 | (87 | ) | ||||||
Provision for income taxes | $ | 1,050 | $ | 1,070 | $ | 1,085 | |||||
A reconciliation of the effective income tax rate on continuing operations to the U.S. federal statutory income tax rate is as follows:
Year Ended September 30, | ||||||||
Effective Tax Rate | 2014 | 2013 | 2012 | |||||
U.S. federal statutory income tax rate | 35.0 | % | 35.0 | % | 35.0 | % | ||
State and local taxes, net of federal benefit | 1.9 | 2.2 | 2.2 | |||||
Effect of international operations | (3.6 | ) | (2.6 | ) | (0.8 | ) | ||
Qualified production activities deduction | (3.2 | ) | (2.1 | ) | (3.0 | ) | ||
Change in valuation allowance | (0.3 | ) | (1.8 | ) | (1.4 | ) | ||
All other, net | 0.1 | (0.3 | ) | (0.7 | ) | |||
Effective tax rate, continuing operations | 29.9 | % | 30.4 | % | 31.3 | % | ||
We recognized net discrete tax benefits of $49 million in 2014, $54 million in 2013 and $94 million in 2012, which served to reduce the provision for income taxes for those periods. The benefits in 2014 are principally related to the reversal of deferred taxes on earnings deemed permanently reinvested and the recognition of capital loss carryforwards. The benefits in 2013 principally reflect the release of tax reserves with respect to certain effectively settled tax positions, as well as the recognition of certain capital loss carryforward and tax credit benefits. The benefits in 2012 include certain operating and capital loss carryforward benefits as well as the release of tax reserves with respect to certain effectively settled tax positions.
The tax effects of the items recorded as deferred tax assets and liabilities are:
Deferred Taxes (in millions) | September 30, | ||||||
2014 | 2013 | ||||||
Deferred tax assets: | |||||||
Accrued liabilities | $ | 175 | $ | 199 | |||
Postretirement and other employee benefits | 391 | 294 | |||||
Tax credit and loss carryforwards | 356 | 274 | |||||
All other | 213 | 188 | |||||
Total deferred tax assets | 1,135 | 955 | |||||
Valuation allowance | (308 | ) | (277 | ) | |||
Total deferred tax assets, net | $ | 827 | $ | 678 | |||
Deferred tax liabilities: | |||||||
Property, equipment and intangible assets | $ | (498 | ) | $ | (436 | ) | |
Unbilled revenue | (142 | ) | (133 | ) | |||
Financing obligations | (121 | ) | (120 | ) | |||
Film & TV production expenditures | (252 | ) | (535 | ) | |||
Total deferred tax liabilities | (1,013 | ) | (1,224 | ) | |||
Deferred taxes, net | $ | (186 | ) | $ | (546 | ) | |
78
We have recorded valuation allowances for certain deferred tax assets, which are primarily related to capital losses in the U.S. and net operating losses in foreign jurisdictions, as sufficient uncertainty exists regarding the future realization of these assets.
We have $386 million of U.S. tax loss carryforwards at September 30, 2014. The utilization of these carryforwards as an available offset to future taxable income is subject to limitations under U.S. federal income tax laws. These carryforwards begin to expire in fiscal year 2015. In addition, we have $661 million of tax losses in various international jurisdictions that are primarily from countries with unlimited carry forward periods and $86 million of tax losses that expire in the fiscal years 2015 through 2031. The pre-valuation allowance deferred tax asset amount related to these U.S. and international tax loss carryforwards is $356 million.
The net deferred tax assets and deferred tax liabilities included in the Consolidated Balance Sheets were as follows:
Deferred Tax Assets / (Liabilities) (in millions) | September 30, | |||||||
2014 | 2013 | |||||||
Current deferred tax assets | $ | 8 | $ | 58 | ||||
Noncurrent deferred tax assets | 105 | 45 | ||||||
Current deferred tax liabilities | (33 | ) | — | |||||
Noncurrent deferred tax liabilities | (266 | ) | (649 | ) | ||||
Deferred taxes, net | $ | (186 | ) | $ | (546 | ) | ||
Current and noncurrent deferred tax assets are included within Prepaid and other assets and Other assets, respectively and current deferred tax liabilities are included within Other liabilities-current in the Consolidated Balance Sheets.
As of September 30, 2014, we have not made any provision for U.S. income taxes on approximately $2.5 billion of unremitted earnings of our international subsidiaries since these earnings are permanently reinvested outside the U.S. If these earnings were to be remitted in the future, the related U.S. income tax liability may be reduced by any foreign income taxes previously paid on these earnings. Under current U.S. tax laws, repatriating unremitted earnings could result in incremental taxes of 10% -15% on the repatriated amounts depending on the territory. To the extent that any tax reform legislation were to lower the U.S. federal statutory income tax rate from its current 35%, there could be a corresponding reduction in the estimate of incremental taxes that would result from repatriating unremitted earnings.
A reconciliation of the beginning and ending amounts of unrecognized tax benefits, excluding interest and penalties, is as follows:
Unrecognized Tax Benefits (in millions) | Year Ended September 30, | ||||||||||
2014 | 2013 | 2012 | |||||||||
Balance at beginning of the period | $ | 159 | $ | 207 | $ | 212 | |||||
Gross additions based on tax positions related to the current year | 25 | 29 | 28 | ||||||||
Gross additions for tax positions of prior years | 10 | 5 | 24 | ||||||||
Gross reductions for tax positions of prior years | (5 | ) | (50 | ) | (44 | ) | |||||
Settlements | — | (25 | ) | (2 | ) | ||||||
Expiration of the statute of limitation | (4 | ) | (7 | ) | (11 | ) | |||||
Balance at end of the period | $ | 185 | $ | 159 | $ | 207 | |||||
The total amount of unrecognized tax benefits at September 30, 2014, if recognized, would favorably affect the effective tax rate.
As discussed in Note 2, we recognize interest and penalties accrued related to unrecognized tax benefits as a component of the Provision for income taxes in the Consolidated Statements of Earnings. We recognized interest and penalties of $10 million in 2014, $9 million in 2013 and $15 million in 2012. We had accruals of $40 million and $35 million related to interest and penalties recorded as a component of Other liabilities – noncurrent in the Consolidated Balance Sheets at September 30, 2014 and 2013, respectively.
We and our subsidiaries file income tax returns with the Internal Revenue Service (“IRS”) and various state and international jurisdictions. The IRS concluded its examination of our U.S. consolidated income tax returns through 2009 in 2013. Currently, there are no material potential income tax liabilities still in dispute with respect to the IRS examination of 2010. The IRS began
79
its examination of our 2011 and 2012 U.S. consolidated federal income tax returns in the fourth quarter of fiscal 2014. Tax authorities are also conducting examinations of Viacom subsidiaries in various state and local jurisdictions, including New York State and New York City. Due to potential resolution of unrecognized tax positions involving multiple tax periods and jurisdictions, it is reasonably possible that a reduction of up to $100 million of unrecognized income tax benefits may occur within 12 months, some of which, depending on the nature of the settlement, may affect our income tax provision and therefore benefit the resulting effective tax rate. The majority of these uncertain tax positions, when recognized in the financial statements, would be recorded in the Consolidated Statements of Earnings as part of the Provision for income taxes. The actual amount could vary significantly depending on the ultimate timing and nature of any settlements.
NOTE 17. DISCONTINUED OPERATIONS
Net losses from discontinued operations were $1 million, $12 million and $364 million for the three-year period ending September 30, 2014, respectively, principally related to Harmonix, which was sold in December 2010.
Discontinued operations for the year ended September 30, 2012 principally reflects a $383 million pre-tax charge related to the earn-out dispute with the former shareholders of Harmonix. For tax purposes, the disposal of Harmonix and related earn-out payment generated tax benefits of approximately $250 million, of which approximately $103 million was utilized as of September 30, 2014. The remaining benefit will be available to offset qualifying future cash taxes.
NOTE 18. EARNINGS PER SHARE
The following table sets forth the weighted average number of common shares outstanding used in determining basic and diluted earnings per common share and anti-dilutive shares:
Weighted Average Number of Common Shares Outstanding and Anti-Dilutive Common Shares (in millions) | Year Ended September 30, | |||||||
2014 | 2013 | 2012 | ||||||
Weighted average number of common shares outstanding, basic | 432.1 | 486.2 | 530.7 | |||||
Dilutive effect of equity awards | 8.1 | 8.6 | 6.8 | |||||
Weighted average number of common shares outstanding, diluted | 440.2 | 494.8 | 537.5 | |||||
Anti-dilutive common shares | 1.1 | 3.2 | 12.5 | |||||
NOTE 19. SUPPLEMENTAL CASH FLOW
Our supplemental cash flow information is as follows:
Supplemental Cash Flow Information (in millions) | Year Ended September 30, | ||||||||||
2014 | 2013 | 2012 | |||||||||
Cash paid for interest* | $ | 568 | $ | 475 | $ | 409 | |||||
Cash paid for income taxes | $ | 1,021 | $ | 463 | $ | 1,069 | |||||
* Includes cash payments related to discontinued operations of $28 million and $3 million in 2013 and 2012, respectively.
Cash paid for income taxes in the year ended September 30, 2014 increased from 2013, which included a benefit from the retroactive reenactment of legislation allowing for accelerated tax deductions on certain qualified film and television productions.
80
NOTE 20. FAIR VALUE MEASUREMENTS
Assets/Liabilities Measured and Recorded at Fair Value on a Recurring Basis
The following table summarizes our financial assets and liabilities measured at fair value on a recurring basis as of September 30, 2014 and 2013:
Financial Asset (Liability) (in millions) | Total | Quoted Prices In Active Markets for Identical Assets Level 1 | Significant Other Observable Inputs Level 2 | Significant Unobservable Inputs Level 3 | |||||||||||
September 30, 2014 | |||||||||||||||
Marketable securities | $ | 107 | $ | 107 | $ | — | $ | — | |||||||
Derivatives | (8 | ) | — | (8 | ) | — | |||||||||
Total | $ | 99 | $ | 107 | $ | (8 | ) | $ | — | ||||||
September 30, 2013 | |||||||||||||||
Marketable securities | $ | 89 | $ | 89 | $ | — | $ | — | |||||||
Derivatives | (2 | ) | — | (2 | ) | — | |||||||||
Total | $ | 87 | $ | 89 | $ | (2 | ) | $ | — | ||||||
The fair value for marketable securities is determined utilizing a market approach based on quoted market prices in active markets at period end. These investments are included within Prepaid and other assets in the Consolidated Balance Sheets.
The fair value for derivatives is determined utilizing a market-based approach. We use derivative financial instruments to modify our exposure to market risks from changes in foreign exchange rates and interest rates. We conduct business in various countries outside the United States, resulting in exposure to movements in foreign exchange rates when translating from the foreign local currency to the U.S. Dollar. We use foreign currency forward contracts to economically hedge anticipated cash flows and foreign currency balances in such currencies as the British Pound, the Indian Rupee, the Euro, the Brazilian Real, the Japanese Yen, the Australian Dollar, the Singapore Dollar and the Canadian Dollar. We also enter into forward contracts to hedge future production costs or programming obligations. The change in fair value of non-designated foreign exchange contracts is included in current period earnings as part of Other items, net in the Consolidated Statements of Earnings. We manage the use of foreign exchange derivatives centrally.
At September 30, 2014 and 2013, the notional value of all foreign exchange contracts was $628 million and $196 million, respectively. In 2014, $390 million related to our foreign currency balances, $154 million related to anticipated investing cash flows and $84 million related to future production costs. In 2013, $178 million related to our foreign currency balances and $18 million related to future production costs and programming obligations.
Assets Measured and Recorded at Fair Value on a Non-Recurring Basis
Certain assets, such as intangible assets and investments, are recorded at fair value only if an impairment charge is recognized.
In 2014, we recognized an impairment charge of $43 million related to an international trade name at Media Networks. See Note 14 for additional information regarding the impairment. The fair value of the trade name (Level 3) was $28 million calculated utilizing the relief-from-royalty method. Under this method, fair value is calculated as the discounted cash flows based on applying a royalty rate to the revenues derived from the trade name. The royalty rate was derived from market data.
In 2013, we recognized an impairment loss to write-down a cost method investment to its fair value. The impairment charge is included in Other items, net, in the Consolidated Statement of Earnings. The fair value of the investment (Level 3) was based on a discounted cash flow analysis.
NOTE 21. REPORTING SEGMENTS
The following tables set forth our financial performance by reporting segment. Our reporting segments have been determined in accordance with our internal management structure. We manage our operations through two reporting segments: (i) Media Networks and (ii) Filmed Entertainment. Typical intersegment transactions include the purchase of advertising by the Filmed Entertainment segment on Media Networks’ properties and the purchase of Filmed Entertainment’s feature films exhibition rights by Media Networks. The elimination of such intercompany transactions in the Consolidated Financial Statements is included within eliminations in the tables below.
81
Our measure of segment performance is adjusted operating income. Adjusted operating income is defined as operating income, before equity-based compensation and certain other items identified as affecting comparability, including restructuring, asset impairment and other charges, when applicable.
Revenues by Segment (in millions) | Year Ended September 30, | ||||||||||
2014 | 2013 | 2012 | |||||||||
Media Networks | $ | 10,171 | $ | 9,656 | $ | 9,194 | |||||
Filmed Entertainment | 3,725 | 4,282 | 4,820 | ||||||||
Eliminations | (113 | ) | (144 | ) | (127 | ) | |||||
Total revenues | $ | 13,783 | $ | 13,794 | $ | 13,887 | |||||
Adjusted Operating Income (in millions) | Year Ended September 30, | ||||||||||
2014 | 2013 | 2012 | |||||||||
Media Networks | $ | 4,271 | $ | 4,096 | $ | 3,889 | |||||
Filmed Entertainment | 205 | 234 | 325 | ||||||||
Corporate expenses | (227 | ) | (251 | ) | (192 | ) | |||||
Equity-based compensation | (122 | ) | (128 | ) | (122 | ) | |||||
Eliminations | (2 | ) | (9 | ) | 1 | ||||||
Asset impairment | (43 | ) | (7 | ) | — | ||||||
Restructuring and other charges | — | (99 | ) | — | |||||||
Operating income | 4,082 | 3,836 | 3,901 | ||||||||
Interest expense, net | (615 | ) | (464 | ) | (417 | ) | |||||
Equity in net earnings of investee companies | 69 | 41 | 12 | ||||||||
Loss on extinguishment of debt | (11 | ) | — | (21 | ) | ||||||
Other items, net | (11 | ) | 106 | (5 | ) | ||||||
Earnings from continuing operations before provision for income taxes | $ | 3,514 | $ | 3,519 | $ | 3,470 | |||||
Depreciation and Amortization | Total Assets | ||||||||||||||||||
Depreciation and Amortization and Total Assets (in millions) | Year Ended September 30, | September 30, | |||||||||||||||||
2014 | 2013 | 2012 | 2014 | 2013 | |||||||||||||||
Media Networks | $ | 148 | $ | 144 | $ | 144 | $ | 17,647 | $ | 16,653 | |||||||||
Filmed Entertainment | 64 | 89 | 87 | 5,440 | 5,647 | ||||||||||||||
Corporate/Eliminations | 5 | 4 | 5 | 30 | 1,529 | ||||||||||||||
Total | $ | 217 | $ | 237 | $ | 236 | $ | 23,117 | $ | 23,829 | |||||||||
Capital Expenditures (in millions) | Year Ended September 30, | ||||||||||
2014 | 2013 | 2012 | |||||||||
Media Networks | $ | 85 | $ | 103 | $ | 101 | |||||
Filmed Entertainment | 34 | 53 | 46 | ||||||||
Corporate | 4 | 4 | 7 | ||||||||
Total capital expenditures | $ | 123 | $ | 160 | $ | 154 | |||||
Revenues by Component (in millions) | Year Ended September 30, | ||||||||||
2014 | 2013 | 2012 | |||||||||
Advertising | $ | 4,953 | $ | 4,855 | $ | 4,756 | |||||
Feature film | 3,173 | 3,742 | 4,366 | ||||||||
Affiliate fees | 4,660 | 4,245 | 3,889 | ||||||||
Ancillary | 1,110 | 1,096 | 1,003 | ||||||||
Eliminations | (113 | ) | (144 | ) | (127 | ) | |||||
Total revenues | $ | 13,783 | $ | 13,794 | $ | 13,887 | |||||
82
Revenues generated from international markets were 26%, 26% and 29% of total consolidated revenues in 2014, 2013 and 2012, respectively. Our principal international businesses are in Europe. The United Kingdom and Germany together accounted for approximately 45% of total revenues in the Europe, Middle East and Africa (“EMEA”) region in each of the three years ended September 30, 2014.
Revenues* | Long-lived Assets** | ||||||||||||||||||
Geographic Information (in millions) | Year Ended September 30, | September 30, | |||||||||||||||||
2014 | 2013 | 2012 | 2014 | 2013 | |||||||||||||||
United States | $ | 10,252 | $ | 10,152 | $ | 9,804 | $ | 5,018 | $ | 4,982 | |||||||||
EMEA | 2,046 | 2,173 | 2,423 | 406 | 418 | ||||||||||||||
All other | 1,485 | 1,469 | 1,660 | 110 | 75 | ||||||||||||||
Total | $ | 13,783 | $ | 13,794 | $ | 13,887 | $ | 5,534 | $ | 5,475 | |||||||||
*Revenue classifications are based on customers’ locations. Transactions within Viacom between geographic areas are not significant.
**Reflects total assets less current assets, deferred tax assets, goodwill, intangibles and investments.
NOTE 22. RELATED PARTY TRANSACTIONS
NAI, directly and through a wholly-owned subsidiary, is the controlling stockholder of both Viacom and CBS. Sumner M. Redstone, the controlling stockholder, Chairman and Chief Executive Officer of NAI, serves as our Executive Chairman and Founder and as the Executive Chairman and Founder of CBS. Shari Redstone, who is Sumner Redstone’s daughter, is the President and a director of NAI, and serves as non-executive Vice Chair of the Board of Directors of both Viacom and CBS. George Abrams, one of our directors, serves on the boards of both NAI and Viacom, and Frederic Salerno, another of our directors, serves on the boards of both Viacom and CBS. Philippe Dauman, our President and Chief Executive Officer, also serves on the boards of both NAI and Viacom. Transactions between Viacom and related parties are overseen by our Governance and Nominating Committee.
Viacom and NAI Related Party Transactions
NAI licenses films in the ordinary course of business for its motion picture theaters from all major studios, including Paramount. During the years ended September 30, 2014, 2013 and 2012, Paramount earned revenues from NAI in connection with these licenses in the aggregate amounts of approximately $15 million, $19 million and $19 million, respectively.
Viacom and CBS Corporation Related Party Transactions
In the ordinary course of business, we are involved in transactions with CBS and its various businesses that result in the recognition of revenues and expenses by us. Transactions with CBS are settled in cash.
Our Filmed Entertainment segment earns revenues and recognizes expenses associated with its distribution of certain television products into the home entertainment market on behalf of CBS. Pursuant to its agreement with CBS, Paramount distributes CBS’s library of television and other content on DVD and Blu-ray disc on a worldwide basis. Under the terms of the agreement, Paramount is entitled to retain a fee based on a percentage of gross receipts and is generally responsible for all out-of-pocket costs, which are recoupable prior to any participation amounts paid. Paramount also earns revenues from CBS through leasing of studio space and licensing of certain film products.
Our Media Networks segment recognizes advertising revenues and purchases television programming from CBS. The cost of the programming purchases is initially recorded as acquired program rights inventory and amortized over the estimated period that revenues will be generated.
Both of our segments recognize advertising expenses related to the placement of advertisements with CBS.
83
The following table summarizes the transactions with CBS as included in our Consolidated Financial Statements:
CBS Related Party Transactions (in millions) | Year Ended September 30, | ||||||||||
2014 | 2013 | 2012 | |||||||||
Consolidated Statements of Earnings | |||||||||||
Revenues | $ | 213 | $ | 264 | $ | 285 | |||||
Operating expenses | $ | 296 | $ | 327 | $ | 347 | |||||
September 30, | |||||||||||
2014 | 2013 | ||||||||||
Consolidated Balance Sheets | |||||||||||
Accounts receivable | $ | 5 | $ | 5 | |||||||
Accounts payable | $ | 2 | $ | 3 | |||||||
Participants' share and residuals, current | 100 | 115 | |||||||||
Program obligations, current | 87 | 99 | |||||||||
Program obligations, noncurrent | 104 | 139 | |||||||||
Other liabilities | 9 | 15 | |||||||||
Total due to CBS | $ | 302 | $ | 371 | |||||||
Other Related Party Transactions
In the ordinary course of business, we are involved in related party transactions with equity investees. These related party transactions primarily relate to the provision of advertising services, licensing of film and programming content, distribution of films and provision of certain administrative support services, for which the impact on our Consolidated Financial Statements is as follows:
Other Related Party Transactions (in millions) | Year Ended September 30, | ||||||||||
2014 | 2013 | 2012 | |||||||||
Consolidated Statements of Earnings | |||||||||||
Revenues | $ | 196 | $ | 216 | $ | 309 | |||||
Operating expenses | $ | 71 | $ | 63 | $ | 120 | |||||
Selling, general and administrative | $ | (14 | ) | $ | (17 | ) | $ | (16 | ) | ||
September 30, | |||||||||||
2014 | 2013 | ||||||||||
Consolidated Balance Sheets | |||||||||||
Accounts receivable | $ | 84 | $ | 84 | |||||||
Other assets | 1 | 1 | |||||||||
Total due from other related parties | $ | 85 | $ | 85 | |||||||
Accounts payable | $ | 2 | $ | 4 | |||||||
Other liabilities | 37 | 26 | |||||||||
Total due to other related parties | $ | 39 | $ | 30 | |||||||
All other related party transactions are not material in the periods presented.
84
NOTE 23. QUARTERLY FINANCIAL DATA (unaudited):
2014 (in millions, except per share information) | First | Second | Third | Fourth | Year Ended September 30, 2014 | ||||||||||||||
Revenues | $ | 3,197 | $ | 3,174 | $ | 3,421 | $ | 3,991 | $ | 13,783 | |||||||||
Operating income | $ | 960 | $ | 872 | $ | 1,086 | $ | 1,164 | $ | 4,082 | |||||||||
Net earnings from continuing operations (Viacom and noncontrolling interests) | $ | 557 | $ | 511 | $ | 654 | $ | 742 | $ | 2,464 | |||||||||
Net earnings (Viacom and noncontrolling interests) | $ | 557 | $ | 511 | $ | 653 | $ | 742 | $ | 2,463 | |||||||||
Net earnings from continuing operations attributable to Viacom | $ | 547 | $ | 502 | $ | 611 | $ | 732 | $ | 2,392 | |||||||||
Net earnings attributable to Viacom | $ | 547 | $ | 502 | $ | 610 | $ | 732 | $ | 2,391 | |||||||||
Basic net earnings per share, continuing operations attributable to Viacom | $ | 1.23 | $ | 1.15 | $ | 1.43 | $ | 1.74 | $ | 5.54 | |||||||||
Basic net earnings per share attributable to Viacom | $ | 1.23 | $ | 1.15 | $ | 1.43 | $ | 1.74 | $ | 5.53 | |||||||||
Diluted net earnings per share, continuing operations attributable to Viacom | $ | 1.20 | $ | 1.13 | $ | 1.40 | $ | 1.72 | $ | 5.43 | |||||||||
Diluted net earnings per share attributable to Viacom | $ | 1.20 | $ | 1.13 | $ | 1.40 | $ | 1.72 | $ | 5.43 | |||||||||
2013 (in millions, except per share information) | First | Second | Third | Fourth | Year Ended September 30, 2013 | ||||||||||||||
Revenues | $ | 3,314 | $ | 3,135 | $ | 3,693 | $ | 3,652 | $ | 13,794 | |||||||||
Operating income | $ | 797 | $ | 847 | $ | 1,085 | $ | 1,107 | $ | 3,836 | |||||||||
Net earnings from continuing operations (Viacom and noncontrolling interests) | $ | 482 | $ | 489 | $ | 666 | $ | 812 | $ | 2,449 | |||||||||
Net earnings (Viacom and noncontrolling interests) | $ | 479 | $ | 486 | $ | 662 | $ | 810 | $ | 2,437 | |||||||||
Net earnings from continuing operations attributable to Viacom | $ | 473 | $ | 481 | $ | 647 | $ | 806 | $ | 2,407 | |||||||||
Net earnings attributable to Viacom | $ | 470 | $ | 478 | $ | 643 | $ | 804 | $ | 2,395 | |||||||||
Basic net earnings per share, continuing operations attributable to Viacom | $ | 0.94 | $ | 0.98 | $ | 1.34 | $ | 1.72 | $ | 4.95 | |||||||||
Basic net earnings per share attributable to Viacom | $ | 0.94 | $ | 0.97 | $ | 1.33 | $ | 1.72 | $ | 4.93 | |||||||||
Diluted net earnings per share, continuing operations attributable to Viacom | $ | 0.93 | $ | 0.96 | $ | 1.32 | $ | 1.69 | $ | 4.86 | |||||||||
Diluted net earnings per share attributable to Viacom | $ | 0.92 | $ | 0.96 | $ | 1.31 | $ | 1.68 | $ | 4.84 | |||||||||
Item 9. Changes in and Disagreements with Accountants on Accounting and Financial Disclosure.
None.
Item 9A. Controls and Procedures.
Evaluation of Disclosure Controls and Procedures
We maintain “disclosure controls and procedures,” as such term is defined in Rules 13a-15(e) and 15d-15(e) under the Securities Exchange Act of 1934 (the “Exchange Act”), that are designed to ensure that information required to be disclosed by us in reports that we file or submit under the Exchange Act is recorded, processed, summarized, and reported within the time periods specified in SEC rules and forms, and that such information is accumulated and communicated to our management, including our Chief Executive Officer and Chief Financial Officer, as appropriate, to allow timely decisions regarding required disclosure. In designing and evaluating our disclosure controls and procedures, management recognized that disclosure controls and procedures, no matter how well conceived and operated, can provide only reasonable, not absolute, assurance that the objectives of the disclosure controls and procedures are met. Additionally, in designing disclosure controls and procedures, our management necessarily was required to apply its judgment in evaluating the cost-benefit relationship of possible disclosure controls and procedures. The design of any disclosure controls and procedures also is based in part upon certain assumptions about the likelihood of future events, and there can be no assurance that any design will succeed in achieving its stated goals under all potential future conditions.
85
Our management, with the participation of our Chief Executive Officer and Chief Financial Officer, has evaluated the effectiveness of the design and operation of our disclosure controls and procedures as of September 30, 2014. Based on that evaluation, management has concluded that, as of such date, our disclosure controls and procedures were effective.
Management’s Report on Internal Control over Financial Reporting
Management’s Report on Internal Control over Financial Reporting is set forth on page 51.
Audit Opinion on Internal Control over Financial Reporting
The effectiveness of the Company’s internal control over financial reporting has been audited by PricewaterhouseCoopers, LLP an independent registered public accounting firm, as stated in their report, which is included herein on page 52.
Changes in Internal Control Over Financial Reporting
We have substantially completed the migration of certain financial processing systems to an enterprise-wide general ledger system during 2014. The new system is a material component of our internal control over financial reporting. In connection with this implementation we updated our internal controls over financial reporting, as necessary, through further automation and standardization of our financial transaction processes and procedures. Except as noted above, there has been no change in the Company's internal control over financial reporting that has materially affected, or is reasonably likely to materially affect, the Company's internal controls over financial reporting.
Item 9B. Other Information.
None.
PART III
Item 10. Directors, Executive Officers and Corporate Governance.
The information required by this item with respect to our directors and certain corporate governance practices will be contained in our Proxy Statement for our 2015 Annual Meeting of Stockholders (the “Proxy Statement”) under the headings “Corporate Governance,” “Our Board of Directors,” “Item 1 – Election of Directors” and “Section 16(a) Beneficial Ownership Reporting Compliance,” which information is incorporated herein by reference. The information required by this item with respect to our executive officers (i) will be contained in the Proxy Statement under the headings “Corporate Governance” and “Section 16(a) Beneficial Ownership Reporting Compliance” and (ii) is included in Part I of this Form 10-K under the caption “Our Executive Officers,” which information is incorporated herein by reference.
Item 11. Executive Compensation.
The information required by this item will be contained in the Proxy Statement under the headings “Executive Compensation,” “Compensation Committee Interlocks and Insider Participation” and “Compensation Committee Report,” which information is incorporated herein by reference.
Item 12. Security Ownership of Certain Beneficial Owners and Management and Related Stockholder Matters.
The information required by this item will be contained in the Proxy Statement under the headings “Equity Compensation Plan Information” and “Security Ownership of Certain Beneficial Owners and Management,” which information is incorporated herein by reference.
Item 13. Certain Relationships and Related Transactions, and Director Independence.
The information required by this item will be contained in the Proxy Statement under the headings “Related Person Transactions” and “Our Board of Directors,” which information is incorporated herein by reference.
Item 14. Principal Accounting Fees and Services.
The information required by this item will be contained in the Proxy Statement under the heading “Services Provided by the Independent Auditor and Fees Paid,” which information is incorporated herein by reference.
86
PART IV
Item 15. Exhibits, Financial Statement Schedules.
(a) 1. | Financial Statements. |
Management’s Report on Internal Control over Financial Reporting
Report of Independent Registered Public Accounting Firm
Consolidated Statement of Earnings for the years ended September 30, 2014, 2013 and 2012
Consolidated Statement of Comprehensive Income for the years ended September 30, 2014, 2013 and 2012
Consolidated Balance Sheets as of September 30, 2014 and 2013
Consolidated Statement of Cash Flows for the years ended September 30, 2014, 2013 and 2012
Consolidated Statement of Stockholders’ Equity for the years ended September 30, 2014, 2013 and 2012
Notes to Consolidated Financial Statements
2. | Financial Statement Schedules. |
Schedule II. Valuation and Qualifying Accounts
All other Schedules are omitted since the required information is not present or is not present in amounts sufficient to require submission of the schedule.
3. | Exhibits. |
The exhibits listed in Item 15(b) of this Part IV are filed or incorporated by reference as part of this Form 10-K. The Index to Exhibits is on page 91.
(b) | Exhibits. |
The exhibits listed in Item 15(b) of this Part IV are filed or incorporated by reference as part of this Form 10-K. The Index to Exhibits is on page 91.
87
SIGNATURES
Pursuant to the requirements of Section 13 or 15(d) of the Securities Exchange Act of 1934, the registrant has duly caused this report to be signed on its behalf by the undersigned, thereunto duly authorized.
VIACOM INC. | ||
By: | /s/ Philippe P. Dauman | |
Philippe P. Dauman | ||
President and Chief Executive Officer | ||
Date: November 13, 2014
Pursuant to the requirements of the Securities Exchange Act of 1934, this report has been signed by the following persons on behalf of Viacom Inc. and in the capacities and on the dates indicated:
Signature | Title | Date | ||
/s/ Philippe P. Dauman | President and Chief Executive Officer; | November 13, 2014 | ||
Philippe P. Dauman | Director | |||
/s/ Thomas E. Dooley | Senior Executive Vice President and Chief | November 13, 2014 | ||
Thomas E. Dooley | Operating Officer; Director | |||
/s/ Wade Davis | Executive Vice President, | November 13, 2014 | ||
Wade Davis | Chief Financial Officer | |||
/s/ Katherine Gill-Charest | Senior Vice President, Controller | November 13, 2014 | ||
Katherine Gill-Charest | (Chief Accounting Officer) | |||
* | Executive Chairman of the Board | November 13, 2014 | ||
Sumner M. Redstone | and Founder | |||
* | Vice Chair of the Board | November 13, 2014 | ||
Shari Redstone | ||||
* | Director | November 13, 2014 | ||
George S. Abrams | ||||
* | Director | November 13, 2014 | ||
Cristiana Falcone Sorrell | ||||
88
Signature | Title | Date | ||
* | Director | November 13, 2014 | ||
Robert K. Kraft | ||||
* | Director | November 13, 2014 | ||
Blythe J. McGarvie | ||||
* | Director | November 13, 2014 | ||
Deborah Norville | ||||
* | Director | November 13, 2014 | ||
Charles E. Phillips, Jr. | ||||
* | Director | November 13, 2014 | ||
Frederic V. Salerno | ||||
* | Director | November 13, 2014 | ||
William Schwartz | ||||
*By: | /s/ Michael D. Fricklas | November 13, 2014 | ||||
Michael D. Fricklas Attorney-in-Fact for the Directors | ||||||
89
Item 15(a).
VIACOM INC.
SCHEDULE II—VALUATION AND QUALIFYING ACCOUNTS
(in millions) | Beginning of period | Additions - expense and other | Deductions | End of period | |||||||||||
Year Ended September 30, 2014: | |||||||||||||||
Allowance for doubtful accounts | $ | 33 | $ | 2 | $ | (5 | ) | $ | 30 | ||||||
Sales returns and allowances | $ | 261 | $ | 468 | $ | (530 | ) | $ | 199 | ||||||
Deferred tax valuation allowance | $ | 277 | $ | 54 | $ | (23 | ) | $ | 308 | ||||||
Year Ended September 30, 2013: | |||||||||||||||
Allowance for doubtful accounts | $ | 36 | $ | 8 | $ | (11 | ) | $ | 33 | ||||||
Sales returns and allowances | $ | 282 | $ | 503 | $ | (524 | ) | $ | 261 | ||||||
Deferred tax valuation allowance | $ | 324 | $ | 75 | $ | (122 | ) | $ | 277 | ||||||
Year Ended September 30, 2012: | |||||||||||||||
Allowance for doubtful accounts | $ | 49 | $ | 6 | $ | (19 | ) | $ | 36 | ||||||
Sales returns and allowances | $ | 309 | $ | 595 | $ | (622 | ) | $ | 282 | ||||||
Deferred tax valuation allowance | $ | 222 | $ | 161 | $ | (59 | ) | $ | 324 | ||||||
90
Item 15(b).
INDEX TO EXHIBITS
Exhibit No. | Description of Exhibit | |
3.1 | Amended and Restated Certificate of Incorporation of Viacom Inc. effective December 31, 2005 (incorporated by reference to Exhibit 3.1 to the Annual Report on Form 10-K of Viacom Inc. filed March 16, 2006) (File No. 001-32686). | |
3.2 | Amended and Restated Bylaws of Viacom Inc. effective September 15, 2011 (incorporated by reference to Exhibit 3.2 to the Current Report on Form 8-K of Viacom Inc. filed September 21, 2011) (File No. 001-32686). | |
4.1 | Indenture, dated as of April 12, 2006, between Viacom Inc. and The Bank of New York (incorporated by reference to Exhibit 4.1 to the Current Report on Form 8-K of Viacom Inc. filed April 17, 2006) (File No. 001-32686). | |
4.2 | First Supplemental Indenture, dated as of April 12, 2006, between Viacom Inc. and The Bank of New York, including Form of 5.75% Senior Note due 2011, Form of 6.25% Senior Note due 2016 and Form of 6.875% Senior Debenture due 2036 (incorporated by reference to Exhibit 4.2 to the Current Report on Form 8-K of Viacom Inc. filed April 17, 2006) (File No. 001-32686). | |
4.3 | Second Supplemental Indenture, dated as of June 16, 2006, between Viacom Inc. and The Bank of New York, including Form of Floating Rate Senior Note due 2009 (incorporated by reference to Exhibit 4.4 to the Registration Statement on Form S-4 of Viacom Inc. filed August 21, 2006) (File No. 333-136756). | |
4.4 | Third Supplemental Indenture, dated as of December 13, 2006, between Viacom Inc. and The Bank of New York, as trustee (including forms of Senior Notes) (incorporated by reference to Exhibit 4.1 to the Current Report on Form 8-K of Viacom Inc. filed December 19, 2006) (File No. 001-32686). | |
4.5 | Fourth Supplemental Indenture, dated as of October 5, 2007, between Viacom Inc. and The Bank of New York, as trustee (including forms of Senior Notes and Senior Debentures) (incorporated by reference to Exhibit 4.1 to the Current Report on Form 8-K of Viacom Inc. filed October 9, 2007) (File No. 001-32686). | |
4.6 | Fifth Supplemental Indenture, dated as of August 26, 2009, between Viacom Inc. and The Bank of New York Mellon, as trustee (including forms of Senior Notes) (incorporated by reference to Exhibit 4.1 to the Current Report on Form 8-K of Viacom Inc. filed August 26, 2009) (File No. 001-32686). | |
4.7 | Sixth Supplemental Indenture, dated as of September 29, 2009, between Viacom Inc. and The Bank of New York Mellon, as trustee (including forms of Senior Notes) (incorporated by reference to Exhibit 4.1 to the Current Report on Form 8-K of Viacom Inc. filed September 30, 2009) (File No. 001-32686). | |
4.8 | Seventh Supplemental Indenture, dated as of February 22, 2011, between Viacom Inc. and The Bank of New York Mellon, as trustee (including form of Senior Notes) (incorporated by reference to Exhibit 4.1 to the Current Report on Form 8-K of Viacom Inc. filed February 23, 2011) (File No. 001-32686). | |
4.9 | Eighth Supplemental Indenture, dated as of March 31, 2011, between Viacom Inc. and The Bank of New York Mellon, as trustee (including form of Senior Notes) (incorporated by reference to Exhibit 4.1 to the Current Report on Form 8-K of Viacom Inc. filed March 31, 2011) (File No. 001-32686). | |
91
Exhibit No. | Description of Exhibit | |
4.10 | Ninth Supplemental Indenture, dated as of December 12, 2011, between Viacom Inc. and The Bank of New York Mellon, as trustee (including form of Senior Notes) (incorporated by reference to Exhibit 4.1 to the Current Report on Form 8-K of Viacom Inc. filed December 12, 2011) (File No. 001-32686). | |
4.11 | Tenth Supplemental Indenture, dated as of February 28, 2012, between Viacom Inc. and The Bank of New York Mellon, as trustee (including form of Senior Notes) (incorporated by reference to Exhibit 4.1 to the Current Report on Form 8-K of Viacom Inc. filed February 28, 2012) (File No. 001-32686). | |
4.12 | Eleventh Supplemental Indenture, dated as of June 14, 2012, between Viacom Inc. and The Bank of New York Mellon, as trustee (including form of Senior Notes) (incorporated by reference to Exhibit 4.1 to the Current Report on Form 8-K of Viacom Inc. filed June 14, 2012) (File No. 001-32686). | |
4.13 | Twelfth Supplemental Indenture, dated as of November 26, 2012, between Viacom Inc. and The Bank of New York Mellon, as Trustee (including forms of Senior Debentures) (incorporated by reference to Exhibit 4.1 to the Current Report on Form 8-K of Viacom Inc. filed November 30, 2012) (File No. 001-32686). | |
4.14 | Thirteenth Supplemental Indenture, dated as of December 4, 2012, between Viacom Inc. and The Bank of New York Mellon, as Trustee (including forms of Senior Debentures) (incorporated by reference to Exhibit 4.1 to the Current Report on Form 8-K of Viacom Inc. filed December 21, 2012) (File No. 001-32686). | |
4.15 | Fourteenth Supplemental Indenture, dated as of December 17, 2012, between Viacom Inc. and The Bank of New York Mellon, as Trustee (including forms of Senior Debentures) (incorporated by reference to Exhibit 4.2 to the Current Report on Form 8-K of Viacom Inc. filed December 21, 2012) (File No. 001-32686). | |
4.16 | Fifteenth Supplemental Indenture, dated as of March 14, 2013, between Viacom Inc. and The Bank of New York Mellon, as Trustee (including forms of the Securities) (incorporated by reference to Exhibit 4.1 to the Current Report on Form 8-K of Viacom Inc. filed March 14, 2013) (File No. 001-32686). | |
4.17 | Sixteenth Supplemental Indenture, dated as of August 19, 2013, between Viacom Inc. and The Bank of New York Mellon, as Trustee (including forms of the Securities) (incorporated by reference to Exhibit 4.1 to the Current Report on Form 8-K of Viacom Inc. filed August 19, 2013) (File No. 001-32686). | |
4.18 | Seventeenth Supplemental Indenture, dated as of March 11, 2014, between Viacom Inc. and The Bank of New York Mellon, as Trustee (including forms of the Securities) (incorporated by reference to Exhibit 4.1 to the Current Report on Form 8-K of Viacom Inc. filed March 11, 2014) (File No. 001-32686). | |
10.1 | $2.0 Billion Three-Year Credit Agreement, dated as of October 8, 2010, among Viacom Inc., the subsidiaries of Viacom Inc. designated as borrowers from time to time thereunder, the Lenders named therein, JPMorgan Chase Bank, N.A., as Administrative Agent, Citibank, N.A. and Bank of America, N.A., as Syndication Agents, and Deutsche Bank Securities Inc., Morgan Stanley MUFG Loan Partners, LLC, The Royal Bank of Scotland PLC and Wells Fargo Bank, N.A., as Documentation Agents (incorporated by reference to Exhibit 10.1 to the Transition Report on Form 10-K of Viacom Inc. filed November 12, 2010) (File No. 001-32686). | |
10.2 | First Amendment, dated as of December 2, 2011, to the $2.0 Billion Three-Year Credit Agreement, dated as of October 8, 2010, among Viacom Inc., the subsidiaries of Viacom Inc. designated as borrowers from time to time thereunder, the Lenders named therein, JPMorgan Chase Bank, N.A., as Administrative Agent, Citibank, N.A. and Bank of America, N.A., as Syndication Agents, and Deutsche Bank Securities Inc., Morgan Stanley MUFG Loan Partners, LLC, The Royal Bank of Scotland PLC and Wells Fargo Bank, N.A., as Documentation Agents (incorporated by reference to Exhibit 10.1 to the Quarterly Report on Form 10-Q of Viacom Inc. filed February 2, 2012) (File No. 001-32686). | |
92
Exhibit No. | Description of Exhibit | |
10.3 | Second Amendment, dated as of November 9, 2012, to the Credit Agreement, dated as of October 8, 2010, as amended on December 2, 2011, among Viacom Inc., the subsidiaries of Viacom Inc. designated as borrowers from time to time thereunder, the Lenders named therein, JPMorgan Chase Bank, N.A., as Administrative Agent, Citibank, N.A. and Bank of America, N.A., as Syndication Agents, and Deutsche Bank Securities Inc., Morgan Stanley MUFG Loan Partners, LLC, The Royal Bank of Scotland PLC and Wells Fargo Bank, N.A., as Documentation Agents (incorporated by reference to Exhibit 10.1 to the Quarterly Report on Form 10-Q of Viacom Inc. filed January 31, 2013) (File No. 001-32686). | |
10.4 | Summary of Viacom Inc. Compensation for Outside Directors (incorporated by reference to Exhibit 10.1 to the Quarterly Report on Form 10-Q of Viacom Inc. filed January 30, 2014) (File No. 001-32686).** | |
10.5 | Amended Compensation Arrangement for Non-Executive Vice Chair (incorporated by reference to Exhibit 10.5 to the Quarterly Report on Form 10-Q of Viacom Inc. filed November 9, 2006) (File No. 001-32686).** | |
10.6 | Viacom Inc. 2006 Stock Option Plan for Outside Directors (incorporated by reference to Exhibit 10.8 to the Annual Report on Form 10-K of Viacom Inc. filed March 16, 2006) (File No. 001-32686).** | |
10.7 | Viacom Inc. 2006 RSU Plan for Outside Directors (incorporated by reference to Exhibit 10.9 to the Annual Report on Form 10-K of Viacom Inc. filed March 16, 2006) (File No. 001-32686).** | |
10.8 | Viacom Inc. 2011 Stock Option Plan for Outside Directors (incorporated by reference to Exhibit B to the Definitive Proxy Statement of Viacom Inc. filed April 16, 2010) (File No. 001-32686), as amended by Amendment No. 1 to Viacom Inc. 2011 Stock Option Plan for Outside Directors (incorporated by reference to Exhibit 10.2 to the Quarterly Report on Form 10-Q of Viacom Inc. filed January 31, 2013) (File No. 001-32686).** | |
10.9 | Viacom Inc. 2011 RSU Plan for Outside Directors, as amended and restated as of November 13, 2013 (incorporated by reference to Exhibit 10.3 to the Quarterly Report on Form 10-Q of Viacom Inc. filed January 30, 2014) (File No. 001-32686).** | |
10.10 | Amendment No. 1, dated January 16, 2014, to the Viacom Inc. 2011 RSU Plan for Outside Directors, as amended and restated as of November 13, 2013 (incorporated by reference to Exhibit 10.4 to the Quarterly Report on Form 10-Q of Viacom Inc. filed January 30, 2014) (File No. 001-32686).** | |
10.11 | Viacom Inc. Deferred Compensation Plan for Outside Directors, as amended and restated as of November 13, 2013 (incorporated by reference to Exhibit 10.2 to the Quarterly Report on Form 10-Q of Viacom Inc. filed January 30, 2014) (File No. 001-32686).** | |
10.12 | Viacom Inc. Senior Executive Short-Term Incentive Plan, as amended and restated effective January 18, 2012 (incorporated by reference to Exhibit A to the Definitive Proxy Statement of Viacom Inc. filed January 27, 2012) (File No. 001-32686).** | |
10.13 | Viacom Inc. 2006 Long-Term Management Incentive Plan, as amended and restated effective January 1, 2011 (incorporated by reference to Exhibit A to the Definitive Proxy Statement of Viacom Inc. filed April 16, 2010) (File No. 001-32686).** | |
10.13.1 | Form of Stock Option/RSU Confirmation Sheet (incorporated by reference to Exhibit 10.1 to the Quarterly Report on Form 10-Q of Viacom Inc. filed August 5, 2011) (File No. 001-32686).** | |
10.13.2 | Form of Terms and Conditions to the Stock Option Certificate (incorporated by reference to Exhibit 10.2 to the Quarterly Report on Form 10-Q of Viacom Inc. filed August 5, 2011) (File No. 001-32686).** | |
93
Exhibit No. | Description of Exhibit | |
10.13.3 | Form of Terms and Conditions to the Restricted Share Units Certificate (incorporated by reference to Exhibit 10.3 to the Quarterly Report on Form 10-Q of Viacom Inc. filed August 5, 2011) (File No. 001-32686).** | |
10.13.4 | Form of Terms and Conditions to the Performance Share Units (incorporated by reference to Exhibit 10.4 to the Quarterly Report on Form 10-Q of Viacom Inc. filed August 5, 2011) (File No. 001-32686).** | |
10.14 | Viacom Excess Pension Plan, as amended and restated January 1, 2009 (incorporated by reference to Exhibit 10.13 to the Annual Report on Form 10-K of Viacom Inc. filed February 12, 2009) (File No. 001-32686).** | |
10.15 | Amendment, effective as of March 31, 2009, to Viacom Excess Pension Plan, as amended and restated January 1, 2009 (incorporated by reference to Exhibit 10.13 to the Transition Report on Form 10-K of Viacom Inc. filed November 12, 2010) (File No. 001-32686).** | |
10.16 | Viacom Excess 401(k) Plan for Designated Senior Executives, as amended and restated January 1, 2009 (incorporated by reference to Exhibit 10.14 to the Annual Report on Form 10-K of Viacom Inc. filed February 12, 2009) (File No. 001-32686).** | |
10.17 | Amendments, effective as of April 1, 2009 and December 31, 2009, to Viacom Excess 401(k) Plan for Designated Senior Executives, as amended and restated January 1, 2009 (incorporated by reference to Exhibit 10.15 to the Transition Report on Form 10-K of Viacom Inc. filed November 12, 2010) (File No. 001-32686).** | |
10.18 | Viacom Bonus Deferral Plan for Designated Senior Executives, as amended and restated January 1, 2009 (incorporated by reference to Exhibit 10.15 to the Annual Report on Form 10-K of Viacom Inc. filed February 12, 2009) (File No. 001-32686).** | |
10.19 | Amendment, effective as of December 31, 2009, to Viacom Bonus Deferral Plan for Designated Senior Executives, as amended and restated January 1, 2009 (incorporated by reference to Exhibit 10.17 to the Transition Report on Form 10-K of Viacom Inc. filed November 12, 2010) (File No. 001-32686).** | |
10.20 | Employment Agreement with Sumner M. Redstone, dated September 25, 2006 (incorporated by reference to Exhibit 10.1 to the Current Report on Form 8-K of Viacom Inc. filed September 26, 2006) (File No. 001-32686).** | |
10.21 | Employment Agreement between Viacom Inc. and Philippe P. Dauman, as amended and restated as of April 14, 2010 (incorporated by reference to Exhibit 10.2 to the Quarterly Report on Form 10-Q of Viacom Inc. filed April 29, 2010) (File No. 001-32686).** | |
10.22 | Employment Agreement between Viacom Inc. and Thomas E. Dooley, as amended and restated as of May 27, 2010 (incorporated by reference to Exhibit 10.1 to the Quarterly Report on Form 10-Q of Viacom Inc. filed August 5, 2010) (File No. 001-32686).** | |
10.23 | Employment Agreement between Viacom Inc. and Michael D. Fricklas, dated as of October 2, 2009 (incorporated by reference to Exhibit 10.17 to the Annual Report on Form 10-K of Viacom Inc. filed February 11, 2010) (File No. 001-32686), as amended by Letter Agreement dated August 6, 2012 (incorporated by reference to Exhibit 10.21 to the Annual Report on Form 10-K of Viacom Inc. filed November 15, 2012) (File No. 001-32686).** | |
10.24 | Employment Agreement between Viacom Inc. and Wade Davis, dated as of November 27, 2012 (incorporated by reference to Exhibit 10.4 to the Quarterly Report on Form 10-Q of Viacom Inc. filed January 31, 2013) (File No. 001-32686).** | |
10.25 | Service Agreement, dated as of March 1, 1994, between George S. Abrams and Former Viacom (incorporated by reference to Exhibit 10(q) to the Annual Report on Form 10-K of Former Viacom filed on March 31, 1995) (File No. 001-09553), assigned to Viacom Inc.** | |
94
Exhibit No. | Description of Exhibit | |
10.26 | Separation Agreement dated as of December 19, 2005 by and between Former Viacom and New Viacom Corp. (incorporated by reference to Exhibit 10.1 to the Current Report on Form 8-K of New Viacom Corp. filed December 21, 2005) (File No. 001-32686). | |
10.27 | Tax Matters Agreement dated as of December 30, 2005 by and between Former Viacom and New Viacom Corp. (incorporated by reference to Exhibit 10.1 to the Current Report on Form 8-K of Viacom Inc. filed January 5, 2006) (File No. 001-32686). | |
21.1* | Subsidiaries of Viacom Inc. | |
23.1* | Consent of PricewaterhouseCoopers LLP, independent registered public accounting firm for Viacom Inc. | |
24.1* | Powers of Attorney. | |
31.1* | Certification of the Chief Executive Officer of Viacom Inc. pursuant to Rule 13a-14(a) or 15d-14(a), as adopted pursuant to Section 302 of the Sarbanes-Oxley Act of 2002. | |
31.2* | Certification of the Chief Financial Officer of Viacom Inc. pursuant to Rule 13a-14(a) or 15d-14(a), as adopted pursuant to Section 302 of the Sarbanes-Oxley Act of 2002. | |
32.1* | Certification of the Chief Executive Officer of Viacom Inc. furnished pursuant to 18 U.S.C. Section 1350, as adopted pursuant to Section 906 of the Sarbanes-Oxley Act of 2002. | |
32.2* | Certification of the Chief Financial Officer of Viacom Inc. furnished pursuant to 18 U.S.C. Section 1350, as adopted pursuant to Section 906 of the Sarbanes-Oxley Act of 2002. | |
101.INS* | XBRL Instance Document. | |
101.SCH* | XBRL Taxonomy Extension Schema. | |
101.CAL* | XBRL Taxonomy Extension Calculation Linkbase. | |
101.DEF* | XBRL Taxonomy Extension Definition Linkbase. | |
101.LAB* | XBRL Taxonomy Extension Label Linkbase. | |
101.PRE* | XBRL Taxonomy Extension Presentation Linkbase. | |
* | Filed herewith. |
** | Represents a management contract or compensatory plan or arrangement required to be filed as an exhibit. |
95