Attached files
| file | filename |
|---|---|
| EX-99.1 - EXHIBIT 99.1 - HOOPER HOLMES INC | a50982986ex99_1.htm |
| 8-K - HOOPER HOLMES, INC. 8-K - HOOPER HOLMES INC | a50982986.htm |
Exhibit 99.2
1 Hooper Holmes, Inc. November 13, 2014 Earnings Presentation Speakers: Henry Dubois, Chief Executive Officer Tom Collins, Chief Financial Officer
2 Safe Harbor Statement 2 The presentation contains forward-looking statements concerning plans, objectives, goals, strategies, future events or performances, which are not statements of historical fact. The forward-looking statements contained in this release reflect our current beliefs and expectations. Actual results or performance may differ materially from what is expressed in the forward-looking statements. You are referred to the documents filed by us with the SEC, specifically reports on Form 10-K and Form 10- Q including risk factors that could cause actual results to differ from forward-looking statements. These reports are available at www.sec.gov. This presentation should be used in conjunction with the earnings call dated November 13, 2014. This presentation contains information from third-party sources, including data from studies conducted by others and market data and industry forecasts obtained from industry publication. Although Hooper Holmes, Inc. believes that such information is reliable, Hooper Holmes, Inc. has not independently verified any of this information and Hooper Holmes, Inc. does not guarantee the accuracy or completeness of this information.
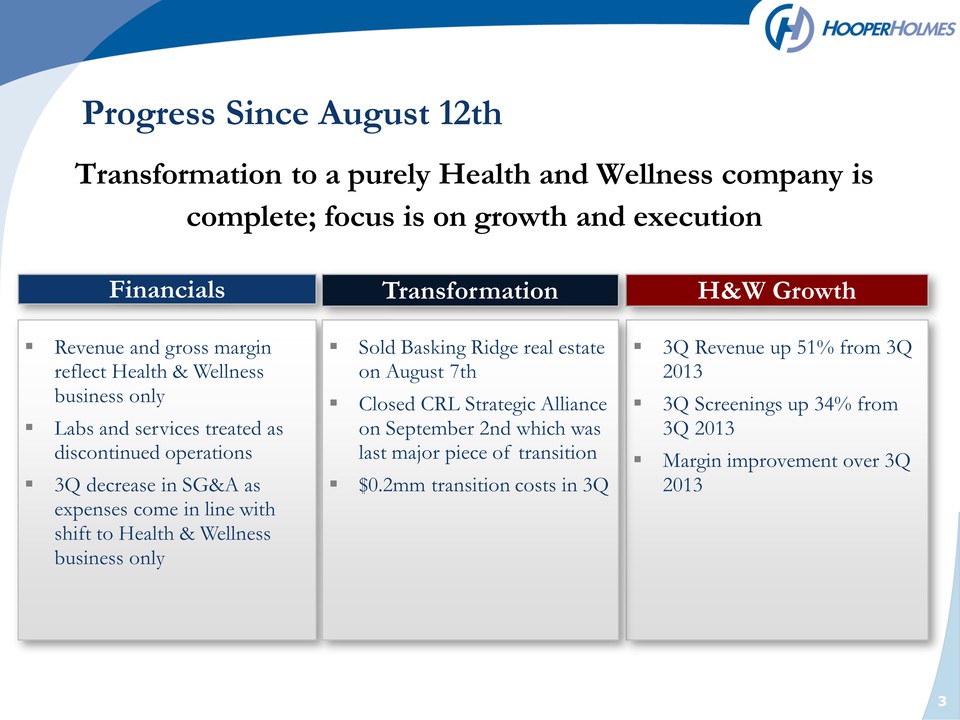
3 Progress Since August 12th Financials Revenue and gross margin reflect Health & Wellness business only Labs and services treated as discontinued operations 3Q decrease in SG&A as expenses come in line with shift to Health & Wellness business only H&W Growth 3Q Revenue up 51% from 3Q 2013 3Q Screenings up 34% from 3Q 2013 Margin improvement over 3Q 2013 3 Sold Basking Ridge real estate on August 7th Closed CRL Strategic Alliance on September 2nd which was last major piece of transition $0.2mm transition costs in 3Q Transformation Transformation to a purely Health and Wellness company is complete; focus is on growth and execution
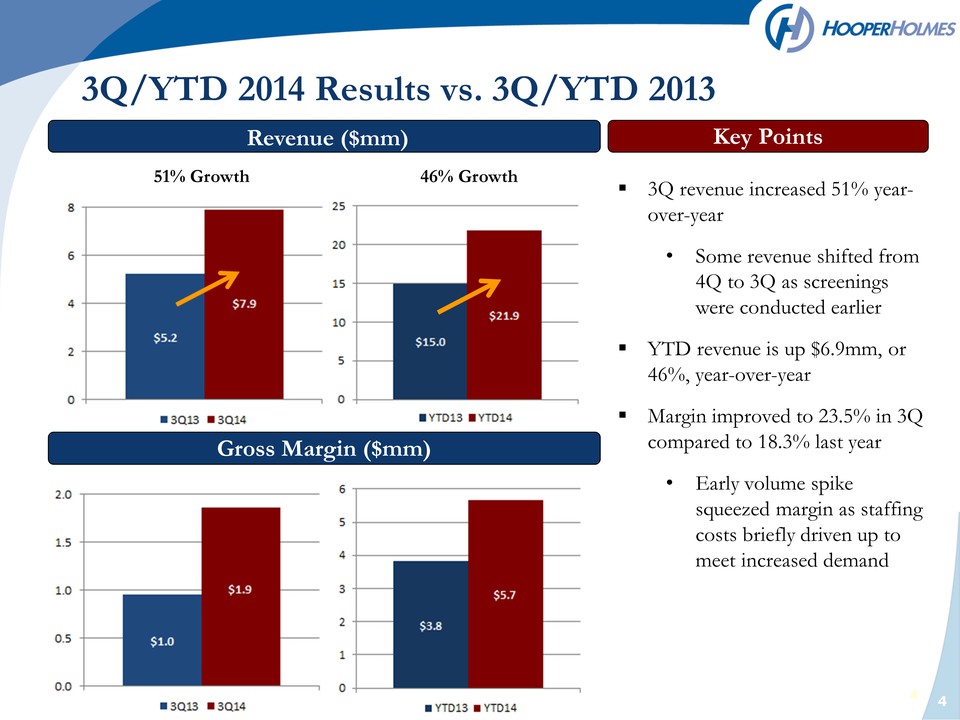
4 Revenue ($mm) Gross Margin ($mm) Key Points 3Q revenue increased 51% yearover-year • Some revenue shifted from 4Q to 3Q as screenings were conducted earlier YTD revenue is up $6.9mm, or 46%, year-over-year Margin improved to 23.5% in 3Q compared to 18.3% last year• Early volume spike squeezed margin as staffing costs briefly driven up to meet increased demand 3Q/YTD 2014 Results vs. 3Q/YTD 2013 51% Growth 46% Growth
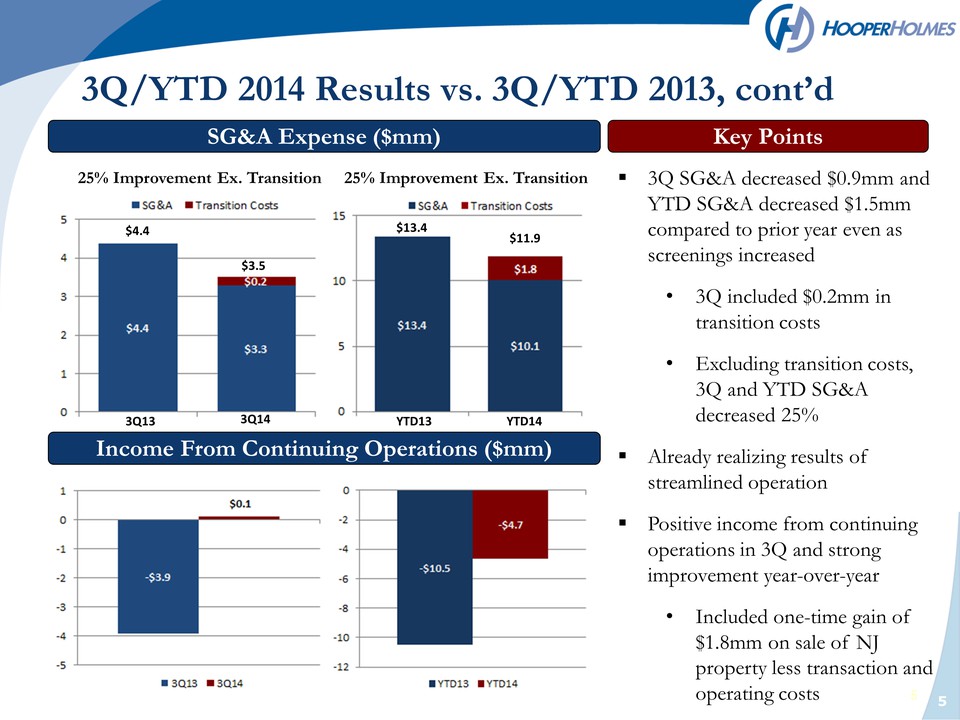
5 SG&A Expense ($mm) Income From Continuing Operations ($mm) Key Points 3Q/YTD 2014 Results vs. 3Q/YTD 2013, cont’d 3Q SG&A decreased $0.9mm and YTD SG&A decreased $1.5mm compared to prior year even as screenings increased • 3Q included $0.2mm in transition costs • Excluding transition costs, 3Q and YTD SG&A decreased 25% Already realizing results of streamlined operation Positive income from continuing operations in 3Q and strong improvement year-over-year• Included one-time gain of $1.8mm on sale of NJ property less transaction and operating costs 25% Improvement Ex. Transition $4.4 $3.5 3Q13 3Q14 YTD13 YTD14 $13.4 $11.9 25% Improvement Ex. Transition
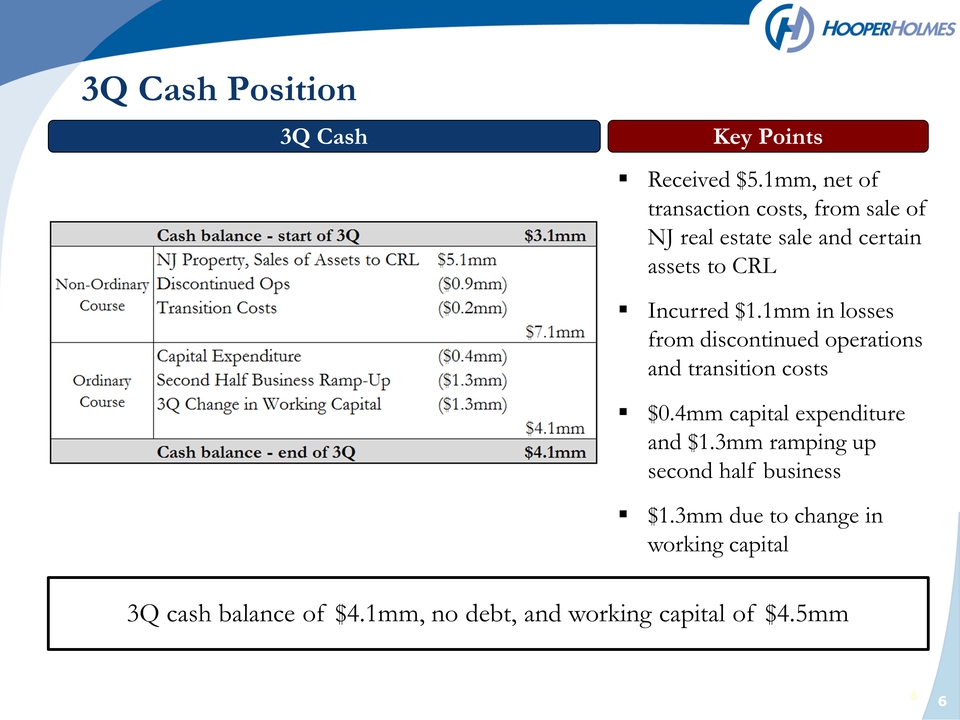
6 Key Points Received $5.1mm, net of transaction costs, from sale of NJ real estate sale and certain assets to CRL Incurred $1.1mm in losses from discontinued operations and transition costs $0.4mm capital expenditure and $1.3mm ramping up second half business $1.3mm due to change in working capital 3Q Cash 3Q Cash Position 3Q cash balance of $4.1mm, no debt, and working capital of $4.5mm
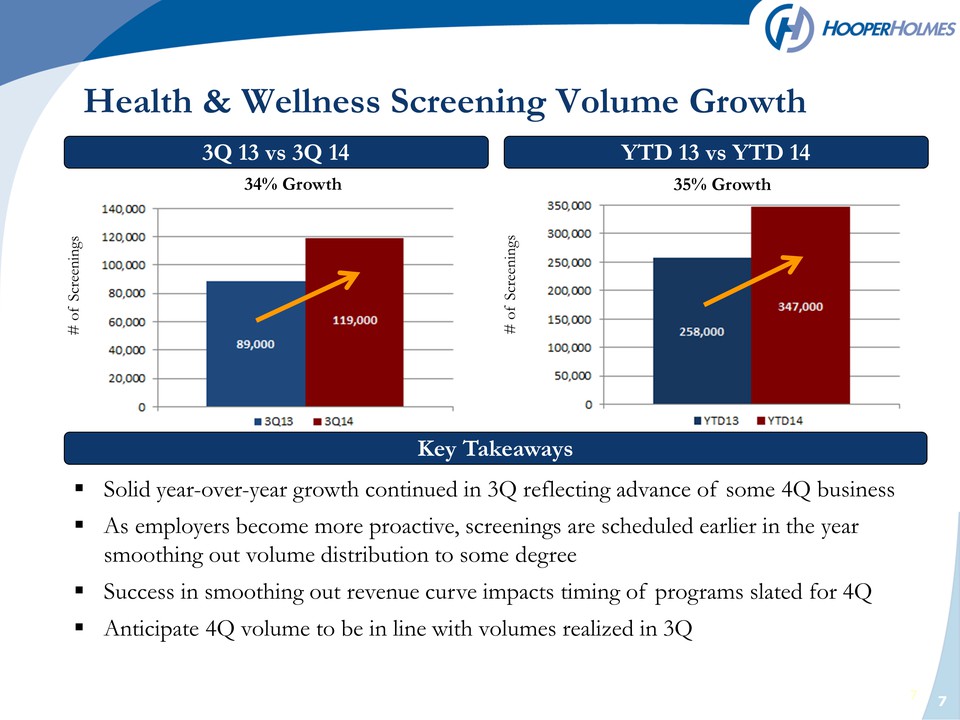
7 3Q 13 vs 3Q 14 YTD 13 vs YTD 14 Solid year-over-year growth continued in 3Q reflecting advance of some 4Q business As employers become more proactive, screenings are scheduled earlier in the year smoothing out volume distribution to some degree Success in smoothing out revenue curve impacts timing of programs slated for 4Q Anticipate 4Q volume to be in line with volumes realized in 3Q Key Takeaways Health & Wellness Screening Volume Growth 35% Growth 34% Growth # of Screenings # of Screenings
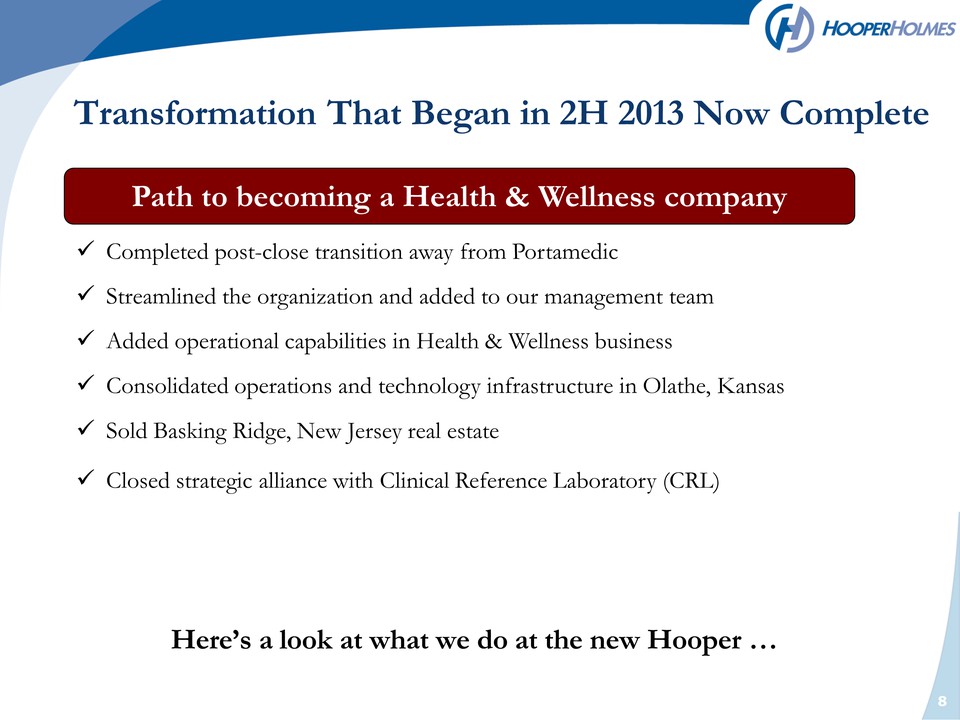
8 Transformation That Began in 2H 2013 Now Complete Path to becoming a Health & Wellness company Completed post-close transition away from Portamedic Streamlined the organization and added to our management team Added operational capabilities in Health & Wellness business Consolidated operations and technology infrastructure in Olathe, Kansas Sold Basking Ridge, New Jersey real estate Closed strategic alliance with Clinical Reference Laboratory (CRL)Here’s a look at what we do at the new Hooper
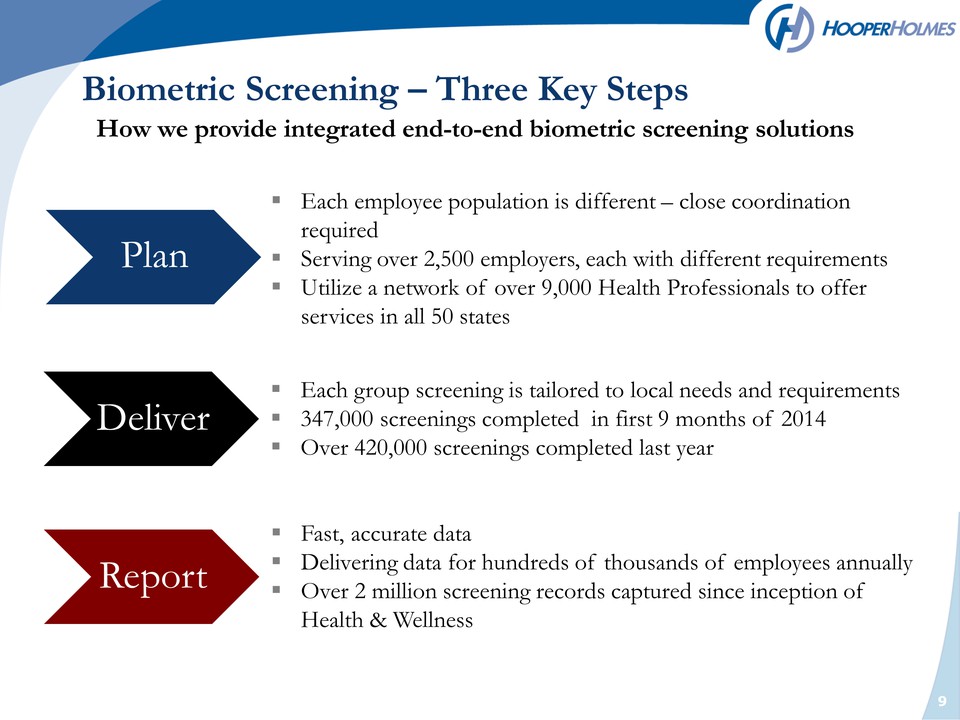
9 Plan Biometric Screening – Three Key Steps Each employee population is different – close coordination required Serving over 2,500 employers, each with different requirements Utilize a network of over 9,000 Health Professionals to offer services in all 50 states Each group screening is tailored to local needs and requirements 347,000 screenings completed in first 9 months of 2014 Over 420,000 screenings completed last year Fast, accurate data Delivering data for hundreds of thousands of employees annually Over 2 million screening records captured since inception of Health & Wellness Deliver ReportHow we provide integrated end-to-end biometric screening solutions
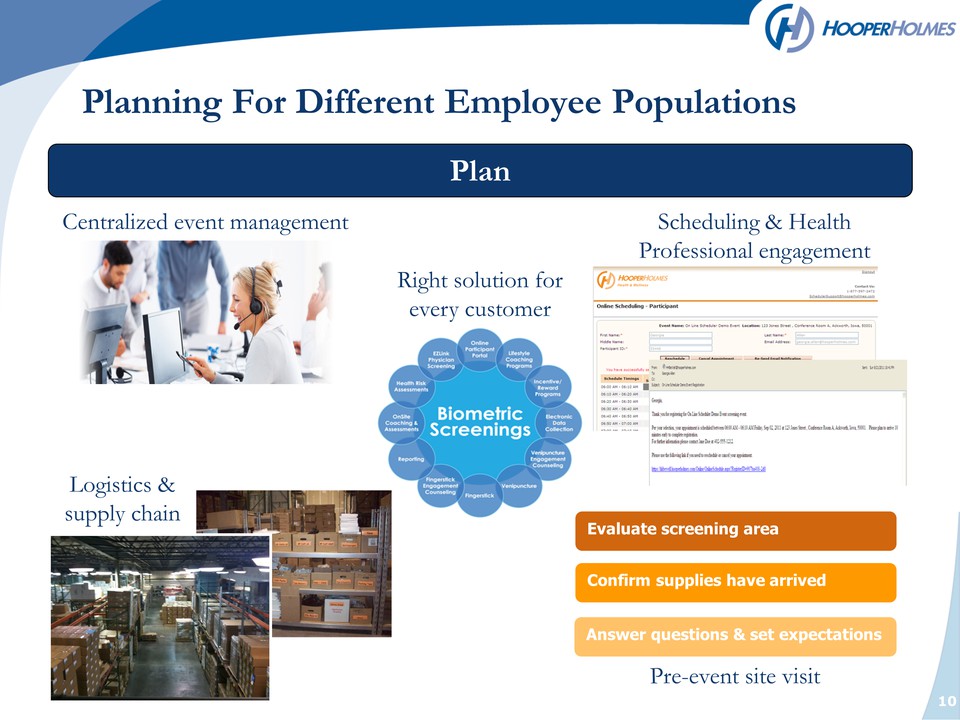
10 Planning For Different Employee Populations Plan Centralized event management Scheduling & Health Professional engagement Logistics & supply chain Pre-event site visit Right solution for every customer Evaluate screening area Confirm supplies have arrived Answer questions & set expectations
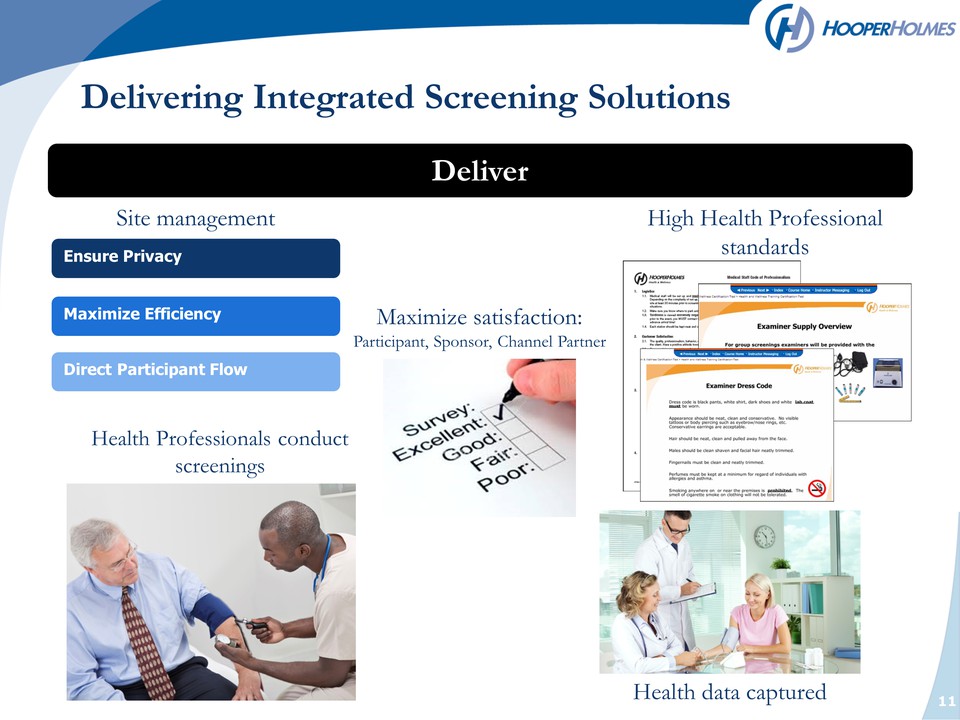
11 Delivering Integrated Screening Solutions Deliver Site management Health Professionals conduct screenings Health data captured Maximize satisfaction: Participant, Sponsor, Channel Partner High Health Professional standards Ensure Privacy Maximize Efficiency Direct Participant Flow
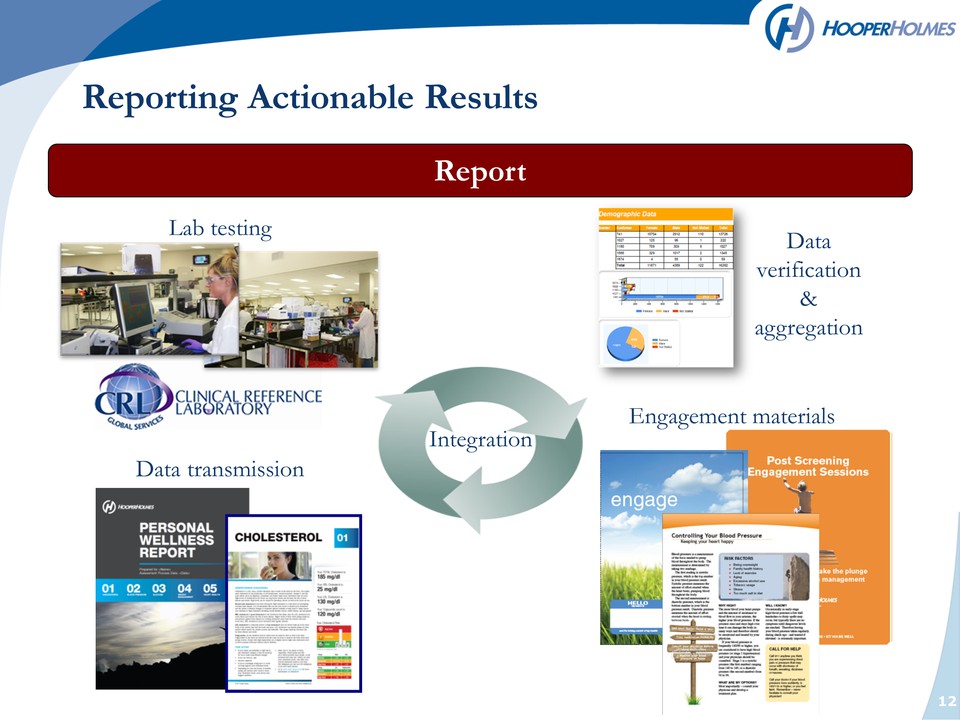
12 Reporting Actionable Results Report Lab testing Data verification & aggregation Data transmission Engagement materials Integration
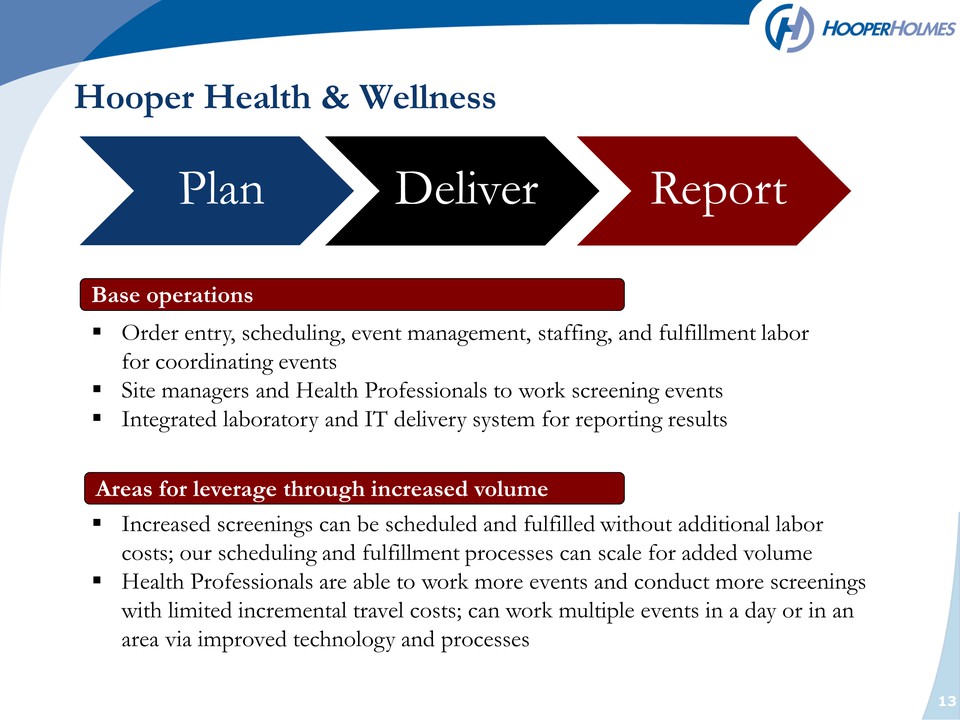
13 Hooper Health & Wellness Plan Deliver Report Base operations Areas for leverage through increased volume Increased screenings can be scheduled and fulfilled without additional labor costs; our scheduling and fulfillment processes can scale for added volume Health Professionals are able to work more events and conduct more screenings with limited incremental travel costs; can work multiple events in a day or in an area via improved technology and processes Order entry, scheduling, event management, staffing, and fulfillment labor for coordinating events Site managers and Health Professionals to work screening events Integrated laboratory and IT delivery system for reporting results.
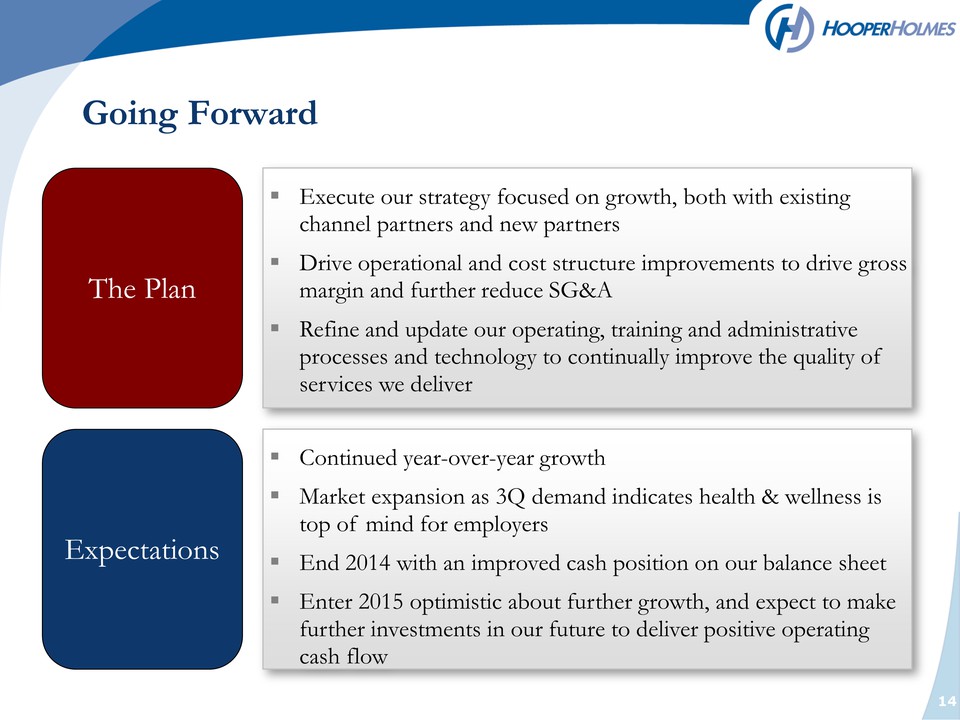
14 Expectations Continued year-over-year growth Market expansion as 3Q demand indicates health & wellness is top of mind for employers End 2014 with an improved cash position on our balance sheet Enter 2015 optimistic about further growth, and expect to make further investments in our future to deliver positive operating cash flow The Plan Execute our strategy focused on growth, both with existing channel partners and new partners Drive operational and cost structure improvements to drive gross margin and further reduce SG&A Refine and update our operating, training and administrative processes and technology to continually improve the quality of services we deliver Going Forward