Attached files
| file | filename |
|---|---|
| 8-K - 8-K - Green Bancorp, Inc. | a14-24400_18k.htm |
Exhibit 99.1
|
|
Sandler O’Neill + Partners East Coast Financial Services Conference November 13, 2014 |

|
|
The following information contains, or may be deemed to contain, “forward-looking statements” (as defined in the U.S. Private Securities Litigation Reform Act of 1995). Forward-looking statements contain words that identify them as forward-looking, such as “may”, “plan”, “seek”, “will”, “expect”, “intend”, “estimate”, “anticipate”, “believe”, “project”, “opportunity”, “target”, “goal”, “growing” and “continue” or other words that relate to future events, as opposed to past or current events. By their nature, forward-looking statements are not statements of historical facts and involve risks and uncertainties because they relate to events and depend on circumstances that may or may not occur in the future. These statements give Green Bancorp’s current expectation of future events or its future performance and do not relate directly to historical or current events or Green Bancorp’s historical or future performance. As such, Green Bancorp’s future results may vary from any expectations or goals expressed in, or implied by, the forward-looking statements included in this presentation, possibly to a material degree. Green Bancorp cannot assure you that the assumptions made in preparing any of the forward- looking statements will prove accurate or that any long-term financial goals will be realized. All forward-looking statements included in this presentation speak only as of the date made, and Green Bancorp undertakes no obligation to update or revise publicly any such forward-looking statements, whether as a result of new information, future events, or otherwise. In particular, Green Bancorp cautions you not to place undue weight on certain forward-looking statements pertaining to potential growth opportunities or long-term financial goals set forth herein. Actual results may vary significantly from these statements. Green Bancorp’s business is subject to numerous risks and uncertainties, which may cause future results of operations to vary significantly from those presented herein. Safe Harbor |
|
|
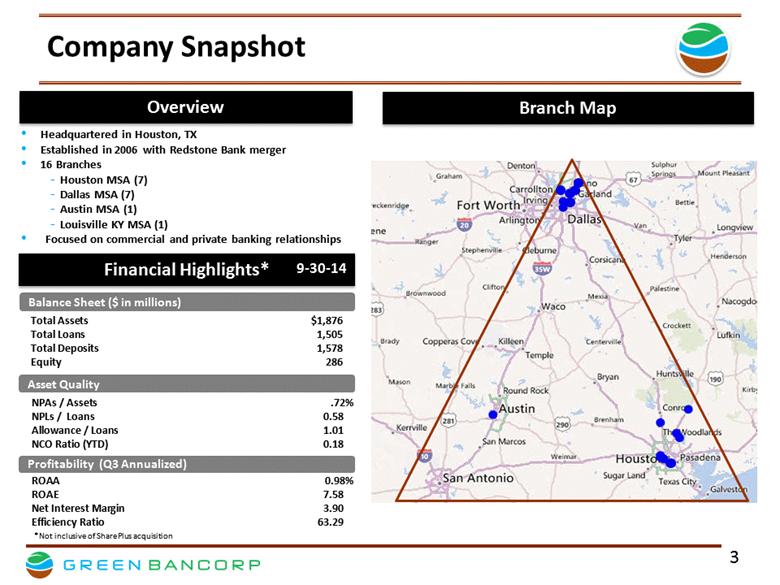
Company Snapshot Overview Branch Map Financial Highlights* Headquartered in Houston, TX Established in 2006 with Redstone Bank merger 16 Branches Houston MSA (7) Dallas MSA (7) Austin MSA (1) Louisville KY MSA (1) Focused on commercial and private banking relationships Balance Sheet ($ in millions) Asset Quality Profitability (Q3 Annualized) Total Assets $1,876 Total Loans 1,505 Total Deposits 1,578 Equity 286 NPAs / Assets .72% NPLs / Loans 0.58 Allowance / Loans 1.01 NCO Ratio (YTD) 0.18 ROAA 0.98% ROAE 7.58 Net Interest Margin 3.90 Efficiency Ratio 63.29 9-30-14 *Not inclusive of SharePlus acquisition |
|
|
Investment Highlights Strong and experienced management team Well-positioned within attractive major metropolitan markets in Texas Portfolio banking model fuels organic growth Scalable portfolio and operating platform can accommodate significant organic growth and enhance profitability potential Experienced acquirer and integrator of financial institutions |
|
|
Manuel J. Mehos, CEO Green Bancorp, Inc. Chairman Green Bank Former Chairman/CEO/President of Coastal Bancorp, Inc. Securities Sales at Goldman, Sachs & Co. C.P.A. at KPMG Previous Board Memberships: Finance Commission of Texas America’s Community Bankers Federal Home Loan Bank of Dallas Texas Savings and Community Bankers Association M.B.A. – University of Texas B.B.A. – University of Texas 28 years in banking Geoffrey D. Greenwade, President Green Bancorp, Inc. President and CEO Green Bank Former Wells Fargo – Regional Manager of Business Banking 30 offices with 130 officers and managers Wells Fargo – EVP, Commercial Business Banking Bank of America Banking Center President Lending Manager Commercial Loan Officer M.B.A. – Baylor University B.B.A. – Texas A&M University 30 years in banking Strong and Experienced Management Team Name and Title Qualification Details Education & Experience Talented team with deep breadth of banking experience |
|
|
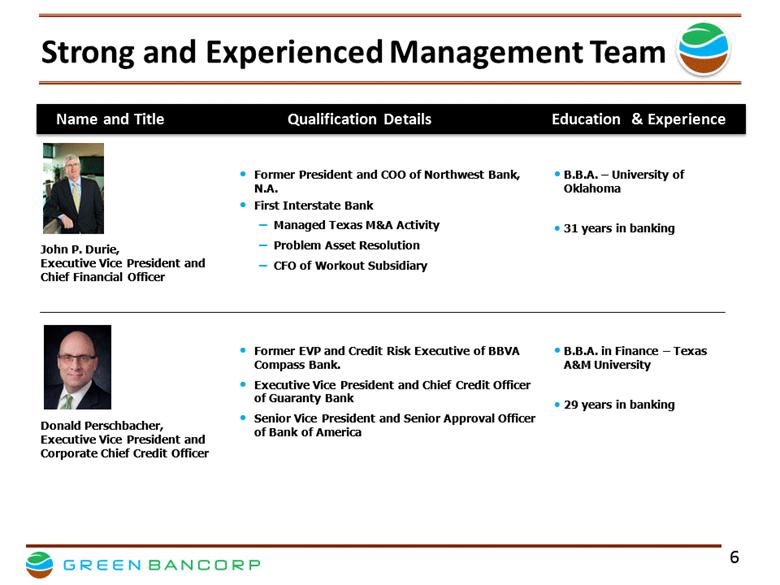
John P. Durie, Executive Vice President and Chief Financial Officer Former President and COO of Northwest Bank, N.A. First Interstate Bank Managed Texas M&A Activity Problem Asset Resolution CFO of Workout Subsidiary B.B.A. – University of Oklahoma 31 years in banking Donald Perschbacher, Executive Vice President and Corporate Chief Credit Officer Former EVP and Credit Risk Executive of BBVA Compass Bank. Executive Vice President and Chief Credit Officer of Guaranty Bank Senior Vice President and Senior Approval Officer of Bank of America B.B.A. in Finance – Texas A&M University 29 years in banking Strong and Experienced Management Team Name and Title Qualification Details Education & Experience |
|
|
Scalable Platform for Growth Portfolio Banker Model - primary growth driver Portfolio Bankers are actively generating business and serving as the primary point of contact for our customers Private and business bankers focus on emerging, affluent and small business customers Commercial and specialty bankers focus on C&I, real estate, energy, mortgage warehouse and SBA loans Increase productivity of existing portfolio bankers Remaining capacity of 37% imbedded in our team, as of 9/30/2014 As utilization rises our efficiency ratio should continue to improve Hire additional seasoned and proven bankers Beat small competitors with size and sophistication, beat large competitors with speed and service |
|
|
Loans Scalable Portfolio And Operational Platform Deposits Scalable Platform & Portfolio Banker Growth Strategy Our team of portfolio bankers has expanded to 48 with an average tenure of three years Generally expect five years for our portfolio bankers to reach full capacity Efficiency ratio decreased from 103.4% in 2009 to 63.3% in Q3 2014 Asset growth from $545.4 million to $1.8 billion during the same period with significant organic growth Hire additional seasoned and proven bankers through: Attractive compensation package, active and growing bank, responsive decision making Provide a full line of business and retail products Beat small competitors with size and sophistication – beat large competitors with speed and service |
|
|
Strategic Acquisitions to Drive Future Growth Focused on well managed banks in our target markets Favorable market share Low cost deposit funding Compelling non-interest income generating business Growth potential Other unique attractive characteristics Leverage reputation as an experienced acquirer Maintain discipline in pricing and pursue transactions expected to produce attractive risk adjusted returns Acquisition strategy emphasizes focus, discipline and success |
|
|
7 Acquisitions at First Interstate 2 Sales at Redstone Bank 1 De Novo Numerous Due Diligence Projects as Lead 4 Acquisitions at Wells Fargo Numerous Credit Due Diligence Projects First Southwest Plan Transaction 13 Acquisitions 3 Divestitures 3 Acquisitions at Guaranty Bank Numerous Portfolio Acquisitions and Business Divestitures Experienced Acquirer Complementary Experience of Senior Team |

|
|
Experienced Acquirer With Strong Track Record Significant In-market Acquisition Opportunities Remain $ 182.7 million - Deposits $ 85.4 million - Loans 2 Branches 12/31/2006 $ 188.4 million - Deposits 1 Branch 10/29/2010 10/21/2011 $167.7 million - Deposits $ 12.7 million - Loans 3 Branches $ 44.1 million - Deposits $ 25.6 million - Loans 1 Branch 05/31/2012 $280.5 million – Deposits $248.2 million - Loans 4 Branches (Source: SNL Financial) 10/17/2014 |
|
|
SharePlus Acquisition Highlights Acquisition announced on May 5, 2014; closed on October 17, 2014 100% cash consideration of $46.2 million or 1.42x(1) tangible book value at announcement Headquartered in Plano, TX, SharePlus was founded as a credit union in 1958, became a publicly traded entity in 2010 and converted its federal thrift charter to a state chartered bank in December 2013 SharePlus adds $348.7 million in total assets, $280.5 million in total deposits and $248.2 million in total loans as of September 30, 2014 Transaction is expected to be accretive to future year’s earnings Transaction Overview Strategic Rationale Consistent with Green Bank’s strategic objective to build a high-performing community banking enterprise with a diversified asset mix, core deposit focus, strong credit culture, and commitment to the communities it serves Strengthens existing Dallas presence by adding 3 branches in the Dallas MSA and 1 additional branch in Louisville, KY and additional portfolio bankers Acquisition multiple based on per share values disclosed in SharePlus’ proxy statement |
|
|
Third Quarter Highlights* Earnings per share of $0.20, an increase of 17.6% YoY Net income of $4.5 million, an increase of 27.3% YoY Strong loan growth, up 18.5% to $1.5 billion Nonperforming Assets remain low decreasing to 0.72% of third quarter total assets Deposits growth of 6.4%, to 1.6 billion driven by strong growth in noninterest-bearing deposits Closed the acquisition of SP Bancorp and its subsidiary SharePlus Bank on October 17, 2014 *Not inclusive of SharePlus acquisition |
|
|
Key Short-Term Strategies |
|
|
Appendix Third Quarter Financial Highlights |
|
|
Third Quarter Financial Highlights 2014 Q3 2013 Q3 Net Income $4,533 $3,561 EPS $0.20 $0.17 ROAA 0.98% 0.84% Loans $1,504,998 $1,270,559 Deposits $1,577,691 $1,483,301 *Dollars in thousands *Dollars in thousands, except per share data |
|
|
Credit Update* Asset quality improvement continues NPA’s of $13.5 million or 0.72% of period end assets Compares favorably to $28.9 million or 1.7% of period end total assets at September 30, 2013 Allowance for loan losses of 1.01% of total loans at September 30, 2014 Compares to 1.17% of total loans at September 30, 2013 and 1.10% of total loans at June 30, 2014 Highlights Total Loan Composition *Not inclusive of SharePlus acquisition |
|
|
Employee Stock Option Plan As of Sept. 30, 2014 Quarter ended Sept. 30, 2014 Nine months ended Sept. 30, 2014 Common shares outstanding - used in Basic EPS 26,170,949 22,713,873 21,430,198 Incremental shares for effect of dilutive options - calculated using treasury stock method 484,001 388,555 297,870 Fully diluted common shares - used in Diluted EPS 26,654,950 23,102,428 21,728,068 Vested stock options - dilutive: Time based stock options 1,023,072 Performance based stock options - Total vested stock options 1,023,072 Unvested stock options - not dilutive: Time based stock options 78,702 Performance based stock options 1,674,511 * Total unvested stock options 1,753,213 Restricted stock - dilutive at issuance: Restricted stock units 275,000 ** * Stock based compensation expense will be recorded at the time performance based options vest. ** Common shares outstanding will increase at the time of issuance. |
|
|
Net Interest Income and Net Interest Margin *Dollars in thousands |
|
|
Non-Interest Income *Dollars in thousands |
|
|
Non-Interest Expense *Dollars in thousands |
|
|
Loans and Deposits *Dollars in thousands |
|
|
Deposit Mix Total Deposits: $1,577,691 *Dollars in thousands |
|
|
Interest Rate Sensitivity Change in Net Interest Income: 12-Month Horizon *This data is derived from an internal static interest rate shock model. The assumptions incorporated into the model are inherently uncertain and, as a result, the model cannot precisely measure future net interest income or precisely predict the impact of fluctuations in market interest rates on net interest income. Interest Rate Change Net Interest Income Change |
|
|
Performance Metrics Efficiency Ratio Remaining Banker Capacity |