Attached files
| file | filename |
|---|---|
| EX-21.1 - LIST OF SUBSIDIARIES - ATWOOD OCEANICS INC | ex21120140930-10ksubsidiar.htm |
| EX-31.1 - CERTIFICATION OF CEO (302) - ATWOOD OCEANICS INC | ex31120140930-10kceocert.htm |
| EX-31.2 - CERTIFICATION OF CFO (302) - ATWOOD OCEANICS INC | ex31220140930-10kcfocert.htm |
| EX-32.1 - CERTIFICATION OF CFO (906) - ATWOOD OCEANICS INC | ex32120140930-10kceocert.htm |
| EX-32.2 - CERTIFICATION OF CFO (906) - ATWOOD OCEANICS INC | ex32220140930-10kcfocert.htm |
| EXCEL - IDEA: XBRL DOCUMENT - ATWOOD OCEANICS INC | Financial_Report.xls |
| EX-23 - CONSENT OF INDEPENDENT REGISTERED PUBLIC ACCOUNTING FIRM - ATWOOD OCEANICS INC | ex2320140930-10kpwcconsent.htm |
UNITED STATES
SECURITIES AND EXCHANGE COMMISSION
WASHINGTON, D. C. 20549
Form 10-K
ý | ANNUAL REPORT PURSUANT TO SECTION 13 OR 15(d) OF THE SECURITIES EXCHANGE ACT OF 1934 |
For the fiscal year ended September 30, 2014 | |
¨ | TRANSITION REPORT PURSUANT TO SECTION 13 OR 15(d) OF THE SECURITIES EXCHANGE ACT OF 1934 |
For the transition period from __________________________________to __________________________________ | |
Commission File Number 1-13167
ATWOOD OCEANICS, INC.
(Exact name of registrant as specified in its charter)
Texas | 74-1611874 | |
(State or other jurisdiction of incorporation or organization) | (I.R.S. Employer Identification No.) | |
15011 Katy Freeway, Suite 800 Houston, Texas | 77094 | |
(Address of principal executive offices) | (Zip Code) | |
Registrant’s telephone number, including area code: (281) 749-7800
Securities registered pursuant to Section 12(b) of the Act:
Title of each class | Name of each exchange on which registered | |
Common Stock $1.00 par value | New York Stock Exchange | |
Securities registered pursuant to Section 12(g) of the Act: None
Indicate by check mark if the registrant is a well-known seasoned issuer, as defined in Rule 405 of the Securities Act. Yes ý No ¨
Indicate by check mark if the registrant is not required to file reports pursuant to Section 13 or Section 15(d) of the Act. Yes ¨ No ý
Indicate by check mark whether the registrant (1) has filed all reports required to be filed by Section 13 or 15 (d) of the Securities Exchange Act of 1934 during the preceding 12 months (or for such shorter period that the registrant was required to file such reports), and (2) has been subject to such filings requirements for the past 90 days. Yes ý No ¨
Indicate by check mark whether the registrant has submitted electronically and posted on its corporate Website, if any, every Interactive Data File required to be submitted and posted pursuant to Rule 405 of Regulation S-T (§232.405 of this chapter) during the preceding 12 months (or for such shorter period that the registrant was required to submit and post such files). Yes ý No ¨
Indicate by check mark if disclosure of delinquent filers pursuant to Item 405 of Regulation S-K (§229.405 of this chapter) is not contained herein, and will not be contained, to the best of the registrant’s knowledge, in definitive proxy or information statements incorporated by reference in Part III of this Form 10-K or any amendment to this Form 10-K ¨.
Indicate by check mark whether the registrant is a large accelerated filer, accelerated filer, a non-accelerated filer, or a smaller reporting company. See definitions of “large accelerated filer”, “accelerated filer” and “smaller reporting company” in Rule 12b-2 of the Exchange Act.
Large accelerated filer | ý | Accelerated filer | ¨ |
Non-accelerated filer | ¨ (Do not check if a Smaller Reporting Company) | Smaller Reporting Company | ¨ |
Indicate by check mark whether the registrant is a shell company (as defined in Rule 12b-2 of the Act). Yes ¨ No ý
The aggregate market value of the voting and non-voting common equity held by non-affiliates computed by reference to the price at which our Common Stock, $1.00 par value, was last sold, or the average bid and asked price of such Common Stock, as of March 31, 2014 was $3.2 billion.
The number of shares outstanding of our Common Stock, $1.00 par value, as of November 5, 2014: 64,357,556.
DOCUMENTS INCORPORATED BY REFERENCE
(1) Proxy Statement for 2015 Annual Meeting of Shareholders - Referenced in Part III of this report.
ATWOOD OCEANICS, INC.
Form 10-K
For the Year Ended September 30, 2014
Table of Contents
Page | |||
2
FORWARD-LOOKING STATEMENTS
Statements included in this Form 10-K regarding future financial performance, capital sources and results of operations and other statements, other than statements of historical fact, that address activities, events or developments that we expect, believe or anticipate will or may occur in the future are forward-looking statements within the meaning of Section 27A of the Securities Act of 1933 and Section 21E of the Securities Exchange Act of 1934. Such statements are those concerning strategic plans, expectations and objectives for future operations and performance. When used in this report, the words “believes,” “expects,” “anticipates,” “plans,” “intends,” “estimates,” “projects,” “could,” “should,” “may,” or similar expressions are intended to be among the statements that identify forward-looking statements.
Such statements are subject to numerous risks, uncertainties and assumptions that are beyond our ability to control, including, but not limited to:
• | prices of oil and natural gas and industry expectations about future prices; |
• | market conditions and level of activity in the drilling industry and the global economy in general; |
• | the operational risks involved in drilling for oil and gas; |
• | the highly competitive and volatile nature of our business; |
• | our ability to enter into, and the terms of, future drilling contracts, including contracts for our newbuild units and for rigs whose contracts are expiring; |
• | the impact of governmental or industry regulation, both in the United States and internationally; |
• | the termination or renegotiation of contracts by customers or payment or other delays by our customers; |
• | the risks of and disruptions to international operations, including political instability and the impact of terrorist acts, acts of piracy, embargoes, war or other military operations; |
• | our ability to obtain and retain qualified personnel to operate our vessels; |
• | unplanned downtime and repairs on our rigs; |
• | timely access to spare parts, equipment and personnel to maintain and service our fleet; |
• | customer requirements for drilling capacity and customer drilling plans; |
• | the adequacy of sources of liquidity for us and for our customers; |
• | changes in tax laws, treaties and regulations; |
• | the risks involved in the construction, upgrade, and repair of our drilling units; and |
• | such other risks discussed in Item 1A. “Risk Factors” of this Form 10-K and in our other reports filed with the Securities and Exchange Commission, or SEC. |
Forward-looking statements are made based upon management’s current plans, expectations, estimates, assumptions and beliefs concerning future events impacting us and therefore involve a number of risks and uncertainties. We caution that forward-looking statements are not guarantees and that actual results could differ materially from those expressed or implied in the forward-looking statements. Undue reliance should not be placed on these forward-looking statements, which are applicable only on the date hereof. We undertake no obligation to revise or update these forward-looking statements to reflect events or circumstances that arise after the date hereof or to reflect the occurrence of unanticipated events.
3
PART I
ITEM 1. | BUSINESS |
Atwood Oceanics, Inc. (which together with its subsidiaries is identified as the “Company,” “we,” “us” or “our,” except where stated or the context requires otherwise) is a global offshore drilling contractor engaged in the drilling and completion of exploratory and developmental oil and gas wells. We currently own a diversified fleet of 13 mobile offshore drilling units located in the United States ("U.S.") Gulf of Mexico, the Mediterranean Sea, offshore West Africa, offshore Southeast Asia and offshore Australia and we are constructing two ultra-deepwater drillships for delivery in fiscal years 2015 through 2016. We were founded in 1968 and are headquartered in Houston, Texas with support offices in Australia, Malaysia, Singapore, the United Arab Emirates and the United Kingdom.
We report our offshore contract drilling operation as a single reportable segment: Offshore Contract Drilling Services. The mobile offshore drilling units and related equipment comprising our offshore rig fleet operate in a single, global market for contract drilling services and are often redeployed globally due to changing demands of our customers, which consist largely of major integrated oil and natural gas companies and independent oil and natural gas companies. The offshore drilling markets where we currently operate, including the U.S. Gulf of Mexico, the Mediterranean Sea, offshore West Africa, offshore Southeast Asia and offshore Australia, are rich in hydrocarbon deposits and thus offer the potential for high drilling activity over the long-term.
OFFSHORE DRILLING EQUIPMENT
Each type of drilling rig is uniquely designed for different purposes and applications, for operations in different water depths, bottom conditions, environments and geographical areas, and for different drilling and operating requirements. We classify rigs with the ability to operate in 5,000 feet of water or greater as deepwater rigs and rigs with the ability to operate in 7,500 feet of water or greater as ultra-deepwater rigs. The following descriptions of the various types of drilling rigs we own or are constructing illustrate the diversified range of applications of our rig fleet.
Ultra-Deepwater Drillships
Drillships are self-propelled vessels, shaped like conventional ships and are the most mobile of the major rig types. Our high-specification drillships currently under construction are dynamically-positioned, which allows them to maintain position without anchors through the use of their onboard propulsion and station-keeping systems. Drillships typically have greater load capacity than semisubmersible rigs, which enables them to carry more supplies on board, often making them better suited for drilling in remote locations where resupply is more difficult. Drillships are designed to operate in greater water depths than bottom support drilling rigs. Drillships are a subset of floating rigs or floaters.
Semisubmersible Rigs
Semisubmersible rigs can be either dynamically-positioned, which renders them self-propelled similar to drillships, or moored. They typically have two hulls, the lower of which is capable of being flooded. Drilling equipment is mounted on the main hull. After the drilling unit is towed to location, the ballast tanks in the lower hull are flooded, lowering the entire drilling unit to its operating draft, and the drilling unit is then either anchored in place (conventionally moored drilling unit) or maintains position through the use of onboard propulsion and station-keeping systems (dynamically-positioned drilling unit). On completion of operations, the lower hull is deballasted, raising the entire drilling unit to its towing draft. Similar to drillships, this type of drilling unit is designed to operate in greater water depths than bottom supported drilling rigs. Semisubmersibles also operate in more severe sea conditions than other types of drilling units. Semisubmersible rigs are also a subset of floating rigs or floaters.
Jackup Drilling Rigs
A jackup drilling rig consists of a single hull supported by at least three legs positioned on the sea floor. It is typically towed to the well site and once on location, its legs are lowered to the sea floor and the unit is raised out of the water by jacking the hull up the legs. Jackup drilling units typically operate in water depths no greater than 500 feet.
4
The following table presents our rig fleet as of November 1, 2014, all of which are wholly owned:
Rig Name | Rig Type | Construction Completed/Last Upgraded (Calendar Year) | Water Depth Rating (feet) | ||||
Atwood Achiever | Drillship | construction completed 2014 | 12,000 | ||||
Atwood Advantage | Drillship | construction completed 2013 | 12,000 | ||||
Atwood Condor | Semisubmersible | construction completed 2012 | 10,000 | ||||
Atwood Osprey | Semisubmersible | construction completed 2011 | 8,200 | ||||
Atwood Eagle | Semisubmersible | upgraded 2002 | 5,000 | ||||
Atwood Falcon | Semisubmersible | upgraded 2012 | 5,000 | ||||
Atwood Hunter | Semisubmersible | upgraded 2014 | 5,000 | ||||
Atwood Mako | Jackup | construction completed 2012 | 400 | ||||
Atwood Manta | Jackup | construction completed 2012 | 400 | ||||
Atwood Orca | Jackup | construction completed 2013 | 400 | ||||
Atwood Beacon | Jackup | construction completed 2003 | 400 | ||||
Atwood Aurora | Jackup | construction completed 2009 | 350 | ||||
Atwood Southern Cross(1) | Semisubmersible | upgraded 2006 | 2,000 | ||||
(1) | Currently cold-stacked and not actively marketed. |
In addition to the above drilling units, we are in the process of constructing two additional drillships. The following table presents our current newbuild projects as of November 1, 2014:
Rig Name | Rig Type | Shipyard | Scheduled Delivery Date | Expected Cost (in millions) | Water Depth Rating (feet) | ||||||||
Atwood Admiral | Drillship | DSME | September 30, 2015 | $ | 635 | 12,000 | |||||||
Atwood Archer | Drillship | DSME | June 30, 2016 | 635 | 12,000 | ||||||||
The Atwood Admiral and Atwood Archer are DP-3 dynamically-positioned, dual derrick, ultra-deepwater drillships rated to operate in water depths up to 12,000 feet and are currently under construction at the DSME shipyard in South Korea. These drillships will have enhanced technical capabilities, including two seven-ram BOPs, three 100-ton knuckle boom cranes, a 165-ton active heave “tree-running” knuckle boom crane and 200 person accommodations. As of September 30, 2014, we had approximately $950 million of total remaining firm commitments related to the construction of these two drillships.
Maintaining high equipment utilization and revenue efficiency through the industry cycles is a significant factor in generating cash flow to satisfy current and future obligations and has been one of our primary performance excellence initiatives. We had a 97% available utilization rate in fiscal year 2014 for our in-service rigs, while our available utilization rate for in-service rigs averaged approximately 96% during the past five fiscal years. See "Item 6: Selected Financial Data" for further discussion on in-service rigs and the calculation of available utilization rates.
As of November 1, 2014, our twelve in-service rigs had approximately 84% and 53% of our available rig days contracted for fiscal years 2015 and 2016, respectively. The Atwood Southern Cross is currently cold-stacked and not actively marketed.
5
The following table presents information regarding the contract status of our drilling units as of November 1, 2014:
Rig Name | Percentage of FY 2014 Revenues | Location at November 1, 2014 | Customer | Contract Status at November 1, 2014 | ||||
ULTRA-DEEPWATER SEMISUBMERSIBLES AND DRILLSHIPS: | ||||||||
Atwood Advantage | 11% | U.S. Gulf of Mexico | Noble Energy Inc. ("Noble") | The rig is currently working under a drilling program with Noble which extends to April 2017. | ||||
Atwood Achiever | 2% | Enroute to Northwest Africa | Kosmos Energy Ltd. ("Kosmos") | The rig was delivered in September 2014 and is mobilizing to Northwest Africa to commence a drilling program with Kosmos which extends to December 2017. | ||||
Atwood Admiral | N/A | South Korea | None | The rig is under construction in South Korea with scheduled delivery in September 2015. | ||||
Atwood Archer | N/A | South Korea | None | The rig is under construction in South Korea with scheduled delivery in June 2016. | ||||
Atwood Condor | 16% | U.S. Gulf of Mexico | Shell Offshore Inc. ("Shell") | The rig is currently working under a drilling program with Shell which extends to November 2016. | ||||
Atwood Osprey | 15% | Offshore Australia | Chevron Australia Pty. Ltd. ("Chevron") | The rig is currently working under a drilling program with Chevron which extends to May 2017. | ||||
DEEPWATER SEMISUBMERSIBLES: | ||||||||
Atwood Eagle | 12% | Offshore Australia | Woodside Energy Ltd. ("Woodside") | The rig is currently working under a drilling program with Woodside which extends to August 2016. | ||||
Atwood Falcon | 12% | Offshore Australia | Apache Energy Ltd. ("Apache")/Murphy Australia WA-481-P Oil PTY LTD ("Murphy")/BHP Billiton Petroleum Pty., Limited ("BHP Billiton") | The rig is currently working under a drilling program with Apache which extends to January 2015. Following this program, the rig will commence a drilling program with Murphy which extends to April 2015. Subsequent to that program, the rig will commence a drilling program with BHP Billiton which extends to March 2016. | ||||
Atwood Hunter | 5% | Offshore Equatorial Guinea | CNOOC Africa Limited ("CNOOC Africa") | The rig is currently working under a drilling program with CNOOC Africa which extends to mid-November 2014. | ||||
JACKUPS: | ||||||||
Atwood Mako | 5% | Offshore Thailand | Salamander Energy (Bualuang) Limited ("Salamander") | The rig is currently working under a drilling program with Salamander which extends to mid-November 2014. | ||||
Atwood Manta | 6% | Offshore Thailand | CEC International, Ltd. ("CEC") | The rig is currently working under a drilling program with CEC which extends to December 2015. | ||||
Atwood Orca | 5% | Offshore Thailand | Mubadala Petroleum ("Mubadala") | The rig is currently working under a drilling program with Mubadala which extends to February 2016. | ||||
Atwood Aurora | 6% | Offshore Cameroon | Addax Petroleum Cameroon Limited ("Addax") | The rig is currently working under a drilling program with Addax which extends to September 2016. | ||||
Atwood Beacon | 5% | Offshore Italy | ENI S.p.A ("ENI") | The rig is currently working under a drilling program with ENI which extends to January 2016. | ||||
OTHER: | ||||||||
Atwood Southern Cross | N/A | Malta | None | The rig is currently cold-stacked and is not being actively marketed. | ||||
6
Our contract backlog at September 30, 2014 was approximately $3.0 billion, representing an approximate 21% decrease compared to our contract backlog of $3.8 billion at September 30, 2013. See Item 1A. “Risk Factors—Our current backlog of contract drilling revenue may not be ultimately realized” and “Management’s Discussion and Analysis of Financial Condition and Results of Operations—Market Outlook—Contract Backlog” in Item 7 of this Form 10-K.
INDUSTRY TRENDS
Our industry is subject to intense price competition and volatility. Periods of high demand and higher day rates are often followed by periods of low demand and lower day rates. Offshore drilling contractors can build new drilling rigs, mobilize rigs from one region of the world to another, “idle” or scrap rigs (taking them out-of-service) or reactivate idled rigs in order to adjust the supply of existing equipment in various markets to meet demand. The market for drilling services is typically driven by global hydrocarbon demand and changes in actual or anticipated oil and gas prices. Generally, sustained high energy prices result in higher cash flow generation by exploration and production companies. This trend is typically accentuated in periods of lower overall industry utilization and day rates. This can translate into increased exploration and production spending by these oil and gas companies, which in turn results in increased drilling activity and demand for services like ours.
Our customers are increasingly demanding newer, higher specification drilling rigs to perform contract drilling services either as a response to increased technical challenges or for the safety, reliability and efficiency typical of the newer, more capable rigs. This trend is commonly referred to as the bifurcation of the drilling fleet. Bifurcation is occurring in both the jackup and floater rig classes and is evidenced by the higher specification drilling rigs operating at generally higher overall utilization levels and day rates than the lower specification or standard drilling rigs. As the offshore drilling sector continues to construct and deliver a larger number of newer, higher specification drilling units, we expect lower specification units to experience reduced overall utilization and day rates leading to a significant number of rigs being either warm or cold-stacked or scrapped.
Floating drilling rigs are outfitted with highly sophisticated subsea well control equipment. The number of original equipment manufacturer (“OEM”) vendors manufacturing and servicing this equipment is limited and their ability to service the drilling industry on a timely basis is challenged. Demand for trained service personnel for subsea well control equipment has sharply increased and delivery times for this equipment have lengthened, driven by the significant increase in the number of rigs under construction, related to increased maintenance and testing requirements following the Macondo incident.
Offshore drilling market fundamentals have significantly deteriorated over the past year. Activity, measured by the level of capital expenditures incurred by the exploration and production companies, has slowed from previous years, particularly for floating drilling rigs. In addition, international oil prices have declined significantly from mid-year levels due to lower-than-expected global oil demand growth and increased supply from U.S. unconventional sources. Generally, a prolonged lower oil price environment restrains increases in exploration and development drilling investment. See "Management's Discussion and Analysis of Financial Condition and Results of Operations-Market Outlook" of this Form 10-K.
DRILLING CONTRACTS
We obtain the contracts under which we operate our units either through direct negotiation with customers or by submitting proposals in competition with other contractors. Our contracts vary in their terms and rates depending on the nature of the operation to be performed, the duration of the work, the amount and type of equipment and services provided, the geographic areas involved, market conditions and other variables.
The initial term of contracts for our units has ranged from the length of time necessary to drill one well to several years. It is not unusual for contracts to contain renewal provisions, which in time of weak market conditions are usually at the option of the customer, and in strong market conditions are usually mutually agreeable.
Generally, contracts for drilling services specify a basic rate of compensation computed on a day rate basis. Contracts generally provide for a reduced day rate payable when operations are interrupted by equipment failure and subsequent repairs, field moves, adverse weather conditions or other factors beyond our control. Some contracts also provide for revision of the specified day rates in the event of material changes in certain items of cost. Any period during which a rig is not earning a full operating day rate because of the above conditions or because the rig is idle and not on contract will have an adverse effect on operating profits. An over-supply of drilling rigs in any market area can adversely affect our ability to employ our drilling units in these market areas.
For any long rig moves outside of in-field relocations, we may obtain from our customers either a lump sum or a day rate as mobilization compensation for services performed and expenses incurred during the period in transit. In a weaker market environment, we may not fully recover our relocation costs or receive any mobilization compensation. However, in a stronger market environment, we are generally able to obtain full reimbursement of relocation costs plus a partial or full day rate as
7
mobilization compensation. We can give no assurance that we will receive full or partial recovery of any future relocation costs beyond those for which we have already contracted.
Certain of our contracts may be canceled upon specified notice at the option of the customer upon payment of an early termination fee, which is typically a percentage of the full operating rate over the remainder of the contract term. Contracts also customarily provide for either automatic termination or termination at the option of the customer in the event of total loss of the drilling rig, if a rig is not delivered to the customer, if a rig does not pass acceptance testing within the period specified in the contract, if drilling operations are suspended for extended periods of time by reason of excessive rig downtime for repairs, or other specified conditions, including force majeure or failure to meet minimum performance criteria. Early termination of a contract may result in a rig being idle for an extended period of time.
Operation of our drilling equipment is subject to the offshore drilling requirements of petroleum exploration companies and agencies of local or foreign governments. These requirements are, in turn, subject to changes in government policies, global demand and prices for petroleum and petroleum products, proved reserves and production in relation to such demand and the extent by which such demand can be met from onshore sources.
The majority of our contracts are denominated in U.S. dollars, but occasionally all or a portion of a contract is payable in local currency. To the extent there is a local currency component in a contract, we attempt to match similar revenue in the local currency to the operating costs paid in the local currency such as local labor, shore base expenses, and local taxes, if any, in order to minimize foreign currency fluctuation impact.
INSURANCE AND RISK MANAGEMENT
Our operations are subject to the usual hazards associated with the drilling of oil and gas wells, such as blowouts, explosions and fires. In addition, our equipment is subject to various risks particular to our industry which we seek to mitigate by maintaining insurance. These risks include, among others, leg damage to jackups during positioning, capsizing, grounding, collision and damage from severe weather conditions. Any of these risks could result in damage or destruction of drilling rigs and oil and gas wells, personal injury and property damage, suspension of operations or environmental damage through oil spillage or extensive, uncontrolled fires. Therefore, in addition to general business insurance policies, we maintain the following insurance relating to our rigs and rig operations, among others: hull and machinery, protection and indemnity, mortgagee’s interest, cargo, war risks, casualty and liability (including excess liability) and, in certain instances, we may carry loss of hire. Our casualty and liability insurance policies are subject to self-insured deductibles. With respect to hull and machinery, we maintain a deductible of $5 to $7.5 million per occurrence. For general and marine third-party liabilities, we generally maintain a $1 million per occurrence deductible on personal injury liability for crew claims. Our rigs are insured at values ranging from book value, for the cold-stacked rigs, to estimated market value, for our in-service rigs. In addition, the Atwood Advantage and Atwood Condor are jointly insured against up to $150 million of damage as a result of a U.S. Gulf of Mexico windstorm. We maintain a $10 million deductible under our U.S. Gulf of Mexico windstorm insurance.
We believe that we are adequately insured against normal and foreseeable risks in our operations in accordance with industry standards; however, such insurance may not be adequate to protect us against liability from all consequences of well disasters, marine perils, extensive fire damage, and damage to the environment or disruption due to terrorism. To date, we have not experienced difficulty in obtaining insurance coverage, although we can provide no assurance as to the future availability of such insurance or the cost thereof. The occurrence of a significant event against which we are not adequately insured could have a material adverse effect on our financial position. See “Operating hazards increase our risk of liability; we may not be able to fully insure against all of these risks.” in Item 1A. “Risk Factors” of this Form 10-K.
CUSTOMERS
Due to the relatively limited number of customers for which we can perform operations at any given time, our business operations are subject to certain associated risks. The loss of, or a decrease in the drilling programs of, these customers may adversely affect our revenues and, therefore, our results of operations and cash flows. Our revenues from individual customers that accounted for 10% or more of our total revenues in fiscal year 2014 are indicated below:
Customer | Percentage of Revenues |
Apache Energy Ltd. | 18% |
Shell Offshore Inc. | 15% |
Chevron Australia Pty. Ltd. | 15% |
Noble Energy Inc. | 14% |
8
In addition, we have certain customers that make up a significant portion of our accounts receivable at September 30, 2014, as indicated in the table below:
Customer | Percentage of Accounts Receivable |
Apache Energy Ltd. | 12% |
Shell Offshore Inc. | 10% |
Chevron Australia Pty. Ltd. | 14% |
Noble Energy Inc. | 14% |
See Item 1A. "Risk Factors - Our business relies heavily on a limited number of customers and a limited number of drilling units and the loss of a significant customer, the loss of a rig, significant downtime for our rigs, or the inability of our customers to perform could materially and adversely impact our business" of this Form 10-K.
COMPETITION
The offshore drilling industry is very competitive, with no single offshore drilling contractor being dominant. We compete with a number of offshore drilling contractors for work, which varies by job requirements and location. Many of our competitors are substantially larger than we are and possess appreciably greater financial and other resources and assets than we do. Our competitors include, among others, the six members of our self-determined peer group including Diamond Offshore Drilling, Inc., Ensco plc, Noble Corporation, Rowan Companies plc, Seadrill Limited, and Transocean Ltd.
Technical capability, location, rig availability and price competition are generally the most important factors in the offshore drilling industry; however, when there is high worldwide utilization of equipment, rig availability and suitability become more important factors in securing contracts than price. Other competitive factors include work force experience, efficiency and condition of equipment, safety performance, reputation and customer relations. We believe that we compete favorably with respect to these factors. See Item 1A. "Risk Factors - Our industry is subject to intense price competition and volatility" of this Form 10-K.
INTERNATIONAL OPERATIONS
During our 46 year history, the majority of our drilling units have operated outside of United States waters, and we have conducted drilling operations in most of the major offshore exploration areas of the world. In the two fiscal years prior to 2013, at least 95% of our contract revenues were derived from foreign operations. In fiscal year 2013, 83% of our contract revenues were derived from foreign operations as a result of our newest ultra-deepwater, semisubmersible drilling rig, the Atwood Condor, having operated in the U.S. Gulf of Mexico for the entire fiscal year. In fiscal year 2014, 70% of our contract revenues were derived from foreign operations as a result of our newest ultra-deepwater drillship, the Atwood Advantage being delivered from the shipyard in December 2013 and operating in the U.S. Gulf of Mexico during the fiscal year. For information relating to the contract revenues and long-lived assets attributable to specific geographic areas of operations, see Note 11 to the Consolidated Financial Statements in Item 8 of this Form 10-K.
For information about risk associated with our foreign operations, see Item 1A, “Risk Factors—Our international operations may involve risks not generally associated with domestic operations.” and “A change in tax laws in any country in which we operate could result in higher tax expense” of this Form 10-K.
EMPLOYEES
As of November 1, 2014, we had approximately 1,905 personnel engaged, including those through labor contractors or agencies. In connection with our foreign drilling operations, we are often required by the host country to hire a substantial percentage of our work force in that country and, in some cases, these employees are represented by foreign unions. To date, we have experienced little difficulty in complying with such requirements, and our drilling operations have not been significantly interrupted by strikes or work stoppages. Our success also depends to a significant extent upon the efforts and abilities of our executive officers and other key management personnel. There is no assurance that these individuals will continue in such capacity for any particular period of time. See Item 1A. "Risk Factors - Failure to obtain and retain key personnel could impede our operations" of this Form 10-K.
9
ENVIRONMENTAL REGULATION
Our operations are subject to a variety of U.S. and foreign environmental regulations and to international environmental conventions. We monitor environmental regulation in each country in which we operate and, while we have experienced an increase in general environmental regulation, we do not believe compliance with such regulations will have a material adverse effect upon our business or results of operations. Past environmental issues, such as the Macondo incident, have led to higher drilling costs, greater regulation a more difficult and lengthy well permitting process and, in general, have adversely affected decisions of oil and gas companies to drill in certain areas.
In the United States as well as in other jurisdictions in which we operate, laws and regulations applicable to our operations include those that (i) require the acquisition of permits to conduct regulated activities; (ii) restrict the types, quantities and concentration of various substances that can be released into the environment in connection with operations; (iii) limit or prohibit drilling activities in certain protected areas; (iv) require remedial measures to mitigate pollution from former and ongoing operations, such as requirements to plug abandoned wells; (v) impose specific safety and health criteria addressing worker protection; and (vi) impose substantial liabilities for pollution resulting from drilling and production operations. Any failure to comply with these laws and regulations may result in the assessment of administrative, civil and criminal penalties, the imposition of corrective or remedial obligations and the issuance of orders enjoining performance of some of our operations. Laws and regulations protecting the environment have become more stringent, and may in some cases impose strict liability, rendering a person liable for environmental damage without regard to negligence or fault on the part of such person. Some of these laws and regulations may expose us to liability for the conduct of or conditions caused by others or for acts which were in compliance with all applicable laws at the time they were performed. The application of these requirements or the adoption of new requirements could have a material adverse effect on our financial position, results of operations or cash flows. We believe all of our rigs satisfy current environmental requirements and certifications, if any, required to operate in the jurisdictions where they currently operate, but can give no assurance that in the future they will satisfy new environmental requirements or certifications, if any, or that the costs to satisfy such requirements or certifications, if any, would not materially affect our financial position, results of operations or cash flows.
The description below of U.S. federal environmental laws and regulations is based upon those currently in effect. In addition to federal laws, state and local environmental laws apply to our operations. As a result of the Macondo incident, legislation and regulations have been proposed that could affect applicable liability limits under existing U.S. environmental laws and regulations. If and when any such changes are adopted by legislation or regulation, we will be able to better assess its impact on us. While laws can vary widely from one jurisdiction to another, each of the laws and regulations described below addresses environmental issues generally similar to those addressed by laws in most of the other jurisdictions in which we operate.
The U.S. Federal Water Pollution Control Act of 1972, commonly referred to as the Clean Water Act, prohibits the discharge of specified substances into waters of the United States without a permit. The regulations implementing the Clean Water Act require permits to be obtained by an operator before specified exploration activities occur. Offshore facilities must also prepare plans addressing spill prevention control and countermeasures. Violations of monitoring, reporting and permitting requirements or other provisions of the Clean Water Act can result in the imposition of administrative, civil and criminal penalties or remedial or mitigation measures.
The U.S. Oil Pollution Act of 1990, or OPA, and related regulations impose a variety of requirements on “responsible parties” related to the prevention of oil spills and liability for damages resulting from such spills. Few defenses exist to the strict liability imposed by OPA, and the liability could be substantial. Failure to comply with ongoing requirements or inadequate cooperation in the event of a spill could subject a responsible party to civil or criminal enforcement action. OPA assigns joint and several, strict liability, without regard to fault, to each liable party for all containment and oil removal costs and a variety of public and private damages including, but not limited to, the costs of responding to a release of oil, natural resource damages, and economic damages suffered by persons adversely affected by an oil spill.
10
The U.S. Comprehensive Environmental Response, Compensation, and Liability Act, or CERCLA, also known as the “Superfund” law, imposes liability without regard to fault or the legality of the original conduct on some classes of persons that are considered to have contributed to the release of a “hazardous substance” into the environment. Such persons include the owner or operator of a facility or vessel from which a release occurred and companies that disposed of or arranged for the transport or disposal of the hazardous substances found at a particular site. Persons who are or were responsible for releases of hazardous substances under CERCLA may be subject to joint and several liabilities for the cost of cleaning up the hazardous substances that have been released into the environment, for damages to natural resources, and for the costs of certain health studies. CERCLA also authorizes the U.S. Environmental Protection Agency (the “EPA”) and, in some instances, third parties to act in response to threats to the public health or the environment and to seek to recover from the responsible classes of persons the costs they incur. It is also not uncommon for third parties to file claims for personal injury and property damage allegedly caused by the hazardous substances released into the environment. We generate materials in the course of our operations that may be regulated as hazardous substances.
The U.S. Resource Conservation and Recovery Act (“RCRA”) governs the management of wastes, including the treatment, storage and disposal of hazardous wastes. RCRA imposes stringent operating requirements, and liability for failure to meet such requirements, on a person who is either a “generator” or “transporter” of hazardous waste or an “owner” or “operator” of a hazardous waste treatment, storage or disposal facility. RCRA specifically excludes from the definition of hazardous waste drilling fluids, produced waters, and other wastes associated with the exploration, development, or production of crude oil and natural gas. A similar exemption is contained in many of the state counterparts to RCRA, leaving such excluded wastes to be regulated as solid waste. As a result, a substantial portion of RCRA's requirements do not apply to us as our operations generate minimal quantities of hazardous wastes (i.e., industrial wastes such as solvents, waste compressor oils, etc.). However, a petition is currently before the EPA to revoke the oil and natural gas exploration and production exemption. Any repeal or modification of this or similar exemption in similar state statutes, would increase the volume of hazardous waste we are required to manage and dispose of, and would cause us, as well as our competitors, to incur increased operating expenses with respect to our U.S. operations.
The federal Clean Air Act regulates emissions of various air pollutants through air emissions standards, construction and operating permitting programs and the imposition of other compliance requirements. These laws and regulations may require us to obtain and strictly comply with stringent air permit requirements or utilize specific equipment or technologies to control emissions of certain pollutants. Compliance with these requirements could increase our costs of development and production.
OTHER GOVERNMENTAL REGULATION
Our operations are subject to various international conventions, laws and regulations in the countries in which we operate, including laws and regulations relating to the importation of and operation of drilling units, currency conversions and repatriation, oil and gas exploration and development, taxation of offshore earnings and earnings of expatriate personnel, environmental protection, the use of local employees and suppliers by foreign contractors and duties on the importation and exportation of drilling units and other equipment. Governments in some foreign countries have become increasingly active in regulating and controlling the ownership of concessions and companies holding concessions, the exploration for oil and gas and other aspects of the oil and gas industries in their countries. In some areas of the world, this governmental activity has adversely affected the amount of exploration and development work done by major oil and gas companies and may continue to do so. Operations in less developed countries can be subject to legal systems that are not as mature or predictable as those in more developed countries, which can lead to greater uncertainty in legal matters and proceedings.
Our newest active ultra-deepwater drillship the Atwood Advantage, and our newest active ultra-deepwater, semisubmersible drilling rig, the Atwood Condor, are currently in the U.S. Gulf of Mexico under contract with Noble and Shell respectively, as of the fourth quarter of fiscal year 2014. Our U.S. operations are subject to various U.S. laws and regulations, including drilling safety rules and workplace safety rules put in place by the Bureau of Ocean Energy Management ("BOEM") and the Bureau of Safety and Environmental Enforcement (“BSEE”), which are designed to improve drilling safety by strengthening requirements for safety equipment, well control systems, and blowout prevention practices for offshore oil and gas operations, and to improve workplace safety by reducing the risk of human error. Implementation of new BOEM or BSEE guidelines or regulations may subject us to increased costs or limit the operational capabilities of our U.S. based rigs and could materially and adversely affect our financial position, results of operations or cash flows. In addition, the U.S. Occupational Safety and Health Act ("OSHA") and other similar laws and regulations govern the protection of the health and safety of employees. Please see Item 1A. “Risk Factors - Government regulation and environmental risks could reduce our business opportunities, expose us to liability and increase our costs” of this Form 10-K.
11
We believe we are in compliance in all material respects with the health, safety and other regulations affecting the operation of our rigs and the drilling of oil and gas wells in the jurisdictions in which we operate. Historically, we have made significant capital expenditures and incurred additional expenses to ensure that our equipment complies with applicable local and international health and safety regulations. Although such expenditures may be required to comply with these governmental laws and regulations, such compliance has not, to date, materially adversely affected our earnings, cash flows or competitive position.
AVAILABLE INFORMATION
We file annual, quarterly and current reports, proxy statements and other information with the SEC. Our SEC filings are available to the public over the internet at the SEC’s web site at http://www.sec.gov. Our website address is www.atwd.com. We make available free of charge on or through our website our annual report on Form 10-K, quarterly reports on Form 10-Q, and current reports on Form 8-K, and amendments to those reports filed or furnished pursuant to Section 13(a) or 15(d) of the Exchange Act as soon as reasonably practicable after we electronically file such material with, or furnish it to, the SEC. We have adopted a Code of Business Conduct and Ethics and a Code of Ethics for the Chief Executive Officer and Senior Financial Officers which are available on our website. We intend to satisfy the disclosure requirement regarding any changes in or waivers from our codes of ethics by posting such information on our website or by filing a Form 8-K for such event. Unless stated otherwise, information on our website is not incorporated by reference into this report or made a part hereof for any purpose. You may also read and copy any document we file at the SEC’s Public Reference Room at 100 F Street NE, Washington, DC 20549. Please call the SEC at 1-800-SEC-0330 for further information on the Public Reference Room and copy charges.
12
ITEM 1A. | RISK FACTORS |
You should carefully consider the following risk factors in addition to the other information included in this Form 10-K. These risks and uncertainties may affect our business, financial position, results of operations or cash flows, as well as an investment in our common stock.
Our business depends on the level of activity in the oil and natural gas industry, which is significantly impacted by the volatility in oil and natural gas prices.
Our business depends on the conditions of the offshore oil and natural gas industry. Demand for our services depends on oil and natural gas industry exploration and production activity and expenditure levels, which are directly affected by trends in oil and natural gas prices. Oil and natural gas prices, and market expectations regarding potential changes to these prices, significantly affect oil and natural gas industry activity. Higher oil and natural gas prices do not necessarily translate into increased activity because demand for our services is typically driven by our customers’ expectations of future commodity prices. Oil and natural gas prices have historically been volatile and are impacted by many factors beyond our control, including:
• | the demand for oil and natural gas; |
• | the cost of exploring for, developing, producing and delivering oil and natural gas; |
• | the strength of the global economy; |
• | expectations about future prices; |
• | the ability of The Organization of Petroleum Exporting Countries (“OPEC”) to set and maintain production levels and pricing; |
• | the level of production by OPEC and non-OPEC countries; |
• | domestic and international tax policies; |
• | political and military conflicts in oil producing regions or other geographical areas or acts of terrorism in the U.S. or elsewhere; |
• | technological advances; |
• | the development and exploitation of alternative fuels; |
• | local and international political, economic and weather conditions; and |
• | environmental and other laws and governmental regulations regarding exploration and development of oil and natural gas reserves. |
The level of offshore exploration, development and production activity and the price for oil and natural gas is volatile and is likely to continue to be volatile in the future. A decline in the worldwide demand for oil and natural gas or prolonged low oil or natural gas prices in the future would likely result in reduced exploration and development of offshore areas and a decline in the demand for our services. Even during periods of high oil prices, companies exploring for oil and gas may cancel or curtail programs, or reduce their levels of capital expenditures for exploration and production for a variety of reasons. These factors could cause our revenues and margins to decline, reduce day rates and utilization of our rigs and limit our future growth prospects and, therefore, could have a material adverse effect on our financial position, results of operations and cash flows.
Our industry is subject to intense price competition and volatility.
The contract drilling business is highly competitive with numerous industry participants. Drilling contracts are traditionally awarded on a competitive bid basis. Price competition is often the primary factor in determining which qualified contractor is awarded a job, although rig availability, the quality and technical capability of service and equipment and safety record are also factors. We compete with a number of offshore drilling contractors, many of which are substantially larger than we are and which possess appreciably greater financial and other resources and assets than we do.
The industry in which we operate historically has been volatile, marked by periods of low demand, excess rig supply and low day rates, followed by periods of high demand, low rig availability and increasing day rates. Periods of excess rig supply intensify the competition in the industry and often result in rigs being idled. We may be required to idle additional rigs or to enter into lower-rate contracts in response to market conditions in the future. Presently, there are numerous recently constructed ultra-deepwater vessels and high-specification jackups that have entered the market and more are under contract for construction. Many of these units do not have drilling contracts in place. The entry into service of these new units has increased and will continue to increase rig supply and could curtail a strengthening, or trigger a reduction, in day rates and utilization as rigs are absorbed into the active fleet. The deepwater market has recently seen a decrease in marketed utilization which may lead to lower day rates in the future. Any further increases in construction of new units may increase the negative impact on day rates and utilization. In addition, rigs
13
may be relocated to markets in which we operate, which could result in or exacerbate excess rig supply which may lower day rates in those markets.
Lower utilization and day rates in one or more of the regions in which we operate would adversely affect our revenues and profitability. Prolonged periods of low utilization and day rates could also result in the recognition of impairment charges on certain of our drilling rigs if future cash flow estimates, based upon information available to management at the time, indicate that the carrying value of these rigs may not be recoverable.
Our business relies heavily on a limited number of customers and a limited number of drilling units and the loss of a significant customer, the loss of a rig, significant downtime for our rigs, or the inability of our customers to perform could materially and adversely impact our business.
Our customer base includes a small number of major and independent oil and gas companies as well as government-owned oil companies. In fiscal year 2014, four customers each accounted for over 10% of our operating revenues: Apache Energy Ltd. - 18%, Shell Offshore Inc. - 15%, Chevron Australia Pty. Ltd. - 15% and Noble Energy Inc. - 14%. The contract drilling business is subject to the usual risks associated with having a limited number of customers for our services. Further, consolidation among oil and natural gas exploration and production companies may reduce the number of available customers. Our business and results of operations could be materially and adversely affected if any of our major customers terminate their contracts with us, fail to renew our existing contracts, refuse to award new contracts to us or experience difficulties in obtaining financing to fund their drilling programs. In addition, we currently have only 13 drilling units, of which only 12 are currently in operation and actively marketed. As a result, if any one or more of our drilling units were idled for a prolonged period of time or if a customer were unable to perform due to liquidity or solvency issues, our business and results of operations could be materially and adversely affected.
High levels of capital expenditures will be necessary to keep pace with the bifurcation of the drilling fleet.
The market for our services is characterized by continual and rapid technological developments that have resulted in, and will likely continue to result in, substantial improvements in the functionality and performance of rigs and equipment. Our customers are increasingly demanding the services of newer, higher specification drilling rigs. This results in a bifurcation of the drilling fleet for both the jackup and floater rig classes and is evidenced by the higher specification drilling rigs generally operating at higher overall utilization levels and day rates than the lower specification or standard drilling rigs. In addition, a significant number of lower specification rigs are being stacked. As a result of this bifurcation, a high level of capital expenditures will be required to maintain and improve existing rigs and equipment and purchase and construct newer, higher specification drilling rigs to meet the increasingly sophisticated needs of our customers.
If we are not successful in acquiring or building new rigs and equipment or upgrading our existing rigs and equipment in a timely and cost-effective manner, we could lose market share. In addition, current competitors or new market entrants may develop new technologies, services or standards that could render some of our services or equipment obsolete, which could have a material adverse effect on our operations.
Rig upgrade, repair and construction projects are subject to risks, including delays, cost overruns, and failure to secure drilling contracts.
As of November 1, 2014, there were 72 ultra-deepwater drillships and semisubmersibles under construction for delivery through calendar year 2020 and 142 newbuild jackup rigs under construction with expected delivery dates through calendar year 2017. As a result, shipyards and third-party equipment vendors are under significant resource constraints to meet delivery obligations. Such constraints may lead to delivery and commissioning delays and/or equipment failures and/or quality deficiencies. Furthermore, new drilling rigs may face start-up or other operational complications following completion of construction work or other unexpected difficulties including equipment failures, design or engineering problems that could result in significant downtime at reduced or zero day rates or the cancellation or termination of drilling contracts.
As of November 1, 2014, we had two ultra-deepwater drillships under construction. Both of our drillships currently under construction do not have long-term drilling contracts in place. We may also commence the construction of additional rigs for our fleet from time to time without first obtaining drilling contracts covering any such rig. Our failure to secure drilling contracts for rigs under construction, including our remaining uncontracted newbuild drillships, prior to delivery from the shipyard could adversely affect our financial position, results of operations or cash flows.
Since 2010, we have invested or committed to invest over $4.5 billion in the expansion of our fleet, including ultra-deepwater and jackup rigs. Depending on available opportunities, we may construct additional rigs for our fleet in the future. In addition, we incur significant upgrade, refurbishment and repair expenditures on our fleet from time to time. Some of these expenditures are
14
unplanned. These projects are subject to risks of delay or cost overruns inherent in any large construction project resulting from numerous factors, including the following:
• | shortages of equipment, materials or skilled labor; |
• | unscheduled delays in the delivery of ordered materials and equipment and failure of third-party equipment to meet quality and/or performance standards; |
• | unanticipated actual or purported change orders; |
• | unanticipated increases in the cost of equipment, labor and raw materials, particularly steel; |
• | damage to shipyard facilities or construction work in progress or delays in construction, resulting from fire, explosion, flooding, severe weather, terrorism, war or other armed hostilities; |
• | difficulties in obtaining necessary permits or in meeting permit conditions; |
• | design and engineering problems; |
• | client acceptance delays; |
• | political, social and economic instability, war and civil disturbances; |
• | delays in customs clearance of critical parts or equipment; |
• | financial or other difficulties or failures at shipyards and suppliers; |
• | claims of force majeure events; |
• | disputes with shipyards and suppliers; |
• | work stoppages and other labor disputes; and |
• | foreign currency exchange rate fluctuations impacting overall cost. |
Both of our rigs currently under construction are located at a single shipyard and any such events that affect the shipyard may impact all of our rigs under construction. Delays in the delivery of rigs being constructed or undergoing upgrade, refurbishment or repair may result in delay in contract commencement, resulting in a loss of revenue to us and may cause our customers to seek to terminate or shorten the terms of their contract under applicable late delivery clauses, if any. In the event of termination of one of these contracts, we may not be able to secure a replacement contract on as favorable terms, if at all. The estimated capital expenditures for rig upgrades, refurbishments and construction projects could materially exceed our planned capital expenditures. Moreover, our rigs undergoing upgrade, refurbishment and repair may not earn a day rate during the period they are out-of-service.
Our business may experience reduced profitability if our customers terminate or seek to renegotiate our drilling contracts.
Currently, our contracts with customers are day rate contracts, in which we charge a fixed amount per day regardless of the number of days needed to drill the well. During depressed market conditions, a customer may no longer need a rig that is currently under contract or may be able to obtain a comparable rig at a lower day rate. Customers may seek to renegotiate the terms of their existing drilling contracts or avoid their obligations under those contracts. In addition, certain of our contracts may be canceled upon specified notice at the option of the customer upon payment of an early termination fee, which is typically a majority of the full operating rate over the remainder of the contract term. Contracts also customarily provide for either automatic termination or termination at the option of the customer in the event of total loss of the drilling rig, if a rig is not delivered to the customer, if a rig does not pass acceptance testing within the period specified in the contract, if drilling operations are suspended for extended periods of time by reason of excessive rig downtime for repairs, or other specified conditions, including force majeure or failure to meet minimum performance criteria. Early termination of a contract may result in a rig being idle for an extended period of time. Our revenues may be adversely affected by customers’ early termination of contracts, especially if we are unable to re-contract the affected rig within a short period of time. The termination or renegotiation of a number of our drilling contracts could adversely affect our financial position, results of operations and cash flows.
Our business will be adversely affected if we are unable to secure contracts on economically favorable terms.
The drilling markets in which we compete frequently experience significant fluctuations in the demand for drilling services, as measured by the level of exploration and development expenditures, and the supply of capable drilling equipment. We have two contracts that will expire during fiscal year 2015 with no immediate follow-on work currently scheduled. Our ability to renew these contracts or obtain new contracts and the terms of any such contracts will depend on market conditions. We may be unable to renew our expiring contracts or obtain new contracts for the rigs under contracts that have expired or been terminated, and the day rates under any new contracts may be substantially below the existing day rates, which could materially reduce our revenues and profitability. We can, as we have done in the past, relocate drilling rigs from one geographic area to another, but only when such moves are economically justified, or we can idle rigs temporarily to save operating expenses and reduce rig supply. If demand
15
for our rigs declines, rig utilization and day rates are generally adversely affected, which in turn, would adversely affect our revenues.
Our current backlog of contract drilling revenue may not be ultimately realized.
As of September 30, 2014, our contract drilling backlog was approximately $3.0 billion for future revenues under firm commitments. We may not be able to perform under these contracts due to events beyond our control, and our customers may seek to cancel or renegotiate our contracts for various reasons, including those described above. In addition, some of our customers could experience liquidity or solvency issues or could otherwise be unable or unwilling to perform under the contract, which could ultimately lead a customer to go into bankruptcy or to otherwise encourage a customer to seek to repudiate, cancel or renegotiate a contract. Our inability or the inability of our customers to perform under our or their contractual obligations may have a material adverse effect on our financial position, results of operations or cash flows.
Our customers may be unable or unwilling to indemnify us.
Consistent with standard industry practice, we typically obtain contractual indemnification from our customers whereby they agree to protect and indemnify us for liabilities resulting from various hazards associated with the drilling industry, including liabilities resulting from pollution or contamination originating below the surface of the water. Enforcement of these contractual rights to indemnification may be limited by public policy or applicable law and, in any event, may not adequately cover our losses from such incidents. We can provide no assurance, however, that our customers will be willing or financially able to meet these indemnification obligations. Also, we may choose not to enforce these indemnities because of business reasons.
Operating hazards increase our risk of liability; we may not be able to fully insure against all of these risks.
Our operations are subject to various operating hazards and risks, including:
• | well blowouts, loss of well control and reservoir damage; |
• | fires and explosions; |
• | catastrophic marine disaster; |
• | adverse sea and weather conditions; |
• | mechanical failure; |
• | navigation errors; |
• | collision; |
• | oil and hazardous substance spills, containment and clean up; |
• | lost or stuck drill strings; |
• | equipment defects; |
• | security breaches of our information systems or other technological failures; |
• | labor shortages and strikes; |
• | damage to and loss of drilling rigs and production facilities; and |
• | war, sabotage, terrorism and piracy. |
These risks present a threat to the safety of personnel and to our rigs, cargo, equipment under tow and other property, as well as the environment. Our operations and those of others could be suspended as a result of these hazards, whether the fault is ours or that of a third party. In certain circumstances, governmental authorities may suspend drilling operations as a result of these hazards, and our customers may cancel or terminate their contracts. Third parties may have significant claims against us for damages due to personal injury, death, property damage, pollution and loss of business if such event were to occur in our operations.
Our offshore drilling operations are also subject to marine hazards, either at offshore sites or while drilling equipment is under tow, such as vessel capsizings, sinkings, collisions or groundings. In addition, raising and lowering jackup drilling rigs, flooding semisubmersible ballast tanks and drilling into high-pressure formations are complex, hazardous activities, and we can encounter problems.
We have had accidents in the past due to some of the hazards described above. Because of the ongoing hazards associated with our operations:
• | we may experience accidents; |
• | our insurance coverage may prove inadequate to cover our losses; |
• | our insurance deductibles may increase; or |
16
• | our insurance premiums may increase to the point where maintaining our current level of coverage is prohibitively expensive or we may be unable to obtain insurance at all. |
We maintain insurance coverage against casualty and liability risks and have renewed our primary insurance program through June 30, 2015. Certain risks, however, such as pollution, reservoir damage and environmental risks generally are not fully insurable. Although we believe our insurance is adequate, our policies and contractual indemnity rights may not adequately cover all losses or may have exclusions of coverage for certain losses. We do not have insurance coverage or rights to indemnity for all risks. In addition, we may be unable to renew or maintain our existing insurance coverage at commercially reasonable rates or at all. If a significant accident or other event occurs and is not fully covered by insurance or contractual indemnity, it could adversely affect our financial position, results of operations or cash flows. There is no assurance that our insurance coverage will be available or affordable and, if available, whether it will be adequate to cover future claims that may arise. Additionally, there is no assurance that those parties with contractual obligations to indemnify us will necessarily be financially able or willing to indemnify us against all these risks.
The U.S. Gulf of Mexico experiences hurricanes and other extreme weather conditions on a relatively frequent basis. In recent years, hurricanes have caused damage to a number of rigs in the U.S. Gulf of Mexico. As a result, insurance companies have reduced the nature and amount of insurance coverage available for losses arising from named windstorm damage in the U.S. Gulf of Mexico and have increased the costs of such coverage. Our current windstorm insurance policy for the Atwood Condor and Atwood Advantage has a policy limit of $150 million and a per occurrence deductible of $10 million. Our limited windstorm insurance coverage exposes us to a significant level of risk if the Atwood Condor or Atwood Advantage were to experience significant damage or loss related to severe weather conditions caused by hurricanes or tropical storms in the U.S. Gulf of Mexico.
Our drilling contracts provide for varying levels of indemnification from our customers and in most cases may require us to indemnify our customers. Under offshore drilling contracts, liability with respect to personnel and property is customarily assigned on a “knock-for-knock” basis, which means that we and our customers assume liability for our respective personnel and property. However, in certain cases we may have liability for damage to our customer’s property and other third-party property on the rig. Our customers typically assume responsibility for and indemnify us from any loss or liability resulting from pollution or contamination, including clean-up and removal and third-party damages, arising from operations under the contract and originating below the surface of the water, including as a result of blow-outs or cratering of the well. In some drilling contracts, however, we may have liability for third-party damages resulting from such pollution or contamination caused by our gross negligence, or, in some cases, ordinary negligence, subject to negotiated caps. We generally indemnify the customer for legal and financial consequences of spills of industrial waste and other liquids originating from our rigs or equipment above the surface of the water.
The above description of our insurance program and the indemnification provisions of our drilling contracts is only a summary and is general in nature. Our insurance program and the terms of our drilling contracts may change in the future. In addition, the indemnification provisions of our drilling contracts may be subject to differing interpretations, and enforcement of those provisions may be limited by public policy and other considerations.
Drilling contracts with national oil companies may expose us to greater risks than we normally assume in drilling contracts with non-governmental customers.
Contracts with national oil companies are often non-negotiable and may expose us to greater commercial, political and operational risks than we assume in other contracts, such as exposure to materially greater environmental liability and other claims for damages (including consequential damages) and personal injury related to our operations, or the risk that the contract may be terminated by our customer without cause on short-term notice, contractually or by governmental action, under certain conditions that may not provide us an early termination payment, collection risks and political risks. In addition, our ability to resolve disputes or enforce contractual provisions may be negatively impacted with these contracts. While we believe that the financial, commercial and risk allocation terms of these contracts and our operating safeguards mitigate these risks, we can provide no assurance that the increased risk exposure will not have an adverse impact on our future operations or that we will not increase the number of rigs contracted to national oil companies with commensurate additional contractual risks.
Our long-term contracts are subject to the risk of cost increases, which could adversely impact our profitability.
In periods of rising demand for offshore rigs, a drilling contractor generally would prefer to enter into well-to-well or other short-term contracts less than one year in duration that would allow the contractor to profit from increasing day rates, while customers with reasonably definite drilling programs would typically prefer long-term contracts in order to maintain day rates at a consistent level. Conversely, in periods of decreasing demand for offshore rigs, a drilling contractor generally would prefer long-term contracts to preserve day rates and utilization, while customers generally would prefer well-to-well or other short-term contracts that would allow the customer to benefit from the decreasing day rates. For the fiscal year ended September 30, 2014, a majority of our revenue was derived from long-term day rate contracts greater than one year in duration, and substantially all
17
of our backlog as of September 30, 2014 was attributable to long-term day rate contracts. As a result, our inability to fully benefit from increasing day rates in an improving market may limit our profitability.
In general, our costs increase as the business environment for drilling services improves and demand for oilfield equipment and skilled labor increases. While many of our contracts include cost escalation provisions that allow changes to our day rate based on stipulated cost increases or decreases, the timing and amount earned from these day rate adjustments may differ from our actual increase in costs. Additionally, if our rigs incur idle time between contracts, we typically do not remove personnel from those rigs because we utilize the crew to prepare the rig for its next contract. During times of reduced activity, reductions in costs may not be immediate as portions of the crew may be required to prepare our rigs for stacking, after which time the crew members are assigned to active rigs or dismissed. Moreover, as our rigs are mobilized from one geographic location to another, the labor and other operating and maintenance costs can vary significantly. In general, labor costs increase primarily due to higher salary levels and inflation. Equipment maintenance expenses fluctuate depending upon the type of activity the unit is performing and the age and condition of the equipment. Contract preparation expenses vary based on the scope and length of contract preparation required and the duration of the firm contractual period over which such expenditures are amortized.
A change in tax laws in any country in which we operate could result in higher tax expense.
We conduct our worldwide operations through various subsidiaries. Tax laws and regulations are highly complex and subject to interpretation. Consequently, we are subject to changing tax laws, treaties and regulations in and between countries in which we operate. Our income tax expense is based on our interpretation of the tax laws in effect at the time the expense was incurred. Tax legislation is proposed from time to time which could, among other things, limit our ability to defer the taxation of non-U.S. income and would increase current tax expense. A change in tax laws, treaties or regulations, or in the interpretation thereof, could result in a materially higher tax expense or a higher effective tax rate on our worldwide earnings.
We file periodic tax returns that are subject to review and audit by various revenue agencies in the jurisdictions in which we operate. Taxing authorities may challenge any of our tax positions. We are currently contesting tax assessments that could have a material impact on our financial statements and we may contest future assessments where we believe the assessments are in error. Determinations by such authorities that differ materially from our recorded estimates, favorably or unfavorably, may have a material impact on our financial position, results of operations or cash flows.
Government regulation and environmental risks could reduce our business opportunities and increase our costs.
We must comply with extensive government regulation in the form of international conventions, federal, state and local laws and regulations in jurisdictions where our vessels operate and are registered. These conventions, laws and regulations govern oil spills, including oil spill prevention, and matters of environmental protection, worker health and safety, and the manning, construction and operation of vessels, and vessel and port security. We believe that we are in material compliance with all applicable environmental, health and safety and vessel and port security laws and regulations as currently in effect. We are not a party to any pending governmental litigation or similar proceeding, and we are not aware of any threatened governmental litigation or proceeding which, if adversely determined, would have a material adverse effect on our financial position, results of operations or cash flows. However, failure to comply with these laws and regulations or the occurrence of an incident such as an oil spill may result in the assessment of administrative, civil and even criminal penalties, the imposition of remedial obligations and other damages, the denial or revocation of permits or other authorizations and the issuance of injunctions that may limit or prohibit our operations or afford our customers the right to terminate or seek to renegotiate their drilling contracts to our detriment. Some of these laws and regulations impose strict and, with limited exceptions, joint and several liability. In addition, compliance with environmental, health and safety and vessel and port security laws increases our costs of doing business. Further, the offshore drilling industry depends on demand for services from the oil and natural gas exploration, development and production industry, and, accordingly, we also are directly affected by the adoption of laws and regulations that, for economic, environmental or other policy reasons, curtail exploration and development drilling for oil and natural gas.
Environmental, health and safety and vessel and port security laws change frequently, and we may not be able to anticipate such changes or the impact of such changes. There is no assurance that we can avoid significant costs, liabilities and penalties imposed as a result of governmental regulation in the future. Changes in laws or regulations regarding offshore oil and gas exploration, development and production activities, the cost or availability of insurance, and decisions by customers, governmental agencies or other industry participants could reduce demand for our services or increase our costs of operations, which could have a negative impact on our financial position, results of operations or cash flows, but we cannot reasonably or reliably estimate that such changes will occur, when they will occur or if they will impact us. Such changes can occur quickly within a region, similar to the increases in regulatory requirements in the U.S. Gulf of Mexico following the Macondo well incident in April 2010, which may impact both the affected region and global utilization and day rates and we may not be able to respond quickly, or at all, to mitigate such changes.
18
Failure to comply with the U.S. Foreign Corrupt Practices Act or foreign anti-bribery legislation could have an adverse impact on our business.
The U.S. Foreign Corrupt Practices Act (“FCPA”) and similar anti-bribery laws in other jurisdictions, including the United Kingdom Bribery Act 2010, generally prohibit companies and their intermediaries from making improper payments to foreign officials for the purpose of obtaining or retaining business. We operate in many parts of the world that have experienced governmental corruption to some degree and, in certain circumstances, strict compliance with anti-bribery laws may conflict with local customs and practices and impact our business. Although we have programs in place covering compliance with anti-bribery legislation, any failure to comply with the FCPA or other anti-bribery legislation could subject us to civil and criminal penalties or other sanctions, which could have a material adverse effect on our business, financial position, results of operations or cash flows. We could also face fines, sanctions and other penalties from authorities in the relevant foreign jurisdictions, including prohibition of our participating in or curtailment of business operations in those jurisdictions and the seizure of rigs or other assets.
Our international operations may involve risks not generally associated with domestic operations.
We derive a significant portion of our revenues from operations outside the United States. Our operations are subject to risks inherent in conducting business internationally, such as:
• | legal and governmental regulatory requirements; |
• | difficulties and costs of staffing and managing international operations; |
• | political, social and economic instability; |
• | terrorist acts, piracy, kidnapping, extortion, war and civil disturbances; |
• | language and cultural difficulties; |
• | potential vessel seizure, expropriation or nationalization of assets or confiscatory taxation; |
• | import-export quotas or other trade barriers; |
• | renegotiation, nullification or modification of existing contracts; |
• | difficulties in collecting accounts receivable and longer collection periods; |
• | foreign and domestic monetary policies; |
• | work stoppages; |
• | complications associated with repairing and replacing equipment in remote locations; |
• | limitations on insurance coverage, such as war risk coverage, in certain areas; |
• | wage and price controls; |
• | assaults on property or personnel, including kidnappings; |
• | travel limitations or operational problems caused by public health issues, epidemics or security threats; |
• | imposition of currency exchange controls; |
• | solicitation by governmental officials for improper payments or other forms of corruption; |
• | currency exchange fluctuations and devaluations; or, |
• | potentially adverse tax consequences, including those due to changes in laws or interpretation of existing laws. |
Our non-U.S. operations are subject to various laws and regulations in certain countries in which we operate, including laws and regulations relating to the import and export, equipment and operation of drilling units, currency conversions and repatriation, oil and gas exploration and development, and taxation of offshore earnings and earnings of expatriate personnel. Governments in some foreign countries have become increasingly active in regulating and controlling the ownership of concessions and companies holding concessions, the exploration for oil and gas and other aspects of the oil and gas industries in their countries, including local content requirements for participating in tenders for certain drilling contracts. Many governments favor or effectively require the awarding of drilling contracts to local contractors or require foreign contractors to employ citizens of, or purchase supplies from, a particular jurisdiction. In addition, government action, including initiatives by OPEC, may continue to cause oil or gas price volatility. In some areas of the world, this governmental activity has adversely affected the amount of exploration and development work by major oil companies and may continue to do so. Operations in less developed countries can be subject to legal systems which are not as mature or predictable as those in more developed countries, which can lead to greater uncertainty in legal matters and proceedings.
Some of our drilling contracts are partially payable in local currency. Those amounts may exceed our local currency needs, leading to the accumulation of excess local currency, which, in certain instances, may be subject to either temporary blocking or other difficulties converting to U.S. dollars. Excess amounts of local currency may be exposed to the risk of currency exchange losses.
19
The shipment of goods, services and technology across international borders subjects us to extensive trade and other laws and regulations. Our import and export activities are governed by unique customs laws and regulations in each of the countries where we operate. Moreover, many countries, including the U.S., control the import and export of certain goods, services and technology and impose related import and export recordkeeping and reporting obligations, the laws and regulations related to which are complex and constantly changing. These laws and regulations may be enacted, amended, enforced or interpreted in a manner materially impacting our operations. Shipments may be delayed and denied import or export for a variety of reasons, some of which are outside our control and such delays or denials could cause unscheduled operational downtime. Any failure to comply with these applicable legal and regulatory obligations also could result in criminal and civil penalties and sanctions, such as fines, imprisonment, debarment from government contracts, seizure of shipments and loss of import and export privileges.
In the past, these conditions or events have not materially affected our operations. However, we cannot predict whether any such conditions or events might develop in the future. Also, we organized our subsidiary structure and our operations, in part, based on certain assumptions about various foreign and domestic tax laws, currency exchange requirements and capital repatriation laws. While we believe our assumptions are correct, there can be no assurance that taxing or other authorities will reach the same conclusion. If our assumptions are incorrect, or if the relevant countries change or modify such laws or the current interpretation of such laws, we may suffer adverse tax and financial consequences, including the reduction of cash flow available to meet required debt service and other obligations. Any of these factors could materially adversely affect our international operations and, consequently, our business, financial position, results of operations or cash flows.
Our information technology systems are subject to cybersecurity risks and threats.
We depend on information technology systems to conduct our operations, including critical systems on our drilling units, and these systems are subject to risks associated with cyber incidents or attacks. Due to the nature of cyber attacks, breaches to our systems could go unnoticed for a prolonged period of time. These cybersecurity risks could disrupt our operations and result in downtime, loss of revenue or the loss of critical data as well as result in higher costs to correct and remedy the effects of such incidents. If our systems for protecting against cyber incidents or attacks prove to be insufficient and an incident were to occur, it could have a material adverse effect on our business, financial condition, results of operations or cash flows. Insurance for losses related to cybersecurity attacks is an emerging insurance product and we do not carry insurance for losses due to cybersecurity attacks.
Our business is subject to war, sabotage, terrorism and piracy, which could have an adverse effect.
It is unclear what impact the current U.S. military campaigns or possible future campaigns will have on the energy industry in general, or us in particular, in the future. Uncertainty surrounding retaliatory military strikes or a sustained military campaign may affect our operations in unpredictable ways, including changes in the insurance markets, disruptions of fuel supplies and markets, particularly oil, and the possibility that infrastructure facilities, including pipelines, production facilities, refineries, electric generation, transmission and distribution facilities, could be direct targets of, or indirect casualties of, an act of terror. War or risk of war may also have an adverse effect on the economy.
Acts of war, sabotage, terrorism, piracy and social unrest, brought about by world political events or otherwise, have caused instability in the world’s financial and insurance markets in the past and may continue to do so in the future. Such acts could be directed against companies such as ours and could also adversely affect the oil, gas and power industries and restrict their future growth. Insurance premiums could increase and coverage may be unavailable in the future.
Failure to obtain and retain key personnel could impede our operations.
We depend to a significant extent upon the efforts and abilities of our executive officers and other key management personnel. There is no assurance that these individuals will continue in such capacity for any particular period of time. The loss of the services of one or more of our executive officers or other personnel could adversely affect our operations.
We require highly skilled personnel to operate our drilling rigs and provide technical services and support for our business worldwide. Historically, competition for the labor required for drilling operations and construction projects, has intensified as the number of rigs activated, added to worldwide fleets or under construction increased, leading to shortages of qualified personnel in the industry and creating upward pressure on wages and higher turnover. We may experience increased competition for the crews necessary to operate our rigs. If increased competition for labor were to intensify in the future, we may experience increases in costs or reductions in experience levels which could impact operations. The shortages of qualified personnel or the inability to obtain and retain qualified personnel could also negatively affect the quality, safety and timeliness of our work.
20
Significant part or equipment shortages, supplier capacity constraints, supplier production disruptions, supplier quality and sourcing issues or price increases could increase our operating costs, decrease our revenues and adversely impact our operations.
Our operations rely on a significant supply of capital and consumable spare parts and equipment to maintain and repair our fleet. We also rely on the supply of ancillary services, including supply boats and helicopters. Certain high specification parts and equipment we use in our operations may be available only from a small number of suppliers, manufacturers or service providers, or in some cases must be sourced through a single supplier, manufacturer or service provider. A disruption in the deliveries from such third-party suppliers, manufacturers or service providers, capacity constraints, production disruptions, price increases, quality control issues, recalls or other decreased availability of parts and equipment could adversely affect our ability to meet our commitments to customers, adversely impact our operations and revenues, delay our rig upgrade, repair or construction projects, or increase our operating costs.
Unionization efforts and labor regulations in certain countries in which we operate could materially increase our costs or limit our flexibility.
Certain of our employees and contractors in international markets are represented by labor unions and work under collective bargaining or similar agreements, which are subject to periodic renegotiation. Efforts may be made from time to time to unionize portions of our workforce. In addition, we may in the future be subject to strikes or work stoppages and other labor disruptions. Additional unionization efforts, new collective bargaining agreements or work stoppages could materially increase our costs, reduce our revenues or limit our flexibility.
Climate change legislation or regulations restricting emissions of greenhouse gases could result in increased operating costs and reduced demand for the oil and natural gas we produce.
There is a concern that emissions of greenhouse gases (“GHG”) may alter the composition of the global atmosphere in ways that affect the global climate. Climate change, including the impact of global warming, may create physical and financial risk. Physical risks from climate change include an increase in sea level and changes in weather conditions. Given the maritime nature of our business, we do not believe that physical climate change is likely to have a material adverse effect on us. Financial risks relating to climate change are likely to arise from increasing legislation and regulation, as compliance with any new rules could be difficult and costly.
U.S. federal legislation has been proposed in Congress to reduce GHG emissions, but to date efforts to pass federal legislation limiting GHG emissions have not been successful, though it is possible that such legislation may be enacted in the U.S. in the future. In addition, the EPA has undertaken new efforts to collect information regarding GHG emissions and their effects. EPA adopted rules requiring the reporting of GHG emissions from specified large GHG emission sources in the U.S. on an annual basis, as well as certain onshore and offshore oil and natural gas production facilities on an annual basis. The EPA also has begun adopting and implementing regulations to restrict emissions of GHGs under existing provisions of the federal Clean Air Act, one of which requires a reduction in emissions of GHGs from motor vehicles and the other of which established a permitting requirement for emissions of GHGs from certain large stationary sources. Foreign jurisdictions are also addressing climate changes by legislation or regulation. The adoption of legislation and regulatory programs to reduce emissions of GHGs could require us to incur increased energy, environmental and other costs and capital expenditures to comply. Consequently, legislation and regulatory programs to reduce emissions of GHGs could have an adverse effect on our business, financial position, results of operations or cash flows.
Adverse impacts upon the oil and gas industry relating to climate change may also affect us as demand for our services depends on the level of activity in offshore oil and natural gas exploration, development and production. Although we do not expect that demand for oil and gas will lessen dramatically over the short term, concerns about climate change may reduce the demand for oil and gas in the long term. In addition, increased regulation of GHG may create greater incentives for use of alternative energy sources. Any long term material adverse effect on the oil and gas industry may have a material adverse effect on our financial position, results of operations or cash flows, but we cannot reasonably or reliably estimate if it will occur, when it will occur or that it will impact us.
We are subject to the anti-takeover provisions of our constitutive documents and Texas law.
Holders of the shares of an acquisition target often receive a premium for their shares upon a change of control. Texas law and provisions of constitutive documents could have the effect of delaying or preventing a change of control and could prevent holders of our common stock from receiving such a premium. For example, Texas law prohibits us from engaging in a business combination with any shareholder for three years from the date that person became an affiliated shareholder by beneficially owning 20% or more of our outstanding common stock, in the absence of certain board of director or shareholder approvals.
21
In addition, under our By-laws, special meetings of shareholders may not be called by anyone other than our Board of Directors, the Chairman of the Board of Directors, our President and Chief Executive Officer, or the holders of at least 10% of the shares of our capital stock entitled to vote at such meeting.
Covenants in our debt agreements restrict our ability to engage in certain activities.
Our debt agreements restrict our ability to, among other things:
• | incur, assume or guarantee additional indebtedness or issue certain stock; |
• | pay dividends or distributions or redeem, repurchase or retire our capital stock or subordinated debt; |
• | make loans and other types of investments; |
• | incur liens; |
• | restrict dividends, loans or asset transfers from our subsidiaries; |
• | sell or otherwise dispose of assets, including capital stock of subsidiaries; |
• | consolidate or merge with or into, or sell substantially all of our assets to, another person; |
• | acquire assets or businesses; |
• | enter into transactions with affiliates; and |
• | enter into new lines of business. |
In addition, our revolving credit facility contains various financial covenants that impose a maximum leverage ratio of 4.0 to 1.0, a debt to capitalization ratio of 0.5 to 1.0, a minimum interest expense coverage ratio of 3.0 to 1.0 and a minimum collateral maintenance of 150% of the aggregate amount outstanding under the Credit Facility. Our ability to meet these covenants or requirements may be affected by events beyond our control, and there can be no assurance that we will satisfy such covenants and requirements in the future. Such restrictions may limit our ability to successfully execute our business plans, which may have adverse consequences on our operations.
We may not be able to generate sufficient cash to service all of our indebtedness, and may be forced to take other actions to satisfy our obligations under our indebtedness, which may not be successful.
Our ability to make scheduled payments on or to refinance our debt obligations depends on our financial position, results of operations and cash flows, which is subject to prevailing economic and competitive conditions and to certain financial, business and other factors beyond our control. We may not be able to maintain a level of cash flows from operating activities sufficient to permit us to pay the principal, premium, if any, and interest on our indebtedness.
If our cash flows and capital resources are insufficient to fund our debt service obligations, we may be forced to reduce or delay investment decisions and capital expenditures, or to sell assets, seek additional capital or restructure or refinance our indebtedness. Our ability to restructure or refinance our debt will depend on the condition of the capital markets and our financial position at such time. Any refinancing of our debt could be at higher interest rates and may require us to comply with more onerous covenants, which could further restrict our business operations. The terms of existing or future debt instruments may restrict us from adopting some of these alternatives. In addition, any failure to make payments of interest and principal on our outstanding indebtedness on a timely basis would likely result in a reduction of our credit rating, which could harm our ability to incur additional indebtedness. In the absence of such operating results and resources, we could face substantial liquidity problems and might be required to dispose of material assets or operations to meet our debt service and other obligations. Our existing debt agreements restrict our ability to dispose of assets and use the proceeds from the disposition. We may not be able to consummate those dispositions or to obtain the proceeds that we could realize from them and these proceeds may not be adequate to meet any debt service obligations then due. These alternative measures may not be successful and may not permit us to meet our scheduled debt service obligations. If we breach our covenants under our senior secured revolving credit facility and seek a waiver, we may not be able to obtain a waiver from the required lenders. If this occurs, we would be in default under our senior secured revolving credit facility, the lenders could exercise their rights and we could be forced into bankruptcy or liquidation. See “Management's Discussion and Analysis of Financial Condition and Results of Operations-Liquidity and Capital Resources-Revolving Credit Facility.”
22
ITEM 1B. | UNRESOLVED STAFF COMMENTS |
None.
ITEM 2. | PROPERTIES |
Our property consists primarily of mobile offshore drilling rigs and ancillary equipment. Nine (Atwood Aurora, Atwood Beacon, Atwood Condor, Atwood Eagle, Atwood Falcon, Atwood Hunter, Atwood Mako, Atwood Manta and Atwood Osprey) of our rigs are pledged under our senior secured revolving credit facility. See “Management’s Discussion and Analysis of Financial Condition and Results of Operations—Liquidity and Capital Resources—Revolving Credit Facility” in Item 7 of this Form 10-K.
We lease our office at our corporate headquarters in the United States and own or lease support offices in Australia, Malaysia, Singapore, the United Arab Emirates and the United Kingdom.
We incorporate by reference in response to this item the information set forth in Item 1, Item 7 and Note 3 to our Consolidated Financial Statements in this Form 10-K.
ITEM 3. | LEGAL PROCEEDINGS |
We have certain actions, claims and other matters pending as discussed and reported in Notes to Consolidated Financial Statements included in Item 8 of this Form 10-K. As of September 30, 2014, we were also involved in a number of lawsuits which have arisen in the ordinary course of business and for which we do not expect the liability, if any, resulting from these lawsuits to have a material adverse effect on our current consolidated financial position, results of operations or cash flows. We cannot predict with certainty the outcome or effect of any of these matters described above or any such other proceeding or threatened litigation or legal proceedings. There can be no assurance that our beliefs or expectations as to the outcome or effect of any lawsuit or other matters will prove correct and the eventual outcome of these matters could materially differ from management’s current estimates.
ITEM 4. | MINE SAFETY DISCLOSURE |
Not applicable.
23
PART II
ITEM 5. | MARKET FOR THE REGISTRANT’S COMMON EQUITY, RELATED STOCKHOLDER MATTERS AND ISSUER PURCHASES OF EQUITY SECURITIES |
Our common stock is traded on the New York Stock Exchange under the symbol “ATW”. As of November 5, 2014, there were approximately 71 record owners of our common stock. Our board of directors has declared a quarterly cash dividend of $0.25 per share of common stock, payable on January 13, 2015 to shareholders of record on January 6, 2015. We have not paid cash dividends historically. On November 5, 2014, the closing price of our shares as reported by the NYSE was $37.55 per share. The declaration of future dividends is at the discretion of our board of directors and subject to our financial condition, results of operations, cash flows and other factors and restrictions under applicable law and our debt instruments.
The following table sets forth the range of high and low sales prices per share of common stock as reported by the NYSE for the periods indicated.
Fiscal 2014 | Fiscal 2013 | ||||||||||||||
Quarters Ended | Low | High | Low | High | |||||||||||
December 31 | $ | 50.29 | $ | 58.46 | $ | 43.21 | $ | 50.18 | |||||||
March 31 | 44.88 | 53.54 | 46.18 | 55.49 | |||||||||||
June 30 | 45.33 | 53.90 | 43.91 | 56.71 | |||||||||||
September 30 | 42.55 | 53.00 | 51.84 | 59.49 | |||||||||||
Under our long-term incentive plans, employees may elect to have us withhold shares to satisfy minimum statutory federal, state and local tax withholding obligations arising from the vesting of restricted stock awards and exercise of stock options. When we withhold these shares, we are required to remit to the appropriate taxing authorities the market price of the shares withheld, which could be deemed a purchase of shares by us on the date of withholding. During the quarter ended September 30, 2014, we withheld the following shares to satisfy tax withholding obligations:
Period | No. of Shares | Average Price | |||||
July 1 - July 31, 2014 | 508 | $ | 53.00 | ||||
August 1 - August 31, 2014 | 4,587 | 48.82 | |||||
September 1 - September 30, 2014 | — | — | |||||
Total | 5,095 | $ | 49.23 | ||||
Information concerning securities authorized for issuance under equity compensation plans is incorporated by reference from our definitive Proxy Statement for the 2015 Annual Meeting of Shareholders, to be filed with the SEC not later than 120 days after the end of the fiscal year covered by this Form 10-K.
24
Performance Graph
Below is a comparison of five-year cumulative total returns among Atwood Oceanics, Inc. and the center for research in security prices ("CRSP") index for the NYSE/AMEX/NASDAQ stock markets, and our self-determined peer group of drilling companies. Total returns assume that $100 was invested in each on September 30, 2009, dividends, if any, were reinvested and a September 30 fiscal year end.
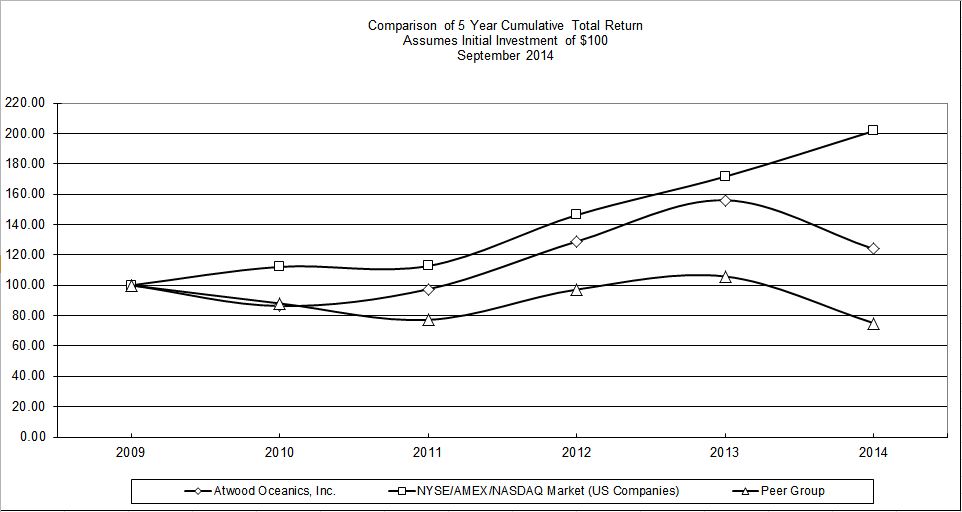
Fiscal Year Ended September 30, | |||||||||||||||||
CRSP Total Returns Index for: | 2009 | 2010 | 2011 | 2012 | 2013 | 2014 | |||||||||||
Atwood Oceanics, Inc. | 100.0 | 86.3 | 97.4 | 128.9 | 156.1 | 123.9 | |||||||||||
NYSE/AMEX/Nasdaq Stock Markets (U.S. Companies) | 100.0 | 112.1 | 112.7 | 146.3 | 171.6 | 201.6 | |||||||||||
Self-determined Peer Group | 100.0 | 88.1 | 77.2 | 97.2 | 105.8 | 75.1 | |||||||||||
Our self-determined peer group (weighted according to market capitalization) is as follows: Diamond Offshore Drilling, Inc., Ensco plc, Noble Corporation, Rowan Companies plc, Seadrill Limited and Transocean Ltd.
The performance graph above is furnished and not filed for purposes of Section 18 of the Securities Exchange Act of 1934 and will not be incorporated by reference into any registration statement filed under the Securities Act of 1933 unless specifically identified therein as being incorporated therein by reference. The performance graph is not soliciting material subject to Regulation 14A.
25
ITEM 6. | SELECTED FINANCIAL DATA |
Selected financial data for each of the last five fiscal years is presented below:
At or For the Years Ended September 30, | ||||||||||||||||||||
(In thousands, except per share amounts, fleet data and ratios) | 2014 | 2013 | 2012 | 2011 | 2010 | |||||||||||||||
STATEMENTS OF OPERATIONS DATA: | ||||||||||||||||||||
Total revenues | $ | 1,173,953 | $ | 1,063,663 | $ | 787,421 | $ | 645,076 | $ | 650,562 | ||||||||||
Contract drilling costs and reimbursable expenses | (562,353 | ) | (458,925 | ) | (347,179 | ) | (223,565 | ) | (252,427 | ) | ||||||||||
Depreciation | (147,358 | ) | (117,510 | ) | (70,599 | ) | (43,597 | ) | (37,030 | ) | ||||||||||
General and administrative | (61,461 | ) | (56,786 | ) | (49,776 | ) | (44,407 | ) | (40,620 | ) | ||||||||||
Gain (loss) on sale of equipment | 34,139 | (971 | ) | (457 | ) | 153 | 485 | |||||||||||||
Other, net | 1,864 | — | — | (5,000 | ) | 1,370 | ||||||||||||||
Operating income | 438,784 | 429,471 | 319,410 | 328,660 | 322,340 | |||||||||||||||
Other (expense) income | (41,491 | ) | (24,670 | ) | (6,106 | ) | (3,813 | ) | (2,361 | ) | ||||||||||
Tax provision | (56,471 | ) | (54,577 | ) | (41,133 | ) | (53,173 | ) | (62,983 | ) | ||||||||||
Net Income | $ | 340,822 | $ | 350,224 | $ | 272,171 | $ | 271,674 | $ | 256,996 | ||||||||||
PER SHARE DATA: | ||||||||||||||||||||
Earnings per common share: | ||||||||||||||||||||
Basic | $ | 5.31 | $ | 5.38 | $ | 4.17 | $ | 4.20 | $ | 3.99 | ||||||||||
Diluted | $ | 5.24 | $ | 5.32 | $ | 4.14 | $ | 4.15 | $ | 3.95 | ||||||||||
Average common shares outstanding: | ||||||||||||||||||||
Basic | 64,240 | 65,073 | 65,267 | 64,754 | 64,391 | |||||||||||||||
Diluted | 65,074 | 65,845 | 65,781 | 65,403 | 65,028 | |||||||||||||||
FLEET DATA: | ||||||||||||||||||||
Rig count (at end of period) | ||||||||||||||||||||
All rigs | 13 | 13 | 11 | 10 | 9 | |||||||||||||||
In-service rigs (1) | 12 | 11 | 9 | 7 | 9 | |||||||||||||||
Utilization rate - full (2) | ||||||||||||||||||||
All rigs | 83 | % | 83 | % | 75 | % | 61 | % | 87 | % | ||||||||||
In-service rigs (1) | 94 | % | 100 | % | 96 | % | 91 | % | 87 | % | ||||||||||
Utilization rate - available (3) | ||||||||||||||||||||
All rigs | 85 | % | 84 | % | 78 | % | 63 | % | 88 | % | ||||||||||
In-service rigs (1) | 97 | % | 100 | % | 100 | % | 95 | % | 88 | % | ||||||||||
BALANCE SHEET DATA: | ||||||||||||||||||||
Cash | $ | 80,080 | $ | 88,770 | $ | 77,871 | $ | 295,002 | $ | 180,523 | ||||||||||
Working capital | 330,430 | 296,888 | 232,887 | 301,608 | 266,534 | |||||||||||||||
Property and equipment, net | 3,967,028 | 3,164,724 | 2,537,340 | 1,887,321 | 1,343,961 | |||||||||||||||
Total assets | 4,507,228 | 3,657,266 | 2,943,762 | 2,375,391 | 1,724,440 | |||||||||||||||
Total debt | 1,742,122 | 1,263,232 | 830,000 | 520,000 | 230,000 | |||||||||||||||
Shareholders' equity (4) | 2,555,524 | 2,207,371 | 1,939,422 | 1,652,787 | 1,370,134 | |||||||||||||||
Ratio of current assets to current liabilities | 2.97 | 2.89 | 2.69 | 2.89 | 3.85 | |||||||||||||||
26
(1) | In-service rigs exclude idled rigs which are not actively marketed. See "Management's Discussion and Analysis of Financial Condition and Results of Operations-Market Outlook" for further discussion of idled rigs. During fiscal year 2014, there were approximately three months of planned out of service time related to the Atwood Hunter. |
(2) | Full utilization rate is calculated by dividing the actual number of days a rig was under contract during the year by 365 days. |
(3) | Available utilization rate is calculated by dividing the actual number of days a rig was under contract during the period by the number of days a rig was available to be under contract during the period, which excludes out of service time for planned shipyard projects between contracts. |
(4) | Our board of directors has declared a quarterly cash dividend of $0.25 per share of common stock, payable on January 13, 2015 to shareholders of record on January 6, 2015. Historically we have not paid dividends. |
27
ITEM 7. | MANAGEMENT’S DISCUSSION AND ANALYSIS OF FINANCIAL CONDITION AND RESULTS OF OPERATIONS |
The following discussion is intended to assist in understanding our financial position at September 30, 2014 and 2013 and our results of operations for each of the fiscal years for the three year period ended September 30, 2014 and should be read in conjunction with the accompanying consolidated financial statements and related notes in Item 8 of this Form 10-K. The following discussion and analysis contains forward-looking statements that involve risks and uncertainties. Our actual results may differ materially from those anticipated in these forward-looking statements as a result of certain factors, including those set forth under Item 1A “Risk Factors” and elsewhere in this Form 10-K. See “Forward-Looking Statements”.
OVERVIEW
Financial and operating results for the fiscal year ended September 30, 2014, include:
• | Record operating revenues totaling $1.17 billion on 3,839 operating days as compared to operating revenues of $1.06 billion on 3,718 operating days for the fiscal year ended September 30, 2013; |
• | Net income of $341 million as compared to net income of $350 million for the fiscal year ended September 30, 2013; |
• | Diluted earnings per share of $5.24 as compared to diluted earnings per share of $5.32 for the fiscal year ended September 30, 2013; |
• | Net cash provided by operating activities of $443 million as compared to net cash provided by operating activities of $432 million for the fiscal year ended September 30, 2013; |
• | Debt to capitalization ratio of 41% at September 30, 2014. |
MARKET OUTLOOK
Industry Conditions
The level of activity in the offshore drilling industry, which affects the drilling sector’s profitability, is cyclical and highly dependent on the capital expenditure spending patterns of exploration and production (“E&P”) companies. E&P company capital expenditure budgets are influenced by the price of oil and gas, company-specific cash flow levels, historical project returns and other capital allocation strategies. After a multi-year increase in E&P spending on drilling programs, we are witnessing a significant slowdown in E&P spending in 2014. This slowdown is a result of several influencing factors, including the lack of recent exploration success, an inability to generate investment returns beyond their cost of capital and shareholder demands to restrain E&P spending in favor of greater dividends. The result of the slowdown has been a delay or cancellation of previously anticipated floater-based drilling programs, leading to a material reduction in new drilling contract awards for floaters in 2014, as compared to recent years. In addition, the rapid increase in U.S. unconventional oil production, weaker global oil demand growth expectations and a stronger dollar has resulted in a steep decline in oil prices since mid-2014. Further decreases in oil prices, or anticipated decreases in oil prices, may lead to further reductions in capital expenditures by E&P companies on drilling programs, which in turn could adversely affect our financial position, results of operations or cash flows.
The supply and demand balance between floating drilling rigs and suitable drilling contracts is being further eroded as drilling companies continue to take delivery of newer, more capable floaters which were ordered earlier in the cycle. As a result, a lower percentage of marketed floaters are being re-contracted, especially among the older, less capable floaters and lower day rates are being contracted across all classes of floaters. Customers continue to prefer newer, high specification floaters over the older, less capable rigs, especially for drilling programs with a high degree of technical complexity or operating in more remote geological basins. This bifurcation of utilization and day rates across different generations of floaters has been especially detrimental to the older, less capable floaters resulting in rigs being idled or scrapped.
Similar to the floater market, the jackup market is now beginning to experience an unfavorable supply and demand imbalance due to the delivery of newbuild jackups from shipyards. Certain markets, especially in Southeast Asia, which is closer to the shipyards constructing the majority of newbuild jackups, are particularly susceptible to oversupply and to lower utilization and day rates. While high specification jackup rigs continue to experience higher levels of utilization and day rates than less capable jackup rigs, the risk of further market weakness created by the supply and demand imbalance is expected to continue through 2015 given the high number of newbuild jackups scheduled for delivery during this period.
28
The slower growth in capital expenditures by E&P companies, the current level of offshore drilling activity, together with the large backlog of rigs under construction, has continued to create capacity constraints in the global offshore rig equipment supply chain. As a result, equipment delivery lead times have lengthened and remain challenging, thus leading to delayed newbuild rig deliveries.
Ultra-deepwater and Deepwater Rig Markets
Industry-wide, the percentage of marketed ultra-deepwater rigs under contract decreased to 94%, while the percentage of marketed deepwater rigs under contract reduced slightly to 88%. As of November 1, 2014, 72 ultra-deepwater floaters were under construction with scheduled for deliveries through January 2020. Forty-seven of these newbuild ultra-deepwater floaters were contracted, including 29 under long-term contracts with Petrobras that are primarily being constructed in shipyards located in Brazil. The number of new ultra-deepwater rig deliveries peaks in 2015 with 24 scheduled to be delivered in 2015. An additional 41 units are scheduled for delivery in 2016 and beyond. As of November 1, 2014, two of the 7 newbuild rigs scheduled to be delivered in 2014 were uncontracted and 14 of the 24 scheduled to be delivered in 2015 were uncontracted. With 84% of ultra-deepwater rigs operating in deepwater and mid-water water depths (i.e., well below their maximum water depths), demand for deepwater rigs and older, less capable ultra-deepwater rigs may be negatively impacted by the increased supply of newer ultra-deepwater rigs. This may result in the older, less capable rigs having to price more aggressively to avoid displacement by the newer, more capable rigs, leading to generally lower day rates for the ultra-deepwater and deepwater rig markets.
Our Ultra-deepwater and Deepwater Rigs
The Atwood Achiever, a dynamically positioned, ultra-deepwater drillship, is currently mobilizing to its first location offshore Northwest Africa and is contracted through approximately December 2017.
The Atwood Advantage, a dynamically positioned, ultra-deepwater drillship, is operating in the U.S. Gulf of Mexico and is contracted through April 2017. The rig arrived in the U.S. Gulf of Mexico in early March 2014 and commenced drilling operations in late April 2014.
The Atwood Condor, a dynamically-positioned, ultra-deepwater semisubmersible, is operating in the U.S. Gulf of Mexico and is contracted through November 2016. The Atwood Osprey, an ultra-deepwater semisubmersible, is operating offshore Australia and is contracted through May 2017.
The Atwood Eagle and Atwood Falcon, both deepwater semisubmersibles, are operating offshore Australia and are contracted through August 2016 and March 2016, respectively. The Atwood Hunter, a deepwater semisubmersible, is currently operating in Equatorial Guinea and is contracted through mid-November 2014.
The Atwood Admiral and Atwood Archer are DP-3 dynamically-positioned, dual derrick, ultra-deepwater drillships rated to operate in water depths up to 12,000 feet, and are currently under construction at the Daewoo Shipbuilding and Marine Engineering Co., Ltd. (“DSME”) shipyard in South Korea. These drillships will have enhanced technical capabilities, including two seven-ram BOPs, three 100-ton knuckle boom cranes, a 165-ton active heave “tree-running” knuckle boom crane and 200 person accommodations. Total cost, including project management, drilling and handling tools and spares, is approximately $635 million per drillship.
The Atwood Admiral and Atwood Archer were scheduled to be delivered in March 2015 and December 2015, respectively. Due to lack of suitable drilling programs, we have not secured the initial drilling contracts for these rigs. Therefore, we have entered into amendments to our construction contracts with DSME to delay the delivery of these two rigs by six months each. The Atwood Admiral is now scheduled for delivery on September 30, 2015 and the Atwood Archer on June 30, 2016.
Jackup Rig Market
Bifurcation in day rates and utilization between high specification jackups and standard jackups continues to characterize contracting activity in the jackup market. We expect this bifurcation trend to become more pronounced in the future. As a result of newbuild jackup construction programs initiated in 2005 and continuing through 2014, the jackup supply continues to increase. As of November 1, 2014, there were 142 newbuild jackup rigs under construction. Thirteen jack-ups are scheduled for delivery in 2014 and only three of these were contracted as of November 1, 2014. The remaining 129 rigs are scheduled for delivery in 2015 through 2017. This increase in the marketed supply of jackups, most of which are high specification, may exceed customer demand leading to lower day rates for jackup rigs of all classes in the future.
29
The percentage of marketed high specification jackup rigs (i.e., rigs equal to or greater than 350-foot water depth capability) under contract is approximately 98% as compared to 87% for the remainder of the global jackup fleet. Despite the expected increase in global jackup supply due to the continued delivery of high specification newbuild rigs through the end of 2017, we expect demand for high specification jackup rigs to remain elevated as operators continue to prefer contracting newer, more capable rigs for their drilling programs.
Our High-Specification Jackup Rigs
The Atwood Mako, the Atwood Manta and the Atwood Orca, all 400-foot water depth Pacific Class jackups, are operating offshore Thailand and are contracted through November 2014, December 2015 and February 2016, respectively. The Atwood Aurora, a 350-foot water depth jackup, is operating offshore West Africa and is contracted through September 2016. The Atwood Beacon, a 400-foot water depth jackup, is operating in the Mediterranean Sea and is contracted into January 2016.
Idled Rigs
During April 2014, we completed the sale of our subsidiary which owned our semisubmersible tender assist drilling rig, the Seahawk. We anticipate that our remaining idled rig, the Atwood Southern Cross, a mid-water floater, will not return to service during fiscal year 2015 due to the lack of sufficient continuous demand, and thus, we are not actively marketing the rig at this time.
Contract Backlog
We maintain a backlog of commitments for contract drilling revenues. Our contract backlog at September 30, 2014 was approximately $3.0 billion, representing a 21% decrease compared to our contract backlog of $3.8 billion at September 30, 2013. We calculate our contract backlog by multiplying the day rate under our drilling contracts by the number of days remaining under the contract, assuming full utilization. The calculation does not include any revenues related to other fees such as for mobilization, demobilization, contract preparation, customer reimbursables and bonuses. The amount of actual revenues earned and the actual periods during which revenues are earned will be different from amounts disclosed in our backlog calculations due to a lack of predictability of various factors, including newbuild rig delivery dates, unscheduled repairs, maintenance requirements, weather delays and other factors. Such factors may result in lower applicable day rates than the full contractual day rate. In addition, under certain circumstances, our customers may seek to terminate or renegotiate our contracts. See Item 1A., “Risk Factors—Our business may experience reduced profitability if our customers terminate or seek to renegotiate our drilling contracts” of this Form 10-K.
The following tables set forth as of September 30, 2014, the amount of our contract drilling revenue backlog and the percent of available operating days committed for our actively-marketed drilling units for the periods indicated:
Contract Drilling Revenue Backlog | Fiscal 2015 | Fiscal 2016 | Fiscal 2017 | Fiscal 2018 | Fiscal 2019 and thereafter | Total | |||||||||||||||||
(In millions) | |||||||||||||||||||||||
Ultra-deepwater | $ | 819 | $ | 808 | $ | 458 | $ | 22 | $ | — | $ | 2,107 | |||||||||||
Deepwater | 338 | 226 | — | — | — | 564 | |||||||||||||||||
Jackups | 250 | 103 | — | — | — | 353 | |||||||||||||||||
$ | 1,407 | $ | 1,137 | $ | 458 | $ | 22 | $ | — | $ | 3,024 | ||||||||||||
Percentage of Available Operating Days Committed | Fiscal 2015 | Fiscal 2016 | Fiscal 2017 | Fiscal 2018 | Fiscal 2019 and thereafter | |||||||||
(In millions) | ||||||||||||||
Ultra-deepwater | 100 | % | 76 | % | 38 | % | 2 | % | — | % | ||||
Deepwater | 71 | % | 46 | % | — | % | — | % | — | % | ||||
Jackups | 83 | % | 34 | % | — | % | — | % | — | % | ||||
85 | % | 54 | % | 16 | % | 1 | % | — | % | |||||
30
RESULTS OF OPERATIONS
Fiscal Year 2014 versus Fiscal Year 2013
Revenues—Revenues for fiscal year 2014 increased $110 million, or 10%, compared to the prior fiscal year. Fiscal year 2014 included 3,839 operating days versus 3,718 operating days in fiscal year 2013. A comparative analysis of revenues for fiscal years 2014 and 2013 is as follows:
REVENUES | |||||||||||
(In millions) | Fiscal Year 2014 | Fiscal Year 2013 | Variance | ||||||||
Ultra-Deepwater | $ | 462 | $ | 335 | $ | 127 | |||||
Deepwater | 333 | 415 | (82 | ) | |||||||
Jackups | 308 | 268 | 40 | ||||||||
Reimbursable | 71 | 46 | 25 | ||||||||
$ | 1,174 | $ | 1,064 | $ | 110 | ||||||
Our ultra-deepwater fleet realized average revenues of $440,000 per day on 1,050 operating days, as compared to $460,000 per day on 730 operating days in fiscal year 2014 and 2013, respectively. The increase in operating days in fiscal year 2014 is largely due to the Atwood Achiever and Atwood Advantage, our "A-Class" ultra-deepwater drillships, being delivered and commencing mobilization under their initial drilling contracts to Northwest Africa in September 2014 and to the U.S. Gulf of Mexico in December 2013, respectively. The average revenue per operating day for our ultra-deepwater fleet decreased in fiscal year 2014 as compared to fiscal year 2013, primarily due to approximately 48 zero-rate days incurred by the Atwood Advantage in the third quarter of fiscal year 2014 related to start-up activities and approximately 21 zero-rate days incurred by the Atwood Condor in the fourth quarter of fiscal year 2014 related to subsea equipment issues.
Our deepwater fleet realized average revenues of $390,000 per day on 860 operating days, as compared to $385,000 per day on 1,078 operating days in fiscal years 2014 and 2013, respectively. The decrease in operating days in fiscal year 2014 is primarily due to the Atwood Hunter undergoing a regulatory and maintenance project from December 2013 through the end of April 2014. The rig was then idle until August, when it recommenced operations in West Africa. Additionally, our deepwater fleet realized higher average revenue per operating day for fiscal year 2014, as compared to fiscal year 2013, primarily due to the Atwood Eagle and the Atwood Falcon incurring less downtime for equipment repairs during fiscal year 2014, as compared to fiscal year 2013.
Our jackup fleet realized average revenues of $160,000 per day on 1,929 operating days, as compared to $140,000 per day on 1,910 operating days in fiscal years 2014 and 2013, respectively. The increase in operating days in fiscal year 2014 is due to a full twelve months of operations for the newly constructed, high specification jackup, the Atwood Manta, which was delivered from the shipyard in December 2012, as well as nine months of operations for the Atwood Orca, partially offset by the loss in operating days due to the sale of the Vicksburg. Overall, the jackup fleet realized higher average revenue per operating day in fiscal year 2014, as compared to fiscal year 2013 due primarily to higher average day rates realized by two of our initial high specification jackups, the Atwood Aurora and the Atwood Beacon, and a greater proportionate mix of our three newly constructed high specification jackups at higher day rates, partially offset by the sale of the Vicksburg.
Reimbursable revenues are primarily driven by our clients' requests for equipment, services and/or personnel that are not typically included in the contractual operating day rate. Thus, these revenues vary depending on the timing of the clients' requests and the work performed. Changes in the amount of these reimbursable revenues generally do not have a material effect on our financial position, results of operations or cash flows.
31
Drilling Costs—Drilling costs for fiscal year 2014 increased $103 million, or 23%, compared to the prior fiscal year. Fiscal year 2014 included 3,839 operating days versus 3,718 operating days in fiscal year 2013. A comparative analysis of drilling costs for fiscal years 2014 and 2013 is as follows:
DRILLING COSTS | |||||||||||
(In millions) | Fiscal Year 2014 | Fiscal Year 2013 | Variance | ||||||||
Ultra-Deepwater | $ | 167 | $ | 127 | $ | 40 | |||||
Deepwater | 201 | 168 | 33 | ||||||||
Jackups | 132 | 124 | 8 | ||||||||
Reimbursable | 56 | 33 | 23 | ||||||||
Other | 6 | 7 | (1 | ) | |||||||
$ | 562 | $ | 459 | $ | 103 | ||||||
Ultra-deepwater drilling costs per calendar day remained relatively stable at approximately $170,000 in fiscal year 2014 and 2013. The increase in operating days in fiscal year 2014 is largely due to the Atwood Achiever and Atwood Advantage, our "A-Class" ultra-deepwater drillships, being delivered and commencing mobilization under their initial drilling contracts to Northwest Africa in September 2014 and to the U.S. Gulf of Mexico in December 2013, respectively.
Deepwater drilling costs increased in fiscal year 2014, as compared to fiscal year 2013, due to maintenance projects and regulatory inspections. Average drilling costs per calendar day for our deepwater rigs increased from approximately $155,000 for fiscal year 2013 to approximately $185,000 in fiscal year 2014 mainly due to the Atwood Hunter undergoing a regulatory and maintenance project from December 2013 through the end of April 2014 and the Atwood Falcon undergoing regulatory inspections and planned maintenance in December 2013. These increases were partially offset by decreased average drilling costs per calendar day for the Atwood Eagle in fiscal year 2014, as compared to fiscal year 2013, due to regulatory inspections, planned maintenance, and upgrades that took place in December 2012.
Jackup drilling costs per calendar day increased from approximately $65,000 for fiscal year 2013 to approximately $70,000 for fiscal year 2014, as a result of full-year operations for the newly constructed Atwood Orca and Atwood Manta. The increase is also due to the Atwood Aurora undergoing regulatory inspections and planned maintenance in March 2014 and higher personnel costs on the Atwood Beacon.
Reimbursable costs are primarily driven by our clients' requests for equipment, services and/or personnel that are not typically included in the contractual operating day rate. Thus, these costs vary depending on the timing of the clients' requests and the work performed. Changes in the amount of these reimbursable costs generally do not have a material effect on our financial position, results of operations or cash flows.
32
Depreciation—Depreciation expense for the fiscal year 2014 increased $29 million, or 25%, compared to the prior fiscal year. A comparative analysis of depreciation expense for fiscal years 2014 and 2013 is as follows:
DEPRECIATION EXPENSE | |||||||||||
(In millions) | Fiscal Year 2014 | Fiscal Year 2013 | Variance | ||||||||
Ultra-Deepwater | $ | 84 | $ | 59 | $ | 25 | |||||
Deepwater | 21 | 21 | — | ||||||||
Jackups | 37 | 32 | 5 | ||||||||
Other | 5 | 6 | (1 | ) | |||||||
$ | 147 | $ | 118 | $ | 29 | ||||||
Ultra-deepwater depreciation increased by $25 million for fiscal year 2014, as compared to fiscal year 2013, due to the delivery of the Atwood Achiever and Atwood Advantage which were placed into service in September 2014 and December 2013, respectively.
Jackup depreciation increased by $5 million for fiscal year 2014 as compared to 2013 due to the addition of the Atwood Manta and the Atwood Orca, which were placed into service at the beginning of December 2012 and May 2013, respectively.
General and administrative—General and administrative expenses for fiscal year 2014 increased approximately $5 million, or 8%, compared to the prior fiscal year primarily due to higher personnel-related costs, including an increase in headcount to support our larger fleet and higher rental and lease costs related to relocation to the new corporate headquarters office.
Interest Expense, net of capitalized interest—Interest expense, net of capitalized interest for fiscal year 2014 increased approximately $16.9 million, compared to the prior fiscal year primarily due to higher outstanding debt and reduced capitalized interest.
Income taxes—Our effective tax rate was 14% for fiscal year 2014, as compared to fiscal year 2013 effective tax rate of 13%. The higher effective income tax was primarily due to the impact of discrete items in the current year as well as changes in the geographic mix of income.
33
Fiscal Year 2013 versus Fiscal Year 2012
Revenues—Revenues for fiscal year 2013 increased $277 million, or 35%, compared to fiscal year 2012. Fiscal year 2013 included 3,718 operating days versus 2,577 operating days in fiscal year 2012. A comparative analysis of revenues for fiscal years 2013 and 2012 is as follows:
REVENUES | |||||||||||
(In millions) | Fiscal Year 2013 | Fiscal Year 2012 | Variance | ||||||||
Ultra-Deepwater | $ | 335 | $ | 199 | $ | 136 | |||||
Deepwater | 415 | 416 | (1 | ) | |||||||
Jackups | 268 | 140 | 128 | ||||||||
Reimbursable | 46 | 32 | 14 | ||||||||
$ | 1,064 | $ | 787 | $ | 277 | ||||||
In fiscal year 2013, our ultra-deepwater fleet realized average revenues of $460,000 per day on 730 operating days, as compared to $440,000 per day on 457 operating days in fiscal year 2012. The increase in operating days in fiscal year 2013 is largely due to the Atwood Condor being delivered and commencing mobilization to the U.S. Gulf of Mexico in September 2012. The average revenue per operating day for our ultra-deepwater fleet increased in fiscal year 2013 as compared to fiscal year 2012, primarily due to the Atwood Condor operating for the full fiscal year in 2013.
In fiscal year 2013, our deepwater fleet realized average revenues of $385,000 per day on 1,078 operating days, as compared to $415,000 per day on 1,002 operating days in fiscal year 2012. The Atwood Falcon was undergoing a shipyard upgrade project from February 2012 through May 2012 in fiscal year 2012 during which time it incurred 96 days at zero-rate. No such projects were undertaken in fiscal year 2013, resulting in higher operating days in fiscal year 2013, as compared to fiscal year 2012. The average revenue per operating day for our deepwater fleet decreased in fiscal year 2013, as compared to fiscal year 2012, primarily due to the Atwood Hunter operating at a lower day rate contract offshore West Africa in fiscal year 2013, as compared to a higher day rate contract in fiscal year 2012.
In fiscal year 2013, our jackup fleet realized average revenues of $140,000 per day on 1,910 operating days, as compared to $125,000 per day on 1,118 operating days in fiscal year 2012. The increase in operating days in fiscal year 2013 is due primarily to the Atwood Mako, the Atwood Manta and the Atwood Orca being delivered from the shipyard and commencing drilling operations offshore Thailand in September 2012, December 2012 and May 2013. Overall, the jackup fleet realized higher average revenue per operating day in fiscal year 2013, as compared to fiscal year 2012, due primarily to higher average day rates realized by the Atwood Beacon and the Atwood Vicksburg and a greater proportionate mix of our three newly constructed high specification jackups mentioned above at higher day rates.
Reimbursable revenues are primarily driven by our clients' requests for equipment, services and/or personnel that are not typically included in the contractual operating day rate. Thus, these revenues vary depending on the timing of the clients' requests and the work performed. Changes in the amount of these reimbursable revenues generally do not have a material effect on our financial position, results of operations or cash flows.
34
Drilling Costs—Drilling costs for fiscal year 2013 increased $112 million, or 32%, compared to fiscal year 2012. Fiscal year 2013 included 3,718 operating days versus 2,577 operating days in fiscal year 2012. A comparative analysis of drilling costs for fiscal years 2013 and 2012 is as follows:
DRILLING COSTS | |||||||||||
(In millions) | Fiscal Year 2013 | Fiscal Year 2012 | Variance | ||||||||
Ultra-Deepwater | $ | 125 | $ | 76 | $ | 49 | |||||
Deepwater | 168 | 159 | 9 | ||||||||
Jackups | 124 | 86 | 38 | ||||||||
Reimbursable | 33 | 19 | 14 | ||||||||
Other | 9 | 8 | 1 | ||||||||
$ | 459 | $ | 348 | $ | 111 | ||||||
Ultra-deepwater drilling costs per calendar day remained relatively stable at approximately $170,000 in fiscal year 2013 and 2012. The increase in the overall costs for fiscal year 2013 as compared to fiscal year 2012 is due primarily to the Atwood Condor operating for the full fiscal year in 2013 after commencing operations in September 2012.
Deepwater drilling costs per calendar day increased to approximately $155,000 for fiscal year 2013 from approximately $145,000 in fiscal year 2012, mainly due to the Atwood Eagle undergoing regulatory inspections, planned maintenance and upgrades in December 2012 and also due to the Atwood Falcon incurring significantly higher personnel costs working offshore Australia in fiscal year 2013, compared to working offshore Malaysia in fiscal year 2012.
Jackup drilling costs per calendar day decreased to approximately $65,000 for fiscal year 2013, from approximately $75,000 for fiscal year 2012, primarily due to the Atwood Aurora amortization charges relating to mobilization to West Africa recorded in fiscal year 2012 as compared to none in fiscal year 2013, since the rig continued to operate in West Africa. Overall, the Jackup costs increased due to the Atwood Mako, the Atwood Manta and the Atwood Orca being delivered from the shipyard and commencing drilling operations offshore Thailand in September 2012, December 2012 and May 2013 and thus earned little to no drilling costs in fiscal year 2012, while the rigs were predominantly under construction.
Reimbursable costs are primarily driven by our clients' requests for equipment, services and/or personnel that are not typically included in the contractual operating day rate. Thus, these costs vary depending on the timing of the clients' requests and the work performed. Changes in the amount of these reimbursable costs generally do not have a material effect on our financial position, results of operations or cash flows.
35
Depreciation—Depreciation expense for fiscal year 2013 increased $47 million, or 66%, as compared to fiscal year 2012. A comparative analysis of depreciation expense by rig for fiscal years 2013 and 2012 is as follows:
DEPRECIATION EXPENSE | |||||||||||
(In millions) | Fiscal Year 2013 | Fiscal Year 2012 | Variance | ||||||||
Ultra-Deepwater | $ | 59 | $ | 33 | $ | 26 | |||||
Deepwater | 20 | 18 | 2 | ||||||||
Jackups | 33 | 15 | 18 | ||||||||
Other | 6 | 5 | 1 | ||||||||
$ | 118 | $ | 71 | $ | 47 | ||||||
Ultra-deepwater depreciation increased by $26 million for fiscal year 2013, as compared to fiscal year 2012, due to the Atwood Condor being placed into service at the beginning of July 2012 and incurring only three months of depreciation expense while mobilizing in the prior fiscal year 2012.
Jackup depreciation increased by $18 million for fiscal year 2013 as compared to fiscal year 2012 due to the addition of the Atwood Mako, the Atwood Manta and the Atwood Orca, which were placed into service in September 2012, December 2012 and May 2013, respectively, incurring little to no depreciation expense in the prior fiscal year 2012.
General and administrative—General and administrative expenses for fiscal year 2013 increased approximately $7 million, or 14%, compared to the fiscal year 2012, primarily due to higher personnel-related costs, including an increase in headcount, and higher professional fees to support our larger fleet.
Income taxes—Our effective tax rate was 13% for fiscal year 2013, which was consistent with fiscal year 2012.
36
LIQUIDITY AND CAPITAL RESOURCES
Sources of Liquidity
Our sources of available liquidity include existing cash balances on hand, cash flows from operations and borrowings under our revolving credit facility. At September 30, 2014, we had $80 million in cash on hand. At any time, we may require a significant portion of our cash on hand for working capital and other purposes. During the year ended September 30, 2014, we relied principally on our cash flows from operations, cash on hand and borrowings under our credit facility to meet liquidity needs and fund our cash requirements including our capital expenditures of $976 million. To date, general inflationary trends have not had a material effect on our operating revenues or expenses.
Cash Flows
September 30, | |||||||||||
(In millions) | 2014 | 2013 | 2013 | ||||||||
Net cash provided by operating activities | $ | 442,620 | $ | 432,110 | $ | 255,603 | |||||
Net cash used by investing activities | (914,215 | ) | (745,076 | ) | (777,437 | ) | |||||
Net cash provided by financing activities | 462,905 | 323,865 | 304,703 | ||||||||
Working capital increased from $297 million as of September 30, 2013 to $330 million as of September 30, 2014 due to an increase in our accounts receivable and inventory which is attributable to our larger fleet. Net cash from operating activities for the year ended September 30, 2014 was $443 million, which compared to $432 million for the year ended September 30, 2013.
Investing Activities
Capital Expenditures
Our investing activities are primarily related to capital expenditures for property and equipment. Our capital expenditures, including maintenance capital expenditures, for fiscal year 2014 totaled $976 million. As of September 30, 2014, we had expended approximately $320 million on our drilling units under construction at that date. The expected remaining costs including firm commitments, project management, capitalized interest and drilling and handling tools and spares for our drilling units under construction for fiscal years ended September 30, 2015 and 2016 are as follows (in millions):
2015 | $ | 550 | |
2016 | 400 | ||
Total | $ | 950 | |
We believe that we will be able to fund all additional construction costs with cash flow from operations and borrowings under our revolving credit facility.
From time to time, we may seek possible expansion and acquisition opportunities relating to our business, which may include the construction or acquisition of rigs or other businesses in addition to those described in this Form 10-K. Such determinations will depend on market conditions and opportunities existing at that time, including with respect to the market for drilling contracts and day rates and the relative costs associated with such expansions or acquisitions. The timing, success or terms of any such efforts and the associated capital commitments are not currently known. In addition to our sources of liquidity, we may seek to access the capital markets to fund such opportunities. Our ability to access the capital markets depends on a number of factors, including, among others, our credit rating, industry conditions, general economic conditions, market conditions and market perceptions of us and our industry.
Sale of assets
We continually review the possibility of disposing of assets that we do not consider core to our long-term business plan.
In January 2014, we sold our standard jackup drilling unit, the Vicksburg, for a sales price of $55.4 million. The date of sale, the carrying value of the rig and its related inventory was $20.5 million.
In April 2014, we sold a wholly owned subsidiary which owned our semisubmersible tender assist drilling rig, the Seahawk, for a sales price of $4.0 million. The carrying value of the subsidiary, after recording a $2.0 million impairment charge recorded in the second quarter of the current fiscal year, approximated its sales price.
37
Financing Activities
Our financing activities primarily consist of borrowing and repayment of long-term and short-term debt. Proceeds received from issuances of long-term debt and borrowings from our bank credit facilities totaled $700 million for fiscal year 2014, $600 million for fiscal year 2013 and $760 million for fiscal year 2012. Repayments on our bank credit facilities were $220 million for fiscal year 2014, $175 million for fiscal year 2013 and $450 million for fiscal year 2012. We had repayments of short-term debt of $14 million for fiscal year 2014 and proceeds of $3 million for fiscal year 2013 and repayments of $0.3 million for fiscal year 2012. In July 2014, we financed our major insurance policies, which financing arrangement bears an interest rate of 1.57% and is amortized over a period of nine months. We had similar arrangements in fiscal years 2013 and 2012.
During fiscal year 2013, our financing activities included the repurchase and retirement of common shares as discussed below. In addition, we received proceeds from the exercise of stock options of $4 million for fiscal year 2014, $9 million for fiscal year 2013 and $6 million for fiscal year 2012.
Expenses, fees and other costs paid in conjunction with our debt issuances were $7 million for fiscal year 2014, $6 million for fiscal year 2013 and $11 million for fiscal year 2012.
6.50% Senior Notes Due 2020
In January 2012, we issued $450 million of 6.50% fixed-rate Senior Notes due 2020 (the "Senior Notes"). We used the net proceeds to reduce outstanding borrowings under our credit facility. On June 21, 2013, we issued an additional $200 million of Senior Notes and used the net proceeds to reduce outstanding borrowings under our credit facility. The two issuances of Senior Notes together form a single series under the indenture with an aggregate principal amount of $650 million.
The Senior Notes are senior unsecured obligations and are not currently guaranteed by any of our subsidiaries. Interest is payable on the Senior Notes semi-annually in arrears. The indenture governing the Senior Notes contains provisions that limit our ability and the ability of our restricted subsidiaries to incur or guarantee additional indebtedness or issue preferred stock; pay dividends or make other restricted payments; sell assets; make investments; create liens; enter into agreements that restrict dividends or other payments from our restricted subsidiaries to us; and consolidate, merge or transfer all or substantially all of our assets. Many of these restrictions will terminate if the Senior Notes become rated investment grade. The indenture governing the Senior Notes also contains customary events of default, including payment defaults; defaults for failure to comply with other covenants in the indenture; cross-acceleration and entry of final judgments in excess of $50.0 million; and certain events of bankruptcy, in certain cases subject to notice and grace periods. We are required to offer to repurchase the Senior Notes in connection with specified change in control events or with excess proceeds of asset sales not applied for permitted purposes.
At any time prior to February 1, 2015, we may, on any one or more occasions, redeem up to 35% of the aggregate principal amount of the Senior Notes with the net cash proceeds of certain equity offerings at a redemption price set forth in the indenture governing the Senior Notes. At any time prior to February 1, 2016, we may, on any one or more occasions, redeem the Senior Notes in whole or in part at a redemption price equal to 100% of the principal amount of the Senior Notes redeemed plus a “make whole” premium. On and after February 1, 2016, we may, on any one or more occasions, redeem the Senior Notes in whole or in part at the redemption price set forth in the indenture governing the Senior Notes.
Revolving Credit Facility
As of September 30, 2014, we had $1.09 billion of outstanding borrowings and $5.90 million in letters of credit issued under our $1.55 billion senior secured revolving credit facility. On April 10, 2014, we entered into an agreement to amend our revolving credit facility the ("Credit Facility"), which increased the total commitment to $1.55 billion from $1.1 billion and extended its maturity to May 2018 from May 2016. Our wholly-owned subsidiary, Atwood Offshore Worldwide Limited (“AOWL”), is the borrower under the Credit Facility, and we and certain of our other subsidiaries are guarantors under the facility. Subsequent to the end of fiscal year 2014, we have repaid $50 million under the Credit Facility.
Prior to the amendment, borrowings under the Credit Facility bore interest at the Eurodollar rate plus a margin ranging from 2.00% to 2.50% and the commitment on the unused portion of the underlying commitments ranged from 0.5% to 1.0% per annum. Borrowings under the Credit Facility bear interest at the Eurodollar rate plus a margin ranging from 1.75% to 2.00% and the commitment fee on the unused portion of the underlying commitment ranges from 0.30% to 0.40% per annum, each based on our corporate credit ratings.
38
The following summarizes our availability under our Credit Facility at September 30, 2014 (in millions):
Commitment under Facility | $ | 1,550 | |
Borrowings under Facility | (1,085 | ) | |
Letters of Credit Outstanding | (6 | ) | |
Availability | $ | 459 | |
The Credit Facility contains various financial covenants that impose a maximum leverage ratio of 4.0 to 1.0, a debt to capitalization ratio of 0.5 to 1.0, a minimum interest expense coverage ratio of 3.0 to 1.0 and a minimum collateral maintenance of 150% of the aggregate amount outstanding under the Credit Facility. In addition, the Credit Facility contains limitations on our and certain of our subsidiaries' ability to incur liens; merge, consolidate or sell substantially all assets; pay dividends; incur additional indebtedness; make advances, investments or loans; and transact with affiliates. The Credit Facility also contains customary events of default, including but not limited to delinquent payments, bankruptcy filings, material adverse judgments, guarantees or security documents not being in full effect, non-compliance with the Employee Retirement Income Security Act of 1974, cross-defaults under other debt agreements, or a change of control. The Credit Facility is secured primarily by first preferred mortgages on nine of our active drilling units (Atwood Aurora, Atwood Beacon, Atwood Condor, Atwood Eagle, Atwood Falcon, Atwood Hunter, Atwood Mako, Atwood Manta and Atwood Osprey), as well as liens on the equity interests of our subsidiaries that own, directly or indirectly, such drilling units. We were in compliance with all financial covenants under the Credit Facility at September 30, 2014, and we anticipate that we will continue to be in compliance for the next fiscal year.
Repurchase and Retirement of Common Shares
As of September 30, 2014, we did not have an active stock repurchase program. On May 23, 2013, we entered into a stock purchase agreement with Helmerich & Payne International Drilling Co. ("H&P"), a subsidiary of Helmerich & Payne, Inc., under which we agreed to repurchase 2,000,000 shares of our common stock from H&P and to make a payment at closing to H&P of $107.1 million. On June 13, 2013, we and H&P amended the agreement to extend the closing date from June 13, 2013 to June 27, 2013 and to increase the amount to be paid at closing to H&P by $200,000. The share repurchase closed on June 27, 2013. Following the share repurchase, we canceled such shares. H&P is considered a related party due to a member of our board of directors currently serving as Chairman of the Board of Helmerich & Payne, Inc.
Dividends
Our board of directors has declared a quarterly cash dividend of $0.25 per share of common stock, payable on January 13, 2015 to shareholders of record on January 6, 2015. The declaration of future dividends is at the discretion of our board of directors and subject to our financial condition, results of operations, cash flows and other factors and restrictions under applicable law and our debt instruments.
Off-balance Sheet Arrangements
We have no off-balance sheet arrangements as that term is defined in Item 303(a)(4)(ii) of Regulation S-K.
39
Commitments and Contractual Obligations
The following table summarizes our obligations and commitments as of September 30, 2014 for fiscal years ended September 30.
(In thousands) | Fiscal 2015 | Fiscal 2016 and 2017 | Fiscal 2018 and 2019 | Fiscal 2020 and Thereafter | Total | ||||||||||||||
Debt (1) | $ | 11,885 | $ | — | $ | 1,085,000 | $ | 650,000 | $ | 1,746,885 | |||||||||
Interest (2) | 67,518 | 133,118 | 98,872 | 14,083 | 313,591 | ||||||||||||||
Purchase Commitments (3) | 448,030 | 359,493 | — | — | 807,523 | ||||||||||||||
Operating Leases (4) | 3,826 | 5,216 | 4,292 | 9,503 | 22,837 | ||||||||||||||
$ | 531,259 | $ | 497,827 | $ | 1,188,164 | $ | 673,586 | $ | 2,890,836 | ||||||||||
(1) | Debt amounts include principal payments on the Senior Notes and Credit Facility and short-term notes payable. Unamortized premiums on the Senior Notes of $7.1 million are excluded from this presentation as they do represent a future commitment of funds. |
(2) | Interest amounts include fixed interest payments on the Senior Notes and swaps (assuming September 30, 2014 LIBOR for floating rate) as well as interest and commitment fees on the Credit Facility (assuming September 30, 2014 LIBOR for floating rate and the debt outstanding and the unused portion of the underlying commitment as of September 30, 2014). |
(3) | Purchase commitment amounts include commitments related to our two drilling units under construction as of September 30, 2014 (excludes project management, capitalized interest and drilling and handling tools and spares.) |
(4) | We enter into operating leases in the normal course of business. Some lease agreements provide us with the option to renew the leases. Our future operating lease payments would change if we exercised these renewal options and if we entered into additional operating lease agreements. |
CRITICAL ACCOUNTING POLICIES
Significant accounting policies are included in Note 2 to our Consolidated Financial Statements for the year ended September 30, 2014. These policies, along with the underlying assumptions and judgments made by management in their application, have a significant impact on our consolidated financial statements. We identify our most critical accounting policies as those that are the most pervasive and important to the portrayal of our financial position and results of operations, and that require the most difficult, subjective and/or complex judgments by management regarding estimates about matters that are inherently uncertain. Our most critical accounting policies are those related to revenue recognition, deferred fees and costs, property and equipment, and income taxes.
Revenue Recognition
We account for contract drilling revenue in accordance with the terms of the underlying drilling contract. These contracts generally provide that revenue is earned and recognized on a daily rate (i.e. “day rate”) basis, and day rates are typically earned for a particular level of service over the life of a contract assuming collectability is reasonably assured. Day rate contracts can be performed for a specified period of time or the time required to drill a specified well or number of wells. Revenues from day rate contracts for drilling and other operations performed during the term of a contract (including during mobilization) are classified under contract drilling services.
Certain fees received as compensation for relocating drilling rigs from one major operating area to another, equipment and upgrade costs reimbursed by the customer, as well as receipt of advance billings of day rates are deferred and recognized as earned during the expected term of the related drilling contract, as are the day rates associated with such contracts. If receipt of such fees is not conditional, they will be recognized as earned on a straight-line method over the expected term of the related drilling contract. However, fees received upon termination of a drilling contract are generally recognized as earned during the period termination occurs as the termination fee is usually conditional based on the occurrence of an event as defined in the drilling contract, such as not obtaining follow on work to the contract in progress or relocation beyond a certain distance when the contract is completed.
At September 30, 2014 and 2013, deferred fees associated with mobilization, related equipment purchases and upgrades and receipt of advance billings of day rates totaled $7.7 million and $12.0 million, respectively. Deferred fees are classified as current or long-term deferred credits in the accompanying Consolidated Balance Sheets based on the expected term of the applicable drilling contracts.
40
Deferred costs
We defer certain mobilization costs relating to moving a drilling rig to a new area incurred prior to the commencement of the drilling operations and customer requested equipment purchases. We amortize such costs on a straight-line basis over the expected term of the applicable drilling contract. Contract revenues and drilling costs are reported in the Consolidated Statements of Operations at their gross amounts.
Property and Equipment
Property and equipment is stated at cost. At September 30, 2014, the carrying value of our property and equipment totaled approximately $4.0 billion, which represents approximately 88% of our total assets. The carrying value reflects the application of our property and equipment accounting policies, which incorporate estimates, assumptions and judgments by management relative to the useful lives and salvage values of our units. Once rigs and related equipment are placed in service, they are depreciated on the straight-line method over their estimated useful lives, with depreciation discontinued only during the period when a drilling unit is out-of-service while undergoing a significant upgrade that extends its useful life. The estimated useful lives of our drilling units and related equipment, including drill pipe, can range from 3 years to 35 years and our salvage values are generally estimated at 5% of capitalized costs. Any future increases or decreases in our estimates of useful lives or salvage values will have the effect of decreasing or increasing future depreciation expense, respectively.
We evaluate our property and equipment whenever events or changes in circumstances indicate that the carrying amount of an asset may not be recoverable and reduce costs by provisions to recognize economic impairment as necessary. An impairment loss on our property and equipment may exist when the estimated future cash flows are less than the carrying amount of the asset. In determining an asset's fair value, we consider a number of factors such as estimated future cash flows, appraisals and current market value analysis. If an asset is determined to be impaired, the loss is measured by the amount by which the carrying value of the asset exceeds its fair value. Asset impairment evaluations are, by nature, highly subjective. Operations of our drilling equipment are subject to the offshore drilling requirements of oil and gas exploration and production companies and agencies of foreign governments. These requirements are, in turn, subject to fluctuations in government policies, world demand and price for petroleum products, proved reserves in relation to such demand and the extent to which such demand can be met from onshore sources. The critical estimates which result from these dynamics include projected utilization, day rates, and operating expenses, each of which impacts our estimated future cash flows. Over the last five years, our full utilization rate for all rigs has averaged approximately 83%; however, if a drilling unit incurs significant idle time or receives day rates below operating costs, its carrying value could become impaired. See "Item 6: Selected Financial Data" for further discussion on the calculation of full utilization rates.
The estimates, assumptions and judgments used by management in the application of our property and equipment and asset impairment policies reflect both historical experience and expectations regarding future industry conditions and operations. The use of different estimates, assumptions and judgments, especially those involving the useful lives of our rigs and vessels and expectations regarding future industry conditions and operations, would likely result in materially different carrying values of assets and results of operations.
Fair value
We have certain assets and liabilities that are required to be measured and disclosed at fair value. Fair value is defined as the exchange price that would be received for an asset or paid to transfer a liability (an exit price) in the principal or most advantageous market for the asset or liability in an orderly transaction between market participants on the measurement date.
Independent third party services are used to determine the fair value of our financial instruments using quoted market prices and observable inputs. When independent third party services are used, we obtain an understanding of how the fair values are derived and selectively corroborate fair values by reviewing other readily available market based sources of information.
The fair values of our interest rate swaps and our foreign currency forward exchange contracts are based upon valuations calculated by an independent third party. The derivatives were valued according to the "Market approach" where possible, and the "Income approach" otherwise. A third party independently valued each instrument using forward price data obtained from reputable data providers (e.g., Bloomberg and Reuters) and reviewed market activity and similarity of pricing terms to determine appropriate reliability level assertions for each instrument. The contribution of the credit valuation adjustment to total fair value is less than 1% for all derivatives and is therefore not significant.
Income Taxes
We conduct operations and earn income in numerous foreign countries and are subject to the laws of taxing jurisdictions within those countries, as well as U S. federal and state tax laws. At September 30, 2014, we have an approximate $0.2 million
41
net deferred income tax liability. This balance reflects the application of our income tax accounting policies. Such accounting policies incorporate estimates, assumptions and judgments by management relative to the interpretation of applicable tax laws, the application of accounting standards, and future levels of taxable income. The estimates, assumptions and judgments used by management in connection with accounting for income taxes reflect both historical experience and expectations regarding future industry conditions and operations. Changes in these estimates, assumptions and judgments could result in materially different provisions for deferred and current income taxes.
A comprehensive model is used to account for uncertain tax positions, which includes consideration of how we recognize, measure, present and disclose uncertain tax positions taken or to be taken on a tax return. The income tax laws and regulations are voluminous and are often ambiguous. As such, we are required to make many subjective assumptions and judgments regarding our tax positions that can materially affect amounts recognized in our consolidated balance sheets and statements of income.
Our annual tax provision is based on expected taxable income, statutory rates and tax planning opportunities available to us in the various jurisdictions in which we operate. The determination of our annual tax provision and evaluation of our tax positions involves interpretation of tax laws in the various jurisdictions and requires significant judgment and the use of estimates and assumptions regarding significant future events, such as the amount, timing and character of income, deductions and tax credits. Our tax liability in any given year could be affected by changes in tax laws, regulations, agreements, and treaties, currency exchange restrictions or our level of operations or profitability in each jurisdiction. Additionally, we operate in many jurisdictions where the tax laws relating to the offshore drilling industry are not well developed. Although our annual tax provision is based on the best information available at the time, a number of years may elapse before the ultimate tax liabilities in the various jurisdictions are determined.
In several of the locations in which we operate, certain of our wholly-owned subsidiaries enter into agreements with other of our wholly-owned subsidiaries to provide specialized services and equipment in support of our operations. We apply a transfer pricing methodology to determine the amount to be charged for providing the services and equipment, and utilize outside consultants to assist us in the development of such transfer pricing methodologies. In most cases, there are alternative transfer pricing methodologies that could be applied to these transactions and, if applied, could result in different chargeable amounts.
Our international rigs are owned and operated, directly or indirectly, by Atwood Offshore Worldwide Limited ("AOWL"), a Cayman Islands subsidiary which we wholly own. It is our intention to indefinitely reinvest historic and future earnings of AOWL and its foreign subsidiaries to finance operating and capital expenditures as well as pay down borrowings. Accordingly, we have not made a provision for U.S. income taxes on approximately $2.4 billion of undistributed foreign earnings and profits. Although we do not intend to repatriate the earnings of AOWL and have not provided U.S. income taxes for such earnings, except to the extent that such earnings were immediately subject to U.S. income taxes, these earnings could become subject to U.S. income tax if remitted, or if deemed remitted as a dividend. If these earnings were remitted, we estimate approximately $450 million in additional taxes would be incurred.
Recently Issued Accounting Pronouncements
In April 2014, the Financial Accounting Standards Board (“FASB”) issued new guidance intended to change the criteria for reporting discontinued operations while enhancing disclosures for discontinued operations, which changes the criteria and requires additional disclosures for reporting discontinued operations. The guidance is effective for all disposals of components of an entity that occur within annual periods beginning on or after December 15, 2014, and interim periods within annual periods beginning on or after December 15, 2015. We do not expect that our adoption will have a material impact on our financial statements or disclosures in our financial statements.
In May 2014, the FASB issued new guidance intended to change the criteria for recognition of revenue. The core principle of the guidance is that an entity should recognize revenue to depict the transfer of promised goods or services to customers in an amount that reflects the consideration to which the entity expects to be entitled in exchange for those goods or services. To achieve this core principal, an entity should apply the following five steps: (1) Identify contracts with customers, (2) Identify the performance obligations in the contracts, (3) Determine the transaction price, (4) Allocate the transaction price to the performance obligation in the contract, and (5) Recognize revenue as the entity satisfies performance obligations. The amendments in are effective for annual reporting periods beginning after December 15, 2016, including interim periods within that reporting period. Early application is not permitted. We are currently evaluating what impact the adoption of this guidance would have on our financial position, results of operations, cash flows or disclosures.
In June 2014, the FASB issued amended guidance on the accounting for certain share-based employee compensation awards. The amended guidance applies to share-based employee compensation awards that include a performance target that affects vesting when the performance target can be achieved after the requisite service period. These targets are to be treated as a performance condition. As such, the performance target should not be reflected in estimating the grant-date fair value of the award and
42
compensation cost should be recognized in the period in which it becomes probable that the performance target will be achieved. The amendments are effective for annual periods and interim periods within those annual periods beginning after December 15, 2015. We do not expect that our adoption will have a material impact on our financial statements or disclosures in our financial statements.
In August 2014, the FASB issued guidance on disclosures of uncertainties about an entity's ability to continue as a going concern. The guidance requires management's evaluation of whether there are conditions or events that raise substantial doubt about the entity's ability to continue as a going concern within one year after the date that the financial statements are issued. This assessment must be made in connection with preparing financial statements for each annual and interim reporting period. Management's evaluation should be based on the relevant conditions and events that are known and reasonably knowable at the date the financial statements are issued. If conditions or events raise substantial doubt about the entity's ability to continue as a going concern, but this doubt is alleviated by management's plans, the entity should disclose information that enables the reader to understand what the conditions or events are, management's evaluation of those conditions or events and management's plans that alleviate that substantial doubt. If conditions or events raise substantial doubt and the substantial doubt is not alleviated, the entity must disclose this in the footnotes. The entity must also disclose information that enables the reader to understand what the conditions or events are, management's evaluation of those conditions or events and management's plans that are intended to alleviate that substantial doubt. The amendments are effective for annual periods and interim periods within those annual periods beginning after December 15, 2016. We do not expect that our adoption will have a material impact on our financial statements or disclosures in our financial statements.
ITEM 7A. | QUANTITATIVE AND QUALITATIVE DISCLOSURES ABOUT MARKET RISK |
We are exposed to market risk, including adverse changes in interest rates and foreign currency exchange rates as discussed below.
Interest Rate Risk
The provisions of our Credit Facility provide for a variable interest rate cost on our $1.085 billion outstanding as of September 30, 2014. However, we have employed an interest rate risk management strategy that utilizes derivative instruments with respect to $250 million of our debt as of September 30, 2014, in order to minimize or eliminate unanticipated fluctuations in earnings and cash flows arising from changes in, and volatility of, interest rates. Effectively, $835 million of our variable long-term debt outstanding as of September 30, 2014 is subject to changes in interest rates. A change of 10% in the interest rate on the floating rate debt would have an immaterial impact on our annual earnings and cash flows.
Foreign Currency Risk
Our functional currency is the U.S. dollar. Certain of our subsidiaries have monetary assets and liabilities that are denominated in a currency other than our functional currency. The majority of our contracts are denominated in U.S. dollars, but occasionally all or a portion of a contract is payable in local currency. To the extent there is a local currency component in a contract, we attempt to match similar revenue in the local currency to the operating costs paid in the local currency such as local labor, shore base expenses, and local taxes, if any, in order to minimize foreign currency fluctuation impact.
From time to time, we enter into foreign currency forward exchange contracts to limit our exposure to fluctuations and volatility in n currency exchange rates. In December 2013, we entered into foreign currency forward exchange contracts for a portion of our anticipated euro receipts associated with revenues earned on a drilling contract from December 2013 to November 2015. These forward contracts are designated as cash flow hedging instruments. Based on September 30, 2014 amounts, a decrease in the value of 10% in foreign currencies relative to the U.S. dollar would not have a material effect to our annual earnings and cash flows.
Market Risk
Our Senior Notes bear interest at a fixed interest rate. The fair value of our Senior Notes will fluctuate based on changes in prevailing market interest rates and market perceptions of our credit risk. The fair value of our Senior Notes was approximately $666 million at September 30, 2014, compared to the principal amount of $650 million. The fair value of our Senior Notes was approximately $662 million at September 30, 2013. If prevailing market interest rates had been 10% lower at September 30, 2014, the change in fair value of our Senior Notes would not have a material effect to our annual earnings and cash flows.
43
ITEM 8. | FINANCIAL STATEMENTS AND SUPPLEMENTARY DATA |
MANAGEMENT’S REPORT ON INTERNAL CONTROL OVER FINANCIAL REPORTING
Management of Atwood Oceanics, Inc. (which together with its subsidiaries is identified as the “Company,” “we” or “our,” unless stated otherwise or the context requires otherwise) is responsible for establishing and maintaining adequate internal control over financial reporting as defined in Rules 13a-15(f) and 15d-15(f) under the Securities Exchange Act of 1934. Our internal control over financial reporting was designed by management, under the supervision of the Chief Executive Officer and Chief Financial Officer, to provide reasonable assurance regarding the reliability of financial reporting and the preparation of financial statements for external purposes in accordance with accounting principles generally accepted in the United States of America, and includes those policies and procedures that:
(i) | pertain to the maintenance of records that, in reasonable detail, accurately and fairly reflect the transactions and dispositions of the assets of the Company; |
(ii) | provide reasonable assurance that transactions are recorded as necessary to permit preparation of financial statements in accordance with accounting principles generally accepted in the United States of America, and that receipts and expenditures of the Company are being made only in accordance with authorizations of management and directors of the Company; and |
(iii) | provide reasonable assurance regarding prevention or timely detection of unauthorized acquisition, use or disposition of the Company’s assets that could have a material effect on the financial statements. |
Because of its inherent limitations, internal control over financial reporting may not prevent or detect misstatements. Also, projections of any evaluation of effectiveness to future periods are subject to the risk that controls may become inadequate because of changes in conditions, or that the degree of compliance with the policies and procedures may deteriorate.
Management assessed the effectiveness of the Company’s internal control over financial reporting as of September 30, 2014. In making this assessment, management used the criteria set forth by the Committee of Sponsoring Organizations of the Treadway Commission in Internal Control-Integrated Framework (1992).
Based on our evaluation under the criteria in Internal Control-Integrated Framework (1992), management has concluded that the Company maintained effective internal control over financial reporting as of September 30, 2014. PricewaterhouseCoopers LLP, our independent registered public accounting firm, has issued an attestation report on the effectiveness of the Company’s internal control over financial reporting as of September 30, 2014, which appears on the following page.
ATWOOD OCEANICS, INC. | ||
by | ||
/s/ Robert J. Saltiel | /s/ Mark L. Mey | |
Robert J. Saltiel | Mark L. Mey | |
President and | Senior Vice President and | |
Chief Executive Officer | Chief Financial Officer | |
November 13, 2014 | November 13, 2014 | |
44
REPORT OF INDEPENDENT REGISTERED PUBLIC ACCOUNTING FIRM
To the Board of Directors and Shareholders of Atwood Oceanics, Inc.
In our opinion, the accompanying consolidated balance sheets and the related consolidated statements of operations, comprehensive income, cash flows and changes in shareholders’ equity present fairly, in all material respects, the financial position of Atwood Oceanics, Inc. and its subsidiaries at September 30, 2014 and 2013, and the results of their operations and their cash flows for each of the three years in the period ended September 30, 2014 in conformity with accounting principles generally accepted in the United States of America. Also in our opinion, the Company maintained, in all material respects, effective internal control over financial reporting as of September 30, 2014, based on criteria established in Internal Control—Integrated Framework (1992) issued by the Committee of Sponsoring Organizations of the Treadway Commission (COSO). The Company’s management is responsible for these financial statements, for maintaining effective internal control over financial reporting and for its assessment of the effectiveness of internal control over financial reporting, included in the accompanying Management’s Report on Internal Control Over Financial Reporting. Our responsibility is to express opinions on these financial statements and on the Company’s internal control over financial reporting based on our integrated audits. We conducted our audits in accordance with the standards of the Public Company Accounting Oversight Board (United States). Those standards require that we plan and perform the audits to obtain reasonable assurance about whether the financial statements are free of material misstatement and whether effective internal control over financial reporting was maintained in all material respects. Our audits of the financial statements included examining, on a test basis, evidence supporting the amounts and disclosures in the financial statements, assessing the accounting principles used and significant estimates made by management, and evaluating the overall financial statement presentation. Our audit of internal control over financial reporting included obtaining an understanding of internal control over financial reporting, assessing the risk that a material weakness exists, and testing and evaluating the design and operating effectiveness of internal control based on the assessed risk. Our audits also included performing such other procedures as we considered necessary in the circumstances. We believe that our audits provide a reasonable basis for our opinions.
A company’s internal control over financial reporting is a process designed to provide reasonable assurance regarding the reliability of financial reporting and the preparation of financial statements for external purposes in accordance with generally accepted accounting principles. A company’s internal control over financial reporting includes those policies and procedures that (i) pertain to the maintenance of records that, in reasonable detail, accurately and fairly reflect the transactions and dispositions of the assets of the company; (ii) provide reasonable assurance that transactions are recorded as necessary to permit preparation of financial statements in accordance with generally accepted accounting principles, and that receipts and expenditures of the company are being made only in accordance with authorizations of management and directors of the company; and (iii) provide reasonable assurance regarding prevention or timely detection of unauthorized acquisition, use, or disposition of the company’s assets that could have a material effect on the financial statements.
Because of its inherent limitations, internal control over financial reporting may not prevent or detect misstatements. Also, projections of any evaluation of effectiveness to future periods are subject to the risk that controls may become inadequate because of changes in conditions, or that the degree of compliance with the policies or procedures may deteriorate.
/s/ PricewaterhouseCoopers LLP
Houston, Texas
November 13, 2014
45
ATWOOD OCEANICS, INC. AND SUBSIDIARIES
CONSOLIDATED STATEMENTS OF OPERATIONS
Years Ended September 30, | |||||||||||
(In thousands, except per share amounts) | 2014 | 2013 | 2012 | ||||||||
REVENUES: | |||||||||||
Contract drilling | $ | 1,103,397 | $ | 1,017,923 | $ | 755,969 | |||||
Revenues related to reimbursable expenses | 70,556 | 45,740 | 31,452 | ||||||||
Total revenues | 1,173,953 | 1,063,663 | 787,421 | ||||||||
COSTS AND EXPENSES: | |||||||||||
Contract drilling | 506,128 | 426,198 | 328,485 | ||||||||
Reimbursable expenses | 56,225 | 32,727 | 18,694 | ||||||||
Depreciation | 147,358 | 117,510 | 70,599 | ||||||||
General and administrative | 61,461 | 56,786 | 49,776 | ||||||||
(Gain) loss on sale of equipment | (34,139 | ) | 971 | 457 | |||||||
Other, net | (1,864 | ) | — | — | |||||||
735,169 | 634,192 | 468,011 | |||||||||
OPERATING INCOME | $ | 438,784 | $ | 429,471 | $ | 319,410 | |||||
OTHER INCOME (EXPENSE): | |||||||||||
Interest expense, net of capitalized interest | (41,803 | ) | (24,903 | ) | (6,460 | ) | |||||
Interest income | 312 | 233 | 354 | ||||||||
(41,491 | ) | (24,670 | ) | (6,106 | ) | ||||||
INCOME BEFORE INCOME TAXES | 397,293 | 404,801 | 313,304 | ||||||||
PROVISION FOR INCOME TAXES | 56,471 | 54,577 | 41,133 | ||||||||
NET INCOME | $ | 340,822 | $ | 350,224 | $ | 272,171 | |||||
EARNINGS PER COMMON SHARE (NOTE 2): | |||||||||||
Basic | $ | 5.31 | $ | 5.38 | $ | 4.17 | |||||
Diluted | $ | 5.24 | $ | 5.32 | $ | 4.14 | |||||
WEIGHTED AVERAGE COMMON SHARES OUTSTANDING (NOTE 2): | |||||||||||
Basic | 64,240 | 65,073 | 65,267 | ||||||||
Diluted | 65,074 | 65,845 | 65,781 | ||||||||
The accompanying notes are an integral part of these consolidated financial statements.
46
ATWOOD OCEANICS, INC. AND SUBSIDIARIES
CONSOLIDATED STATEMENTS OF COMPREHENSIVE INCOME
Years Ended September 30, | |||||||||||
(In thousands) | 2014 | 2013 | 2012 | ||||||||
Net income | $ | 340,822 | $ | 350,224 | $ | 272,171 | |||||
Other comprehensive income (loss): | |||||||||||
Derivative financial instruments: | |||||||||||
Unrealized holding gain (loss) | 4,208 | (244 | ) | (3,094 | ) | ||||||
Reclassification adjustment for loss included in net income | 834 | 1,774 | 1,610 | ||||||||
Total other comprehensive income (loss) | 5,042 | 1,530 | (1,484 | ) | |||||||
Comprehensive income | $ | 345,864 | $ | 351,754 | $ | 270,687 | |||||
The accompanying notes are an integral part of these consolidated financial statements.
47
ATWOOD OCEANICS INC. AND SUBSIDIARIES
CONSOLIDATED BALANCE SHEETS
September 30, | |||||||
(In thousands, except par value) | 2014 | 2013 | |||||
ASSETS | |||||||
Cash | $ | 80,080 | $ | 88,770 | |||
Accounts receivable | 242,684 | 199,689 | |||||
Income tax receivable | 6,260 | 4,672 | |||||
Inventories of materials and supplies | 132,368 | 121,833 | |||||
Prepaid expenses, deferred costs and other current assets | 36,415 | 38,796 | |||||
Total current assets | 497,807 | 453,760 | |||||
Property and equipment, net | 3,967,028 | 3,164,724 | |||||
Other receivables | 11,831 | 11,831 | |||||
Deferred income taxes | 589 | — | |||||
Deferred costs and other assets | 29,973 | 26,951 | |||||
Total assets | $ | 4,507,228 | $ | 3,657,266 | |||
LIABILITIES AND SHAREHOLDERS' EQUITY | |||||||
Accounts payable | $ | 94,315 | $ | 95,827 | |||
Accrued liabilities | 19,158 | 17,653 | |||||
Dividends payable | 16,090 | — | |||||
Short-term debt | 11,885 | 8,071 | |||||
Interest payable | 8,099 | 7,945 | |||||
Income tax payable | 14,234 | 16,554 | |||||
Deferred credits and other liabilities | 3,596 | 10,822 | |||||
Total current liabilities | 167,377 | 156,872 | |||||
Long-term debt | 1,742,122 | 1,263,232 | |||||
Deferred income taxes | 783 | 485 | |||||
Deferred credits | 4,100 | 1,176 | |||||
Other | 37,322 | 28,130 | |||||
Total long-term liabilities | 1,784,327 | 1,293,023 | |||||
Commitments and contingencies (Note 10) | |||||||
Preferred stock, no par value, 1,000 shares authorized, none outstanding | — | — | |||||
Common stock, $1.00 par value, 180,000 shares authorized with 64,362 issued and outstanding at September 30, 2014 and 90,000 shares authorized and 64,057 shares issued and outstanding at September 30, 2013 | 64,362 | 64,057 | |||||
Paid-in capital | 201,464 | 183,390 | |||||
Retained earnings | 2,286,137 | 1,961,405 | |||||
Accumulated other comprehensive income (loss) | 3,561 | (1,481 | ) | ||||
Total shareholders’ equity | 2,555,524 | 2,207,371 | |||||
Total liabilities and shareholders’ equity | $ | 4,507,228 | $ | 3,657,266 | |||
The accompanying notes are an integral part of these consolidated financial statements.
48
ATWOOD OCEANICS, INC. AND SUBSIDIARIES
CONSOLIDATED STATEMENTS OF CHANGES IN
SHAREHOLDERS’ EQUITY
Common Stock | Paid-in | Retained | Accumulated Other Comprehensive | Total Stockholders’ | ||||||||||||||||||
(In thousands) | Shares | Amount | Capital | Earnings | Income (Loss) | Equity | ||||||||||||||||
September 30, 2011 | 64,960 | $ | 64,960 | $ | 145,084 | $ | 1,444,270 | $ | (1,527 | ) | $ | 1,652,787 | ||||||||||
Net income | — | — | — | 272,171 | — | 272,171 | ||||||||||||||||
Other comprehensive loss | — | — | — | — | (1,484 | ) | (1,484 | ) | ||||||||||||||
Vesting of restricted stock awards | 207 | 207 | (207 | ) | — | — | — | |||||||||||||||
Exercise of employee stock options | 285 | 285 | 5,261 | — | — | 5,546 | ||||||||||||||||
Stock option and restricted stock award compensation expense | — | — | 10,402 | — | — | 10,402 | ||||||||||||||||
September 30, 2012 | 65,452 | 65,452 | 160,540 | 1,716,441 | (3,011 | ) | 1,939,422 | |||||||||||||||
Net income | — | — | — | 350,224 | — | 350,224 | ||||||||||||||||
Other comprehensive income | — | — | — | — | 1,530 | 1,530 | ||||||||||||||||
Vesting of restricted stock awards | 168 | 168 | (168 | ) | — | — | — | |||||||||||||||
Exercise of employee stock options | 437 | 437 | 8,787 | — | — | 9,224 | ||||||||||||||||
Stock option and restricted stock award compensation expense | — | — | 14,231 | — | — | 14,231 | ||||||||||||||||
Repurchase and retirement of common shares | (2,000 | ) | (2,000 | ) | — | (105,260 | ) | — | (107,260 | ) | ||||||||||||
September 30, 2013 | 64,057 | 64,057 | 183,390 | 1,961,405 | (1,481 | ) | 2,207,371 | |||||||||||||||
Net income | — | — | — | 340,822 | — | 340,822 | ||||||||||||||||
Other comprehensive income | — | — | — | — | 5,042 | 5,042 | ||||||||||||||||
Dividends declared | — | — | — | (16,090 | ) | — | (16,090 | ) | ||||||||||||||
Vesting of restricted stock awards | 180 | 180 | (180 | ) | — | — | — | |||||||||||||||
Exercise of employee stock options | 125 | 125 | 3,563 | — | — | 3,688 | ||||||||||||||||
Stock option and restricted stock award compensation expense | — | — | 14,691 | — | — | 14,691 | ||||||||||||||||
September 30, 2014 | 64,362 | $ | 64,362 | $ | 201,464 | $ | 2,286,137 | $ | 3,561 | $ | 2,555,524 | |||||||||||
The accompanying notes are an integral part of these consolidated financial statements.
49
ATWOOD OCEANICS, INC. AND SUBSIDIARIES
CONSOLIDATED STATEMENTS OF CASH FLOWS
Years Ended September 30, | |||||||||||
(In thousands) | 2014 | 2013 | 2012 | ||||||||
Cash flows from operating activities: | |||||||||||
Net income | $ | 340,822 | $ | 350,224 | $ | 272,171 | |||||
Adjustments to reconcile net income to net cash provided by operating activities: | |||||||||||
Depreciation | 147,358 | 117,510 | 70,599 | ||||||||
Amortization | 8,634 | 5,224 | (712 | ) | |||||||
Provision for doubtful accounts and inventory obsolescence | 2,826 | 5,582 | 765 | ||||||||
Deferred income tax benefit | (1,270 | ) | (816 | ) | (989 | ) | |||||
Share-based compensation expense | 14,691 | 14,231 | 10,402 | ||||||||
(Gain) loss on sale of assets | (34,139 | ) | 971 | 457 | |||||||
Change in assets and liabilities: | |||||||||||
Accounts receivable | (43,965 | ) | (36,330 | ) | (80,013 | ) | |||||
Income tax receivable | (1,588 | ) | 1,078 | (119 | ) | ||||||
Inventories of materials and supplies | (17,220 | ) | (43,254 | ) | (23,395 | ) | |||||
Prepaid expenses, deferred costs and other current assets | 15,463 | (712 | ) | (6,386 | ) | ||||||
Deferred costs and other assets | (11,682 | ) | (19,700 | ) | (32,597 | ) | |||||
Accounts payable | 1,932 | 11,440 | 27,536 | ||||||||
Accrued liabilities | 1,647 | 1,430 | (7,096 | ) | |||||||
Premium on Senior Notes | — | 8,500 | — | ||||||||
Income tax payable | (2,320 | ) | 5,863 | 1,250 | |||||||
Deferred credits and other liabilities | 21,431 | 10,869 | 23,730 | ||||||||
Net cash provided by operating activities | 442,620 | 432,110 | 255,603 | ||||||||
Cash flows from investing activities: | |||||||||||
Capital expenditures | (975,731 | ) | (745,223 | ) | (785,083 | ) | |||||
Proceeds from sale of assets | 61,516 | 147 | 7,646 | ||||||||
Net cash used by investing activities | (914,215 | ) | (745,076 | ) | (777,437 | ) | |||||
Cash flows from financing activities: | |||||||||||
Proceeds from issuance of long-term debt | 700,000 | 600,000 | 760,000 | ||||||||
Principal payments on long-term debt | (220,000 | ) | (175,000 | ) | (450,000 | ) | |||||
Proceeds (repayments) on short-term debt, net | (13,979 | ) | 2,923 | (313 | ) | ||||||
Repurchase and retirement of common shares | — | (107,260 | ) | — | |||||||
Proceeds from exercise of stock options | 3,688 | 9,224 | 5,546 | ||||||||
Debt issuance costs paid | (6,804 | ) | (6,022 | ) | (10,530 | ) | |||||
Net cash provided by financing activities | 462,905 | 323,865 | 304,703 | ||||||||
Net increase (decrease) in cash and cash equivalents | (8,690 | ) | 10,899 | (217,131 | ) | ||||||
Cash at beginning of period | 88,770 | 77,871 | 295,002 | ||||||||
Cash at end of period | $ | 80,080 | $ | 88,770 | $ | 77,871 | |||||
Cash paid during the period for: | |||||||||||
Domestic and foreign income taxes | $ | 55,777 | $ | 49,105 | $ | 49,636 | |||||
Interest, net of amounts capitalized | 35,265 | 21,200 | 1,849 | ||||||||
Non-cash activities: | |||||||||||
Increase (decrease) in accrued liabilities related to capital expenditures | (2,804 | ) | 795 | (56,965 | ) | ||||||
Dividends payable | 16,090 | — | — | ||||||||
Increase in short-term debt related to funding of insurance policies | 17,793 | — | — | ||||||||
The accompanying notes are an integral part of these consolidated financial statements.
50
NOTE 1—NATURE OF OPERATIONS
Atwood Oceanics, Inc. and its subsidiaries, which are collectively referred to herein as the “Company,” “we,” “us” or “our” except where stated or the context indicates otherwise, are a global offshore drilling contractor engaged in the drilling and completion of exploratory and developmental oil and gas wells. We currently own a diversified fleet of 13 mobile offshore drilling units located in the U.S. Gulf of Mexico, the Mediterranean Sea, offshore West Africa, offshore Southeast Asia and offshore Australia and are constructing two ultra-deepwater drillships for delivery in fiscal years 2015 and 2016. We were founded in 1968 and are headquartered in Houston, Texas with support offices in Australia, Malaysia, Singapore, the United Arab Emirates and the United Kingdom.
NOTE 2—SUMMARY OF SIGNIFICANT ACCOUNTING POLICIES
Consolidation
The consolidated financial statements include the accounts of Atwood Oceanics, Inc. and all of its domestic and foreign subsidiaries. All significant intercompany accounts and transactions have been eliminated in consolidation.
Use of estimates
The preparation of financial statements in conformity with generally accepted accounting principles in the United States (“GAAP”) requires management to make extensive use of estimates and assumptions that affect the reported amounts of assets and liabilities and disclosure of contingent assets and liabilities at the date of the financial statements and the reported amounts of revenues and expenses during the reporting period. Actual results could differ from those estimates.
Reclassifications
Certain reclassifications have been made to the prior period financial statements to conform to the current year presentation.
Accounts receivable
We record accounts receivable at the amount we invoice our customers. Our customers are major international corporate entities and government organizations with stable payment experience. Included within accounts receivable at September 30, 2014 and 2013 are unbilled receivable balances totaling $84.2 million and $50.4 million, respectively, which represent amounts for which services have been performed, revenue has been recognized based on contractual provisions and for which collection is deemed reasonably assured. Such unbilled amounts were billed subsequent to their respective fiscal year end. Historically, our uncollectible accounts receivable have been immaterial, and typically, we do not require collateral for our receivables. We provide an allowance for uncollectible accounts, as necessary, on a specific identification basis. We have no allowance for doubtful accounts at September 30, 2014 and 2013. Our provision for bad debts for the years ended September 30, 2014 and 2013 was $1.0 million and $3.9 million, respectively. No bad debt expense was recorded for the year ended September 30, 2012. Bad debt expense is reported as a component of Contract Drilling costs in our Consolidated Statements of Operations.
Concentrations of market and credit risk
All of our customers are in the oil and gas offshore exploration and production industry. This industry concentration has the potential to impact our overall exposure to market and credit risks, either positively or negatively, in that our customers could be affected by similar changes in economic, industry or other conditions. However, we believe that the credit risk posed by this industry concentration is offset by the creditworthiness of our customer base. Revenues from individual customers that are 10% or more of our total revenues as follows:
(In thousands) | Fiscal 2014 | Fiscal 2013 | Fiscal 2012 | ||||||||
Apache Energy Ltd. | $ | 209,871 | $ | 159,369 | $ | — | |||||
Shell Offshore Inc. | 179,763 | 28,349 | — | ||||||||
Chevron Australia Pty. Ltd. | 175,334 | 197,242 | 265,731 | ||||||||
Hess Corporation | — | 154,973 | — | ||||||||
Noble Energy Inc. | 169,851 | 153,615 | 137,135 | ||||||||
Sarawak Shell Bhd. | — | — | 44,405 | ||||||||
Kosmos Energy Ghana Inc. | 12,933 | — | 90,088 | ||||||||
51
In addition, we have certain customers that make up a significant portion of our Accounts Receivable at September 30, 2014, as indicated in the table below:
Customer | Percentage of Accounts Receivable |
Apache Energy Ltd. | 12% |
Shell Offshore Inc. | 10% |
Chevron Australia Pty. Ltd. | 14% |
Noble Energy Inc. | 14% |
Inventories of material and supplies
Inventories consist of spare parts, material and supplies held for consumption and are stated principally at average cost, net of reserves for excess and obsolete inventory of $5.5 million and $4.1 million at September 30, 2014 and 2013, respectively. We maintain our reserves at between 3% and 5% of the balance to provide for non-recoverable costs.
Property and equipment
Property and equipment are recorded at historical cost. Interest costs related to property under construction are capitalized as a component of construction costs.
Once rigs and related equipment are placed in service, they are depreciated on the straight-line method over their estimated useful lives, with depreciation discontinued only during the period when a drilling unit is out-of-service while undergoing a significant upgrade that extends its useful life. Our estimated useful lives of our various classifications of assets are as follows:
Years | |
Drilling vessels and related equipment | 5-35 |
Drill pipe | 3 |
Furniture and other | 3-10 |
Maintenance, repairs and minor replacements are charged against income as incurred. Major replacements and upgrades are capitalized and depreciated over the remaining useful life of the asset, as determined upon completion of the work. The cost and related accumulated depreciation of assets sold, retired or otherwise disposed are removed from the accounts at the time of disposition and any resulting gain or loss is reflected in the Consolidated Statements of Operations for the applicable periods.
Impairment of property and equipment
We evaluate our property and equipment whenever events or changes in circumstance indicate that the carrying amount of an asset may not be recoverable. An impairment loss on our property and equipment exists when the estimated future cash flows are less than the carrying amount of the asset. If an asset is determined to be impaired, the loss is measured by the amount by which the carrying value of the asset exceeds its fair value. In determining an asset's fair value, we consider a number of factors such as estimated future cash flows, appraisals and current market value analysis.
Revenue recognition
We account for contract drilling revenue in accordance with accounting guidance and the terms of the underlying drilling contract. These contracts generally provide that revenue is earned and recognized on a daily rate (i.e. “day rate”) basis, and day rates are typically earned for a particular level of service over the life of a contract assuming collectability is reasonably assured. Day rate contracts can be performed for a specified period of time or the time required to drill a specified well or number of wells. Revenues from day rate contracts for drilling and other operations performed during the term of a contract (including during mobilization) are classified under contract drilling services.
Certain fees received as compensation for relocating drilling rigs from one major operating area to another, equipment and upgrade costs reimbursed by the customer, as well as receipt of advance billings of day rates are deferred and recognized as earned during the expected term of the related drilling contract, as are the day rates associated with such contracts. If receipt of such fees is not conditional, they will be recognized as earned on a straight-line method over the expected term of the related drilling contract.
52
However, fees received upon termination of a drilling contract are generally recognized as earned during the period termination occurs as the termination fee is usually conditional based on the occurrence of an event as defined in the drilling contract, such as not obtaining follow on work to the contract in progress or relocation beyond a certain distance when the contract is completed.
At September 30, 2014 and 2013, deferred fees associated with mobilization, related equipment purchases and upgrades and receipt of advance billings of day rates totaled $7.7 million and $12.0 million, respectively. Deferred fees are classified as current or long-term deferred credits in the accompanying Consolidated Balance Sheets based on the expected term of the applicable drilling contracts.
Reimbursable revenue
We recognize customer reimbursable revenues as we bill our customers for reimbursement of costs associated with certain equipment, materials and supplies, subcontracted services, employee bonuses and other expenditures, resulting in little or no net effect on operating income since such recognition is concurrent with the recognition of the respective reimbursable costs in operating and maintenance expense.
Deferred costs
We defer certain mobilization costs relating to moving a drilling rig to a new area incurred prior to the commencement of the drilling operations and customer requested equipment purchases. We amortize such costs on a straight-line basis over the expected term of the applicable drilling contract. Contract revenues and drilling costs are reported in the Consolidated Statements of Operations at their gross amounts.
At September 30, 2014 and 2013, deferred costs associated with mobilization and related equipment purchases totaled $9.6 million and $17.4 million, respectively. Deferred costs are classified as current or long-term deferred costs in the accompanying Consolidated Balance Sheets based on the expected term of the applicable drilling contracts.
Deferred drydocking costs
Certifications from various regulatory bodies are required to operate our drilling rigs and well control systems and we must maintain such certifications through periodic inspections and surveys on an ongoing basis. We defer the periodic survey and drydock costs incurred in connection with obtaining regulatory certifications and we recognize such costs in Contract Drilling Expense over the period until the next survey using the straight-line method. At September 30, 2014 and 2013, deferred drydocking costs totaling $2.6 million and $2.6 million, respectively, were included in Deferred Costs and Other Assets in the accompanying Consolidated Balance Sheets.
Derivative financial instruments
From time to time we may enter into a variety of derivative financial instruments in connection with the management of our exposure to variability in interest rates and currency exchange rates. We do not engage in derivative transactions for speculative or trading purposes and we are not a party to leveraged derivatives.
We enter into interest rate swaps to limit our exposure to fluctuations and volatility in interest rates. Our credit facility exposes us to short-term changes in market interest rates as our interest obligations on these instruments are periodically re-determined based on the prevailing Eurodollar rate.
Our functional currency is the U.S. dollar and thus our international operations expose us to foreign currency risk associated with cash flows from transactions denominated in currencies other than our functional currency. From time to time, we enter into foreign currency forward exchange contracts to limit our exposure to fluctuations and volatility in currency exchange rates. In December 2013, we entered into foreign currency forward exchange contracts for a portion of our anticipated euro receipts associated with revenues earned on a drilling contract from December 2013 to November 2015. These forward contracts are designated as cash flow hedging instruments.
We record our derivative contracts at fair value on our Consolidated Balance Sheets (See Note 5). Each quarter, changes in the fair values of our derivative instruments designated as hedging instruments will adjust the balance sheet asset or liability, with an offset to Accumulated Other Comprehensive Income (“AOCI”) for the effective portion of the hedge. The effective portion of the cash flow hedge will remain in AOCI until it is reclassified into earnings in the period or periods during which the hedged transaction affects earnings or when it is probable that the hedged forecasted transaction will not occur by the end of the originally specified time period. Any changes in fair value resulting from ineffectiveness are recognized immediately into earnings. See our
53
Consolidated Statement of Comprehensive Income for changes in our unrealized holding losses and reclassifications into earnings for fiscal 2014, 2013 and 2012.
Foreign exchange
Monetary assets and liabilities denominated in foreign currency are re-measured to U.S. Dollars at the rate of exchange in effect at the end of the fiscal year, items of income and expense are re-measured at average monthly rates, and property and equipment and other nonmonetary amounts are re-measured at historical rates. Gains and losses on foreign currency transactions and re-measurements are generally related to and included in contract drilling costs in our consolidated statements of operations. We recorded a foreign exchange loss of $3.0 million during fiscal year 2014, a loss of $2.8 million during fiscal year 2013 and a gain of $1.5 million during fiscal year 2012. The effect of exchange rate changes on cash held in foreign currencies was immaterial.
Income taxes
Deferred income taxes are recorded to reflect the tax consequences, if any, on future years of differences between the tax basis of assets and liabilities and their financial reporting amounts at each year-end given the provisions of enacted tax laws in each respective jurisdiction. We do not record deferred taxes on the basis differences of our drilling rigs working in the U.S. Gulf of Mexico as we do not believe these differences will result in additional U.S. income tax expense. Deferred tax assets are reduced by a valuation allowance when, based upon management’s estimates, it is more likely than not that a portion of the deferred tax assets will not be realized in a future period. In addition, we accrue for income tax contingencies, or uncertain tax positions, that we believe are more likely than not to be realized. See Note 9 for further discussion.
Earnings per common share
Basic earnings per share excludes dilution and is computed by dividing net income (loss) by the weighted-average number of common shares outstanding for the period. Diluted earnings per share reflects the assumed effect of the issuance of additional shares in connection with the exercise of stock options and vesting of restricted stock.
The computation of basic and diluted earnings per share for each of the past three fiscal years is as follows:
(In thousands, except per share amounts) | Net Income | Shares | Per Share Amount | |||||||
Fiscal 2014 | ||||||||||
Basic earnings per share | $ | 340,822 | 64,240 | $ | 5.31 | |||||
Effect of dilutive securities: | ||||||||||
Stock options | — | 239 | (0.01 | ) | ||||||
Restricted stock | — | 595 | (0.06 | ) | ||||||
Diluted earnings per share | $ | 340,822 | 65,074 | $ | 5.24 | |||||
Fiscal 2013 | ||||||||||
Basic earnings per share | $ | 350,224 | 65,073 | $ | 5.38 | |||||
Effect of dilutive securities: | ||||||||||
Stock options | — | 354 | (0.03 | ) | ||||||
Restricted stock | — | 418 | (0.03 | ) | ||||||
Diluted earnings per share | $ | 350,224 | 65,845 | $ | 5.32 | |||||
Fiscal 2012 | ||||||||||
Basic earnings per share | $ | 272,171 | 65,267 | $ | 4.17 | |||||
Effect of dilutive securities: | ||||||||||
Stock options | — | 255 | (0.01 | ) | ||||||
Restricted stock | — | 259 | (0.02 | ) | ||||||
Diluted earnings per share | $ | 272,171 | 65,781 | $ | 4.14 | |||||
In fiscal years 2014 and 2013, there were no anti-dilutive options. The calculation of diluted earnings per share for fiscal year 2012 excludes 656,000 anti-dilutive options.
54
Recently issued accounting pronouncements
In April 2014, the Financial Accounting Standards Board (“FASB”) issued new guidance intended to change the criteria for reporting discontinued operations while enhancing disclosures for discontinued operations, which changes the criteria and requires additional disclosures for reporting discontinued operations. The guidance is effective for all disposals of components of an entity that occur within annual periods beginning on or after December 15, 2014, and interim periods within annual periods beginning on or after December 15, 2015. We do not expect that our adoption will have a material impact on our financial statements or disclosures in our financial statements.
In May 2014, the FASB issued new guidance intended to change the criteria for recognition of revenue. The core principle of the guidance is that an entity should recognize revenue to depict the transfer of promised goods or services to customers in an amount that reflects the consideration to which the entity expects to be entitled in exchange for those goods or services. To achieve this core principal, an entity should apply the following five steps: (1) Identify contracts with customers, (2) Identify the performance obligations in the contracts, (3) Determine the transaction price, (4) Allocate the transaction price to the performance obligation in the contract, and (5) Recognize revenue as the entity satisfies performance obligations. The amendments in are effective for annual reporting periods beginning after December 15, 2016, including interim periods within that reporting period. Early application is not permitted. We are currently evaluating what impact the adoption of this guidance would have on our financial position, results of operations, cash flows or disclosures.
In June 2014, the FASB issued amended guidance on the accounting for certain share-based employee compensation awards. The amended guidance applies to share-based employee compensation awards that include a performance target that affects vesting when the performance target can be achieved after the requisite service period. These targets are to be treated as a performance condition. As such, the performance target should not be reflected in estimating the grant-date fair value of the award and compensation cost should be recognized in the period in which it becomes probable that the performance target will be achieved. The amendments are effective for annual periods and interim periods within those annual periods beginning after December 15, 2015. We do not expect that our adoption will have a material impact on our financial statements or disclosures in our financial statements.
In August 2014, the FASB issued guidance on disclosures of uncertainties about an entity's ability to continue as a going concern. The guidance requires management's evaluation of whether there are conditions or events that raise substantial doubt about the entity's ability to continue as a going concern within one year after the date that the financial statements are issued. This assessment must be made in connection with preparing financial statements for each annual and interim reporting period. Management's evaluation should be based on the relevant conditions and events that are known and reasonably knowable at the date the financial statements are issued. If conditions or events raise substantial doubt about the entity's ability to continue as a going concern, but this doubt is alleviated by management's plans, the entity should disclose information that enables the reader to understand what the conditions or events are, management's evaluation of those conditions or events and management's plans that alleviate that substantial doubt. If conditions or events raise substantial doubt and the substantial doubt is not alleviated, the entity must disclose this in the footnotes. The entity must also disclose information that enables the reader to understand what the conditions or events are, management's evaluation of those conditions or events and management's plans that are intended to alleviate that substantial doubt. The amendments are effective for annual periods and interim periods within those annual periods beginning after December 15, 2016. We do not expect that our adoption will have a material impact on our financial statements or disclosures in our financial statements.
55
NOTE 3—PROPERTY AND EQUIPMENT
A summary of property and equipment by classification is as follows:
September 30, | |||||||
(In thousands) | 2014 | 2013 | |||||
Drilling vessels and equipment | $ | 4,181,774 | $ | 2,979,503 | |||
Construction work in progress | 319,548 | 715,320 | |||||
Drill pipe | 31,265 | 26,743 | |||||
Office equipment and other | 35,566 | 24,439 | |||||
Total cost | 4,568,153 | 3,746,005 | |||||
Less: Accumulated depreciation | (601,125 | ) | (581,281 | ) | |||
Property and equipment, net | $ | 3,967,028 | $ | 3,164,724 | |||
Completed Construction Projects
Our first ultra-deep water drillship, the Atwood Advantage, was delivered from the Daewoo Shipbuilding and Marine Engineering Co., Ltd (“DSME”) yard in South Korea in December 2013. Our second ultra-deepwater drillship, the Atwood Achiever, was delivered from the DSME yard in September 2014.
The Atwood Orca, a 400-foot Pacific Class jackup drilling unit, was delivered in April 2013 from the PPL Shipyard PTE LTD in Singapore (“PPL”).
Construction Projects
In September 2012, we entered into a turnkey construction contract with DSME to construct a third ultra-deepwater drillship, the Atwood Admiral, at the DSME yard in South Korea. The Atwood Admiral is scheduled for delivery in September 2015. In June 2013, we entered into a turnkey construction contract with DSME to construct a fourth ultra-deepwater drillship, the Atwood Archer, at the DSME yard in South Korea. The Atwood Archer is scheduled for delivery in June 2016.
As of September 30, 2014, we had expended approximately $320 million on our ultra-deepwater drillships then under construction. Total remaining firm commitments for these two drilling units under construction were approximately $950 million at September 30, 2014.
Sale of Assets
In January 2014, we sold our standard jackup drilling unit, the Vicksburg, for a sales price of $55.4 million. The carrying value of the rig and its related inventory was approximately $20.5 million.
In April 2014, we sold a wholly owned subsidiary which owned our semisubmersible tender assist drilling rig, the Seahawk, for a sales price of $4.0 million. The carrying value of the subsidiary after a $2.0 million impairment charge recorded in the second quarter of the current fiscal year, approximated its sales price.
56
NOTE 4—DEBT
A summary of long-term debt is as follows:
September 30, | |||||||
(In thousands) | 2014 | 2013 | |||||
Senior Notes 6.5% due 2020 | $ | 657,122 | $ | 658,232 | |||
Revolving Credit Facility | 1,085,000 | 605,000 | |||||
Total long-term debt | $ | 1,742,122 | $ | 1,263,232 | |||
Long-term Debt
Senior Notes - In January 2012, we issued $450 million of 6.50% fixed-rate Senior Notes due 2020 (the "Senior Notes"). We used the net proceeds to reduce outstanding borrowings under our credit facility. On June 21, 2013, we issued an additional $200 million of Senior Notes. The two issuances of Senior Notes together form a single series under the indenture with an aggregate principal amount of $650 million. Our Senior Notes are unsecured obligations and are not guaranteed by any of our subsidiaries. We received a premium of $8.5 million as part of the net proceeds for the Senior Notes issued in 2013. This premium is being amortized over the life of our Senior Notes.
As of September 30, 2014, we had $1.085 billion of outstanding borrowings and $5.9 million in letters of credit issued under our five-year aggregate $1.55 billion senior secured revolving credit facility.
Credit Facility - On April 10, 2014, we entered into an agreement to amend our revolving credit facility the ("Credit Facility"), which increased the total commitment to $1.55 billion from $1.1 billion and extended its maturity to May 2018 from May 2016. Our wholly-owned subsidiary, Atwood Offshore Worldwide Limited (“AOWL”), is the borrower under the Credit Facility, and we and certain of our other subsidiaries are guarantors under the facility.
Prior to the amendment, borrowings under the Credit Facility bore interest at the Eurodollar rate plus a margin ranging from 2.00% to 2.50% and the commitment on the unused portion of the underlying commitments ranged from 0.5% to 1.0% per annum. Borrowings under the Credit Facility bear interest at the Eurodollar rate plus a margin ranging from 1.75% to 2.00% and the commitment fee on the unused portion of the underlying commitment ranges from 0.30% to 0.40% per annum, each based on our corporate credit ratings. Our Credit Facility contains various financial covenants and as of September 30, 2014, we were in compliance with those covenants.
In connection with the amendment, we mortgaged as additional collateral the Atwood Mako and the Atwood Manta. As a result, first preferred mortgages on nine of our active drilling units (Atwood Aurora, Atwood Beacon, Atwood Condor, Atwood Eagle, Atwood Falcon, Atwood Hunter, Atwood Mako, Atwood Manta and Atwood Osprey,), as well as liens on the equity interests of our subsidiaries that own, directly or indirectly, such drilling units serve as collateral for our Credit Facility.
The weighted-average effective interest rate on our long-term debt during fiscal 2014 was 2.28%. The effective rate was determined after giving consideration to the effect of our interest rate swaps accounted for as hedges and the amortization of premiums or discounts. Interest expense for fiscal 2014, 2013 and 2012 was $41.8 million, $24.9 million and $6.5 million, respectively. Capitalized interest expense for fiscal 2014, 2013 and 2012 was $30.0 million, $33.2 million and $32.9 million, respectively.
Short-term Debt
In July 2014, we financed our primary insurance program covering against casualty and liability risks. The financing arrangement bears an interest rate of 1.57% and is amortizing over a period of nine months. We had a similar arrangement in fiscal 2013 and 2012 and the interest rate was 1.46% for fiscal 2013 and 1.46% for fiscal 2012.
57
NOTE 5—FAIR VALUE OF FINANCIAL INSTRUMENTS
We have certain assets and liabilities that are required to be measured and disclosed at fair value. Fair value is defined as the exchange price that would be received for an asset or paid to transfer a liability (an exit price) in the principal or most advantageous market for the asset or liability in an orderly transaction between market participants on the measurement date.
The fair value hierarchy prioritizes inputs to valuation techniques used to measure fair value into three levels. Priority is given to unadjusted quoted prices in active markets for identical assets or liabilities (Level 1) and the lowest priority to unobservable inputs (Level 3). Assets and liabilities measured at fair value are classified based on the lowest level of input that is significant to the fair value measurement. Our assessment of the significance of a particular input to the fair value measurement requires judgment, which may affect the valuation of the fair value of assets and liabilities and their placement within the fair value hierarchy levels. The determination of the fair values, stated below, takes into account the market for our financial assets and liabilities, the associated credit risk and other considerations.
We have classified and disclosed fair value measurements using the following levels of the fair value hierarchy:
Level 1: Unadjusted quoted prices in active markets that are accessible at the measurement date for identical, unrestricted assets or liabilities.
Level 2: Quoted prices in markets that are not active, or inputs which are observable, either directly or indirectly, for substantially the full term of the asset or liability.
Level 3: Measurement based on prices or valuation models that require inputs that are both significant to the fair value measurement and less observable for objective sources (i.e., supported by little or no market activity).
Fair value of Certain Assets and Liabilities
The fair value of cash, accounts receivable and accounts payable approximate fair value because of their short term maturities.
Fair Value of Financial Instruments
Independent third party services are used to determine the fair value of our financial instruments using quoted market prices and observable inputs. When independent third party services are used, we obtain an understanding of how the fair values are derived and selectively corroborate fair values by reviewing other readily available market based sources of information.
Long-term Debt - Our long-term debt consists of both our Senior Notes and our Credit Facility.
Senior Notes - The carrying value of our Senior Notes, net of unamortized premium is $657 million ($650 million principal amount) while the fair value of our Senior Notes was $666 million at September 30, 2014. The fair value is determined by a market approach using quoted period-end bond prices. We have classified this as a Level 2 fair value measurement as valuation inputs for fair value measurements are quoted market prices at September 30, 2014 that can only be obtained from independent third party sources. The fair value amount has been calculated using these quoted prices. However, no assurance can be given that the fair value would be the amount realized in an active market exchange.
Credit Facility - Our Credit Facility is variable-rate and the carrying amounts of our variable-rate debt approximates fair value because such debt bears short-term, market-based interest rates. We have classified the fair value measurement of this instrument as Level 2 as valuation inputs for purposes of determining our fair value disclosure are readily available published Eurodollar rates.
Derivative financial instruments - Our derivative financial instruments consist of our interest rate swap contracts and our foreign currency forward exchange contracts. We record our derivative contracts at fair value on our consolidated balance sheets. The fair values of our interest rate swaps and our foreign currency forward exchange contracts are based upon valuations calculated by an independent third party. The derivatives were valued according to the "Market approach" where possible, and the "Income approach" otherwise. A third party independently valued each instrument using forward price data obtained from reputable data providers (e.g., Bloomberg and Reuters) and reviewed market activity and similarity of pricing terms to determine appropriate reliability level assertions for each instrument. The contribution of the credit valuation adjustment to total fair value is less than 1% for all derivatives and is therefore not significant. Based on valuation inputs for fair value measurement and independent review performed by third party consultants, we have classified our derivative contracts as Level 2 as they were valued based upon observable inputs from dealer markets.
The following table sets forth the estimated fair value of our derivative financial instruments at September 30, 2014 and 2013, which are measured and recorded at fair value on a recurring basis:
58
September 30, | ||||||||||
(In thousands) | Balance Sheet Classification | 2014 | 2013 | |||||||
Derivative assets designated as hedges: | ||||||||||
Short-term foreign currency forwards | Prepaid expenses, deferred costs and other current assets | $ | 3,930 | $ | — | |||||
Long-term foreign currency forwards | Deferred costs and other assets | 1,125 | — | |||||||
Long-term interest rate swaps | Deferred costs and other assets | 275 | — | |||||||
Derivative liabilities designated as hedges: | ||||||||||
Short-term interest rate swaps | Accrued liabilities | (838 | ) | (1,586 | ) | |||||
Total derivative contracts, net | $ | 4,492 | $ | (1,586 | ) | |||||
NOTE 6—CAPITAL STOCK
Dividends Declared
Our board of directors has declared a quarterly cash dividend of $0.25 per share of common stock, payable on January 13, 2015 to shareholders of record on January 6, 2015. We have not paid dividends historically.
Increase in Shares Authorized
At the Company's 2014 Annual Meeting of Shareholders held on February 19, 2014, our shareholders approved an increase in the number of authorized shares of our common stock from 90,000,000 to 180,000,000. The Company also has the authority to issue 1,000,000 shares of preferred stock, each with no par value.
Repurchase and Retirement of Common Shares
On May 23, 2013, we entered into a stock purchase agreement with Helmerich & Payne International Drilling Co. ("H&P"), a subsidiary of Helmerich & Payne, Inc., under which we agreed to repurchase 2,000,000 shares of our common stock from H&P and to make a payment at closing to H&P of $107.1 million. On June 13, 2013, we and H&P amended the agreement to extend the closing date from June 13, 2013 to June 27, 2013 resulting in an increase to the amount paid at closing to H&P by $200,000. The share repurchase closed on June 27, 2013. Following the share repurchase, we canceled such shares. H&P is considered a related party due to a member of our board of directors currently serving as Chairman of the Board of Helmerich & Payne, Inc.
59
NOTE 7—SHARE-BASED COMPENSATION
Our incentive plans permit the issuance of restricted stock and restricted stock unit awards (which we refer to as "restricted stock awards"), performance awards, stock appreciation rights and stock options. There are 1.9 million shares available for future grants at September 30, 2014. We deliver newly issued shares of common stock for restricted stock awards upon vesting or upon exercise of stock options.
Share-based compensation is recognized as an expense over the requisite service period on a straight-line basis. The total share-based compensation expense is based on the fair value of the award measured at the grant date.
September 30, | |||||||||||
(In thousands, except average service periods) | 2014 | 2013 | 2012 | ||||||||
Share-based compensation recognized | $ | 14,691 | $ | 14,231 | $ | 10,402 | |||||
Unrecognized compensation cost, net of estimated forfeitures | 16,478 | 19,898 | 19,483 | ||||||||
Remaining weighted-average service period (years) | 1.7 | 1.8 | 2.2 | ||||||||
Stock Options
Under our stock incentive plans, the exercise price of each stock option must be equal to or greater than the fair market value of one share of our common stock on the date of grant and all outstanding options having a maximum term of 10 years. Options vest ratably over a period ranging from the end of the first to the fourth year from the date of grant for stock options. Each option is for the purchase of one share of our common stock.
The total fair value of stock options vested during fiscal years 2014, 2013 and 2012 was $2.8 million, $3.2 million and $2.5 million, respectively. Cash proceeds received for the exercise of options for the fiscal years 2014, 2013 and 2012 was $3.7 million, $9.2 million and $5.5 million, respectively. No stock options were granted during fiscal year 2014 or 2013. The weighted-average grant date fair value of stock options granted during fiscal year 2012 was $16.90 per share. For fiscal year 2012, we estimated the fair value of each stock option on the date of grant using the Black-Scholes pricing model and the following assumptions:
Fiscal 2012 | ||
Risk-Free Interest Rate | 0.9% | |
Expected Volatility | 44% | |
Expected Life (Years) | 5.4 | |
Dividend Yield | None | |
The average risk-free interest rate is based on the five-year U.S. treasury security rate in effect as of the grant date. We determined expected volatility using a six-year historical volatility figure and determined the expected term of the stock options using 10 years of historical data. We have not historically paid dividends.
A summary of stock option activity for fiscal year 2014 is as follows:
Number of Options (000s) | Weighted Average Exercise Price | Weighted Average Remaining Contractual Life (Years) | Aggregate Intrinsic Value (000s) | |||||||||
Outstanding at October 1, 2013 | 989 | $ | 33.21 | |||||||||
Granted | — | — | ||||||||||
Exercised | (125 | ) | 29.44 | $ | 2,637 | |||||||
Forfeited | (31 | ) | 40.24 | |||||||||
Outstanding at September 30, 2014 | 833 | 33.52 | 5.0 | 8,473 | ||||||||
Exercisable at September 30, 2014 | 666 | 31.78 | 4.5 | 7,928 | ||||||||
Restricted Stock
We have awarded restricted stock and restricted stock units to certain employees and to our non-employee directors. All current awards of restricted stock to employees are subject to a vesting and restriction period ranging from three to four years, as set forth
60
in the terms of the grant. Our restricted stock awards are subject to acceleration for change of control, retirement, death or disability. All awards of restricted stock to non-employee directors are subject to a vesting and restriction period of a minimum of 13 months, subject to acceleration upon certain events, such as change of control, as set forth in the terms of the grant. We value restricted stock awards based on the fair market value of our common stock on the date of grant. Our restricted stock holders have the right to receive dividend equivalents for restricted awards that vest for the dividends we will start paying in fiscal 2015. Recipients of restricted stock awards do not have the rights of a shareholder until shares of stock are issued to the recipient.
A summary of restricted stock activity for fiscal year 2014 is as follows:
Number of Shares (000s) | Weighted Average Fair Value | |||||
Unvested at October 1, 2013 | 623 | $ | 42.44 | |||
Granted | 235 | 54.19 | ||||
Vested | (175 | ) | 38.04 | |||
Forfeited | (61 | ) | 47.60 | |||
Unvested at September 30, 2014 | 622 | 47.62 | ||||
Performance Units
We have made awards to certain employees that are subject to market-based performance conditions ("performance units"). All current awards of performance units are subject to a vesting and restriction period of three years. Our performance unit awards are subject to acceleration for change of control, retirement, death or disability. The number of shares that vest based on market-based performance conditions will depend on the degree of achievement of specified corporate performance criteria which are strictly market-based. The grant date fair value of the performance units we have granted was determined through use of the Monte Carlo simulation method. The grant date fair value per share for the performance units we granted in fiscal 2014, 2013 and 2012 was $53.55, $45.20 and $40.28, respectively. Our performance unit holders have the right to receive dividend equivalents for performance units that vest for the dividends we will start paying in fiscal 2015. Recipients of performance units do not have the rights of a shareholder until shares of stock are issued to the recipient.
A summary of performance unit stock activity for fiscal year 2014 is as follows:
Number of Shares (000s) | Weighted Average Fair Value | |||||
Unvested at October 1, 2013 | 226 | $ | 42.35 | |||
Granted | 86 | 53.55 | ||||
Vested | — | — | ||||
Forfeited | (48 | ) | 43.10 | |||
Unvested at September 30, 2014 | 264 | 45.87 | ||||
NOTE 8—RETIREMENT PLANS
We have two defined contribution retirement plans (the “Retirement Plans”). Qualified participants may make contributions under these Retirement Plans, which together with our contributions, can be up to 100% of their compensation, as defined, to a maximum of $52,000. Effective January 1, 2014, an employee is immediately eligible upon date of hire to become a participant in one of our Retirement Plans. Under the Retirement Plans, participant contributions of 1% to 5% are matched on a 2 to 1 basis. Our contributions vest 100% after three years of service with us, including any period of ineligibility mandated by the Retirement Plans. If a participant terminates employment before becoming fully vested, the unvested portion is credited to our account and can be used only to offset our future contribution requirements.
During fiscal years 2014, 2013 and 2012, forfeitures of $0.3 million, $0.2 million, and $0.2 million, respectively, were used to reduce our cash contribution requirements. In fiscal years 2014, 2013 and 2012, our actual cash contributions totaled approximately $9.8 million, $6.8 million and $4.6 million, respectively. As of September 30, 2014, there were approximately $0.7 million of contribution forfeitures, which can be used to reduce our future cash contribution requirements.
61
NOTE 9—INCOME TAXES
Domestic and foreign income before income taxes for the three-year period ended September 30, 2014 is as follows:
(In thousands) | Fiscal 2014 | Fiscal 2013 | Fiscal 2012 | ||||||||
Domestic loss | $ | (36,756 | ) | $ | (17,823 | ) | $ | (35,685 | ) | ||
Foreign income | 434,049 | 422,624 | 348,989 | ||||||||
Income before income taxes | $ | 397,293 | $ | 404,801 | $ | 313,304 | |||||
The provision (benefit) for domestic and foreign taxes on income consists of the following:
(In thousands) | Fiscal 2014 | Fiscal 2013 | Fiscal 2012 | ||||||||
Current—domestic | $ | 773 | $ | 161 | $ | (1,048 | ) | ||||
Deferred—domestic | (980 | ) | (862 | ) | (980 | ) | |||||
Current—foreign | 56,968 | 55,233 | 43,169 | ||||||||
Deferred—foreign | (290 | ) | 45 | (8 | ) | ||||||
Provision for income taxes | $ | 56,471 | $ | 54,577 | $ | 41,133 | |||||
Deferred Taxes
The components of the deferred income tax assets (liabilities) as of September 30, 2014 and 2013 are as follows:
September 30, | |||||||
(In thousands) | 2014 | 2013 | |||||
Deferred tax assets: | |||||||
Net operating loss carryforwards | $ | 35,935 | $ | 27,309 | |||
Tax credit carryforwards | 1,246 | 1,246 | |||||
Stock option compensation expense | 11,744 | 9,666 | |||||
Book accruals | 3,274 | 5,604 | |||||
52,199 | 43,825 | ||||||
Deferred tax liabilities: | |||||||
Difference in book and tax basis of equipment | 496 | (2,500 | ) | ||||
Deferred dividend withholding tax | (784 | ) | — | ||||
(288 | ) | (2,500 | ) | ||||
Net deferred tax assets (liabilities) before valuation allowance | 51,911 | 41,325 | |||||
Valuation allowance | (52,105 | ) | (41,810 | ) | |||
Net deferred tax liabilities | $ | (194 | ) | $ | (485 | ) | |
For fiscal year 2014, we recorded a valuation allowance of $10.3 million on net deferred tax assets primarily related to our United States net operating loss carry forward. The gross amount of federal net operating loss carry forwards as of September 30, 2014 is estimated to be $159.3 million, which will begin to expire in 2025. Management does not expect that our tax credit carry forward of $1.2 million will be utilized to offset future tax obligations before the credits begin to expire in 2015. Thus, a corresponding valuation allowance of $1.2 million is recorded as of September 30, 2014.
We have approximately $19.6 million of windfall tax benefits from previous stock option exercises that have not been recognized as of September 30, 2014. This amount will not be recognized until the deduction would reduce our United States income taxes payable. At such time, the amount will be recorded as an increase to paid-in-capital. We apply the “with-and-without” approach when utilizing certain tax attributes whereby windfall tax benefits are used last to offset taxable income.
We do not record federal income taxes on the undistributed earnings of our foreign subsidiaries that we consider to be indefinitely reinvested in foreign operations. The cumulative amount of such undistributed earnings was approximately $2.4 billion at September 30, 2014. If these earnings were distributed, we estimate approximately $450 million in additional taxes would be incurred. These earnings could also become subject to additional taxes under the anti-deferral provisions within the
62
U.S. Internal Revenue Code. However, we believe this is highly unlikely given our current structure and have not provided deferred income taxes on these foreign earnings as we consider them to be permanently invested abroad.
We record estimated accrued interest and penalties related to uncertain tax positions in income tax expense. At September 30, 2014, we had approximately $12.3 million of reserves for uncertain tax positions, including estimated accrued interest and penalties of $3.3 million, which are included in Other Long Term Liabilities in the Consolidated Balance Sheet. All $12.3 million of the net uncertain tax liabilities would affect the effective tax rate if recognized.
A summary of activity related to the net uncertain tax positions including penalties and interest for fiscal year 2014 is as follows:
Liability for Uncertain | |||
(In thousands) | Tax Positions | ||
Balance at October 1, 2013 | $ | 7,711 | |
Increases as a result of tax positions taken during the current period | 1,224 | ||
Increases as a result of tax positions taken in prior periods | 5,546 | ||
Decreases due to the lapse of the applicable statute of limitations | (2,183 | ) | |
Balance at September 30, 2014 | $ | 12,298 | |
We believe that it is reasonably possible that approximately $1.2 million of our remaining unrecognized tax benefits may be recognized by the end of fiscal year 2015 as a result of a lapse of the statute of limitations.
Our United States tax returns for fiscal year 2010 and subsequent years remain subject to examination by tax authorities. As we conduct business globally, we have various tax years remaining open to examination in our international tax jurisdictions, including tax returns in Australia for fiscal years 2008 through 2013, as well as returns in Equatorial Guinea for calendar years 2010 through 2013. Although we cannot predict the outcome of ongoing or future tax examinations, we do not anticipate that the ultimate resolution of these examinations will have a material impact on our consolidated financial position, results of operations or cash flows.
We have historically earned most of our operating income in certain nontaxable and deemed profit tax jurisdictions, which significantly reduced our effective tax rate for fiscal years 2014, 2013 and 2012 when compared to the United States statutory rate. There were no significant transactions that materially impacted our effective tax for fiscal years 2014, 2013 or 2012. The differences between the United States statutory and our effective income tax rate are as follows:
Fiscal 2014 | Fiscal 2013 | Fiscal 2012 | ||||||
Statutory income tax rate | 35 | % | 35 | % | 35 | % | ||
Resolution of prior period tax items | — | — | (3 | ) | ||||
Increase in tax rate resulting from: | ||||||||
Valuation allowance | 2 | 1 | 4 | |||||
Increases to the reserve for uncertain tax positions | 1 | — | — | |||||
Decrease in tax rate resulting from: | ||||||||
Foreign tax rate differentials, net of foreign tax credit utilization | (24 | ) | (23 | ) | (23 | ) | ||
Effective income tax rate | 14 | % | 13 | % | 13 | % | ||
63
NOTE 10—COMMITMENTS AND CONTINGENCIES
Operating Leases
Future minimum lease payments for operating leases for fiscal years ending September 30 are as follows (in thousands):
2015 | $ | 3,826 | |
2016 | 2,768 | ||
2017 | 2,448 | ||
2018 | 2,149 | ||
2019 and thereafter | 11,646 | ||
Total rent expense under operating leases was approximately $11.5 million, $7.4 million and $5.5 million for fiscal years ended September 30, 2014, 2013 and 2012, respectively. The future minimum lease payments for our Houston corporate office is a material portion of the amounts shown in the table above. This lease is for ten years and commenced on January 31, 2014.
Purchase Commitments
At September 30, 2014, our purchase commitments, relating to our drilling units under construction, were as follows for fiscal years ended September 30 (in thousands):
2015 | $ | 448,030 | |
2016 | 359,493 | ||
2017 | — | ||
2018 | — | ||
2019 and thereafter | — | ||
Litigation
We are party to a number of lawsuits which are ordinary, routine litigation incidental to our business, the outcome of which is not expected to have, either individually or in the aggregate, a material adverse effect on our financial position, results of operations or cash flows.
Other Matters
The Atwood Beacon operated in India from early December 2006 to the end of July 2009. A service tax was enacted in India in 2004 on revenues derived from seismic and exploration activities. This service tax law was subsequently amended in June 2007 and again in May 2008 to state that revenues derived from mining services and drilling services were specifically subject to this service tax. The contract terms with our customer in India provided that any liability incurred by us related to any taxes pursuant to laws not in effect at the time the contract was executed in 2005 was to be reimbursed by our customer. We believe any service taxes assessed by the Indian tax authorities under the 2007 or 2008 amendments are an obligation of our customer. Our customer is disputing this obligation on the basis of its contention that revenues derived from drilling services were taxable under the initial 2004 law, and are, therefore, our obligation.
After reviewing the status of the drilling services we provided to our customer, the Indian tax authorities assessed service tax obligations on revenues derived from the Atwood Beacon commencing on June 1, 2007. The relevant Indian tax authority issued an extensive written ruling setting forth the application of the June 1, 2007 service tax regulation and confirming the position that drilling services, including the services performed under our contract with our customer prior to June 1, 2007, were not covered by the 2004 service tax law. In August 2012, the Indian Custom Excise and Service Tax Appellate Tribunal issued an Order in our favor confirming our position that service tax did not apply to drilling services performed prior to June 1, 2007. The Indian Service Tax Authority has appealed this ruling to the Indian Supreme Court.
As of September 30, 2014, we had paid to the Indian government $10.5 million in service taxes and have accrued $1.3 million of additional service tax obligations in accrued liabilities on our consolidated balance sheets, for a total of $11.8 million relating to service taxes. We recorded a corresponding $11.8 million long-term other receivable due from our customer relating to service taxes due under the contract. We continue to pursue collection of such amounts from our customer and expect to collect the amount recorded as receivable.
64
NOTE 11—OPERATIONS BY GEOGRAPHIC AREAS
Our offshore contract drilling operations are managed and reported as a single reportable segment: Offshore Contract Drilling Services. The mobile offshore drilling units and related equipment comprising our offshore rig fleet operate in a single, global market for contract drilling services. Our drilling units are often redeployed globally due to changing demands of our customers, which consist largely of major integrated oil and natural gas companies and independent oil and natural gas companies. Due to the mobile nature of our rig fleet, the geographic areas where we conduct our business can and does change from year to year. Our offshore contract drilling services segment currently conducts offshore contract drilling operations located in the U.S. Gulf of Mexico, the Mediterranean Sea, offshore West Africa, offshore Southeast Asia and offshore Australia. The accounting policies of our reportable segment are the same as those described in the summary of significant accounting policies (see Note 2). We evaluate the performance of our operating segment based on revenues from external customers and segment profit.
A summary of revenues by geographic areas for the fiscal years ended September 30, 2014, 2013 and 2012 is as follows:
REVENUES | |||||||||||
(In thousands) | Fiscal 2014 | Fiscal 2013 | Fiscal 2012 | ||||||||
Australia | $ | 457,281 | $ | 445,538 | $ | 363,400 | |||||
Cameroon | 43,389 | 64,436 | 35,362 | ||||||||
Equatorial Guinea | 41,245 | 142,637 | 126,575 | ||||||||
Ghana | — | 113 | 90,076 | ||||||||
Guyana | — | 127 | 31,675 | ||||||||
Israel | 2,749 | 58,454 | 6,301 | ||||||||
Italy | 58,912 | — | — | ||||||||
Malaysia | 49,610 | 9,198 | 44,413 | ||||||||
Morocco | 18,128 | — | — | ||||||||
Suriname | — | — | 13,488 | ||||||||
Thailand | 149,961 | 159,853 | 39,598 | ||||||||
United States | 352,678 | 183,307 | 36,533 | ||||||||
Total revenues | $ | 1,173,953 | $ | 1,063,663 | $ | 787,421 | |||||
A summary of property and equipment, net as of by geographic areas at September 30, 2014, 2013 and 2012 is as follows:
PROPERTY AND EQUIPMENT, NET | |||||||||||
September 30, | |||||||||||
(In thousands) | 2014 | 2013 | 2012 | ||||||||
Australia | $ | 669,845 | $ | 704,158 | $ | 738,504 | |||||
Cameroon | 166,464 | 172,606 | 235,573 | ||||||||
Equatorial Guinea | 66,045 | 52,085 | 3 | ||||||||
Ghana | — | 2,296 | 5,475 | ||||||||
Israel | — | 77,056 | 81,173 | ||||||||
Italy | 82,617 | — | — | ||||||||
Korea (1) | 311,494 | 715,320 | 353,641 | ||||||||
Malaysia | 321 | 188,241 | 169 | ||||||||
Malta | 3,332 | 3,968 | 4,768 | ||||||||
Morocco | 627,459 | — | — | ||||||||
Singapore(1) | — | — | 84,443 | ||||||||
Thailand | 539,333 | 390,420 | 208,303 | ||||||||
United States | 1,500,118 | 858,574 | 825,288 | ||||||||
Total property and equipment, net | $ | 3,967,028 | $ | 3,164,724 | $ | 2,537,340 | |||||
(1) Property and equipment, net in these geographic areas consist of assets under construction.
65
NOTE 12—QUARTERLY FINANCIAL DATA (UNAUDITED)
Summarized quarterly results for fiscal years 2014 and 2013 are as follows:
Fiscal 2014 Quarters Ended | ||||||||||||||||
(In thousands, except per share amounts) | December 31 | March 31 | June 30 | September 30 | ||||||||||||
Revenues | $ | 284,706 | $ | 273,097 | $ | 292,777 | $ | 323,373 | ||||||||
Income before income taxes | 94,260 | 97,283 | 79,365 | 126,385 | ||||||||||||
Net income | 83,397 | 73,300 | 71,925 | 112,200 | ||||||||||||
Earnings per common share: | ||||||||||||||||
Basic | 1.30 | 1.14 | 1.12 | 1.74 | ||||||||||||
Diluted | 1.28 | 1.13 | 1.11 | 1.72 | ||||||||||||
Fiscal 2013 Quarters Ended | ||||||||||||||||
December 31 | March 31 | June 30 | September 30 | |||||||||||||
Revenues | $ | 245,093 | $ | 253,161 | $ | 272,688 | $ | 292,721 | ||||||||
Income before income taxes | 84,087 | 97,432 | 105,130 | 118,152 | ||||||||||||
Net income | 72,831 | 85,519 | 89,981 | 101,893 | ||||||||||||
Earnings per common share: | ||||||||||||||||
Basic | 1.11 | 1.30 | 1.38 | 1.59 | ||||||||||||
Diluted | 1.10 | 1.28 | 1.37 | 1.57 | ||||||||||||
(1) | The sum of the individual quarterly earnings per common share amounts may not agree with year-to-date earnings per common share as each quarterly computation is based on the weighted-average number of common shares outstanding during that period. |
NOTE 13—SUBSEQUENT EVENTS
On October 31, 2014, we entered into Supplemental Agreements to the construction contracts for each of the Atwood Admiral and Atwood Archer whereby the delivery of the drillships was postponed by six months. The Atwood Admiral is now scheduled for delivery on September 30, 2015, and the Atwood Archer is now scheduled for delivery on June 30, 2016. In consideration of the agreement by DSME to postpone deliveries, we have agreed to accelerate the payment of a portion of the milestone payments on each rig as follows: $50 million on each rig payable on November 30, 2014; and $25 million on each rig payable on June 30, 2015. In addition, each rig’s final milestone payment amount will be increased by the aggregate financing cost on these payments using an interest rate of 3.5% per annum.
66
ITEM 9. | CHANGES IN AND DISAGREEMENTS WITH ACCOUNTANTS ON ACCOUNTING AND FINANCIAL DISCLOSURE |
None.
ITEM 9A. | CONTROLS AND PROCEDURES |
(a) Evaluation of Disclosure Controls and Procedures
Our management, with the participation of our Chief Executive Officer and Chief Financial Officer, evaluated the effectiveness of our disclosure controls and procedures as of the end of the period covered by this report. Based on that evaluation, the Chief Executive Officer and Chief Financial Officer concluded that our disclosure controls and procedures as of the end of the period covered by this report have been designed and are effective at the reasonable assurance level so that the information required to be disclosed by us in our periodic SEC filings is recorded, processed, summarized and reported within the time periods specific in the SEC’s rules, regulations, and forms and is communicated to management. We believe that a controls system, no matter how well designed and operated, cannot provide absolute assurance that the objectives of the controls system are met, and no evaluation of controls can provide absolute assurance that all control issues and instances of fraud, if any, within a company have been detected.
(b) Management’s Annual Report on Internal Control over Financial Reporting
A copy of our Management’s Report on Internal Control over Financial Reporting is included in Item 8 of this Form 10-K.
(c) Attestation Report of the Independent Registered Public Accounting Firm.
A copy of the report of PricewaterhouseCoopers LLP, our independent registered public accounting firm, is included in Item 8 of this Form 10-K
(d) Change in Internal Control over Financial Reporting
As of July 22, 2014, we upgraded and re-implemented the use of Maximo software, a maintenance, supply chain and inventory system, across our Maintenance and Supply Chain departments at our headquarters in Houston, Texas as well as at our support offices and on our rig fleet. As appropriate, we modified the design and documentation of internal control processes and procedures relating to the upgraded system and related interfaces to simplify and improve our existing internal control over financial reporting related to inventory management and procurement. There were no additional changes in our internal control over financial reporting during the most recent fiscal year covered by this report that have materially affected, or are reasonably likely to materially affect, our internal control over financial reporting.
ITEM 9B. | OTHER INFORMATION |
None.
67
PART III
ITEM 10. | DIRECTORS, EXECUTIVE OFFICERS AND CORPORATE GOVERNANCE |
This information is incorporated by reference from our definitive Proxy Statement for the 2015 Annual Meeting of Shareholders, to be filed with the SEC not later than 120 days after the end of the fiscal year covered by this Form 10-K.
ITEM 11. | EXECUTIVE COMPENSATION |
This information is incorporated by reference from our definitive Proxy Statement for the 2015 Annual Meeting of Shareholders, to be filed with the SEC not later than 120 days after the end of the fiscal year covered by this Form 10-K.
ITEM 12. | SECURITY OWNERSHIP OF CERTAIN BENEFICIAL OWNERS AND MANAGEMENT AND RELATED STOCKHOLDER MATTERS |
This information is incorporated by reference from our definitive Proxy Statement for the 2015 Annual Meeting of Shareholders, to be filed with the SEC not later than 120 days after the end of the fiscal year covered by this Form 10-K.
ITEM 13. | CERTAIN RELATIONSHIPS AND RELATED TRANSACTIONS, AND DIRECTOR INDEPENDENCE |
This information is incorporated by reference from our definitive Proxy Statement for the 2015 Annual Meeting of Shareholders, to be filed with the SEC not later than 120 days after the end of the fiscal year covered by this Form 10-K.
ITEM 14. | PRINCIPAL ACCOUNTANT FEES AND SERVICES |
This information is incorporated by reference from our definitive Proxy Statement for the 2015 Annual Meeting of Shareholders, to be filed with the SEC not later than 120 days after the end of the fiscal year covered by this Form 10-K.
68
PART IV
ITEM 15. | EXHIBITS AND FINANCIAL STATEMENTS |
(1) | Financial Statements. |
Our Consolidated Financial Statements, together with the notes thereto and the report of PricewaterhouseCoopers LLP dated November 13, 2014, are included in Item 8 of this Form 10-K.
(2) | Financial Statement Schedules. |
All financial statement schedules have been omitted because they are not applicable or not required, the information is not significant, or the information is presented elsewhere in the financial statements.
(3) | Exhibits. |
3.1 | Amended and Restated Certificate of Formation effective as of February 14, 2013 (Incorporated herein by reference to Exhibit 3.1 of our Form 8-K filed on February 14, 2013). | |
3.2 | Amendment No. 1 to Amended and Restated Certificate of Formation dated February 19, 2014 (Incorporated herein by reference to Exhibit 3.1 of our Form 8-K filed on February 21, 2014). | |
3.3 | By-Laws of Atwood Oceanics, Inc., effective March 7, 2013 (Incorporated herein by reference to Exhibit 3.1 to our Form 8-K filed on March 7, 2013). | |
4.1 | Indenture dated January 18, 2012 between Atwood Oceanics, Inc. and Wells Fargo Bank, National Association, as trustee, relating to debt securities (Incorporated herein by reference to Exhibit 4.1 to our Form 10-Q for the quarter ended December 31, 2011). | |
4.2 | First Supplemental Indenture dated January 18, 2012 between Atwood Oceanics, Inc. and Wells Fargo Bank, National Association, as trustee, including the form of 6.50% Senior Notes due 2020 (Incorporated herein by reference to Exhibit 4.2 to our Form 10-Q for the quarter ended December 31, 2011. | |
4.3 | See Exhibit Nos. 3.1 and 3.3 hereof for provisions of our Amended and Restated Certificate of Formation and By-Laws defining the rights of our shareholders (Incorporated herein by reference to Exhibits 3.1 of our Form 8-K filed on February 14, 2013 and Exhibit 3.1 to our Form 8-K filed on March 7, 2013). | |
4.4 | Restatement Agreement, dated as of April 10, 2014, among Atwood Oceanics, Inc., Atwood Offshore Worldwide Limited, the lenders party thereto, Nordea Bank Finland Plc, New York Branch, as existing administrative agent, and Nordea Bank Finland Plc, London Branch, as successor agent (Incorporated by reference to Exhibit 10.1 of our Form 8-K filed on April 11, 2014). | |
4.5 | Amended and Restated Credit Agreement dated as of April 10, 2014, among Atwood Oceanics, Inc., Atwood Offshore Worldwide Limited, the lenders party thereto and Nordea Bank Finland Plc, London Branch, as administrative agent (included in Exhibit 10.1). | |
†10.1 | Atwood Oceanics, Inc. Amended and Restated 2001 Stock Incentive Plan (Incorporated herein by reference to Appendix D to our definitive proxy statement on Form DEF 14A filed January 13, 2006). | |
†10.2 | Form of Atwood Oceanics, Inc. Stock Option Agreement – 2001 Stock Incentive Plan (Incorporated herein by reference to Exhibit 10.3.7 of our Form 10-K for the year ended September 30, 2005). | |
†10.3 | Form of Atwood Oceanics, Inc. Restricted Stock Award Agreement – 2001 Stock Incentive Plan (Incorporated herein by reference to Exhibit 10.3.8 of our Form 10-K for the year ended September 30, 2005). | |
†10.4 | Form of Non-Employee Director Restricted Stock Award Agreement Amended and Restated 2001 Stock Incentive Plan (Incorporated herein by reference to Exhibit 10.1 of our Form 8-K filed June 1, 2006). | |
†10.5 | Form of Stock Option Agreement – 2007 Long-Term Incentive Plan (Incorporated herein by reference to Exhibit 10.1.1 of our Form 10-Q for the quarter ended March 31, 2007). | |
†10.6 | Form of Restricted Stock Award Agreement – 2007 Long-Term Incentive Plan (Incorporated herein by reference to Exhibit 10.1.2 of our Form 10-Q for the quarter ended March 31, 2007). | |
†10.7 | Form of Non-Employee Director Restricted Stock Award Agreement – 2007 Long-Term Incentive Plan (Incorporated herein by reference to Exhibit 10.1.15 of our Form 10-K for the year ended September 30, 2009). | |
†10.8 | Atwood Oceanics, Inc. Amended and Restated 2007 Long-Term Incentive Plan (Incorporated herein by reference to our definitive proxy statement on Form DEF14A filed January 14, 2011). | |
69
†10.9 | First Amendment to Atwood Oceanics, Inc. Amended and Restated 2007 Long-Term Incentive Plan (Incorporated herein by reference to Exhibit 10.3 to our Form 10-Q for the quarter ended December 31, 2011). | |
†10.10 | Second Amendment to Atwood Oceanics, Inc. Amended and Restated 2007 Long-Term Incentive Plan, effective November 21, 2013 (Incorporated herein by reference to Exhibit 10.1 of our Form 10-Q for the quarter ended December 31, 2013). | |
†10.11 | Form of Notice of Restricted Stock Grant - 2007 Long-Term Incentive Plan (Incorporated herein by reference to Exhibit 10.4 to our Form 10-Q for the quarter ended December 31, 2011). | |
†10.12 | Form of Notice of Non-employee Director Restricted Stock Grant - 2007 Long-Term Incentive Plan (Incorporated herein by reference to Exhibit 10.5 to our Form 10-Q for the quarter ended December 31, 2011). | |
†10.13 | Form of Notice of Option Grant - 2007 Long-Term Incentive Plan (Incorporated herein by reference to Exhibit 10.6 to our Form 10-Q for the quarter ended December 31, 2011). | |
†10.14 | Form of Notice of Performance Unit Grant - 2007 Long-Term Incentive Plan (Incorporated herein by reference to Exhibit 10.7 to our Form 10-Q for the quarter ended December 31, 2011). | |
†10.15 | Atwood Oceanics, Inc. 2013 Long-Term Incentive Plan (Incorporated herein by reference to Appendix A to our definitive proxy statement on Form DEF14A filed on January 3, 2013). | |
†10.16 | Form of Notice of Restricted Stock Unit Award - 2013 Long-Term Incentive Plan (Incorporated herein by reference to Exhibit 10.2 to our Form 10-Q for the quarter ended March 31, 2013). | |
†10.17 | Form of Notice of Non-employee Director Restricted Stock Unit Award - 2013 Long-Term Incentive Plan (Incorporated herein by reference to Exhibit 10.3 to our Form 10-Q for the quarter ended March 31, 2013). | |
†10.18 | Form of Notice of Option Grant - 2013 Long-Term Incentive Plan (Incorporated herein by reference to Exhibit 10.4 to our Form 10-Q for the quarter ended March 31, 2013). | |
†10.19 | Form of Notice of Performance Unit Grant - 2013 Long-Term Incentive Plan (Incorporated herein by reference to Exhibit 10.5 to our Form 10-Q for the quarter ended March 31, 2013). | |
†10.20 | Revised Form of Notice of Restricted Stock Unit Award - 2013 Long Term Incentive Plan (Incorporated herein by reference to Exhibit 10.2 to our Form 10-Q for the quarter ended December 31, 2013). | |
†10.21 | Revised Form of Notice of Performance Unit Grant - 2013 Long Term Incentive Plan (Incorporated herein by reference to Exhibit 10.3 to our Form 10-Q for the quarter ended December 31, 2013). | |
†10.22 | Revised Form of Notice of Non-Employee Director Restricted Stock Unit Award - 2013 Long Term Incentive Plan (Incorporated herein by reference to Exhibit 10.4 to our Form 10-Q for the quarter ended December 31, 2013). | |
†10.23 | Form of Executive Change of Control Agreement (Incorporated herein by reference to Exhibit 10.1 to our Form 8-K filed May 30, 2012). | |
†10.24 | Form of Indemnification Agreement for Directors and Executive Officers (Incorporated herein by reference to Exhibit 10.1 to our Form 10-Q for the quarter ended March 31, 2012). | |
†10.25 | Atwood Oceanics, Inc. Restated Executive Life Insurance Plan dated as of March 19, 1999 (Incorporated herein by reference to Exhibit 10.22 to our Form 10-K for the year ended September 30, 2011). | |
†10.26 | First Amendment, dated as of May 24, 2012, to the Atwood Oceanics, Inc. Salary Continuation Plan (formerly known as the Restated Executive Life Insurance Plan) (Incorporated herein by reference to Exhibit 10.2 to our Form 8-K filed May 30, 2012). | |
†10.27 | Form of Salary Continuation Agreement (Incorporated herein by reference to Exhibit 10.3 to our Form 8-K filed May 30, 2012). | |
†10.28 | Atwood Oceanics, Inc. Benefits Equalization Plan Amended and Restated Effective as of January 1, 2013 (Incorporated herein by reference to Exhibit 10.1 to our Form 10-Q for the quarter ended December 31, 2012). | |
†10.29 | Amended and Restated Atwood Oceanics, Inc. 2007 Nonemployee Directors' Elective Deferred Compensation Plan (Incorporated herein by reference to Exhibit 10.6 to our Form 10-Q for the quarter ended March 31, 2013). | |
10.30 | Contract for Construction and Sale of Drillship by and between Alpha Admiral Company and Daewoo Shipbuilding & Marine Engineering Co. Ltd., dated September 27, 2012 (Incorporated herein by reference to Exhibit 10.42 to our From 10-K for the year ended September 30, 2012). | |
70
10.31 | Contract for Construction and Sale of Drillship by and between Alpha Archer Company and Daewoo Shipbuilding & Marine Engineering Co., Ltd., dated June 24, 2013 (Incorporated herein by reference to Exhibit 10.1 to our Form 10-Q for the quarter ended June 30, 2013). | |
10.32 | Stock Purchase Agreement, dated May 23, 2013, by and among Atwood Oceanics, Inc. and Helmerich & Payne International Drilling Co. (Incorporated herein by reference to Exhibit 10.1 to our Form 8-K filed May 30, 2013). | |
10.33 | First Amendment to Stock Purchase Agreement, dated June 13, 2013, by and among Atwood Oceanics, Inc. and Helmerich & Payne International Drilling Co. (Incorporated herein by reference to Exhibit 10.1 to our Form 8-K filed June 17, 2013). | |
*21.1 | List of Subsidiaries. | |
*23 | Consent of Independent Registered Public Accounting Firm. | |
*31.1 | Certification of Chief Executive Officer pursuant to Section 302 of the Sarbanes-Oxley Act of 2002. | |
*31.2 | Certification of Chief Financial Officer pursuant to Section 302 of the Sarbanes-Oxley Act of 2002. | |
**32.1 | Certification of Chief Executive Officer pursuant to Section 906 of the Sarbanes-Oxley Act of 2002. | |
**32.2 | Certification of Chief Financial Officer pursuant to Section 906 of the Sarbanes-Oxley Act of 2002. | |
*101 | Interactive data files. | |
* | Filed herewith | |
** | Furnished herewith | |
† | Management contract or compensatory plan or arrangement | |
71
SIGNATURES
Pursuant to the requirements of Section 13 or 15(d) of the Securities Exchange Act of 1934, the registrant has duly caused this report to be signed on its behalf by the undersigned, thereunto duly authorized.
ATWOOD OCEANICS, INC. |
/S/ ROBERT J. SALTIEL |
ROBERT J. SALTIEL |
President and Chief Executive Officer |
Date: November 13, 2014 |
Pursuant to the requirements of the Securities Exchange Act of 1934, this report has been signed below by the following persons on behalf of the registrant and in the capacities and on the dates indicated.
/S/ MARK L. MEY | /S/ ROBERT J. SALTIEL | |
MARK L. MEY Senior Vice President, Chief Financial Officer (Principal Financial Officer) | ROBERT J. SALTIEL President and Chief Executive Officer; Director (Principal Executive Officer) | |
Date: November 13, 2014 | Date: November 13, 2014 | |
/S/ MARK W. SMITH | ||
MARK W. SMITH Vice President, Chief Accounting Officer and Controller (Principal Accounting Officer) | ||
Date: November 13, 2014 | ||
/S/ DEBORAH A. BECK | /S/ JEFFREY A. MILLER | |
DEBORAH A. BECK Director | JEFFREY A. MILLER Director | |
Date: November 13, 2014 | Date: November 13, 2014 | |
/S/ GEORGE S. DOTSON | /S/ JAMES R. MONTAGUE | |
GEORGE S. DOTSON Director | JAMES R. MONTAGUE Director | |
Date: November 13, 2014 | Date: November 13, 2014 | |
/s/ JACK E. GOLDEN | /S/ PHIL D. WEDEMEYER | |
JACK E. GOLDEN Director | PHIL D. WEDEMEYER Director | |
Date: November 13, 2014 | Date: November 13, 2014 | |
/S/ HANS HELMERICH | ||
HANS HELMERICH Director | ||
Date: November 13, 2014 | ||
72