Attached files
| file | filename |
|---|---|
| 8-K - FORM 8-K - PUBLIC SERVICE ENTERPRISE GROUP INC | d819319d8k.htm |
 Forward-Looking Statement
2
Certain of the matters discussed in this report about our and our subsidiaries'
future performance, including, without limitation, future revenues, earnings, strategies, prospects, consequences and
all other statements that are not purely historical constitute
“forward-looking statements” within the meaning of the Private Securities Litigation Reform Act of 1995. Such forward-looking
statements are subject to risks and uncertainties, which could cause actual
results to differ materially from those anticipated. Such statements are based on management's beliefs as well as
assumptions made by and information currently available to management. When
used herein, the words “anticipate,” “intend,” “estimate,” “believe,” “expect,” “plan,” “should,” “hypothetical,”
“potential,” “forecast,” “project,” variations of
such words and similar expressions are intended to identify forward-looking statements. Factors that may cause actual results to differ are often
presented with the forward-looking statements themselves. Other factors
that could cause actual results to differ materially from those contemplated in any forward-looking statements made by us
herein are discussed in filings we make with the United States Securities and
Exchange Commission (SEC), including our Annual Report on Form 10-K and subsequent reports on Form 10-Q and
Form 8-K and available on our website: http://www.pseg.com. These factors
include, but are not limited to: •
adverse changes in the demand for or the price of the capacity and energy that
we sell into wholesale electricity markets, •
adverse changes in energy industry law, policies and regulation, including
market structures and a potential shift away from competitive markets toward subsidized market
mechanisms, capacity market design, transmission planning and cost allocation
rules, including how transmission projects are planned and who is permitted to build transmission
in the future, and reliability standards,
•
any inability of our transmission and distribution businesses to obtain
adequate and timely rate relief and regulatory approvals from federal and state regulators,
•
changes in federal and state environmental regulations and enforcement that
could increase our costs or limit our operations, •
changes in nuclear regulation and/or general developments in the nuclear power
industry, including various impacts from any accidents or incidents experienced at our facilities or by
others in the industry, that
could limit operations of our nuclear generating units, •
actions or activities at one of our nuclear units located on a multi-unit
site that might adversely affect our ability to continue to operate that unit or other units located at the same site,
•
any inability to manage our energy obligations, available supply and risks,
•
adverse outcomes of any legal, regulatory or other proceeding, settlement,
investigation or claim applicable to us and/or the energy industry,
•
any deterioration in our credit quality or the credit quality of our
counterparties, •
availability of capital and credit at commercially reasonable terms and
conditions and our ability to meet cash needs, •
changes in the cost of, or interruption in the supply of, fuel and other
commodities necessary to the operation of our generating units, •
delays in receipt of necessary permits and approvals for our
construction and development activities, •
delays or unforeseen cost escalations in our construction and development
activities, •
any inability to achieve, or continue to sustain, our expected levels of
operating performance, •
any equipment failures, accidents, severe weather events or other incidents
that impact our ability to provide safe and reliable service to our customers, and any inability to obtain
sufficient insurance coverage
or recover proceeds of insurance with respect to such events, •
acts of terrorism, cybersecurity attacks or intrusions that could
adversely impact our businesses, •
increases in competition in energy supply markets as well as competition for
certain transmission projects, •
any inability to realize anticipated tax benefits or retain tax credits,
•
challenges associated with recruitment and/or retention of a qualified
workforce, •
adverse performance of our decommissioning and defined benefit plan trust fund
investments and changes in funding requirements, •
changes in technology, such as distributed generation and micro grids, and
greater reliance on these technologies, and •
changes in customer behaviors, including increases in energy efficiency,
net-metering and demand response. All of the forward-looking statements made in this report are qualified by
these cautionary statements and we cannot assure you that the results or developments anticipated by management will be
realized or even if realized, will have the expected consequences to, or
effects on, us or our business prospects, financial condition or results of operations. Readers are cautioned not to place
undue reliance on these forward-looking statements in making any investment
decision. Forward-looking statements made in this report apply only as of the date of this report. While we may elect
to update forward-looking statements from time to time, we specifically
disclaim any obligation to do so, even if internal estimates change, unless otherwise required by applicable securities laws.
The forward-looking statements contained in this report are intended to
qualify for the safe harbor provisions of Section 27A of the Securities Act of 1933, as amended, and Section 21E of the
Securities Exchange Act of 1934, as amended.
Exhibit 99 |
 GAAP Disclaimer
These materials and other financial releases can be found on the
pseg.com
website under the investor tab, or at http://investor.pseg.com/
PSEG presents Operating Earnings in addition to its Net Income reported in
accordance with accounting principles generally accepted in the United
States (GAAP). Operating Earnings is a non-GAAP financial measure
that differs from Net Income because it excludes gains or losses
associated with Nuclear Decommissioning Trust (NDT),
Mark-to-Market (MTM) accounting, and other material one-time
items. PSEG presents Operating Earnings because management believes that
it is appropriate for investors to consider results excluding these
items in addition to the results reported in accordance with GAAP. PSEG
believes that the non-GAAP financial measure of Operating Earnings
provides a consistent and comparable measure of performance of its
businesses to help shareholders understand performance trends. This
information is not
intended to be viewed as an alternative to GAAP information.
The last slides in this presentation include a list of items excluded from Net
Income to reconcile to Operating Earnings, with a reference to those
slides included on each of the slides where the non-GAAP information
appears. 3 |
 Delivering on commitments and pursuing
opportunities for growth
Operational
Excellence
•
Power: Record 2013 output at Linden CCGT and Salem 2;
nuclear capacity factor greater than 90% for 9 straight year
•
PSE&G: Mid-Atlantic Reliability Award (12
consecutive year) •
PSEG Long Island: Went “live”
on January 1, 2014
•
PSEG: Cost-control benefits continue
Financial
Strength
•
Strong cash flows supported credit rating increases
•
Pension fully funded
•
Dividend increased
Disciplined
Investment
•
PSE&G
Transmission capital program execution and growth
Energy Strong infrastructure program underway
Solar 4 All Extension and Solar Loan III programs
•
Power: Investments to enhance the fleet’s competitiveness
– 130 MW Nuclear uprate, 150 MW CCGT uprate and efficiency
improvement 7
th
th |
 Operating Earnings Mix
Long term investment program has driven increased earnings
contribution from stable, regulated business
*SEE SLIDE A FOR ITEMS EXCLUDED FROM INCOME FROM
CONTINUING OPERATIONS/ NET INCOME TO RECONCILE TO OPERATING EARNINGS;
DISCONTINUED OPERATIONS REFLECT TEXAS. E=ESTIMATE ** 2014
PERCENTS USE MIDPOINT OF EARNINGS GUIDANCE. Power’s
diverse fuel mix
and dispatch flexibility
continues to generate
earnings and free cash flow
PSE&G’s
investment
in
transmission has
diversified its asset base
and, coupled with other
investments
and cost controls,
supported compound
annual earnings growth of
~18% over 2009 –
2013
Operating
Earnings*
Contribution
by
Subsidiary
(%)
PSE&G
Power
Other
$2.44
$2.58
$2.60 -
$2.75E
$3.12
$2.74
$3.09
8
2009
2010
2011
2012
2013
2014E** |
 PSEG –
Year to Date 2014 Highlights
Operating Earnings YTD up 9% to $2.27 per share from $2.09 for YTD 2013
PSE&G on track to record double-digit growth in earnings on expanded
capital investment program
PSEG Power expected to earn at upper level of expectations for the full year
Narrowed 2014 full–year, operating earnings guidance to
$2.60-$2.75 per share, from $2.55-$2.75 per share prior
Executing on our capital program
Replacement of PSE&G’s gas cast-iron pipe underway as part of $1.22
billion Energy Strong capital program
Major transmission projects under $6.8 billion capital program are
on-time and on-budget
Market developments
PJM proposed changes to its Reliability Price Mechanism, Demand Curve Adjustment
and pending Demand Response (DR) issues supportive of price formation
13 |
 SEE SLIDE A FOR ITEMS EXCLUDED FROM INCOME FROM CONTINUING
OPERATIONS/NET INCOME TO RECONCILE TO OPERATING
EARNINGS. E = ESTIMATE.
$2.44
$2.58
$2.60 -
$2.75E
2014 operating earnings guidance narrowed; forecast full-year at upper
end of range, assuming normal weather and unit operations for rest of
year PSEG –
2014 Another Year of Growth
14
2014 Guidance
2013
2012 |
 Investment opportunities exceeding $1 billion
Focused on providing our customers with access to low-cost gas
and cost-effective technologies that reduce emissions
as they also improve system reliability
Potential Investment
Description
Amount
Bridgeport Harbor Station
New 450 MW CCGT Unit
$500 --
$700
PSEG --
Long Island
Utility 2.0 Energy Efficiency Filing
$200 --
$345
Artificial Island
FERC 1000 Project*
$250 --
$300
PennEast Pipeline
Equity Interest
$100 --
$120
PSE&G Energy Efficiency
Program Extension
$100 --
$100
Total
$1,150-$1,565
*Artificial Island Project includes amount for related compensator which has
been assigned to PSE&G. 16 |
 PSEG Annual Dividend –
A long history of growth
and returning cash to shareholders with a financial position that
provides opportunity for consistent and sustained growth
Payout Ratio
70%
63%
66%
43%
44%
43%
44%
50%
58%
56%
55%**
PSEG Annual Dividend Rate
*INDICATED ANNUAL RATE.
**2014
PAYOUT
RATIO
REFLECTS
THE
MIDPOINT
OF
OPERATING
EARNINGS
GUIDANCE.
E=ESTIMATE
10-YEAR COMPOUND ANNUAL
RATE OF GROWTH 3.0%
17
2004
2005
2006
2007
2008
2009
2010
2011
2012
2013
2014E |
 PSE&G’s 2014 operating earnings
to benefit from increased investment in transmission and
on-going cost control
42
PSE&G Operating Earnings*
($ Millions)
2012
2013
2014 Guidance
E=ESTIMATE
*SEE SLIDE A FOR ITEMS EXCLUDED FROM NET INCOME TO RECONCILE
TO OPERATING EARNINGS. |
 PSEG Long Island commenced operations
on January 1, 2014
Key elements of Operating Services Agreement
Increased PSEG
scope and control
Performance metrics
NY Department of
Public Service
oversight
Utility 2.0 –
Expanded program
filed ~$345 million
Use of PSEG brand
as PSEG Long Island
3-Year rate freeze
(2013-2015)
Early performance
Successful transition
to PSEG Long Island
Improved
stakeholder
communications
Achieving reliability
and customer
satisfaction metrics
45 |
 PSEG
Power
Nuclear
is
a
critical
element of our success
Hope Creek
•
Operated by PSEG Nuclear
•
PSEG Ownership: 100%
•
Technology: Boiling Water
Reactor
•
Total Capacity: 1,178 MW
•
Owned Capacity: 1,178
MW
•
License Expiration: 2046
•
Next Refueling
Spring 2015
Salem
Units 1 and 2
•
Operated by PSEG Nuclear
•
PSEG Ownership: 57%
•
Technology: Pressurized Water
Reactor
•
Total Capacity: 2,365 MW
•
Owned Capacity: 1,358 MW
•
License Expiration: 2036
and 2040
•
Next Refueling
Unit 1 –
Spring 2016
Unit 2 --
Fall 2015
Peach Bottom
Units 2 and 3
•
Operated by Exelon
•
PSEG Ownership: 50%
•
Technology: Boiling Water
Reactor
•
Total Capacity: 2,251 MW
•
Owned Capacity:
1,125 MW
•
License Expiration: 2033
and 2034
•
Next Refueling
Unit 2 –
Spring 2016
Unit 3 –
Fall 2015
•
Uprate: 130 MW (PS Share)
Unit 2 -
2015/Unit 3 -
2016
55 |
 Shasta A & B
California (4 MW)
COD March 2014
Polycrystalline -
single axis tracker
Investment $13 million
20 year PPAs with PG&E
Hackettstown (Mars)
New Jersey (2 MW)
COD September 2009
Thin film panels –
fixed tilt
Investment $13 million
15 year PPA with Mars, Inc.
Wyandot
Ohio (12 MW)
COD May 2010
Thin film panels –
fixed tilt
Investment $45 million
20 year PPA with AEP
JEA
Florida (15 MW)
COD September 2010
Thin film panels –
fixed tilt
Investment $59 million
30 year PPA with JEA
Queen Creek
Arizona (25 MW)
COD October 2012
Polycrystalline -
single axis tracker
Investment $79 million
20 year PPA with SRP
Milford
Delaware (15 MW)
COD December 2012
Polycrystalline -
fixed tilt
Investment $49 million
20 year PPA with DEMEC
Badger I
Arizona (19 MW)
COD November 2013
Polycrystalline -
single axis tracker
Investment $50 million
30 year PPA with APS
PSEG Solar Source owns ~110 MW
of solar facilities with long term contracted revenues*
In Construction
Texas (13 MW)
COD Year-End 2014E
Polycrystalline -
single axis tracker
Investment $22 million
30 year PPA with El Paso Electric
Whitcomb
Vermont (4 MW)
COD October 2014
Polycrystalline -
single axis tracker
Investment $10 million
25 year PPA with VT Electric
Power Producers, Inc.
*PROJECT SIZE IN MEGAWATTS SHOWN IN DC (DIRECT CURRENT).
E=ESTIMATE 64 |
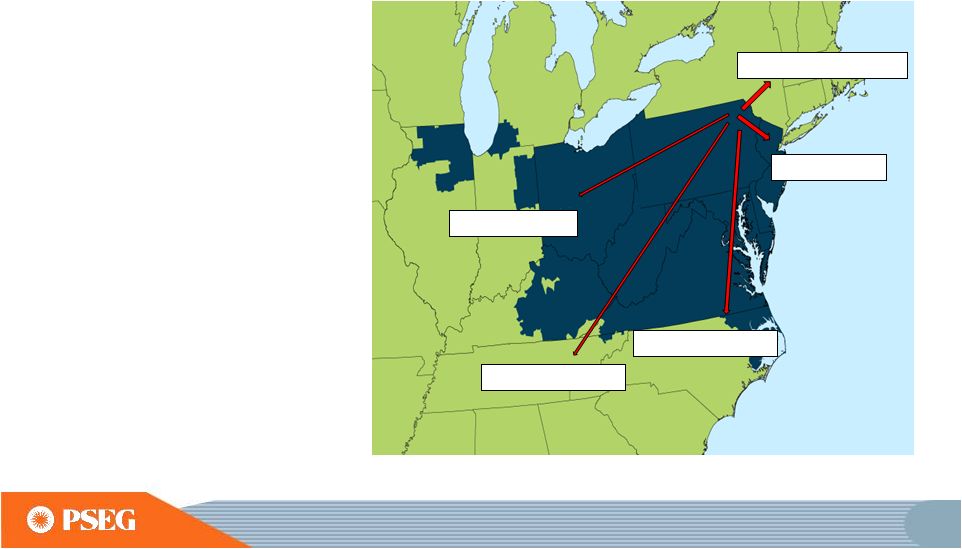 Industry infrastructure build through 2018
to meet demand growth
New England 1.4 bcf/d
Southeast 6.5 bcf/d
Midwest 2.3 bcf/d
Gulf Coast 2.8 bcf/d
New investment
will increase pipeline
takeaway capacity
from low-cost
Marcellus and Utica
shale basins to
meet demand in the
South and Midwest
NJ/NY 1.4 bcf/d
72 |
 Sustainable Advantage: Forward power curves
indicate PSEG Zone retains premium price
* MARKET AS OF OCTOBER 22, 2014. SOURCE:
ICE/BROKER QUOTES. Monthly Power Price
Summary* Growing importance of the winter peak has influenced PJM
reliability planning …
with supportive implications for price formation
73 |
 Oct-Dec
2014
2015
2016
Volume TWh
8
36
36
Base Load
% Hedged
100%
100%
55-60%
(Nuclear and Base Load Coal)
Price $/MWh
$49
$50
$49
Volume TWh
5
21
21
Intermediate Coal, Combined
% Hedged
50-55%
5-10%
0%
Cycle, Peaking
Price $/MWh
$49
$50
$49
Volume TWh
13
55-57
55-57
Total
% Hedged
80-85%
65-70%
35-40%
Price $/MWh
$49
$50
$49
Sustainable Advantage: Hedging strategy
designed to protect gross margin while leveraging the portfolio
78
HEDGE
PERCENTAGES
AND
PRICES
AS
OF
SEPTEMBER
30,
2014.
REVENUES
OF
FULL
REQUIREMENT
LOAD
DEALS
BASED
ON
CONTRACT
PRICE,
INCLUDING
RENEWABLE
ENERGY
CREDITS,
ANCILLARY,
AND
TRANSMISSION
COMPONENTS
BUT
EXCLUDING
CAPACITY.
HEDGES
INCLUDE
POSITIONS
WITH
MTM
ACCOUNTING
TREATMENT
AND
OPTIONS.
EXCLUDES
SOLAR
AND
KALAELOA. |
 PJM Capacity Performance Proposal:
aims to increase electric supply reliability
Capacity
performance
(CP)
proposal
places
emphasis
on
reliability
given
observed outages during times of extreme weather stress and anticipated
retirements;
Imposition
of
higher
penalty
structure
to
encourage
availability
Elimination
of
2.5%
holdback,
making
all
capacity
resources
annual
products,
net CONE bidding safe harbor, and the change in the demand curve (VRR)
support price formation and improve resource adequacy
Generator
availability/flexibility
is
key
objective
for
units
with
secure
fuel
supply
capable of meeting operating standards
80 |
 In 2013, PSE&G invested over $2B, using $1.4B of
internally generated cash flow and debt, while maintaining its
capital structure
85
PSE&G Cash
from Ops
(1)
~$1.4B
PSE&G
Capital
Investment
~$2.2B
Cash ~$0.1B
PSE&G
2013
Cash
Flows
PSE&G
Net Debt
~$0.6B
Parent Capital
Contribution
~$0.1B
(1) PSE&G CASH FROM OPERATIONS ADJUSTS FOR SECURITIZATION PRINCIPAL
REPAYMENTS OF ~$220 MILLION. |
 Improving Operating Earnings
and increased contribution from PSE&G
PSEG Operating Earnings
$ Millions (except EPS)
2012
2013
2014E
PSE&G
$528
$612
$710 -
$745
PSEG Power
$663
$710
$575 -
$610
Enterprise/Other
$45
($13)
$35 -
$40
Operating Earnings*
$1,236
$1,309
$1,320 -
$1,395
Operating EPS*
$2.44
$2.58
$2.60 -
$2.75
Regulated % of Earnings
43%
47%
53% -
54%
*SEE SLIDE A FOR ITEMS EXCLUDED FROM INCOME FROM CONTINUING
OPERATIONS/NET INCOME TO RECONCILE TO OPERATING EARNINGS.
NOTE: 2012 OPERATING EARNINGS RE-STATED FOR TRANSFER OF ASSETS FROM PSEG
HOLDINGS TO PSEG POWER. E=ESTIMATE.
93 |
 PSE&G
EPS
Annual Dividend Per Share
(10 YEAR HISTORICAL CAGR ~3%)
(1)
THE 2014 PAYOUT RATIO IS BASED ON THE MIDPOINT OF PSEG'S 2014 OPERATING
EARNINGS GUIDANCE OF $2.60-$2.75E PER SHARE. SEE SLIDE A FOR ITEMS
EXCLUDED FROM INCOME FROM CONTINUING OPERATIONS/NET INCOME TO RECONCILE TO
OPERATING EARNINGS. Opportunity
for
consistent and sustainable
dividend growth supported by strong cash flow from both
businesses
2.8% increase
Payout Ratio
43%
44%
50%
58%
56%
55%
( 1)
E = ESTIMATE
94 |
 September 30, 2014
$ Billions
PSEG
PSE&G
Power
Cash and Cash Equivalents
$0.7
$0.3
$0.0
Short Term Debt
$0.0
$0.0
N/A
Long Term Debt
(2)
8.6
6.1
2.5
Common Equity
12.1
6.6
5.5
Total Capitalization
$20.7
$12.7
$8.0
Total Debt / Capitalization
42%
48%
32%
PSE&G Regulated Equity Ratio
(1)
51.8%
Our balance sheet remains strong
(1)
REGULATED EQUITY RATIO INCLUDES CUSTOMER DEPOSITS OF ~$97 MILLION AND EXCLUDES
SHORT-TERM DEBT. (2) INCLUDES L-T DEBT DUE WITHIN 1
YEAR; EXCLUDES SECURITIZATION DEBT OF $326 MILLION AND NON-RECOURSE
DEBT OF $16 MILLION. 108 |
 PSEG Energy Holdings
Investment Portfolio
Equipment
Investment
Balance*
at 9/30/2014
($ millions)
Merchant Energy Leases
NRG REMA
Keystone, Conemaugh & Shawville (PA)
3 coal-fired plants (1,162 equity MW)
$345
NRG Energy/Midwest Gen **
Powerton & Joliet Generating Stations
(IL)
2 coal-fired generating facilities (1,640 equity MW)
$218
Regulated Energy Leases
Merrill Creek
Reservoir in NJ (PECO, MetEd, Delmarva Power & Light)
$197
Grand Gulf
Nuclear station in Mississippi (175 equity MW)
Real Estate Leveraged Leases
GM Renaissance Center; Wal-Marts; E-D (shopping) Centers
$73
Real Estate Operating Leases
Office Towers, Shopping Centers -
28 properties
$57
Generation Legacy Assets
GWF (in wind down stage), Bridgewater, GSOE
$3
Other
Land & Receivables
$5
Total Holdings Investments
$898
*BOOK BALANCE EXCLUDING DEFERRED TAX ACCOUNTS.
**EME AND ITS SUBSIDIARIES FILED CHAPTER 11 BANKRUPTCY ON 12/17/2012.
ON APRIL 1,2014, EME WAS ACQUIRED BY NRG; ALL MONETARY DEFAULTS WERE CURED AT
CLOSING WITH NO CHANGE TO HOLDINGS’
STATED EQUITY VALUE.
110 |
 Items Excluded from Income from Continuing
Operations/Net Income to Reconcile to Operating Earnings
PLEASE SEE PAGE 3 FOR AN EXPLANATION OF PSEG’S USE OF OPERATING EARNINGS
AS A NON-GAAP FINANCIAL MEASURE AND HOW IT DIFFERS FROM NET
INCOME. 2013
2012
2011
2010
2009
2008
Earnings Impact ($ Millions)
Operating Earnings
1,309
$
1,236
$
1,389
$
1,584
$
1,567
$
1,478
$
Gain (Loss) on Nuclear Decommissioning Trust (NDT)
Fund Related Activity (PSEG Power)
40
52
50
46
9
(71)
Gain (Loss) on Mark-to-Market (MTM) (PSEG Power)
(74)
(10)
107
(1)
(11)
14
Lease Transaction Activity (PSEG Enterprise/Other)
-
36
(173)
-
29
(490)
Storm O&M (PSEG Power)
(32)
(39)
-
-
-
-
Market Transition Charge Refund (PSE&G)
-
-
-
(72)
-
-
Gain (Loss) on Asset Sales and Impairments (PSEG Enterprise/Other)
-
-
34
-
-
(13)
Income from Continuing Operations
1,243
$
1,275
$
1,407
$
1,557
$
1,594
$
918
$
Discontinued Operations
-
-
96
7
(2)
270
Net Income
1,243
$
1,275
$
1,503
$
1,564
$
1,592
$
1,188
$
Fully Diluted Average Shares Outstanding (in Millions)
508
507
507
507
507
508
Per Share Impact (Diluted)
Operating Earnings
2.58
$
2.44
$
2.74
$
3.12
$
3.09
$
2.91
$
Gain (Loss) on NDT Fund Related Activity (PSEG Power)
0.08
0.10
0.10
0.09
0.02
(0.14)
Gain (Loss) on MTM (PSEG Power)
(0.14)
(0.02)
0.21
-
(0.02)
0.03
Lease Transaction Activity (PSEG Enterprise/Other)
-
0.07
(0.34)
-
0.05
(0.96)
Storm O&M (PSEG Power)
(0.07)
(0.08)
-
-
-
-
Market Transition Charge Refund (PSE&G)
-
-
-
(0.14)
-
-
Gain (Loss) on Asset Sales and Impairments (PSEG Enterprise/Other)
-
-
0.06
-
-
(0.03)
Income from Continuing Operations
2.45
$
2.51
$
2.77
$
3.07
$
3.14
$
1.81
$
Discontinued Operations
-
-
0.19
0.01
-
0.53
Net Income
2.45
$
2.51
$
2.96
$
3.08
$
3.14
$
2.34
$
For the Year Ended
December 31,
(Unaudited)
Reconciling Items, net of tax
(a)
Includes the financial impact from positions with forward delivery
months. A
(a)
(a)
PUBLIC SERVICE ENTERPRISE GROUP INCORPORATED |
 2014
2013
2014
2013
2013
2012
Earnings Impact ($ Millions)
Operating Earnings
393
$
385
$
1,153
$
1,061
$
1,309
$
1,236
$
Gain (Loss) on Nuclear Decommissioning Trust (NDT)
Fund Related Activity (PSEG Power)
17
12
40
29
40
52
Gain (Loss) on Mark-to-Market (MTM)
(a)
(PSEG Power)
36
3
(138)
(22)
(74)
(10)
Lease Related Activity (PSEG Enterprise/Other)
-
-
-
-
-
36
Storm O&M, net of insurance recoveries (PSEG Power)
(2)
(10)
(13)
(25)
(32)
(39)
Net Income
444
$
390
$
1,042
$
1,043
$
1,243
$
1,275
$
Fully Diluted Average Shares Outstanding (in Millions)
507
508
507
507
508
507
Per Share Impact (Diluted)
Operating Earnings
0.77
$
0.76
$
2.27
$
2.09
$
2.58
$
2.44
$
Gain (Loss) on NDT Fund Related Activity (PSEG Power)
0.04
0.02
0.08
0.06
0.08
0.10
Gain (Loss) on MTM
(a)
(PSEG Power)
0.07
0.01
(0.27)
(0.04)
(0.14)
(0.02)
Lease Related Activity (PSEG Enterprise/Other)
-
-
-
-
-
0.07
Storm O&M, net of insurance recoveries (PSEG Power)
(0.01)
(0.02)
(0.03)
(0.05)
(0.07)
(0.08)
Net Income
0.87
$
0.77
$
2.05
$
2.06
$
2.45
$
2.51
$
(a) Includes the financial impact from positions with forward delivery months.
September 30,
September 30,
December 31,
(Unaudited)
PUBLIC SERVICE ENTERPRISE GROUP INCORPORATED
Reconciling Items, net of tax
Three Months Ended
Nine Months Ended
Year Ended
Items Excluded from Income from Continuing
Operations/Net Income to Reconcile to Operating Earnings
B
PLEASE SEE PAGE 3 FOR AN EXPLANATION OF PSEG’S USE OF OPERATING EARNINGS
AS A NON-GAAP FINANCIAL MEASURE AND HOW IT DIFFERS FROM NET
INCOME. |