Attached files
| file | filename |
|---|---|
| EX-31.2 - GULF RESOURCES, INC. | e612805_ex31-2.htm |
| EX-31.1 - GULF RESOURCES, INC. | e612805_ex31-1.htm |
| EX-32.1 - GULF RESOURCES, INC. | e612805_ex32-1.htm |
| EXCEL - IDEA: XBRL DOCUMENT - GULF RESOURCES, INC. | Financial_Report.xls |
UNITED STATES
SECURITIES AND EXCHANGE COMMISSION
Washington, D.C. 20549
FORM 10-Q
|
x
|
QUARTERLY REPORT PURSUANT TO SECTION 13 OR 15(d) OF THE SECURITIES EXCHANGE ACT OF 1934
|
|
For the quarterly period ended September 30, 2014
|
|
|
Or
|
|
|
o
|
TRANSITION REPORT PURSUANT TO SECTION 13 OR 15(d) OF THE SECURITIES EXCHANGE ACT OF 1934
|
|
For the transition period from _________ to _________
|
Commission File Number: 001-34499
GULF RESOURCES, INC.
(Exact name of registrant as specified in its charter)
|
Delaware
|
13-3637458
|
|
|
(State or other jurisdiction of incorporation or organization)
|
(I.R.S. Employer Identification No.)
|
|
|
Level 11,Vegetable Building, Industrial Park of the East
Shouguang City, Shandong,
|
262700
|
|
|
(Address of principal executive offices)
|
(Zip Code)
|
Registrant’s telephone number, including area code: +86 (536) 567 0008
Indicate by check mark whether the registrant (1) has filed all reports required to be filed by Section 13 or 15(d) of the Securities Exchange Act of 1934 during the preceding 12 months (or for such shorter period that the registrant was required to file such reports), and (2) has been subject to such filing requirements for the past 90 days.
Yes x No o
Indicate by check mark whether the registrant has submitted electronically and posted on its corporate Web site, if any, every, Interactive Data File required to be submitted and posted pursuant to Rule 405 of Regulation S-T (§232.405 of this chapter) during the preceding 12 months (or for such shorter period that the registrant was required to submit and post such files).
Yes x No o
Indicate by check mark whether the registrant is a large accelerated filer, an accelerated filer, a non-accelerated filer, or a smaller reporting company. See the definitions of “large accelerated filer,” “accelerated filer” and “smaller reporting company” in Rule 12b-2 of the Exchange Act.
|
Large accelerated filer o
|
Accelerated filer o
|
|
Non-accelerated filer (Do not check if a smaller reporting company) o
|
Smaller reporting company x
|
Indicate by check mark whether the registrant is a shell company (as defined in Rule 12b-2 of the Exchange Act).
Yes o No x
As of November 4, 2014, the registrant had outstanding 38,726,415 shares of common stock.
|
Part I – Financial Information
|
|
|
Part II – Other Information
|
|
Item 1. Financial Statements
|
GULF RESOURCES, INC.
|
|
AND SUBSIDIARIES
|
|
CONDENSED CONSOLIDATED BALANCE SHEETS
|
|
(Expressed in U.S. dollars)
|
|
September 30, 2014
Unaudited
|
December 31, 2013
Audited
|
|||||||
|
Current Assets
|
||||||||
|
Cash
|
$
|
131,866,548
|
$
|
107,828,800
|
||||
|
Accounts receivable
|
48,334,471
|
44,885,354
|
||||||
|
Inventories
|
5,273,169
|
5,301,995
|
||||||
|
Prepayments and deposits
|
254,018
|
4,583
|
||||||
|
Prepaid land leases
|
290,634
|
50,548
|
||||||
|
Deferred tax assets
|
1,642
|
1,657
|
||||||
|
Total Current Assets
|
186,020,482
|
158,072,937
|
||||||
|
Non-Current Assets
|
||||||||
|
Property, plant and equipment, net
|
130,528,039
|
146,400,436
|
||||||
|
Property, plant and equipment under capital leases, net
|
1,420,725
|
1,701,328
|
||||||
|
Prepaid land leases, net of current portion
|
733,956
|
753,928
|
||||||
|
Deferred tax assets
|
2,295,277
|
2,316,176
|
||||||
|
Total non-current assets
|
134,977,997
|
151,171,868
|
||||||
|
Total Assets
|
$
|
320,998,479
|
$
|
309,244,805
|
||||
|
Liabilities and Stockholders’ Equity
|
||||||||
|
Current Liabilities
|
||||||||
|
Accounts payable and accrued expenses
|
$
|
6,342,340
|
$
|
5,645,831
|
||||
|
Retention payable
|
321,220
|
209,126
|
||||||
|
Capital lease obligation, current portion
|
155,111
|
202,392
|
||||||
|
Taxes payable
|
4,269,126
|
5,248,486
|
||||||
|
Total Current Liabilities
|
11,087,797
|
11,305,835
|
||||||
|
Non-Current Liabilities
|
||||||||
|
Capital lease obligation, net of current portion
|
2,811,103
|
2,943,878
|
||||||
|
Total Liabilities
|
$
|
13,898,900
|
$
|
14,249,713
|
||||
|
|
||||||||
|
Stockholders’ Equity
|
||||||||
|
PREFERRED STOCK; $0.001 par value; 1,000,000 shares authorized; none outstanding
|
$
|
$
|
||||||
|
COMMON STOCK; $0.0005 par value; 80,000,000 shares authorized; 38,911,014 and 38,765,201 shares issued; and 38,726,415 and 38,580,602 shares outstanding as of September 30, 2014 and December 31, 2013, respectively
|
19,456
|
19,383
|
||||||
|
Treasury stock; 184,599 shares as of September 30, 2014 and December 31, 2013 at cost
|
(500,000
|
)
|
(500,000
|
)
|
||||
|
Additional paid-in capital
|
80,063,908
|
80,033,981
|
||||||
|
Retained earnings unappropriated
|
180,817,501
|
166,421,427
|
||||||
|
Retained earnings appropriated
|
17,859,051
|
17,265,572
|
||||||
|
Cumulative translation adjustment
|
28,839,663
|
31,754,729
|
||||||
|
Total Stockholders’ Equity
|
307,099,579
|
294,995,092
|
||||||
|
Total Liabilities and Stockholders’ Equity
|
$
|
320,998,479
|
$
|
309,244,805
|
||||
See accompanying notes to the condensed consolidated financial statements.
GULF RESOURCES, INC.
AND SUBSIDIARIES
CONDENSED CONSOLIDATED STATEMENTS OF INCOME AND COMPREHENSIVE INCOME
(Expressed in U.S. dollars)
(UNAUDITED)
|
Three-Month Period Ended
September 30,
|
Nine-Month Period Ended
September 30,
|
|||||||||||||||
|
2014
|
2013
|
2014
|
2013
|
|||||||||||||
|
NET REVENUE
|
||||||||||||||||
|
Net revenue
|
$
|
31,106,964
|
$
|
32,935,277
|
$
|
88,451,954
|
$
|
88,291,753
|
||||||||
|
OPERATING INCOME (EXPENSES)
|
||||||||||||||||
|
Cost of net revenue
|
(21,901,056
|
)
|
(22,006,256
|
)
|
(63,202,383
|
)
|
(63,251,929
|
)
|
||||||||
|
Sales, marketing and other operating expenses
|
(29,064
|
)
|
(25,378
|
)
|
(78,793
|
)
|
(70,796
|
)
|
||||||||
|
Research and development cost
|
(30,985
|
)
|
(33,198
|
)
|
(94,323
|
)
|
(105,380
|
)
|
||||||||
|
Write-off/Impairment on property, plant and equipment
|
(673,705
|
)
|
(214
|
)
|
(673,705
|
)
|
(214
|
)
|
||||||||
|
Loss from disposal of property , plant and equipment
|
-
|
-
|
(9,866
|
)
|
-
|
|||||||||||
|
General and administrative expenses
|
(1,894,507
|
)
|
(1,962,496
|
)
|
(4,916,626
|
)
|
(6,354,165
|
)
|
||||||||
|
Gain on relocation of factory
|
-
|
1,877,779
|
-
|
1,877,779
|
||||||||||||
|
Other operating income
|
116,942
|
107,006
|
351,547
|
489,695
|
||||||||||||
|
(24,412,375
|
)
|
(22,042,757
|
)
|
(68,624,149
|
)
|
(67,415,010
|
)
|
|||||||||
|
INCOME FROM OPERATIONS
|
6,694,589
|
10,892,520
|
19,827,805
|
20,876,743
|
||||||||||||
|
OTHER INCOME (EXPENSE)
|
||||||||||||||||
|
Interest expense
|
(48,950
|
)
|
(50,643
|
)
|
(154,090
|
)
|
(157,232
|
)
|
||||||||
|
Interest income
|
125,625
|
86,296
|
351,271
|
238,568
|
||||||||||||
|
INCOME BEFORE TAXES
|
6,771,264
|
10,928,173
|
20,024,986
|
20,958,079
|
||||||||||||
|
INCOME TAXES
|
(1,732,861
|
)
|
(2,818,444
|
)
|
(5,035,433
|
)
|
(5,609,486
|
)
|
||||||||
|
NET INCOME
|
$
|
5,038,403
|
$
|
8,109,729
|
$
|
14,989,553
|
$
|
15,348,593
|
||||||||
|
COMPREHENSIVE INCOME:
|
||||||||||||||||
|
NET INCOME
|
$
|
5,038,403
|
$
|
8,109,729
|
$
|
14,989,553
|
$
|
15,348,593
|
||||||||
|
OTHER COMPREHENSIVE INCOME (LOSS)
|
||||||||||||||||
|
- Foreign currency translation adjustments
|
24,054
|
1,524,122
|
(2,915,066
|
)
|
6,590,396
|
|||||||||||
|
COMPREHENSIVE INCOME
|
$
|
5,062,457
|
$
|
9,633,851
|
$
|
12,074,487
|
$
|
21,938,989
|
||||||||
|
EARNINGS PER SHARE:
|
||||||||||||||||
|
BASIC
|
$
|
0.13
|
$
|
0.21
|
$
|
0.39
|
$
|
0.40
|
||||||||
|
DILUTED
|
$
|
0.13
|
$
|
0.21
|
$
|
0.38
|
$
|
0.40
|
||||||||
|
WEIGHTED AVERAGE NUMBER OF SHARES:
|
||||||||||||||||
|
BASIC
|
38,726,415
|
38,368,267
|
38,684,220
|
38,368,267
|
||||||||||||
|
DILUTED
|
39,297,334
|
38,963,154
|
39,305,975
|
38,685,610
|
||||||||||||
See accompanying notes to the condensed consolidated financial statements.
|
GULF RESOURCES, INC.
|
|
AND SUBSIDIARIES
|
|
CONDENSED CONSOLIDATED STATEMENT OF STOCKHOLDERS’ EQUITY
|
|
NINE-MONTH PERIOD ENDED SEPTEMBER 30, 2014
|
|
(Expressed in U.S. dollars)
|
|
Common stock
|
|||||||||||||||||||||||||||||||||||||
|
Number
|
Number
|
Number
|
Additional
|
Statutory
|
Cumulative
|
||||||||||||||||||||||||||||||||
|
of shares
|
of shares
|
of treasury
|
Treasury
|
paid-in
|
common
|
Retained
|
translation
|
||||||||||||||||||||||||||||||
|
issued
|
outstanding
|
stock
|
Amount
|
stock
|
capital
|
reserve
|
earnings
|
adjustment
|
Total
|
||||||||||||||||||||||||||||
|
$
|
$
|
$
|
$
|
$
|
$
|
$
|
|||||||||||||||||||||||||||||||
|
BALANCE AT DECEMBER 31, 2013
Audited
|
38,765,201
|
38,580,602
|
184,599
|
19,383
|
(500,000
|
)
|
80,033,981
|
17,265,572
|
166,421,427
|
31,754,729
|
294,995,092
|
||||||||||||||||||||||||||
|
Translation adjustment
|
-
|
-
|
-
|
-
|
-
|
-
|
-
|
(2,915,066
|
)
|
(2,915,066
|
)
|
||||||||||||||||||||||||||
|
Cashless exercise of stock options
|
145,813
|
145,813
|
-
|
73
|
-
|
(73)
|
-
|
-
|
-
|
-
|
|||||||||||||||||||||||||||
|
Issuance of stock options to employees
|
-
|
-
|
-
|
-
|
-
|
30,000
|
-
|
-
|
-
|
30,000
|
|||||||||||||||||||||||||||
|
Net income for nine-month period ended September 30, 2014
|
-
|
-
|
-
|
-
|
-
|
-
|
-
|
14,989,553
|
-
|
14,989,553
|
|||||||||||||||||||||||||||
|
Transfer to statutory common reserve fund
|
-
|
-
|
-
|
-
|
-
|
-
|
593,479
|
(593,479
|
)
|
-
|
-
|
||||||||||||||||||||||||||
|
BALANCE AT SEPTEMBER 30, 2014
Unaudited
|
38,911,014
|
38,726,415
|
184,599
|
19,456
|
(500,000
|
)
|
80,063,908
|
17,859,051
|
180,817,501
|
28,839,663
|
307,099,579
|
||||||||||||||||||||||||||
See accompanying notes to the condensed consolidated financial statements.
|
GULF RESOURCES, INC.
|
|
AND SUBSIDIARIES
|
|
CONDENED CONSOLIDATED STATEMENTS OF CASH FLOWS
|
|
(Expressed in U.S. dollars)
|
|
(UNAUDITED)
|
|
Nine-Month Period Ended September 30,
|
||||||||
|
2014
|
2013
|
|||||||
|
|
|
|||||||
|
CASH FLOWS FROM OPERATING ACTIVITIES
|
|
|
||||||
|
Net income
|
$
|
14,989,553
|
$
|
15,348,593
|
||||
|
Adjustments to reconcile net income to net cash provided by operating activities:
|
||||||||
|
Interest on capital lease obligation
|
153,630
|
156,644
|
||||||
|
Amortization of prepaid land leases
|
435,642
|
419,180
|
||||||
|
Depreciation and amortization
|
20,602,061
|
20,568,172
|
||||||
|
Write-off/Impairment loss on property, plant and equipment
|
673,705
|
214
|
||||||
|
Loss from disposal of property, plant and equipment
|
9,866
|
-
|
||||||
|
Currency translation adjustment on inter-company balances
|
(237,028
|
)
|
556,325
|
|||||
|
Gain on relocation of factory
|
-
|
(1,877,779
|
)
|
|||||
|
Demolition expenditure net off against gain on relocation of factory
|
-
|
(733,379
|
)
|
|||||
|
Stock-based compensation expense
|
30,000
|
536,400
|
||||||
|
Changes in assets and liabilities:
|
||||||||
|
Accounts receivable
|
(3,830,608
|
)
|
(4,801,147
|
)
|
||||
|
Inventories
|
(22,314
|
)
|
309,538
|
|||||
|
Prepayments and deposits
|
(249,255
|
)
|
(9,375
|
)
|
||||
|
Accounts payable and accrued expenses
|
747,789
|
(310,091
|
)
|
|||||
|
Retention payable
|
113,936
|
(1,287,006
|
)
|
|||||
|
Taxes payable
|
(940,835
|
)
|
2,512,686
|
|||||
|
Net cash provided by operating activities
|
32,476,141
|
31,388,975
|
||||||
|
CASH FLOWS USED IN INVESTING ACTIVITIES
|
||||||||
|
Additions of prepaid land leases
|
(664,106
|
)
|
(638,076
|
)
|
||||
|
Proceeds from sales of property, plant and equipment
|
21,514
|
143
|
||||||
|
Purchase of property, plant and equipment
|
(6,459,250
|
)
|
(6,072
|
)
|
||||
|
Construction in progress
|
-
|
(307,635
|
)
|
|||||
|
Net cash used in investing activities
|
(7,101,842
|
)
|
(951,640
|
)
|
||||
|
CASH FLOWS USED IN FINANCING ACTIVITIES
|
||||||||
|
Repayment of capital lease obligation
|
(304,806
|
)
|
(302,497
|
)
|
||||
|
Net cash used in financing activities
|
(304,806
|
)
|
(302,497
|
)
|
||||
|
EFFECTS OF EXCHANGE RATE CHANGES ON CASH AND CASH EQUIVALENTS
|
(1,031,745
|
)
|
1,828,730
|
|||||
|
NET INCREASE IN CASH AND CASH EQUIVALENTS
|
24,037,748
|
31,963,568
|
||||||
|
CASH AND CASH EQUIVALENTS - BEGINNING OF PERIOD
|
107,828,800
|
65,241,035
|
||||||
|
CASH AND CASH EQUIVALENTS - END OF PERIOD
|
$
|
131,866,548
|
$
|
97,204,603
|
||||
|
SUPPLEMENTAL DISCLOSURE OF CASH FLOW INFORMATION
|
||||||||
|
Cash paid during the period for:
|
||||||||
|
Income taxes
|
$
|
5,865,449
|
$
|
3,348,327
|
||||
|
SUPPLEMENTAL DISCLOSURE OF NON-CASH FLOW INVESTING
AND FINANCING ACTIVITIES
|
||||||||
|
Issuance of common stock upon cashless exercise of options
|
$
|
73
|
$
|
-
|
||||
See accompanying notes to the condensed consolidated financial statements.
GULF RESOURCES, INC.
AND SUBSIDIARIES
NOTES TO CONDENSED CONSOLIDATED FINANCIAL STATEMENTS
SEPTEMBER 30, 2014
(Expressed in U.S. dollars)
(UNAUDITED)
NOTE 1 – BASIS OF PRESENTATION AND SUMMARY OF SIGNIFICANT ACCOUNTING POLICIES
(a) Basis of Presentation and Consolidation
The accompanying condensed financial statements have been prepared by Gulf Resources, Inc., a Delaware corporation and its subsidiaries (collectively, the “Company”), without audit, in accordance with the instructions to Form 10-Q and, therefore, do not necessarily include all information and footnotes necessary for a fair statement of its financial position, results of operations and cash flows in accordance with accounting principles generally accepted in the United States (“US GAAP”).
In the opinion of management, the unaudited financial information for the three and nine months ended September 30, 2014 presented reflects all adjustments, which are only normal and recurring, necessary for a fair statement of results of operations, financial position and cash flows. These condensed financial statements should be read in conjunction with the financial statements included in the Company’s 2013 Form 10-K. Operating results for the interim periods are not necessarily indicative of operating results for an entire fiscal year.
The preparation of financial statements in conformity with US GAAP requires management to make estimates and assumptions that affect the amounts that are reported in the financial statements and accompanying disclosures. Although these estimates are based on management’s best knowledge of current events and actions that the Company may undertake in the future, actual results may be different from the estimates. The Company also exercises judgments in the preparation of these condensed financial statements in the areas including classification of leases and related party transactions.
The consolidated financial statements include the accounts of Gulf Resources, Inc. and its wholly-owned subsidiary, Upper Class Group Limited, a company incorporated in the British Virgin Islands, which owns 100% of Hong Kong Jiaxing Industrial Limited, a company incorporated in Hong Kong (“HKJI”). HKJI owns 100% of Shouguang City Haoyuan Chemical Company Limited ("SCHC") which owns 100% of Shouguang Yuxin Chemical Industry Co., Limited (“SYCI”). All material intercompany transactions have been eliminated on consolidation.
(b) Nature of the Business
The Company manufactures and trades bromine and crude salt through its wholly-owned subsidiary, Shouguang City Haoyuan Chemical Company Limited ("SCHC"), and manufactures chemical products for use in the oil industry and paper manufacturing industry through its wholly-owned subsidiary, Shouguang Yuxin Chemical Industry Co., Limited ("SYCI") in The People’s Republic of China (“PRC”).
(c) Allowance for Doubtful Accounts
As of September 30, 2014 and December 31, 2013, allowances for doubtful accounts were nil. No allowances for doubtful accounts were charged to the income statement for the three-month and nine-month periods ended September 30, 2014 and 2013.
(d) Concentration of Credit Risk
The Company is exposed to credit risk in the normal course of business, primarily related to accounts receivable and cash and cash equivalents. Substantially all of the Company’s cash and cash equivalents are maintained with financial institutions in the PRC, namely, Industrial and Commercial Bank of China Limited and China Merchants Bank Company Limited, which are not insured or otherwise protected. The Company placed $131,866,548 and $107,828,800 with these institutions as of September 30, 2014 and December 31, 2013, respectively. The Company has not experienced any losses in such accounts in the PRC.
Concentrations of credit risk with respect to accounts receivable exists as the Company sells a substantial portion of its products to a limited number of customers. However, such concentrations of credit risks are limited since the Company performs ongoing credit evaluations of its customers’ financial condition and due to the generally short payment terms. Approximately 71% and 74% of the balances of accounts receivable as of September 30, 2014 and December 31, 2013, respectively, were outstanding for less than or equal to 90 days. For the balances of accounts receivable aged more than 90 days as of September 30, 2014, approximately 70% was settled in October 2014.
GULF RESOURCES, INC.
AND SUBSIDIARIES
NOTES TO CONDENSED CONSOLIDATED FINANCIAL STATEMENTS
SEPTEMBER 30, 2014
(Expressed in U.S. dollars)
(UNAUDITED)
NOTE 1 – BASIS OF PRESENTATION AND SUMMARY OF SIGNIFICANT ACCOUNTING POLICIES – Continued
(e) Property, Plant and Equipment
Property, plant and equipment are stated at cost less accumulated depreciation and any impairment losses. Expenditures for new facilities or equipment, and major expenditures for betterment of existing facilities or equipment are capitalized and depreciated using the straight-line method at rates sufficient to depreciate such costs over the estimated productive lives. All other ordinary repair and maintenance costs are expensed as incurred.
Mineral rights are recorded at cost less accumulated depreciation and any impairment losses. Mineral rights are amortized ratably over the term of the lease, or the equivalent term under the units of production method, whichever is shorter.
Construction in progress primarily represents direct costs of construction of plant, machinery and equipment. Costs incurred are capitalized and transferred to property and equipment upon completion, at which time depreciation commences.
The Company’s depreciation and amortization policies on property, plant and equipment, other than mineral rights and construction in progress, are as follows:
|
Useful life
(in years)
|
||
|
Buildings (including salt pans)
|
8 - 20
|
|
|
Plant and machinery (including protective shells, transmission channels and ducts)
|
5 - 8
|
|
|
Motor vehicles
|
5
|
|
|
Furniture, fixtures and equipment
|
8
|
Property, plant and equipment under capital leases are depreciated over their expected useful lives on the same basis as owned assets, or where shorter, the term of the lease, which is 20 years.
(f) Retirement Benefits
Pursuant to the relevant laws and regulations in the PRC, the Company participates in a defined contribution retirement plan for its employees arranged by a governmental organization. The Company makes contributions to the retirement scheme at the applicable rate based on the employees’ salaries. The required contributions under the retirement plans are charged to the consolidated income statement on an accrual basis when they are due. The Company’s contributions totaled $193,764 and $125,504 for the three-month period ended September 30, 2014 and 2013, respectively, and totaled $512,794 and $369,417 for the nine-month period ended September 30, 2014 and 2013, respectively.
(g) Revenue Recognition
The Company recognizes revenue, net of value-added tax, when persuasive evidence of an arrangement exists, delivery of the goods has occurred, customer acceptance has been obtained, which means the significant risks and ownership have been transferred to the customer, the price is fixed or determinable and collectability is reasonably assured.
GULF RESOURCES, INC.
AND SUBSIDIARIES
NOTES TO CONDENSED CONSOLIDATED FINANCIAL STATEMENTS
SEPTEMBER 30, 2014
(Expressed in U.S. dollars)
(UNAUDITED)
NOTE 1 – BASIS OF PRESENTATION AND SUMMARY OF SIGNIFICANT ACCOUNTING POLICIES – Continued
(h) Recoverability of Long-lived Assets
In accordance with Financial Accounting Standards Board (“FASB”) Accounting Standards Codification (“ASC”) 360-10-35 “Impairment or Disposal of Long-lived Assets”, long-lived assets to be held and used are analyzed for impairment whenever events or changes in circumstances indicate that the carrying amount of an asset may not be fully recoverable or that the useful lives of those assets are no longer appropriate. The Company evaluates at each balance sheet date whether events and circumstances have occurred that indicate possible impairment.
The Company determines the existence of such impairment by measuring the expected future cash flows (undiscounted and without interest charges) and comparing such amount to the carrying amount of the assets. An impairment loss, if one exists, is then measured as the amount by which the carrying amount of the asset exceeds the discounted estimated future cash flows. Assets to be disposed of are reported at the lower of the carrying amount or fair value of such assets less costs to sell. Asset impairment charges are recorded to reduce the carrying amount of the long-lived asset that will be sold or disposed of to their estimated fair values. Charges for the asset impairment reduce the carrying amount of the long-lived assets to their estimated salvage value in connection with the decision to dispose of such assets.
For the three-month and nine-month periods ended September 30, 2014, certain property, plant and machinery, with net book values of $673,705 were replaced during the third phase enhancement project to protective shells for transmission channels, write-offs of the same amounts, were made and included in write-off/impairment on property, plant and equipment.
On September 25, 2013, SCHC entered into a relocation compensation agreement with the Transportation Bureau of Dongying City, Shangdong Province (“Transportation Bureau”) and the Government of Liuhu Township of Dongying City, Shandong Province (“Liuhu Government”) in which SCHC will receive relocation compensation in the amount of $3,875,047 (RMB 23,824,453) for relocating Factory No. 3 due to a railway construction project. Out of this total amount, $2,927,700 (RMB 18,000,000) will be received upon the demolition of the warehouses and facilities of factory No. 3. The remaining balance will be paid after the clearance of all ground fixtures and examination approval by Liuhu Government. As of September 30, 2013, SCHC has completed the demolition work and compensation proceeds of $2,927,700 (RMB 18,000,000) was recorded in other receivable. This amount was received by SCHC from the Liuhu Government in October 2013. For the three-month and nine-month periods ended September 30, 2013, certain property, plant and machinery, with net book value of $307,182 were replaced due to the relocation of the Factory No. 3. In addition, demolition costs of $733,379 (RMB 4,523,400) were incurred in the same periods. The write-off and demolition costs were offset against the compensation proceeds resulting in a net gain on relocation of factory of $1,877,779 in the three and nine months ended September 30, 2013. This is accounted for in accordance with Financial Accounting Standards Board (“FASB”) Accounting Standards Codification (“ASC”) 605-40 “Revenue Recognition – Gains and losses”.
(i) Basic and Diluted Net Income per Share of Common Stock
Basic earnings per common share are based on the weighted average number of shares outstanding during the periods presented. Diluted earnings per share are computed using weighted average number of common shares plus dilutive common share equivalents outstanding during the period. Potential common shares that would have the effect of increasing diluted earnings per share are considered to be anti-dilutive, i.e. the exercise prices of the outstanding stock options were greater than the market price of the common stock. Anti-dilutive common stock equivalents which were excluded from the calculation of number of dilutive common stock equivalents amounted to 2,229,731 and 3,601,075 shares for the three-month period ended September 30, 2014 and 2013, respectively, and amounted to 1,931,556 and 4,660,000 shares for the nine-month period ended September 30, 2014 and 2013, respectively. These awards could be dilutive in the future if the market price of the common stock increases and is greater than the exercise price of these awards.
GULF RESOURCES, INC.
AND SUBSIDIARIES
NOTES TO CONDENSED CONSOLIDATED FINANCIAL STATEMENTS
SEPTEMBER 30, 2014
(Expressed in U.S. dollars)
(UNAUDITED)
NOTE 1 – BASIS OF PRESENTATION AND SUMMARY OF SIGNIFICANT ACCOUNTING POLICIES – Continued
(i) Basic and Diluted Net Income per Share of Common Stock – Continued
The following table sets forth the computation of basic and diluted earnings per share:
|
|
Three-Month Period Ended
September 30,
|
Nine-Month Period Ended
September 30,
|
||||||||||||||
|
2014
|
2013
|
2014
|
2013
|
|||||||||||||
|
Numerator
|
||||||||||||||||
|
Net income
|
$
|
5,038,403
|
$
|
8,109,729
|
$
|
14,989,553
|
$
|
15,348,593
|
||||||||
|
Denominator
|
||||||||||||||||
|
Basic: Weighted-average common shares outstanding during the period
|
38,726,415
|
38,368,267
|
38,684,220
|
38,368,267
|
||||||||||||
|
Add: Dilutive effect of stock options
|
570,919
|
594,887
|
621,755
|
317,343
|
||||||||||||
|
Diluted
|
39,297,334
|
38,963,154
|
39,305,975
|
38,685,610
|
||||||||||||
|
Net income per share
|
||||||||||||||||
|
Basic
|
$
|
0.13
|
$
|
0.21
|
$
|
0.39
|
$
|
0.40
|
||||||||
|
Diluted
|
$
|
0.13
|
$
|
0.21
|
$
|
0.38
|
$
|
0.40
|
||||||||
(j) Reporting Currency and Translation
The financial statements of the Company’s foreign subsidiaries are measured using the local currency, Renminbi (“RMB”), as the functional currency; whereas the functional currency and reporting currency of the Company is the United States dollar (“USD” or “$”).
As such, the Company uses the “current rate method” to translate its PRC operations from RMB into USD, as required under ASC 830 “Foreign Currency Matters”. The assets and liabilities of its PRC operations are translated into USD using the rate of exchange prevailing at the balance sheet date. The capital accounts are translated at the historical rate. Adjustments resulting from the translation of the balance sheets of the Company’s PRC subsidiaries are recorded in stockholders’ equity as part of accumulated comprehensive income. The statement of income and comprehensive income is translated at average rates during the reporting period. Gains or losses resulting from transactions in currencies other than the functional currencies are recognized in net income for the reporting periods as part of general and administrative expense. The statement of cash flows is translated at average rates during the reporting period, with the exception of issuance of shares and payment of dividends which are translated at historical rates.
(k) Foreign Operations
All of the Company’s operations and assets are located in PRC. The Company may be adversely affected by possible political or economic events in this country. The effect of these factors cannot be accurately predicted.
(l) New Accounting Pronouncements
No accounting standards and guidance with an effective date during the three-month and nine-month periods ended September 30, 2014 or issued during 2014 had or are expected to have a significant impact on the Company’s condensed consolidated financial statements.
GULF RESOURCES, INC.
AND SUBSIDIARIES
NOTES TO CONDENSED CONSOLIDATED FINANCIAL STATEMENTS
SEPTEMBER 30, 2014
(Expressed in U.S. dollars)
(UNAUDITED)
NOTE 2 – INVENTORIES
Inventories consist of:
|
September 30, 2014
|
December 31, 2013
|
|||||||
|
Raw materials
|
$
|
1,214,560
|
$
|
651,810
|
||||
|
Finished goods
|
4,065,178
|
4,656,814
|
||||||
|
Allowance for obsolete and slow-moving inventory
|
(6,569
|
)
|
(6,629
|
)
|
||||
|
$
|
5,273,169
|
$
|
5,301,995
|
|||||
NOTE 3 – PREPAID LAND LEASES
The Company prepaid its land leases with lease terms for periods ranging from one to fifty years to use the land on which the office premises, production facilities and warehouses of the Company are situated. The prepaid land lease is amortized on a straight line basis.
During the three-month period ended September 30, 2014 and 2013, amortization of prepaid land lease totaled $234,231 and $229,262, respectively, which were recorded as cost of net revenue. During the nine-month period ended September 30, 2014 and 2013, amortization of prepaid land lease totaled $435,642 and $419,180, respectively, which were recorded as cost of net revenue.
The Company has the rights to use certain parcels of land located in Shouguang, the PRC, through lease agreements signed with local townships. Such parcels of land are collectively owned by local townships and accordingly, the Company could not obtain land use rights certificates on these parcels of land. The parcels of land that the Company could not obtain land use rights certificates cover a total of approximately 59.39 square kilometers with an aggregate carrying value of $982,789 and approximately 59.39 square kilometers with an aggregate carrying value of $761,496 as at September 30, 2014 and December 31, 2013, respectively.
NOTE 4 – PROPERTY, PLANT AND EQUIPMENT, NET
Property, plant and equipment, net consist of the following:
|
September 30, 2013
|
December 31, 2013
|
|||||||
|
At cost:
|
||||||||
|
Mineral rights
|
$
|
6,471,234
|
$
|
6,530,158
|
||||
|
Buildings
|
52,862,086
|
53,343,419
|
||||||
|
Plant and machinery
|
176,519,145
|
172,842,611
|
||||||
|
Motor vehicles
|
9,338
|
9,423
|
||||||
|
Furniture, fixtures and office equipment
|
4,858,389
|
4,902,627
|
||||||
|
Total
|
240,720,192
|
237,628,238
|
||||||
|
Less: Accumulated depreciation and amortization
|
(110,192,153
|
)
|
(91,227,802
|
)
|
||||
|
Net book value
|
$
|
130,528,039
|
$
|
146,400,436
|
||||
The Company has certain buildings and salt pans erected on parcels of land located in Shouguang, PRC, and such parcels of land are collectively owned by local townships. The Company has not been able to obtain property ownership certificates over these buildings and salt pans as the Company could not obtain land use rights certificates on the underlying parcels of land. The aggregate carrying values of these properties situated on parcels of the land are $37,564,473 and $39,565,302 as at September 30, 2014 and December 31, 2013, respectively.
GULF RESOURCES, INC.
AND SUBSIDIARIES
NOTES TO CONDENSED CONSOLIDATED FINANCIAL STATEMENTS
SEPTEMBER 30, 2014
(Expressed in U.S. dollars)
(UNAUDITED)
NOTE 4 – PROPERTY, PLANT AND EQUIPMENT, NET – Continued
During the three-month period ended September 30, 2014, depreciation and amortization expense totaled $6,704,711, of which $6,189,046 and $515,665 were recorded as cost of net revenue and administrative expenses, respectively. During the three-month period ended September 30, 2013, depreciation and amortization expense totaled $6,794,439, of which $6,354,146 and $440,293 were recorded as cost of net revenue and administrative expenses, respectively. During the nine-month period ended September 30, 2014, depreciation and amortization expense totaled $20,336,460, of which $19,180,021 and $1,156,439 were recorded as cost of sales and administrative expenses respectively. During the nine-month period ended September 30, 2013, depreciation and amortization expense totaled $20,305,673, of which $19,069,116 and $1,236,557 were recorded as cost of sales and administrative expenses respectively.
NOTE 5 – PROPERTY, PLANT AND EQUIPMENT UNDER CAPITAL LEASES, NET
Property, plant and equipment under capital leases, net consist of the following:
|
September 30, 2014
|
December 31, 2013
|
|||||||
|
At cost:
|
||||||||
|
Buildings
|
$
|
133,757
|
$
|
134,975
|
||||
|
Plant and machinery
|
2,514,240
|
2,537,133
|
||||||
|
Total
|
2,647,997
|
2,672,108
|
||||||
|
Less: Accumulated depreciation and amortization
|
(1,227,272
|
)
|
(970,780
|
)
|
||||
|
Net book value
|
$
|
1,420,725
|
$
|
1,701,328
|
||||
The above buildings erected on parcels of land located in Shouguang, PRC, are collectively owned by local townships. The Company has not been able to obtain property ownership certificates over these buildings as the Company could not obtain land use rights certificates on the underlying parcels of land.
During the three-month period ended September 30, 2014 and 2013, depreciation and amortization expense totaled $88,352 and $88,194, respectively, which was recorded as cost of net revenue. During the nine-month period ended September 30, 2014 and 2013, depreciation and amortization expense totaled $265,601 and $262,500, respectively, which was recorded as cost of net revenue.
NOTE 6 – ACCOUNTS PAYABLE AND ACCRUED EXPENSES
Accounts payable and accrued expenses consist of the following:
|
September 30, 2014
|
December 31, 2013
|
|||||||
|
Accounts payable
|
$
|
4,160,169
|
$
|
3,998,660
|
||||
|
Salary payable
|
232,511
|
212,138
|
||||||
|
Social security insurance contribution payable
|
89,203
|
57,674
|
||||||
|
Price adjustment funds
|
1,495,978
|
861,071
|
||||||
|
Other payables
|
364,479
|
516,288
|
||||||
|
Total
|
$
|
6,342,340
|
$
|
5,645,831
|
||||
GULF RESOURCES, INC.
AND SUBSIDIARIES
NOTES TO CONDENSED CONSOLIDATED FINANCIAL STATEMENTS
SEPTEMBER 30, 2014
(Expressed in U.S. dollars)
(UNAUDITED)
NOTE 7 – RELATED PARTY TRANSACTIONS
During the three-month and nine-month periods ended September 30, 2014, the Company borrowed $80,000 and $279,974, respectively, and fully repaid later during the same period, from Jiaxing Lighting Appliance Company Limited (Jiaxing Lighting”), in which Mr. Ming Yang, a shareholder and the Chairman of the Company, had a 100% equity interest in Jiaxing Lighting. The amounts due to Jiaxing Lighting were unsecured, interest free and repayable on demand.
On September 25, 2012, the Company purchased five stories of a commercial building in the PRC, through SYCI, from Shandong Shouguang Vegetable Seed Industry Group Co., Ltd. (the “Seller”) at a cost of approximately $5.7 million in cash, of which Mr. Ming Yang, the Chairman of the Company, had a 99% equity interest in the Seller. The cost of the five stories of the commercial building was valued by an independent appraiser on September 17, 2012 to its fair value and recorded as property, plant and equipment. The Company commenced using the property as the new headquarters for the office in early January, 2013. During the fiscal year 2013, the Company entered into an agreement with the Seller to provide property management services for an annual amount of approximately $100,704 for five years from January 1, 2013 to December 31, 2017. The expense associated with this agreement for the three- month period ended September 30, 2014 and 2013 were $25,332 and $25,287. The expense associated with this agreement for the nine- month period ended September 30, 2014 and 2013 were $76,152 and $76,263.
NOTE 8 – TAXES PAYABLE
|
Taxes payable consists of the following:
|
|
September 30, 2014
|
December 31, 2013
|
|||||||
|
Income tax payable
|
$
|
1,806,286
|
$
|
2,653,168
|
||||
|
Mineral resource compensation fee payable
|
336,378
|
300,856
|
||||||
|
Value added tax payable
|
972,873
|
1,079,143
|
||||||
|
Land use right tax payable
|
944,373
|
952,972
|
||||||
|
Other tax payables
|
209,216
|
262,347
|
||||||
|
Total
|
$
|
4,269,126
|
$
|
5,248,486
|
||||
NOTE 9 – CAPITAL LEASE OBLIGATIONS
The components of capital lease obligations are as follows:
|
Imputed
|
September 30,
|
December 31,
|
|||||||
|
Interest rate
|
2013
|
2013
|
|||||||
|
Total capital lease obligations
|
6.7%
|
$
|
2,966,214
|
$
|
3,146,270
|
||||
|
Less: Current portion
|
(155,111
|
)
|
(202,392
|
)
|
|||||
|
Capital lease obligations, net of current portion
|
$
|
2,811,103
|
$
|
2,943,878
|
|||||
Interest expenses from capital lease obligations amounted to $48,863 and $50,438 for the three-month period ended September 30, 2014 and 2013, respectively, which were charged to the income statements. Interest expenses from capital lease obligations amounted to $153,630 and $156,644 for the nine-month period ended September 30, 2014 and 2013, respectively, which were charged to the income statements.
NOTE 10 –EQUITY
|
(a)
|
Authorized shares
|
During the annual general meeting held on June 18, 2013, the shareholders of the Company approved the amendment to the Certificate of Incorporation to decrease the number of the authorized shares of the Company’s comment stocks to 80,000,000. The Company has completed the filing of the amendment and restatement of the Certificate of Incorporation with the Secretary of the State of Delaware to decrease the number of authorized shares of the Company’s common stock and accordingly 80,000,000 is disclosed as the authorized shares of the Company’s common stock in the consolidated balance sheets as of September 30, 2014 and December 31, 2013.
|
(b)
|
Retained Earnings - Appropriated
|
In accordance with the relevant PRC regulations and the PRC subsidiaries’ Articles of Association, the Company’s PRC subsidiaries are required to allocate its profit after tax to the following reserve:
Statutory Common Reserve Funds
SCHC and SYCI are required each year to transfer at least 10% of the profit after tax as reported under the PRC statutory financial statements to the Statutory Common Reserve Funds until the balance reaches 50% of the registered share capital. This reserve can be used to make up any loss incurred or to increase share capital. Except for the reduction of losses incurred, any other application should not result in this reserve balance falling below 25% of the registered capital. The Statutory Common Reserve Fund as of September 30, 2014 for SCHC and SYCI is 38% and 50% of its registered capital respectively.
GULF RESOURCES, INC.
AND SUBSIDIARIES
NOTES TO CONDENSED CONSOLIDATED FINANCIAL STATEMENTS
SEPTEMBER 30, 2014
(Expressed in U.S. dollars)
(UNAUDITED)
NOTE 11 – STOCK-BASED COMPENSATION
Pursuant to the Company’s Amended and Restated 2007 Equity Incentive Plan, the total aggregate number of shares of the Company’s common stock reserved for issuance is 4,341,989 shares. As of September 30, 2014, the number of shares of the Company’s common stock available for issuance is 1,528,489.
The fair value of each option award below is estimated on the date of grant using the Black-Scholes option-pricing model. The risk free rate is based on the yield-to-maturity in continuous compounding of the US Government Bonds with the time-to-maturity similar to the expected tenor of the option granted, volatility is based on the annualized historical stock price volatility of the Company, and the expected life is based on the estimated average of the life of options using the “simplified” method, as prescribed in FASB ASC 718, due to insufficient historical exercise activity during recent years as a basis from which to estimate future exercise patterns.
In early March 2014, the Company granted to an independent director an option to purchase 12,500 shares of the Company’s common stock at an exercise price of $2.55 per share and the options vested immediately. The options were valued at $10,200 fair value, with assumed 67.14% volatility, a three-year expiration term with expected tenor of 1.49 years, a risk free rate of 0.21% and no dividend yield. For the three-month period ended March 31, 2014, $10,200 was recognized as general and administrative expenses.
On May 7, 2014, the Company granted to an independent director an option to purchase 12,500 shares of the Company’s common stock at an exercise price of $1.83 per share and the options vested immediately. The options were valued at $7,900 fair value, with assumed 69.24% volatility, a three-year expiration term with expected tenor of 1.49 years, a risk free rate of 0.25% and no dividend yield. For the three-month period ended June 30, 2014, $7,900 was recognized as general and administrative expenses.
On June 30, 2014, the Company granted to an independent director an option to purchase 12,500 shares of the Company’s common stock at an exercise price of $2.15 per share and the options vested immediately. The options were valued at $8,200 fair value, with assumed 64.48% volatility, a three-year expiration term with expected tenor of 1.50 years, a risk free rate of 0.27% and no dividend yield. For the three-month period ended June 30, 2014, $8,200 was recognized as general and administrative expenses.
During the nine months ended September 30, 2014, 145,813 shares of common stock were issued upon cashless exercise of 223,000 options.
The following table summarizes all Company stock option transactions between January 1, 2014 and September 30, 2014.
The following table summarizes all Company stock option transactions between January 1, 2014 and September 30, 2014.
|
Number of Option
and Warrants
Outstanding and exercisable
|
Weighted- Average Exercise price of Option
and Warrants
|
Range of
Exercise Price per Common Share
|
||||||||||
|
Balance, January 1, 2014
|
2,470,971 | $ | 3.36 | $ | 0.95 - $12.60 | |||||||
|
Granted and vested during the period ended September 30, 2014
|
37,500 | $ | 2.18 | $ | 1.83-2.55 | |||||||
|
Exercised during the period ended September 30, 2014
|
(223,000 | ) | $ | 0.95 | $ | 0.95 | ||||||
|
Expired during the period ended September 30, 2014
|
(50,000 | ) | $ | 9.10 | $ | 3.22-12.00 | ||||||
|
Balance, September 30, 2014
|
2,235,471 | $ | 3.44 | $ | 0.95 - $12.60 | |||||||
GULF RESOURCES, INC.
AND SUBSIDIARIES
NOTES TO CONDENSED CONSOLIDATED FINANCIAL STATEMENTS
SEPTEMBER 30, 2014
(Expressed in U.S. dollars)
(UNAUDITED)
NOTE 11 – STOCK-BASED COMPENSATION – Continued
|
Stock and Warrants Options Exercisable and Outstanding
|
|||||||
|
Weighted Average
|
|||||||
|
Remaining
|
|||||||
|
Outstanding at September 30, 2014
|
Range of
Exercise Prices
|
Contractual Life
(Years)
|
|||||
|
Exercisable and outstanding
|
2,235,471
|
$0.95 - $12.60
|
1.44
|
||||
The aggregate intrinsic value of options outstanding and exercisable as of September 30, 2014 was $1,615,362.
The total intrinsic value of options exercised was $67,274 and $1,880 for the nine months ended September 30, 2014 and 2013.
During the three-month period ended September 30, 2014, 3,330 shares of common stock were issued upon cashless exercise of 10,000 options.
There were no options exercised in the three months ended September 30, 2014.
NOTE 12 – INCOME TAXES
The Company utilizes the asset and liability method of accounting for income taxes in accordance with FASB ASC 740-10.
(a) United States
Gulf Resources, Inc. is subject to the United States of America Tax law at a tax rate of 35%. No provision for the US federal income taxes has been made as the Company had no US taxable income for the three-month and nine-month periods ended September 30, 2014 and 2013, and management believes that its earnings are permanently invested in the PRC.
(b) BVI
Upper Class Group Limited, a subsidiary of Gulf Resources, Inc., was incorporated in the BVI and, under the current laws of the BVI, it is not subject to tax on income or capital gain in the BVI. Upper Class Group Limited did not generate assessable profit for the three-month and nine-month periods ended September 30, 2014 and 2013.
(c) Hong Kong
Hong Kong Jiaxing Industrial Limited, a subsidiary of Upper Class Group Limited, was incorporated in Hong Kong and is subject to Hong Kong profits tax. The Company is subject to Hong Kong taxation on its activities conducted in Hong Kong and income arising in or derived from Hong Kong. No provision for profits tax has been made as the Company has no assessable income for the three-month and nine-month periods ended September 30, 2014 and 2013. The applicable statutory tax rates for the three-month and nine-month periods ended September 30, 2014 and 2013 are 16.5%.
(d) PRC
Enterprise income tax (“EIT”) for SCHC and SYCI in the PRC is charged at 25% of the assessable profits.
The operating subsidiaries SCHC and SYCI are wholly foreign-owned enterprises (“FIE”) incorporated in the PRC and are subject to PRC Foreign Enterprise Income Tax Law.
On February 22, 2008, the Ministry of Finance (“MOF”) and the State Administration of Taxation (“SAT”) jointly issued Cai Shui [2008] Circular 1 (“Circular 1”). According to Article 4 of Circular 1, distributions of accumulated profits earned by a FIE prior to January 1, 2008 to foreign investor(s) in 2008 will be exempted from withholding tax (“WHT”) while distribution of the profit earned by an FIE after January 1, 2008 to its foreign investor(s) shall be subject to WHT at 5% effective tax rate.
As of September 30, 2014 and December 31, 2013, the accumulated distributable earnings under the Generally Accepted Accounting Principles (GAAP”) of PRC are $237,463,108 and $225,003,631, respectively. Since the Company intends to reinvest its earnings to further expand its businesses in mainland China, its foreign invested enterprises do not intend to declare dividends to their immediate foreign holding companies in the foreseeable future. Accordingly, as of September 30, 2014 and December 31, 2013, the Company has not recorded any WHT on the cumulative amount of distributable retained earnings of its foreign invested enterprises in China. As of September 30, 2014 and December 31, 2013, the unrecognized WHT are $10,766,110 and $10,133,056, respectively.
GULF RESOURCES, INC.
AND SUBSIDIARIES
NOTES TO CONDENSED CONSOLIDATED FINANCIAL STATEMENTS
SEPTEMBER 30, 2014
(Expressed in U.S. dollars)
(UNAUDITED)
NOTE 12 – INCOME TAXES – Continued
The Company’s tax returns are subject to the various tax authorities’ examination. The federal, state and local authorities of the United States may examine the Company’s tax returns filed in the United States for three years from the date of filing. The Company’s US tax returns since 2011 are currently subject to examination. Inland Revenue Department of Hong Kong may examine the Company’s tax returns filed in Hong Kong for seven years from date of filing. The Company’s Hong Kong tax returns since incorporation in year 2007 are currently subject to examination. The tax authorities of the PRC may examine the Company’s PRC tax returns for three years from the date of filing. The Company’s PRC tax returns since 2011 are currently subject to examination.
The components of the provision for income taxes from continuing operations are:
|
Three-Month Period
Ended September 30,
|
Nine-Month Period
Ended September 30,
|
|||||||||||||||
|
2014
|
2013
|
2014
|
2013
|
|||||||||||||
|
Current taxes – PRC
|
$
|
1,732,861
|
$
|
2,818,444
|
$
|
5,035,433
|
$
|
5,609,486
|
||||||||
|
Deferred taxes – PRC
|
-
|
-
|
-
|
-
|
||||||||||||
|
$
|
1,732,861
|
$
|
2,818,444
|
$
|
5,035,433
|
$
|
5,609,486
|
|||||||||
The effective income tax expenses differ from the PRC statutory income tax rate of 25% from continuing operations in the PRC as follows:
|
Three-Month Period
Ended September 30,
|
Nine-Month Period
Ended September 30,
|
||||||||||
|
Reconciliations
|
2014
|
2013
|
2014
|
2013
|
|||||||
|
Statutory income tax rate
|
25
|
%
|
25
|
%
|
25
|
%
|
25
|
%
|
|||
|
Non-taxable item
|
0
|
%
|
0
|
%
|
0
|
%
|
1
|
%
|
|||
|
Change in valuation allowance - US federal net operating loss
|
1
|
%
|
1
|
%
|
0
|
%
|
1
|
%
|
|||
|
Effective tax rate
|
26
|
%
|
26
|
%
|
25
|
%
|
27
|
%
|
|||
Significant components of the Company’s deferred tax assets and liabilities at September 30, 2014 and December 30, 2013 are as follows:
|
September 30, 2014
|
December 31, 2013
|
|||||||
|
Deferred tax liabilities
|
$
|
-
|
$
|
-
|
||||
|
Deferred tax assets:
|
||||||||
|
Allowance for obsolete and slow-moving inventories
|
$
|
1,642
|
$
|
1,657
|
||||
|
Impairment on property, plant and equipment
|
474,828
|
479,151
|
||||||
|
Exploration costs
|
1,820,449
|
1,837,025
|
||||||
|
Compensation costs of unexercised stock options
|
1,944,923
|
2,053,310
|
||||||
|
US federal net operating loss
|
9,657,767
|
9,272,734
|
||||||
|
Total deferred tax assets
|
13,899,609
|
13,643,877
|
||||||
|
Valuation allowance
|
(11,602,690
|
)
|
(11,326,044
|
) | ||||
|
Net deferred tax asset
|
$
|
2,296,919
|
$
|
2,317,833
|
||||
|
Current deferred tax asset
|
$
|
1,642
|
$
|
1,657
|
||||
|
Long-term deferred tax asset
|
$
|
2,295,277
|
$
|
2,316,176
|
||||
GULF RESOURCES, INC.
AND SUBSIDIARIES
NOTES TO CONDENSED CONSOLIDATED FINANCIAL STATEMENTS
SEPTEMBER 30, 2014
(Expressed in U.S. dollars)
(UNAUDITED)
NOTE 12 – INCOME TAXES – Continued
The increase in valuation allowance for each of the three-month period ended September 30, 2014 and 2013 is $57,219 and $78,594, respectively, and nine-month period ended September 30, 2014 and 2013 is $276,646 and $326,287, respectively.
There were no unrecognized tax benefits and accrual for uncertain tax positions as of September 30, 2014 and December 31, 2013.
NOTE 13 – BUSINESS SEGMENTS
The Company has three reportable segments: bromine, crude salt and chemical products. The reportable segments are consistent with how management views the markets served by the Company and the financial information that is reviewed by its chief operating decision maker.
An operating segment’s performance is primarily evaluated based on segment operating income, which excludes share-based compensation expense, certain corporate costs and other income not associated with the operations of the segment. These corporate costs (income) are separately stated below and also include costs that are related to functional areas such as accounting, treasury, information technology, legal, human resources, and internal audit. The Company believes that segment operating income, as defined above, is an appropriate measure for evaluating the operating performance of its segments. All the customers are located in PRC.
|
Three-Month
Period Ended September 30, 2014
|
Bromine*
|
Crude
Salt*
|
Chemical
Products
|
Segment
Total
|
Corporate
|
Total
|
||||||||||||||||||
|
Net revenue
(external customers)
|
$
|
15,973,528
|
$
|
2,655,028
|
$
|
12,478,408
|
$
|
31,106,964
|
$
|
-
|
$
|
31,106,964
|
||||||||||||
|
Net revenue
(intersegment)
|
832,946
|
-
|
-
|
832,946
|
-
|
832,946
|
||||||||||||||||||
|
Income (loss) from operations before taxes
|
3,131,684
|
(431,901
|
)
|
4,161,811
|
6,861,594
|
(167,005
|
)
|
6,694,589
|
||||||||||||||||
|
Income taxes
|
793,882
|
(109,510
|
) |
1,048,489
|
1,732,861
|
-
|
1,732,861
|
|||||||||||||||||
|
Income (loss) from operations after taxes
|
2,337,802
|
(322,391
|
)
|
3,113,322
|
5,128,733
|
(167,005
|
)
|
4,961,728
|
||||||||||||||||
|
Total assets
|
190,832,648
|
54,799,590
|
75,322,416
|
320,954,654
|
43,825
|
320,998,479
|
||||||||||||||||||
|
Depreciation and amortization
|
4,266,547
|
1,638,806
|
887,710
|
6,793,063
|
-
|
6,793,063
|
||||||||||||||||||
|
Capital expenditures
|
5,342,659
|
1,116,591
|
-
|
6,459,250
|
-
|
6,459,250
|
||||||||||||||||||
|
Three-Month
Period Ended September 30, 2013
|
Bromine*
|
Crude
Salt*
|
Chemical
Products
|
Segment
Total
|
Corporate
|
Total
|
||||||||||||||||||
|
Net revenue
(external customers)
|
$
|
17,093,087
|
$
|
3,902,979
|
$
|
11,939,211
|
$
|
32,935,277
|
$
|
-
|
$
|
32,935,277
|
||||||||||||
|
Net revenue
(intersegment)
|
781,866
|
-
|
-
|
781,866
|
-
|
781,866
|
||||||||||||||||||
|
Income (loss) from operations before taxes
|
5,876,150
|
1,635,755
|
3,740,278
|
11,252,183
|
(359,663
|
)
|
10,892,520
|
|||||||||||||||||
|
Income taxes
|
1,452,755
|
425,640
|
940,049
|
2,818,444
|
-
|
2,818,444
|
||||||||||||||||||
|
Income (loss) from operations after taxes
|
4,423,395
|
1,210,115
|
2,800,229
|
8,433,739
|
(359,663
|
)
|
8,074,076
|
|||||||||||||||||
|
Total assets
|
180,313,532
|
58,306,651
|
63,073,106
|
301,693,289
|
32,604
|
301,725,893
|
||||||||||||||||||
|
Depreciation and amortization
|
4,123,370
|
1,873,318
|
885,945
|
6,882,633
|
-
|
6,882,633
|
||||||||||||||||||
|
Capital expenditures
|
238,689
|
69,933
|
6,091
|
314,713
|
-
|
314,713
|
||||||||||||||||||
GULF RESOURCES, INC.
AND SUBSIDIARIES
NOTES TO CONDENSED CONSOLIDATED FINANCIAL STATEMENTS
SEPTEMBER 30, 2014
(Expressed in U.S. dollars)
(UNAUDITED)
NOTE 13 – BUSINESS SEGMENTS – Continued
|
Nine-Month
Period Ended September 30, 2014
|
Bromine*
|
Crude
Salt*
|
Chemical
Products
|
Segment
Total
|
Corporate
|
Total
|
||||||||||||||||||
|
Net revenue
(external customers)
|
$
|
43,950,056
|
$
|
8,012,368
|
$
|
36,489,530
|
$
|
88,451,954
|
$
|
-
|
$
|
88,451,954
|
||||||||||||
|
Net revenue
(intersegment)
|
2,453,779
|
-
|
-
|
2,453,779
|
-
|
2,453,779
|
||||||||||||||||||
|
Income (loss) from operations before taxes
|
7,748,981
|
94,609
|
12,123,116
|
19,966,706
|
(138,901
|
)
|
19,827,805
|
|||||||||||||||||
|
Income taxes
|
1,964,367
|
17,483
|
3,053,583
|
5,035,433
|
-
|
5,035,433
|
||||||||||||||||||
|
Income (loss) from operations after taxes
|
5,784,614
|
77,126
|
9,069,533
|
14,931,273
|
(138,901
|
)
|
14,792,372
|
|||||||||||||||||
|
Total assets
|
190,832,648
|
54,799,590
|
75,322,416
|
320,954,654
|
43,825
|
320,998,479
|
||||||||||||||||||
|
Depreciation and amortization
|
13,194,940
|
4,738,524
|
2,668,597
|
20,602,061
|
-
|
20,602,061
|
||||||||||||||||||
|
Capital expenditures
|
5,342,659
|
1,116,591
|
-
|
6,459,250
|
-
|
6,459,250
|
||||||||||||||||||
|
Nine-Month
Period Ended September 30, 2013
|
Bromine*
|
Crude
Salt*
|
Chemical
Products
|
Segment
Total
|
Corporate
|
Total
|
||||||||||||||||||
|
Net revenue
(external customers)
|
$
|
46,300,730
|
$
|
9,983,741
|
$
|
32,007,282
|
$
|
88,291,753
|
$
|
-
|
$
|
88,291,753
|
||||||||||||
|
Net revenue
(intersegment)
|
2,174,342
|
-
|
-
|
2,174,342
|
-
|
2,174,342
|
||||||||||||||||||
|
Income (loss) from operations before taxes
|
10,086,575
|
2,902,613
|
9,408,993
|
22,398,181
|
(1,521,438
|
)
|
20,876,743
|
|||||||||||||||||
|
Income taxes
|
2,574,710
|
668,660
|
2,366,116
|
5,609,486
|
-
|
5,609,486
|
||||||||||||||||||
|
Income (loss) from operations after taxes
|
7,511,866
|
2,233,952
|
7,042,877
|
16,788,695
|
(1,521,438
|
)
|
15,267,257
|
|||||||||||||||||
|
Total assets
|
180,313,532
|
58,306,651
|
63,073,106
|
301,693,289
|
32,604
|
301,725,893
|
||||||||||||||||||
|
Depreciation and amortization
|
12,811,261
|
5,120,004
|
2,636,907
|
20,568,172
|
-
|
20,568,172
|
||||||||||||||||||
|
Capital expenditures
|
238,689
|
69,933
|
6,091
|
314,713
|
-
|
314,713
|
||||||||||||||||||
* Certain common production overheads, operating and administrative expenses and asset items (mainly cash and certain office equipment) of bromine and crude salt segments in SCHC were split by reference to the average selling price and production volume of respective segment.
|
Three-Month Period
Ended September 30,
|
Nine-Month Period
Ended September 30,
|
|||||||||||||||
|
Reconciliations
|
2014
|
2013
|
2014
|
2013
|
||||||||||||
|
Total segment operating income
|
$
|
6,861,594
|
$
|
11,252,183
|
$
|
19,966,706
|
$
|
22,398,181
|
||||||||
|
Corporate costs
|
(167,005
|
)
|
(359,663
|
)
|
(138,901
|
)
|
(1,521,438
|
)
|
||||||||
|
Income from operations
|
6,694,589
|
10,892,520
|
19,827,805
|
20,876,743
|
||||||||||||
|
Other income, net of expense
|
76,675
|
35,653
|
197,181
|
81,336
|
||||||||||||
|
Income before taxes
|
$
|
6,771,264
|
$
|
10,928,173
|
$
|
20,024,986
|
$
|
20,958,079
|
||||||||
GULF RESOURCES, INC.
AND SUBSIDIARIES
NOTES TO CONDENSED CONSOLIDATED FINANCIAL STATEMENTS
SEPTEMBER 30, 2014
(Expressed in U.S. dollars)
(UNAUDITED)
NOTE 13 – BUSINESS SEGMENTS – Continued
The following table shows the major customer(s) (10% or more) for the three-month period ended September 30, 2014.
|
Number
|
Customer
|
Bromine
(000’s)
|
Crude Salt
(000’s)
|
Chemical Products
(000’s)
|
Total
Revenue
(000’s)
|
Percentage of
Total Revenue (%)
|
|||||||||||||||||
|
1
|
Shandong Morui
Chemical Company
Limited
|
$
|
2,212
|
$
|
673
|
$
|
1,916
|
$
|
4,801
|
15.4%
|
|||||||||||||
|
TOTAL
|
$
|
2,212
|
$
|
673
|
$
|
1,916
|
$
|
4,801
|
15.4%
|
||||||||||||||
The following table shows the major customer(s) (10% or more) for the nine-month period ended September 30, 2014.
|
Number
|
Customer
|
Bromine
(000’s)
|
Crude Salt
(000’s)
|
Chemical Products
(000’s)
|
Total
Revenue
(000’s)
|
Percentage of
Total Revenue (%)
|
|||||||||||||||||
|
1
|
Shandong Morui
Chemical Company
Limited
|
$
|
6,300
|
$
|
1,936
|
$
|
5,237
|
$
|
13,473
|
15.2%
|
|||||||||||||
|
TOTAL
|
$
|
6,300
|
$
|
1,936
|
$
|
5,237
|
$
|
13,473
|
15.2%
|
||||||||||||||
The following table shows the major customer(s) (10% or more) for the three-month period ended September 30, 2013.
|
Number
|
Customer
|
Bromine
(000’s)
|
Crude Salt
(000’s)
|
Chemical Products
(000’s)
|
Total
Revenue
(000’s)
|
Percentage of
Total Revenue (%)
|
|||||||||||||||||
|
1
|
Shandong Morui
Chemical Company
Limited
|
$
|
2,078
|
$
|
934
|
$
|
1,223
|
$
|
4,235
|
12.9%
|
|||||||||||||
|
TOTAL
|
$
|
2,078
|
$
|
934
|
$
|
1,223
|
$
|
4,235
|
12.9%
|
||||||||||||||
The following table shows the major customer(s) (10% or more) for the nine-month period ended September 30, 2013.
|
Number
|
Customer
|
Bromine
(000’s)
|
Crude Salt
(000’s)
|
Chemical Products
(000’s)
|
Total
Revenue
(000’s)
|
Percentage of
Total Revenue (%)
|
|||||||||||||||||
|
1
|
Shandong Morui
Chemical Company
Limited
|
$
|
5,425
|
$
|
2,428
|
$
|
3,278
|
$
|
11,131
|
12.6%
|
|||||||||||||
|
TOTAL
|
$
|
5,425
|
$
|
2,428
|
$
|
3,278
|
$
|
11,131
|
12.6%
|
||||||||||||||
NOTE 14 – MAJOR SUPPLIERS
During the three-month and nine-month periods ended September 30, 2014, the Company purchased 89.0% and 89.6% of its raw materials from its top five suppliers, respectively. As of September 30, 2014, amounts due to those suppliers included in accounts payable were $3,710,837. During the three-month and nine-month periods ended September 30, 2013, the Company purchased 89.9% and 85.5% of its raw materials from its top five suppliers, respectively. As of September 30, 2013, amounts due to those suppliers included in accounts payable were $4,381,537.This concentration makes the Company vulnerable to a near-term severe impact, should the relationships be terminated.
GULF RESOURCES, INC.
AND SUBSIDIARIES
NOTES TO CONDENSED CONSOLIDATED FINANCIAL STATEMENTS
SEPTEMBER 30, 2014
(Expressed in U.S. dollars)
(UNAUDITED)
NOTE 15 – CUSTOMER CONCENTRATION
The Company sells a substantial portion of its products to a limited number of customers. During the three-month and nine-month periods ended September 30, 2014, the Company sold 42.4% of its products to its top five customers, respectively. As of September 30, 2014, amounts due from these customers were $24,632,838. During the three-month and nine-month periods ended September 30, 2013, the Company sold 40.2% and 40.2% of its products to its top five customers, respectively. As of September 30, 2013, amounts due from these customers were $19,028,426.This concentration makes the Company vulnerable to a near-term severe impact, should the relationships be terminated.
NOTE 16 – FAIR VALUE OF FINANCIAL INSTRUMENTS
The carrying values of financial instruments, which consist of cash, accounts receivable and accounts payable and other payables, approximate their fair values due to the short-term nature of these instruments. There were no material unrecognized financial assets and liabilities as of September 30, 2014 and December 31, 2013.
NOTE 17 – RESEARCH AND DEVELOPMENT EXPENSES
The total research and development expenses recognized in the income statements during the three-month and nine-month periods ended September 30, 2014 were $30,985 and $94,322, respectively, of which the consumption of bromine produced by the Company amounted to $8,547 and $26,054, respectively. The total research and development expenses recognized in the income statements during the three-month and nine-month periods ended September 30, 2013 were $33,198 and $105,380, respectively, of which the consumption of bromine produced by the Company amounted to $8,803 and $27,385, respectively.
NOTE 18 – CAPITAL COMMITMENT AND OPERATING LEASE COMMITMENTS
As of September 30, 2014, the Company has leased a real property adjacent to Factory No. 1, with the related production facility, channels and ducts, other production equipment and the buildings located on the property, under capital lease. The future minimum lease payments required under capital lease, together with the present value of such payments, are included in the table show below.
The Company has leased nine pieces of land under non-cancelable operating leases, which are fixed in rentals and expired through December 2021, December 2030, December 2031, December 2032, December 2040, February 2059, August 2059 and June 2060, respectively. The Company accounts for the leases as operating leases.
The following table sets forth the Company’s contractual obligations as of September 30, 2014:
|
Capital Lease Obligations
|
Operating Lease Obligations
|
Property Management Fees
|
Exploration
Project Expenditure
|
|||||||||||||
|
Payable within:
|
||||||||||||||||
|
the next 12 months
|
$ | 305,088 | $ | 980,497 | $ | 101,403 | $ | 568,890 | ||||||||
|
the next 13 to 24 months
|
305,088 | 999,498 | 101,403 | - | ||||||||||||
|
the next 25 to 36 months
|
305,088 | 1,022,358 | 101,403 | - | ||||||||||||
|
the next 37 to 48 months
|
305,088 | 1,043,220 | 25,351 | - | ||||||||||||
|
the next 49 to 60 months
|
305,088 | 1,068,182 | - | - | ||||||||||||
|
thereafter
|
3,355,963 | 20,776,768 | - | - | ||||||||||||
|
Total
|
$ | 4,881,403 | $ | 25,890,523 | $ | 329,560 | $ | 568,890 | ||||||||
|
Less: Amount representing interest
|
(1,915,187 | ) | ||||||||||||||
|
Present value of net minimum lease payments
|
$ | 2,966,216 | ||||||||||||||
GULF RESOURCES, INC.
AND SUBSIDIARIES
NOTES TO CONDENSED CONSOLIDATED FINANCIAL STATEMENTS
SEPTEMBER 30, 2014
(Expressed in U.S. dollars)
(UNAUDITED)
NOTE 18 – CAPITAL COMMITMENT AND OPERATING LEASE COMMITMENTS – Continued
Rental expenses related to operating leases of the Company amounted to $244,097 and $239,111, which were charged to the income statements for the three-month ended September 30, 2014 and 2013, respectively. Rental expenses related to operating leases of the Company amounted to $733,138 and $710,643, which were charged to the income statements for the nine-month ended September 30, 2014 and 2013, respectively.
Cautionary Note Regarding Forward-Looking Statements
The discussion below contains “forward-looking statements” within the meaning of the Private Securities Litigation Reform Act of 1995, Section 27A of the Securities Act, and Section 21E of the Exchange Act. We have used words such as “believes,” “intends,” “anticipates,” “expects” and similar expressions to identify forward-looking statements. These statements are based on information currently available to us and are subject to a number of risks and uncertainties that may cause our actual results of operations, financial condition, cash flows, performance, business prospects and opportunities and the timing of certain events to differ materially from those expressed in, or implied by, these statements. These risks, uncertainties and other factors include, without limitation, those matters discussed in Item 1A of Part I of our 2013 Form 10-K. Except as expressly required by the federal securities laws, we undertake no obligation to update such factors or to publicly announce the results of any of the forward-looking statements contained herein to reflect future events, developments, or changed circumstances, or for any other reason. The following discussion should be read in conjunction with our consolidated financial statements and notes thereto appearing in our 2013 Form 10-K and Item 1A, “Risk Factors” for the year ended December 31, 2013.
Overview
Gulf Resources, Inc. conducts operations through its two wholly-owned China subsidiaries, SCHC and SYCI. Our business is also reported in these segments, Bromine, Crude Salt, and Chemical Products.
Through SCHC, we produce and sell bromine and crude salt. We are one of the largest producers of bromine in China, as measured by production output. Elemental bromine is used to manufacture a wide variety of brominated compounds used in industry and agriculture. Bromine is commonly used in brominated flame retardants, fumigants, water purification compounds, dyes, medicines, and disinfectants.
Through SYCI, we manufacture and sell chemical products that are used in oil and gas field exploration, oil and gas distribution, oil field drilling, wastewater processing, papermaking chemical agents and inorganic chemicals.
Our Corporate History
We were incorporated in Delaware on February 28, 1989. From November 1993 through August 2006, we were engaged in the business of owning, leasing and operating coin and debit card pay-per copy photocopy machines, fax machines, microfilm reader-printers and accessory equipment under the name “Diversifax, Inc.”. Due to the increased use of internet services, demand for our services declined sharply, and in August 2006, our Board of Directors decided to discontinue our operations.
Upper Class Group Limited, incorporated in the British Virgin Islands in July 2006, acquired all the outstanding stock of SCHC, a company incorporated in Shouguang City, Shandong Province, PRC, in May 2005. At the time of the acquisition, members of the family of Mr. Ming Yang, our president and former chief executive officer, owned approximately 63.20% of the outstanding shares of Upper Class Group Limited. Since the ownership of Upper Class Group Limited and SCHC was then substantially the same, the acquisition was accounted for as a transaction between entities under common control, whereby Upper Class Group Limited recognized the assets and liabilities transferred at their carrying amounts.
On December 12, 2006, our company, then known as Diversifax, Inc., a public “shell” company, acquired Upper Class Group Limited and SCHC. Under the terms of the agreement, the stockholders of Upper Class Group Limited received 13,250,000 (restated for the 2-for-1 stock split in 2007 and the 1-for-4 stock split in 2009) shares of voting common stock of Gulf Resources, Inc. in exchange for all outstanding shares of Upper Class Group Limited. Members of the Yang family received approximately 62% of our common stock as a result of the acquisition. Under accounting principles generally accepted in the United States, the share exchange is considered to be a capital transaction rather than a business combination. That is, the share exchange is equivalent to the issuance of stock by Upper Class Group Limited for the net assets of Gulf Resources, Inc., accompanied by a recapitalization, and is accounted for as a change in capital structure. Accordingly, the accounting for the share exchange is identical to that resulting from a reverse acquisition, except no goodwill is recorded. Under reverse takeover accounting, the post reverse acquisition comparative historical financial statements of the legal acquirer, Gulf Resources, Inc., are those of the legal acquiree, Upper Class Group Limited. Share and per share amounts stated have been retroactively adjusted to reflect the share exchange. On February 20, 2007, we changed our corporate name to Gulf Resources, Inc.
On February 5, 2007, we acquired SYCI, a company incorporated in PRC, in October 2000. Under the terms of the acquisition agreement, the stockholders of SYCI received a total of 8,094,059 (restated for the 2-for-1 stock split in 2007 and the 1-for-4 stock split in 2009) shares of common stock of Gulf Resources, Inc. in exchange for all outstanding shares of SYCI's common stock. Simultaneously with the completion of the acquisition, a dividend of $2,550,000 was paid to the former stockholders of SYCI. At the time of the acquisition, approximately 49.1% of the outstanding shares of SYCI were owned by Ms. Yu, Mr. Yang’s wife, and the remaining 50.9% of the outstanding shares of SYCI were owned by SCHC, all of whose outstanding shares were owned by Mr. Yang and his wife. Since the ownership of Gulf Resources, Inc. and SYCI are substantially the same, the acquisition was accounted for as a transaction between entities under common control, whereby Gulf Resources, Inc. recognized the assets and liabilities of SYCI at their carrying amounts. Share and per share amounts have been retroactively adjusted to reflect the acquisition.
To satisfy certain ministerial requirements necessary to confirm certain government approvals required in connection with the acquisition of SCHC by Upper Class Group Limited, all of the equity interest of SCHC were transferred to a newly formed Hong Kong corporation named Hong Kong Jiaxing Industrial Limited (“Hong Kong Jiaxing”) all of the outstanding shares of which are owned by Upper Class Group Limited. The transfer of all of the equity interest of SCHC to Hong Kong Jiaxing received approval from the local State Administration of Industry and Commerce on December 10, 2007.
As a result of the transactions described above, our corporate structure is linear. That is Gulf Resources owns 100% of the outstanding shares of Upper Class Group Limited, which owns 100% of the outstanding shares of Hong Kong Jiaxing, which owns 100% of the outstanding shares of SCHC, which owns 100% of the outstanding shares of SYCI.
On October 12, 2009 we completed a 1-for-4 reverse stock split of our common stock, such that for each four shares outstanding prior to the stock split there was one share outstanding after the reverse stock split. All shares of common stock referenced in this report have been adjusted to reflect the stock split figures. On October 27, 2009 our shares began trading on the NASDAQ Global Select Market under the ticker symbol “GFRE” and on June 30, 2011 we changed our ticker symbol to “GURE” to better reflect of our corporate name.
Our current corporate structure chart is set forth in the following diagram:
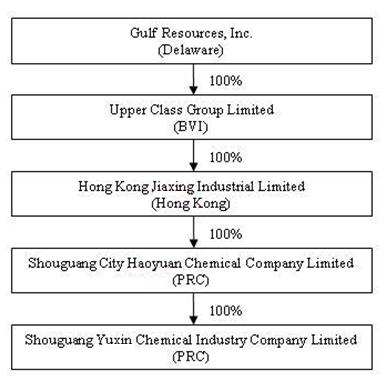
As a result of our acquisitions of SCHC and SYCI, our historical financial statements and the information presented below reflects the accounts of SCHC and SYCI. The following discussion should be read in conjunction with our consolidated financial statements and notes thereto appearing elsewhere in this report.
RESULTS OF OPERATIONS
The following table presents certain information derived from the consolidated statements of operations, cash flows and stockholders equity for the three-month and nine-month periods ended September 30, 2014 and 2013.
Comparison of the Three-Month Period Ended September 30, 2014 and 2013
|
Three-Month
Period Ended
September 30, 2014
|
Three-Month
Period Ended
September 30, 2013
|
% Change
|
|||||||||
|
Net revenue
|
$ | 31,106,964 | $ | 32,935,277 | (5.6 | %) | |||||
|
Cost of net revenue
|
$ | (21,901,056 | ) | $ | (22,006,256 | ) | (0.5 | %) | |||
|
Gross profit
|
$ | 9,205,908 | $ | 10,929,021 | (16 | %) | |||||
|
Sales, marketing and other operating expenses
|
$ | (29,064 | ) | $ | (25,378 | ) | 15 |
%
|
|||
|
Research and development costs
|
$ | (30,985 | ) | $ | (33,198 | ) | (7 | %) | |||
|
Write-off/Impairment on property, plant and equipment
|
$ | (673,705 | ) | $ | (214 | ) | 31471 | 5% | |||
|
General and administrative expenses
|
$ | (1,894,507 | ) | $ | (1,962,496 | ) | (3 | %) | |||
|
Gain on relocation of factory
|
$ | - | $ | 1,877,779 | (100 | %) | |||||
|
Other operating income
|
$ | 116,942 | $ | 107,006 | 9 |
%
|
|||||
|
Income from operations
|
$ | 6,694,589 | $ | 10,892,520 | (39 | %) | |||||
|
Other income, net
|
$ | 76,675 | $ | 35,653 | 115 |
%
|
|||||
|
Income before taxes
|
$ | 6,771,264 | $ | 10,928,173 | (38 | %) | |||||
|
Income taxes
|
$ | (1,732,861 | ) | $ | (2,818,444 | ) | (39 | %) | |||
|
Net income
|
$ | 5,038,403 | $ | 8,109,729 | (38 | %) | |||||
Net revenue. Net revenue was $31,106,964 for three-month period ended September 30, 2014, a decrease of approximately 1.8 million (or 5.6%) as compared to the same period in 2013. This decrease was attributable to the decrease in our bromine and crude salt segments. Revenue from the bromine products segment decreased from $17,093,087 for the three-month period ended September 30, 2013 to $15,973,528 for the same period in 2014, a decrease of approximately 6.5%. Revenue from the crude salt segment decreased from $3,902,979 for the three-month period ended September 30, 2013 to $2,655,028 for the same period in 2014, a decrease of approximately 32%.
Revenue from the chemical products segment products increased from $11,939,211 for the three-month period ended September 30, 2013 to $12,478,408 for the same period in 2014, an increase of approximately 4.5%.
|
Net Revenue by Segment
|
|||||||||||||||||||
|
Three-Month Period Ended
|
Three-Month Period Ended
|
Percent change
Increase/Decrease
|
|||||||||||||||||
|
September 30, 2014
|
September 30, 2013
|
of Net Revenue
|
|||||||||||||||||
|
Segment
|
% of total
|
% of total
|
|||||||||||||||||
|
Bromine
|
$
|
15,973,528
|
51
|
%
|
$
|
17,093,087
|
52
|
%
|
(6.5
|
%)
|
|||||||||
|
Crude Salt
|
$
|
2,655,028
|
9
|
%
|
$
|
3,902,979
|
12
|
%
|
(32.0
|
%)
|
|||||||||
|
Chemical Products
|
$
|
12,478,408
|
40
|
%
|
$
|
11,939,211
|
36
|
%
|
4.5
|
%
|
|||||||||
|
Total sales
|
$
|
31,106,964
|
100
|
%
|
$
|
32,935,277
|
100
|
%
|
(5.6
|
%)
|
|||||||||
|
Bromine and crude salt segments
|
Three-Month Period Ended
|
Percentage Change
|
|||||||||
|
product sold in tonnes
|
September 30, 2014
|
September 30, 2013
|
Increase /Decrease
|
||||||||
|
Bromine (excluded volume sold to SYCI)
|
5,596
|
5,797
|
(3
|
%)
|
|||||||
|
Crude Salt
|
95,234
|
90,092
|
6
|
%
|
|||||||
|
Three-Month Period Ended
|
Percentage Change
|
||||||||||
|
Chemical products segment sold in tonnes
|
September 30, 2014
|
September 30, 2013
|
Increase
|
||||||||
|
Oil and gas exploration additives
|
3,836
|
3,529
|
8.7
|
%
|
|||||||
|
Paper manufacturing additives
|
1,115
|
1,079
|
3.3
|
%
|
|||||||
|
Pesticides manufacturing additives
|
852
|
813
|
4.8
|
%
|
|||||||
|
Overall
|
5,803
|
5,421
|
7.0
|
%
|
|||||||
Bromine segment
The table below shows the changes in the average selling price and changes in the sales volume of bromine for three-month period ended September 30, 2014 from the same period in 2013.
|
Three-Month Period
Ended September 30,
|
||||
|
Decrease in net revenue of bromine as a result of:
|
2014 vs. 2013
|
|||
|
Decrease in average selling price
|
$
|
(535,721
|
)
|
|
|
Decrease in sales volume
|
$
|
(583,838
|
)
|
|
|
Total effect on net revenue of bromine
|
$
|
(1,119,559
|
)
|
|
The decrease in net revenue from our bromine segment was mainly due to the decrease in both the sales volume and selling price. The sales volume of bromine decreased from 5,797 tonnes for the three-month period ended September 30, 2013 to 5,596 tonnes for the same period in 2014, a decrease of 3%. The selling price of bromine decreased from $2,949 per tonne for the three-month period ended September 30, 2013 to $2,855 per tonne for the same period in 2014, a decrease of 3%. The major reason for the decrease in the sales volume and selling price of bromine was mainly attributable to the macro-economic tightening policy imposed by the PRC government beginning in the second half of 2011 to slow down the economy, which has affected our customers’ industries. As a result, we needed to offer competitive selling prices to our customers to compete with other bromine manufacturers. The average selling price for this quarter decreased $130 per tonne, as compared with the first quarter of 2014, which was $2,985 per tonne. We expect the average selling price of bromine to remain at the current level through the end of 2014 should the PRC government’s macro-economic tightening policy remain in place.
Crude salt segment
The table below shows the changes in the average selling price and changes in the sales volume of crude salt for three-month period ended September 30, 2014 from the same period in 2013.
|
Three-Month Period
Ended September 30,
|
||||
|
Increase/Decrease in net revenue of crude salt as a result of:
|
2014 vs. 2013
|
|||
|
Decrease in average selling price
|
$
|
(1,431,027
|
)
|
|
|
Increase in sales volume
|
$
|
183,076
|
||
|
Total effect on net revenue of crude salt
|
$
|
(1,247,951
|
)
|
|
The decrease in net revenue from our crude salt segment was mainly due to the decrease in the selling price of crude salt. The selling price of crude salt decreased by 36% from $43.32 per tonne for the three-month period ended September 30, 2013 to $27.88 per tonne for the same period in 2014. The decrease in the selling price was mainly due to the macro-economic tightening policy imposed by the PRC government to slow down the economy, which has affected our customers’ industries.
We noted a downward trend in the average selling price of crude salt since the third quarter of 2013. The average selling price decreased 28% from the first quarter of 2014 to the third quarter of 2014. We expect the average selling price of crude salt to remain at current levels through the end of 2014.
Chemical products segment
|
Product Mix of Chemical Products Segment
|
Percent
|
|||||||||||||||||
|
Three-Month Period Ended
|
Three-Month Period Ended
|
Change of
|
||||||||||||||||
|
September 30, 2014
|
September 30, 2013
|
Net Revenue
|
||||||||||||||||
|
Chemical Products
|
% of total
|
% of total
|
||||||||||||||||
|
Oil and gas exploration additives
|
$
|
7,129,171
|
57
|
%
|
$
|
6,828,309
|
57
|
%
|
4
|
%
|
||||||||
|
Paper manufacturing additives
|
$
|
1,272,376
|
10
|
%
|
$
|
1,263,919
|
11
|
%
|
1
|
%
|
||||||||
|
Pesticides manufacturing additives
|
$
|
4,076,861
|
33
|
%
|
$
|
3,846,983
|
32
|
%
|
6
|
%
|
||||||||
|
Total sales
|
$
|
12,478,408
|
100
|
%
|
$
|
11,939,211
|
100
|
%
|
5
|
%
|
||||||||
Net revenue from our chemical products segment increased from $11,939,211 for the three-month period ended September 30, 2013 to $12,478,408 for the same period in 2014, an increase of approximately 5%. The increase was mainly attributable to the increase in demand for all of our chemical products. Our oil and gas exploration chemicals are the most popular products within the chemical products segment, which contributed $7,129,171 (or 57%) and $6,828,309 (or 57%) of our chemical segment revenue for the three-month period ended September 30, 2014 and 2013, respectively, with an increase of $300,862, or 4%. Net revenue from our paper manufacturing additives increased from $1,263,919 for the three-month period ended September 30, 2013 to $1,272,376 for the same period in 2014, an increase of approximately 1%. Net revenue from our pesticides manufacturing additives increased from $3,846,983 for the three-month period ended September 30, 2013 to $4,076,861 for the same period in 2014, an increase of approximately 6%.
The table below shows the changes in the average selling price and changes in the sales volume of major chemical products for three-month period ended September 30, 2014 from the same period in 2013.
|
Increase/Decrease in net revenue,
for the three-month period ended September 30,
2014 vs. 2013, as a result of:
|
Oil and gas exploration additives
|
Paper manufacturing additives
|
Pesticides manufacturing additives
|
Total
|
||||||||||||
|
Increase/Decrease in average selling price
|
$
|
(281,426
|
)
|
$
|
(33,169
|
)
|
$
|
44,300
|
$
|
(270,295
|
)
|
|||||
|
Increase in sales volume
|
$
|
582,288
|
$
|
41,625
|
$
|
185,579
|
$
|
809,492
|
||||||||
|
Total effect on net revenue of chemical products
|
$
|
300,862
|
$
|
8,456
|
$
|
229,879
|
$
|
539,197
|
||||||||
Cost of Net Revenue.
|
Cost of Net Revenue by Segment
|
% Change
|
|||||||||||||||||
|
Three-Month Period Ended
|
Three-Month Period Ended
|
of Cost of
|
||||||||||||||||
|
September 30, 2014
|
September 30, 2013
|
Net Revenue
|
||||||||||||||||
|
Segment
|
% of total
|
% of total
|
||||||||||||||||
|
Bromine
|
$
|
11,181,746
|
51
|
%
|
$
|
11,710,778
|
53
|
%
|
(4.5
|
%)
|
||||||||
|
Crude Salt
|
$
|
2,714,874
|
12
|
%
|
$
|
2,380,562
|
11
|
%
|
14.0
|
%
|
||||||||
|
Chemical Products
|
$
|
8,004,436
|
37
|
%
|
$
|
7,914,916
|
36
|
%
|
1.1
|
%
|
||||||||
|
Total
|
$
|
21,901,056
|
100
|
%
|
$
|
22,006,256
|
100
|
%
|
(0.5
|
%)
|
||||||||
Cost of net revenue reflects mainly the raw materials consumed and the direct salaries and benefits of staff engaged in the production process, electricity, depreciation and amortization of manufacturing plant and machinery and other manufacturing costs. Our cost of net revenue was $21,901,056 for the three-month period ended September 30, 2014, a decrease of $105,200 (or 0.5%) as compared to the same period in 2013. The decrease in overall cost of net revenue was mainly attributable to the decrease in purchase price of raw materials of bromine product segment.
Bromine production capacity and utilization of our factories
The table below represents the annual capacity and utilization ratios for all of our bromine producing properties:
|
Annual Production Capacity (in tonnes)
|
Utilization
Ratio (i)
|
||||||
|
Three-month period ended September 30, 2013
|
47,347
|
55%
|
|||||
|
Three-month period ended September 30, 2014
|
47,347
|
54%
|
|||||
|
Variance of the three-month period ended September 30, 2014 and 2013
|
-
|
(1%
|
)
|
||||
(i) Utilization ratio is calculated based on the annualized actual production volume in tonnes for the period divided by the annual production capacity in tonnes.
Our utilization ratio decreased by 1% for the three-month period ended September 30, 2014 as compared with the same period in 2013.
Bromine segment
For the three-month period ended September 30, 2014, the cost of net revenue for the bromine segment was $11,181,746, a decrease of $529,032 or 4.5% over the same period in 2013. The most significant components of the costs of net revenue for the bromine segment were the cost of raw materials and finished goods consumed of $4,967,567 (or 44%), depreciation and amortization of manufacturing plant and machinery of $3,987,538 (or 36%) and electricity of $901,481 (or 7%) for the three-month period ended September 30, 2014. For the three-month period ended September 30, 2013, the major components of the cost of net revenue were the cost of raw materials and finished goods consumed of $5,696,274 (or 49%), depreciation and amortization of manufacturing plant and machinery of $3,920,453 (or 33%) and electricity of $871,597 (or 7%). The cost structure changed as compared with the same period in 2013 where the contribution from the cost of raw materials and finished goods consumed decreased by 5% and depreciation and amortization of manufacturing plant and machinery increased by 3%. The decrease in net cost of net revenue was attributable mainly to the decrease in purchase price of raw material.
The table below represents the major production cost component of bromine per tonne for respective periods:
|
Per tonne production cost
|
Three-Month Period Ended
|
Three-Month Period Ended
|
|||||||||||||||
|
component of bromine segment
|
September 30, 2014
|
September 30, 2013
|
% Change
|
||||||||||||||
|
% of total
|
% of total
|
||||||||||||||||
|
Raw materials
|
$
|
888
|
44
|
%
|
$
|
983
|
49
|
%
|
(10
|
%)
|
|||||||
|
Depreciation and amortization
|
$
|
712
|
36
|
%
|
$
|
676
|
34
|
%
|
5
|
%
|
|||||||
|
Electricity
|
$
|
161
|
8
|
%
|
$
|
150
|
7
|
%
|
7
|
%
|
|||||||
|
Others
|
$
|
237
|
12
|
%
|
$
|
211
|
10
|
%
|
12
|
%
|
|||||||
|
Production cost of bromine per tonne
|
$
|
1,998
|
100
|
%
|
$
|
2,020
|
100
|
%
|
(1
|
%)
|
|||||||
Our production cost of bromine per tonne was $1,998 for the three-month period ended September 30, 2014, a decrease of 1% (or $22) as compared to the same period in 2013, which was attributable mainly to the component of the cost of raw materials consumed. The cost of raw materials consumed per tonne decreased by 10% as compared to the last comparison period, which was mainly attributable to the decrease in the purchase price of raw materials resulting from the macro-economic tightening policy imposed by the PRC government, which was offset by the increase in depreciation and amortization per tonne by 5% due to the relocation and the construction of the new factory No.3, which was completed in December 2013 and the depreciation of construction projects commenced in January 2014.
Crude salt segment
The cost of net revenue for our crude salt segment for the three-month period ended September 30, 2014 was $2,714,874, representing an increase of $334,312, or 14%, compared to $2,380,562 for the same period in 2013. The increase in cost was mainly due to the relocation and the construction of the new factory No.3, which was completed in December 2013 and the depreciation of construction projects commenced in January 2014.The significant cost components for the three-month period ended September 30, 2014 were depreciation and amortization of $1,836,322 (or 68%), resource taxes calculated based on crude salt sold of $309,359 (or 11%) and electricity of $219,306 (or 8%). The significant cost components for the three-month period ended September 30, 2013 were depreciation and amortization of $1,580,599 (or 67%), resource taxes calculated based on crude salt sold of $292,131 (or 12%) and electricity of $222,527 (or 9%). The table below represents the major production cost component of crude salt per ton for respective periods:
|
Per tonne production cost
|
Three-Month Period Ended
|
Three-Month Period Ended
|
|||||||||||||||
|
component of crude salt segment
|
September 30, 2014
|
September 30, 2013
|
% Change
|
||||||||||||||
|
% of total
|
% of total
|
||||||||||||||||
|
Depreciation and amortization
|
$
|
19.3
|
67
|
%
|
$
|
17.5
|
67
|
%
|
10
|
%
|
|||||||
|
Resource tax
|
$
|
3.2
|
12
|
%
|
$
|
3.2
|
12
|
%
|
-
|
||||||||
|
Electricity
|
$
|
2.3
|
9
|
%
|
$
|
2.5
|
9
|
%
|
(7
|
%)
|
|||||||
|
Others
|
$
|
3.7
|
12
|
%
|
$
|
3.2
|
12
|
%
|
16
|
%
|
|||||||
|
Production cost of crude salt per tonne
|
$
|
28.5
|
100
|
%
|
$
|
26.4
|
100
|
%
|
8
|
%
|
|||||||
Our production cost of crude salt per tonne was $28.5 for the three-month period ended September 30, 2014, an increase of 8% (or $2.1) as compared to the same period in 2013, which was attributable mainly to the components of depreciation and amortization of manufacturing plant and machinery. The significant percentage increase in depreciation and amortization per tonne by 10% was due to the relocation and the construction of the new factory No.3, which was completed in December 2013 and the depreciation of construction projects commenced in January 2014.
Chemical products segment
Cost of net revenue for our chemical products segment for the three-month period ended September 30, 2014, was $8,004,436, representing an increase of $89,520 or 1.1% over the same period in 2013. The significant costs were the cost of raw material and finished goods consumed of $6,712,327 (or 84%) and $6,870,302 (or 87%) and depreciation and amortization of manufacturing plant and machinery of $709,469 (or 9%) and $708,022 (or 9%) for each of the three-month period ended September 30, 2014 and 2013, respectively.
Gross Profit. Gross profit was $9,205,908, or 30%, of net revenue for three-month period ended September 30, 2014 compared to $10,929,021, or 33%, of net revenue for the same period in 2013. The decrease in gross profit percentage was primarily attributable to a decrease in the margin percentage of bromine and crude salt segments.
|
Gross Profit by Segment
|
% Point Change
|
||||||||||||||||
|
Three-Month Period Ended
|
Three-Month Period Ended
|
of Gross
|
|||||||||||||||
|
September 30, 2014
|
September 30, 2013
|
Profit Margin
|
|||||||||||||||
|
Segment
|
Gross Profit Margin
|
Gross Profit Margin
|
|||||||||||||||
|
Bromine
|
$
|
4,791,782
|
30
|
%
|
$
|
5,382,309
|
32
|
%
|
(2
|
%)
|
|||||||
|
Crude Salt
|
$
|
(59,846
|
)
|
(2
|
%)
|
$
|
1,522,417
|
39
|
%
|
(41
|
%)
|
||||||
|
Chemical Products
|
$
|
4,473,972
|
36
|
%
|
$
|
4,024,295
|
34
|
%
|
2
|
%
|
|||||||
|
Total Gross Profit
|
$
|
9,205,908
|
30
|
%
|
$
|
10,929,021
|
33
|
%
|
(3
|
%)
|
|||||||
Bromine segment
For the three-month period ended September 30, 2014, the gross profit margin for our bromine segment was 30% compared to 32% for the same period in 2013. This 2% decrease in our gross profit margin is mainly due to the PRC government’s macro-economic tightening policy to slow down the economy, our selling price in the three-month ended September 30, 2014 was affected. We cut the average selling price of bromine from $2,949 per tonne for the three-month period ended September 30, 2013 to $2,855 per tonne for the same period in 2014, a decrease of 3%, in order to compete with other bromine manufacturers. We expect that the average selling price and gross profit margin of bromine will remain at current level towards the end of 2014 should the PRC government’s macro-economic tightening policy remain in place.
Crude salt segment
For the three-month period ended September 30, 2014 the gross profit margin for our crude salt segment was -2% compared to 39% for the same period in 2013. This 41% decrease in our gross profit margin is mainly attributable to the selling price decreased from $43.32 per tonne for the three-month period ended September 30, 2013 to $27.88 per tonne for the same period in 2014, a decrease of 36%, due to the macro-economic tightening policy imposed by the PRC government, which has affected our customers’ industries.
Chemical products segment
The gross profit margin for our chemical products segment for the three-month period ended September 30, 2014 was 36% compared to 34% for the same period in 2013, an increase of 2%. This 2% increase in our gross profit margin was mainly a result of the increase in average selling price of pesticides manufacturing additives, decrease in the purchase price of raw materials and decrease in factory overhead per unit produced due to higher volume of production.
Research and Development Costs. The total research and development costs incurred for the three-month period ended September 30, 2014 and 2013 were $30,985 and $33,198, respectively, a decrease of 7%. Research and development costs for the three-month period ended September 30, 2014 and 2013 represented raw materials used by SYCI for testing the manufacturing routine.
Write-off/Impairment on property, plant and equipment. Write-off on property, plant and equipment for the three-month period ended September 30, 2014 and 2013 were $673,705 and $214, respectively, an increase of 314715%. Write-off on property, plant and equipment of $673,705 for the three-month period ended September 30, 2014 represented the write-off of certain protective shells to transmission pipelines and ducts replaced during the third phase enhancement project that started in August 2014.
General and Administrative Expenses. General and administrative expenses were $1,894,507 for the three-month period ended September 30, 2014, a decrease of $67,989 (or 3%) as compared to $1,962,496 for the same period in 2013. This decrease in general and administrative expenses was primarily due to the legal costs and expenses incurred in connection with the class action lawsuit as described in our 2013 Form 10-K, which was $51,626 for the three-month period ended September 30, 2013 and $0 for the same period in 2014 since the lawsuit was settled in early 2014.
Gain on relocation of factory. Gain on relocation of factory was $1,877,779 for the three-month period ended September 30, 2013. In late September 2013, the Transportation Bureau of Dongying City and other local government agencies requested to requisition the land where the original Factory No. 3 was located for railway construction. We recognized such amount in this quarter in 2013.
Other Operating Income. Other operating income was $116,942 for the three-month period ended September 30, 2014, an increase of $9,936(or 9%) as compared to $107,006 for the same period in 2013 for sales of wastewater. Wastewater is generated from the production of bromine and eventually becomes crude salt when it evaporates. Not all of our bromine production plants have sufficient area on the property to allow for evaporation of wastewater to produce crude salt. Certain of our customers who have facilities located adjacent to our bromine production plants have agreed to channel our wastewater into brine pans on their properties for evaporation. These customers then are able to sell the resulting crude salt themselves. We have signed agreements with four of our customers to sell them our wastewater at market prices.
Income from Operations. Income from operations was $6,694,589 for the three-month period ended September 30, 2014 (or 22% of net revenue), a decrease of $4,197,931, or approximately 39%, over the income from operations for the same period in 2013. The decrease resulted primarily from the decrease in bromine and crude salt selling price.
|
Income from Operations by Segment
|
||||||||||||||
|
Three-Month Period Ended
September 30, 2014
|
Three-Month Period Ended
September 30, 2013
|
|||||||||||||
|
Segment:
|
% of total
|
% of total
|
||||||||||||
|
Bromine
|
$ | 3,131,684 | 45 | % | $ | 5,876,150 | 52 | % | ||||||
|
Crude Salt
|
(431,901 | ) | (6 | %) | 1,635,755 | 15 | % | |||||||
|
Chemical Products
|
4,161,811 | 61 | % | 3,740,278 | 33 | % | ||||||||
|
Income from operations before corporate costs
|
6,861,594 | 100 | % | 11,252,183 | 100 | % | ||||||||
|
Corporate costs
|
(167,005 | ) | (359,663 | ) | ||||||||||
|
Income from operations
|
$ | 6,694,589 | $ | 10,892,520 | ||||||||||
Bromine segment
Income from operations from our bromine segment was $3,131,684 for the three-month period ended September 30, 2014, a decrease of $2,744,466 (or approximately 47%) compared to the same period in 2013. This significant decrease resulted primarily from the decrease in selling price (contributed a decrease of approximately $0.5 million) and gain on relocation of original Factory No.3 of approximately $1.45million recognized for the three-month period ended September 30, 2013, which was partially offset by the decrease in purchase price of raw material.
Crude salt segment
Loss from operations from our crude salt segment was $431,901 for the three-month period ended September 30, 2014, a decrease of $2,067,656 (or approximately 126%) compared to the same period in 2013. This decrease resulted primarily from the decrease in selling price (contributed a decrease of approximately $1.43 million) in the three-month period end June 30, 2013 as compared to the same period in 2014 due to macro-economic tightening policy imposed by the PRC government and gain on relocation of original Factory No.3 of approximately $0.43 million recognized for the three-month period ended September 30, 2013 and an increase the depreciation and amortization of the plant and machinery due to the relocation and the construction of the new factory, which was completed in December 2013 and the depreciation of construction projects commenced in January 2014.
Chemical products segment
Income from operations from our chemical products segment was $4,161,811 for the three-month period ended September 30, 2014, an increase of $421,533 (or approximately 11%) compared to the same period in 2013. This increase was primarily due to demand for all of our chemical products, which was partially offset by the decrease in purchase of raw material.
Other Income. Net Other income, net of $76,675 represented bank interest income, net of capital lease interest expense for the three -month period ended September 30, 2014, an increase of $41,022 (or approximately 115%) as compared to the same period in 2013, mainly due to higher average bank balance held during the three months period ended September 30, 2014 compared to the same period ended September 30, 2013.
Net Income. Net income was $5,038,403 for the three-month period ended September 30, 2014, a decrease of $3,071,326 (or approximately 38%) compared to the same period in 2013. This significant decrease was primarily attributable to the decrease in the selling price of bromine and crude salt.
Effective Tax Rate. Our effective tax rate for the three-month period ended September 30, 2014 and 2013 was 26% and 26%, respectively. The effective tax rate of 26% for the three-month period ended September 30, 2014 differs from the PRC statutory income tax rate of 25% due to the US federal net operating loss incurred by the Company. The effective tax rate of 26% for the same period in 2013 differs from the PRC statutory income tax rate of 25% due to the US federal net operating loss incurred by the Company.
Comparison of the Nine-Month Period Ended September 30, 2014 and 2013
|
Nine-Month
Period Ended
September 30, 2014
|
Nine-Month
Period Ended
September 30, 2013
|
% Change
|
|||||||||
|
Net revenue
|
$ | 88,451,954 | $ | 88,291,753 | 0.2 | % | |||||
|
Cost of net revenue
|
$ | (63,202,383 | ) | $ | (63,251,929 | ) | (0.1 | %) | |||
|
Gross profit
|
$ | 25,249,571 | $ | 25,039,824 | 1 | % | |||||
|
Sales, marketing and other operating expenses
|
$ | (78,793 | ) | $ | (70,796 | ) | 11 | % | |||
|
Research and development costs
|
$ | (94,323 | ) | $ | (105,380 | ) | (10 | %) | |||
|
Loss from disposal of property, plant and equipment
|
(9,866 | ) | - | - | |||||||
|
Write-off/Impairment on property, plant and equipment
|
$ | (673,705 | ) | $ | (214 | ) | 314715 | % | |||
|
General and administrative expenses
|
$ | (4,916,626 | ) | $ | (6,354,165 | ) | (23 | %) | |||
|
Gain on relocation on factory
|
$ | - | $ | 1,877,779 | (100 | %) | |||||
|
Other operating income
|
$ | 351,547 | $ | 489,695 | (28 | %) | |||||
|
Income from operations
|
$ | 19,827,805 | $ | 20,876,743 | (5 | %) | |||||
|
Other income, net
|
$ | 197,181 | $ | 81,336 | 142 | % | |||||
|
Income before taxes
|
$ | 20,024,986 | $ | 20,958,079 | (4 | %) | |||||
|
Income taxes
|
$ | (5,035,433 | ) | $ | (5,609,486 | ) | (10 | %) | |||
|
Net income
|
$ | 14,989,553 | $ | 15,348,593 | (2 | %) | |||||
Net revenue. Net revenue for nine-month period ended September 30, 2014 was $88,451,954, representing an increase of approximately $0.16 million (or 0.2%) over the same period in 2013. This increase was primarily attributable to the increase of revenues from our chemical segment. Revenue from the chemical products segment increased from $32,007,282 for the nine-month period ended September 30, 2013 to $36,489,530 for the same period in 2014, an increase of approximately14%.
Revenue from the bromine products segment decreased from $46,300,730 for the nine-month period ended September 30, 2013 to $43,950,056 for the same period in 2014, a decrease of approximately 5%. Revenue from the crude salt segment decreased from $9,983,741 for the nine-month period ended September 30, 2013 to $8,012,368 for the same period in 2014, a decrease of approximately 20%.
|
Net Revenue by Segment
|
|||||||||||||||||
|
Nine-Month Period Ended
|
Nine-Month Period Ended
|
Percent
Increase/(Decrease)
|
|||||||||||||||
|
September 30, 2014
|
September 30, 2013
|
of Net Revenue
|
|||||||||||||||
|
Segment
|
% of total
|
% of total
|
|||||||||||||||
|
Bromine
|
$
|
43,950,056
|
50
|
%
|
$
|
46,300,730
|
53
|
%
|
(5
|
%)
|
|||||||
|
Crude Salt
|
$
|
8,012,368
|
9
|
%
|
$
|
9,983,741
|
11
|
%
|
(20
|
%)
|
|||||||
|
Chemical Products
|
$
|
36,489,530
|
41
|
%
|
$
|
32,007,282
|
36
|
%
|
14
|
%
|
|||||||
|
Total sales
|
$
|
88,451,954
|
100
|
%
|
$
|
88,291,753
|
100
|
%
|
0.2
|
%
|
|||||||
|
Bromine and crude salt segments
|
Nine-Month Period Ended
|
Percentage Change
|
||||||||||
|
product sold in tonnes
|
September 30, 2014
|
September 30, 2013
|
Increase/(Decrease)
|
|||||||||
|
Bromine (excluded volume sold to SYCI)
|
15,199
|
15,306
|
(1
|
%)
|
||||||||
|
Crude Salt
|
248,134
|
241,239
|
3
|
%
|
||||||||
|
Nine-Month Period Ended
|
Percentage Change
|
|||||||||||
|
Chemical products segment sold in tonnes
|
September 30, 2014
|
September 30, 2013
|
Increase
|
|||||||||
|
Oil and gas exploration additives
|
11,062
|
9,513
|
16
|
%
|
||||||||
|
Paper manufacturing additives
|
3,173
|
3,125
|
2
|
%
|
||||||||
|
Pesticides manufacturing additives
|
2,503
|
2,297
|
9
|
%
|
||||||||
|
Overall
|
16,738
|
14,935
|
12
|
%
|
||||||||
Bromine segment
The decrease in net revenue from our bromine segment was mainly due to the decrease in the selling price. The selling price of bromine decreased from $3,025 per tonne for the nine-month period ended September 30, 2013 to $2,892 per tonne for the same period in 2014, a decrease of 4%. The major reason for the decrease in the selling price of bromine was mainly attributable to the macro-economic tightening policy imposed by the PRC government beginning in the second half of 2011 to slow down the economy, which has affected our customers’ industries. As a result, we needed to offer competitive selling prices to our customers to compete with other bromine manufacturers. The average selling price for this quarter decreased $130 per tonne, as compared with the first quarter of 2014, which was $2,985 per tonne. We expect the average selling price of bromine to remain at the current level through the end of 2014 should the PRC government’s macro-economic tightening policy remain in place. The table below shows the changes in the average selling price and changes in the sales volume of bromine for nine-month period ended September 30, 2014 from the same period in 2013.
|
Nine-Month Period
Ended September 30,
|
||||
|
Decrease in net revenue of bromine as a result of:
|
2014 vs. 2013
|
|||
|
Decrease in average selling price
|
$
|
(2,034,489
|
)
|
|
|
Decrease in sales volume
|
$
|
(316,185
|
)
|
|
|
Total effect on net revenue of bromine
|
$
|
(2,350,674
|
)
|
|
Crude salt segment
The decrease in net revenue from our crude salt segment was mainly due to the decrease in the average selling price. The average selling price of crude salt decrease from $41.39 per tonne for the nine-month period ended September 30, 2013 to $32.29 per tonne for the same period in 2014, a decrease of 22%. The decrease in the selling price was mainly due to the macro-economic tightening policy imposed by the PRC government to slow down the economy, which has affected our customers’ industries.
The table below shows the changes in the average selling price and changes in the sales volume of crude salt for nine-month period ended September 30, 2014 from the same period in 2013.
|
Nine-Month Period
Ended September 30,
|
||||
|
Increase /Decrease in net revenue of crude salt as a result of:
|
2014 vs. 2013
|
|||
|
Decrease in average selling price
|
$
|
(2,225,379
|
)
|
|
|
Increase in sales volume
|
$
|
254,006
|
||
|
Total effect on net revenue of crude salt
|
$
|
(1,971,373
|
)
|
|
Chemical products segment
|
Product Mix of Chemical Products Segment
|
Percent
|
||||||||||||||||
|
Nine-Month Period Ended
|
Nine-Month Period Ended
|
Change of
|
|||||||||||||||
|
September 30, 2014
|
September 30, 2013
|
Net Revenue
|
|||||||||||||||
|
Chemical Products
|
% of total
|
% of total
|
|||||||||||||||
|
Oil and gas exploration additives
|
$
|
20,848,777
|
57
|
%
|
$
|
18,126,509
|
57
|
%
|
15
|
%
|
|||||||
|
Paper manufacturing additives
|
$
|
3,643,637
|
10
|
%
|
$
|
3,547,763
|
11
|
%
|
3
|
%
|
|||||||
|
Pesticides manufacturing additives
|
$
|
11,997,117
|
33
|
%
|
$
|
10,333,010
|
32
|
%
|
16
|
%
|
|||||||
|
Total sales
|
$
|
36,489,530
|
100
|
%
|
$
|
32,007,283
|
100
|
%
|
14
|
%
|
|||||||
Net revenue from our chemical products segment increased from $32,007,283 for the nine-month period ended September 30, 2013 to $36,489,530 for the same period in 2014, an increase of approximately 14%. The increase was mainly attributable to the increase in demand for all of our chemical products. Our oil and gas exploration chemicals are the most popular products within the chemical products segment, which contributed $20,848,777 (or 57%) and $18,126,509 (or 57%) of our chemical segment revenue for the nine-month period ended September 30, 2014 and 2013, respectively, with an increase of $2,722,268, or 15%. Net revenue from our paper manufacturing additives increased from $3,547,763 for the nine-month period ended September 30, 2013 to $3,643,637 for the same period in 2014, an increase of approximately 3%. Net revenue from our pesticides manufacturing additives increased from $10,333,010 for the nine-month period ended September 30, 2013 to $11,997,117 for the same period in 2014, an increase of approximately 16%.
The table below shows the changes in the average selling price and changes in the sales volume of major chemical products for nine-month period ended September 30, 2014 from the same period in 2013.
|
Increase / (Decrease) in net revenue,
for the nine-month period ended September 30,
2014 vs. 2013, as a result of:
|
Oil and gas exploration additives
|
Paper manufacturing additives
|
Pesticides manufacturing additives
|
Total
|
|||||||||||||
|
Increase / (Decrease) in average selling price
|
$
|
(213,216
|
)
|
$
|
41,067
|
$
|
707,075
|
$
|
534,926
|
||||||||
|
Increase in sales volume
|
$
|
2,935,484
|
$
|
54,806
|
$
|
957,032
|
$
|
3,947,322
|
|||||||||
|
Total effect on net revenue of chemical products
|
$
|
2,722,268
|
$
|
95,873
|
$
|
1,664,107
|
$
|
4,482,248
|
|||||||||
Cost of Net Revenue.
| Cost of Net Revenue by Segment |
% Change
|
||||||||||||||||
| Nine-Month Period Ended |
Nine-Month Period Ended
|
of Cost of
|
|||||||||||||||
| September 30, 2014 |
September 30, 2013
|
Net Revenue
|
|||||||||||||||
|
Segment
|
% of total | % of total | |||||||||||||||
|
Bromine
|
$
|
32,606,253
|
52
|
%
|
$
|
34,745,832
|
55
|
%
|
(6.2
|
%)
|
|||||||
|
Crude Salt
|
$
|
7,172,556
|
11
|
%
|
$
|
6,755,418
|
11
|
%
|
6.2
|
%
|
|||||||
|
Chemical Products
|
$
|
23,423,574
|
37
|
%
|
$
|
21,750,679
|
34
|
%
|
7.7
|
%
|
|||||||
|
Total
|
$
|
63,202,383
|
100
|
%
|
$
|
63,251,929
|
100
|
%
|
(0.1
|
%)
|
|||||||
Cost of net revenue reflects mainly the raw materials consumed and the direct salaries and benefits of staff engaged in the production process, electricity, depreciation and amortization of manufacturing plant and machinery and other manufacturing costs. Our cost of net revenue was $63,202,383 for nine-month period ended September 30, 2014, a decrease of $49,546 (or 0.1%) over the same period in 2013.
Bromine production capacity and utilization of our factories
The table below represents the annual capacity and utilization ratios for all of our bromine producing properties:
|
Annual Production Capacity (in tonnes)
|
Utilization
Ratio (i)
|
|||||||
|
Nine-month period ended September 30, 2013
|
47,347
|
46%
|
||||||
|
Nine-month period ended September 30, 2014
|
47,347
|
45%
|
||||||
|
Variance of the nine-month period ended September 30, 2014 and 2013
|
-
|
(1%
|
)
|
|||||
(i) Utilization ratio is calculated based on the annualized actual production volume in tonnes for the period divided by the annual production capacity in tonnes.
Our utilization ratio decreased by 1% for the nine-month period ended September 30, 2014 as compared with the same period in 2013.
Bromine segment
For the nine-month period ended September 30, 2014, the cost of net revenue for the bromine segment was $32,606,253, a decrease of $2,139,579 or 6% over the same period in 2013. The most significant components of the costs of net revenue for the bromine segment were the cost of raw materials and finished goods consumed of $13,623,872 (or 42%), depreciation and amortization of manufacturing plant and machinery of $12,674,236 (or 39%) and electricity of $2,528,684 (or 8%) for the nine-month period ended September 30, 2014. For the nine-month period ended September 30, 2013, the major components of the cost of net revenue were the cost of raw materials and finished goods consumed of $16,625,563 (or 48%), depreciation and amortization of manufacturing plant and machinery of $12,236,373 (or 35%) and electricity of $2,370,825 (or 7%). The cost structure changed as compared with the same period in 2013 where the contribution from cost of raw materials and finished goods consumed decreased by 6% and depreciation and amortization of manufacturing plant and machinery increased by 4%. The decrease in net cost of net revenue was attributable mainly to the decrease in purchase price of raw material.
|
Per tonne production cost
|
Nine-Month Period Ended
|
Nine-Month Period Ended
|
|||||||||||||||
|
component of bromine segment
|
September 30, 2014
|
September 30, 2013
|
% Change
|
||||||||||||||
|
% of total
|
% of total
|
||||||||||||||||
|
Raw materials
|
$
|
896
|
42
|
%
|
$
|
1,086
|
48
|
%
|
(17
|
%)
|
|||||||
|
Depreciation and amortization
|
$
|
834
|
39
|
%
|
$
|
799
|
35
|
%
|
4
|
%
|
|||||||
|
Electricity
|
$
|
166
|
8
|
%
|
$
|
155
|
7
|
%
|
7
|
%
|
|||||||
|
Others
|
$
|
249
|
11
|
%
|
$
|
230
|
10
|
%
|
8
|
%
|
|||||||
|
Production cost of bromine per tonne
|
$
|
2,145
|
100
|
%
|
$
|
2,270
|
100
|
%
|
(5
|
%)
|
|||||||
Our production cost of bromine per tonne was $2,145 for the nine-month period ended September 30, 2014, a decrease of 5% (or $125) over the same period in 2013, which was attributable mainly to the component of cost of raw materials consumed. The cost of raw materials consumed per tonne decreased by 17% as compared to the last comparison period, which was mainly attributable to the decrease in the purchase price of raw materials resulting from the macro-economic tightening policy imposed by the PRC government since January 2011.
Crude salt segment
For the nine-month period ended September 30, 2014, the cost of net revenue for our crude salt segment was $7,172,556, representing an increase of $417,138, or 6%, compared to $6,755,418 for the same period in 2013. The increase in cost was mainly due to the relocation and the construction of the new factory No.3, which was completed in December 2013 and the depreciation of construction projects commenced in January 2014.The significant cost components for the nine-month period ended September 30, 2014 were depreciation and amortization of $4,953,782 (or 69%), resource taxes calculated based on crude salt sold of $807,291 (or 11%) and electricity of $524,401 (or 7%). The significant cost components for the nine-month period ended September 30, 2013 were depreciation and amortization of $4,656,245 (or 69%), resource taxes calculated based on crude salt sold of $776,965 (or 12%) and electricity of $537,154 (or 8%). The table below represents the major production cost component of crude salt per ton for respective periods:
|
Per tonne production cost
|
Nine-Month Period Ended
|
Nine-Month Period Ended
|
|||||||||||||||
|
component of crude salt segment
|
September 30, 2014
|
September 30, 2013
|
% Change
|
||||||||||||||
|
% of total
|
% of total
|
||||||||||||||||
|
Depreciation and amortization
|
$
|
20.0
|
69
|
%
|
$
|
19.3
|
69
|
%
|
3
|
%
|
|||||||
|
Resource tax
|
$
|
3.2
|
11
|
%
|
$
|
3.2
|
12
|
%
|
-
|
||||||||
|
Electricity
|
$
|
2.1
|
7
|
%
|
$
|
2.2
|
8
|
%
|
(5
|
%)
|
|||||||
|
Others
|
$
|
3.6
|
13
|
%
|
$
|
3.3
|
11
|
%
|
9
|
%
|
|||||||
|
Production cost of crude salt per tonne
|
$
|
28.9
|
100
|
%
|
$
|
28.0
|
100
|
%
|
3
|
%
|
|||||||
Our production cost of crude salt per tonne was $28.9 for the nine-month period ended September 30, 2014, an increase of 3% (or $0.9) as compared to the same period in 2013, which was attributable mainly to the component of depreciation and amortization of manufacturing plant and machinery. The significant percentage increase in depreciation and amortization per tonne by 3% was due to the relocation and the construction of the new factory No.3, which was completed in December 2013 and the depreciation of construction projects commenced in January 2014.
Chemical products segment
For the nine-month period ended September 30, 2014, cost of net revenue for our chemical products segment was $23,423,547, representing an increase of $1,672,895 or 8% over the same period in 2013. The costs were the cost of raw material and finished goods consumed of $19,501,096 (or 83%) and $18,693,141 (or 86%) and depreciation and amortization of manufacturing plant and machinery of $2,132,775 (or 9%) and $2,107,340 (or 10%) for each of the nine-month period ended September 30, 2014 and 2013, respectively. As some of the components of our cost of net revenue are fixed costs such as depreciation and amortization of our manufacturing plant and machinery, the rate of increase for the cost of net revenue for our chemical products segment was less than that of net revenue.
Gross Profit. Gross profit was $25,249,571, or 29%, of net revenue for nine-month period ended September 30, 2014 compared to $25,039,824, or 28%, of net revenue for the same period in 2013. The increase in gross profit percentage was primarily attributable to an increase in the margin percentage of chemical products segment, which offset by crude salt segments.
|
Gross Profit by Segment
|
% Point Change
|
||||||||||||||||
|
Nine-Month Period Ended
|
Nine-Month Period Ended
|
of Gross
|
|||||||||||||||
|
September 30, 2014
|
September 30, 2013
|
Profit Margin
|
|||||||||||||||
|
Segment
|
Gross Profit Margin
|
Gross Profit Margin
|
|||||||||||||||
|
Bromine
|
$
|
11,343,803
|
26
|
%
|
$
|
11,554,898
|
25
|
%
|
1
|
%
|
|||||||
|
Crude Salt
|
$
|
839,812
|
10
|
%
|
$
|
3,228,323
|
32
|
%
|
(22
|
%)
|
|||||||
|
Chemical Products
|
$
|
13,065,956
|
36
|
%
|
$
|
10,256,603
|
32
|
%
|
4
|
%
|
|||||||
|
Total Gross Profit
|
$
|
25,249,571
|
29
|
%
|
$
|
25,039,824
|
28
|
%
|
1
|
%
|
|||||||
Bromine segment
The gross profit margin for our bromine segment for the nine-month period ended September 30, 2014 was 26% compared to 25% for the same period in 2013. As mentioned in the net revenue discussion above, due to the PRC government’s macro-economic tightening policy to slow down the economy, our selling price in the nine-month ended September 30, 2014 was affected. We cut the average selling price of bromine from $3,025 per tonne for the nine-month period ended September 30, 2013 to $2,892 per tonne for the same period in 2014, a decrease of 4%, in order to compete with other bromine manufacturers. Our purchase price of material decreased even more from $1,086 per tonne for the nine-month period ended September 30, 2014 to $896 per tonne for the same period in 2014, a decrease of 17%.
Crude salt segment
For the nine-month period ended September 30, 2014, the gross profit margin for our crude salt segment was 10% compared to 32% for the same period in 2013. This 22% decrease in our gross profit margin is mainly attributable to the selling price decreased from $41.39 per tonne for the nine-month period ended September 30, 2014 to $32.29 per tonne for the same period in 2014, a decrease of 22%, due to the macro-economic tightening policy imposed by the PRC government, which has affected our customers’ industries.
Chemical products segment
The gross profit margin for our chemical products segment for the nine-month period ended September 30, 2014 was 36% compared to 32% for the same period in 2014, an increase of 4%. This 4% increase in our gross profit margin was mainly a result of the increase in average selling price of paper manufacturing additive and pesticides manufacturing additives, decrease in factory overhead per unit produced due to higher volume of production
Research and Development Costs. For the nine-month period ended September 30, 2014 and 2013, the total research and development costs incurred were $94,322 and $105,380, respectively, a decrease of 10%. Research and development costs for the nine-month period ended September 30, 2014 and 2013 represented raw materials used by SYCI for testing the manufacturing routine.
Write-off/Impairment on property, plant and equipment. Write-off on property, plant and equipment for the nine-month period ended September 30, 2014 and 2013 were $673,705 and $214, respectively, an increase of 314715%. Write-off on property, plant and equipment of $673,705 for the nine-month period ended September 30, 2014 represented the write-off of certain protective shells to transmission pipelines and ducts replaced during the third phase enhancement project that started in August 2014.
General and Administrative Expenses. General and administrative expenses were $4,916,626 for the nine-month period ended September 30, 2014, a decrease of $1,437,539 (or 23%) as compared to $6,354,165 for the same period in 2013. This decrease in general and administrative expenses was primarily due to (i) a non-cash expense related to stock options granted to employees decreased from $536,400 for the nine-month period ended September 30,2013 to $30,000 for the same period of 2014 ; and (ii) the unrealized exchange loss in relation to the translation difference of inter-company balances in USD and RMB for the nine-month period ended September 30,2013 amounted to $556,325, as compared to the unrealized exchange gain for the same period in 2014 amounted to $237,028.
Gain on relocation of factory. Gain on relocation of factory was $1,877,779 for the nine-month period ended September 30, 2013. In late September 2013, the Transportation Bureau of Dongying City and other local government agencies requested to requisition the land where the original Factory No. 3 was located for railway construction.
Other Operating Income. Other operating income was $351,547 for the nine-month period ended September 30, 2014 for sales of wastewater. The other operating income for the nine-month period ended September 30, 2013 was $489,695, which represented (i) a sum of $318,603 for sales of wastewater; (ii) a sum of $171,092 for insurance compensation received in 2013 for legal fees incurred in 2012. Wastewater is generated from the production of bromine and eventually becomes crude salt when it evaporates. Not all of our bromine production plants have sufficient area on the property to allow for evaporation of wastewater to produce crude salt. Certain of our customers who have facilities located adjacent to our bromine production plants have agreed to channel our wastewater into brine pans on their properties for evaporation. These customers then are able to sell the resulting crude salt themselves. We signed agreements with four of our customers to sell them our wastewater at market prices.
Income from Operations. Income from operations was $19,827,805 for the nine-month period ended September 30, 2014 (or 22% of net revenue), a decrease of $1,048,938, or approximately 5%, over income from operations for the same period in 2013. The decrease resulted primarily from the decrease in bromine and crude salt selling price, which partly offset by gain on relocation of original Factory No.3 for the same period in 2013.
|
Income from Operations by Segment
|
||||||||||||||
|
Nine-Month Period Ended
September 30, 2014
|
Nine-Month Period Ended
September 30, 2013
|
|||||||||||||
|
Segment:
|
% of total
|
% of total
|
||||||||||||
|
Bromine
|
$ | 7,748,981 | 38.8 | % | $ | 10,086,575 | 45 | % | ||||||
|
Crude Salt
|
94,609 | 0.5 | % | 2,902,613 | 13 | % | ||||||||
|
Chemical Products
|
12,123,116 | 60.7 | % | 9,408,993 | 42 | % | ||||||||
|
Income from operations before corporate costs
|
19,966,706 | 100 | % | 22,398,181 | 100 | % | ||||||||
|
Corporate costs
|
(138,901 | ) | (1,521,438 | ) | ||||||||||
|
Income from operations
|
$ | 19,827,805 | $ | 20,876,743 | ||||||||||
Bromine segment
Income from operations from our bromine segment was $7,748,981 for the nine-month period ended September 30, 2014, a decrease of $2,337,594 (or approximately 23%) compared to the same period in 2013. This significant decrease resulted primarily from the decrease in selling price (contributed a decrease of approximately $2.03 million) and gain on relocation of original Factory No.3 of approximately $1.45million recognize for the nine-month period ended September 30, 2013, which was partially offset by the decrease in purchase of raw material.
Crude salt segment
For the nine-month period ended September 30, 2014, income from operations from our crude salt segment was $94,609, a decrease of $2,808,004 (or approximately 96.7%) compared to the same period in 2013. This significant decrease resulted primarily from the decrease in selling price (contributed a decrease of approximately $2.23 million) and gain on relocation of original Factory No.3 of approximately $0.43million recognize for the nine-month period ended September 30, 2013 and increase the depreciation and amortization of the plant and machinery due to the relocation and the construction of the new factory, which was completed in December 2013 and the depreciation of construction projects commenced in January 2014.
Chemical products segment
For the nine-month period ended September 30, 2014, income from operations from our chemical products segment was $12,123,116, an increase of $2,714,123 (or approximately 29%) over same period in 2013. This significant increase was primarily due to demand for all of our chemical products, which was partially offset by the decrease in purchase of raw material.
Other Income, Net. Other income, net of $197,181 represented bank interest income, net of capital lease interest expense for the nine -month period ended September 30, 2014, an increase of $115,845 (or approximately 142%) as compared to the same period in 2013, mainly due to higher average bank balance held during the nine months period ended September 30, 2014 compared to the same period ended September 30, 2013.
Net Income. Net income was $14,989,553 for the nine-month period ended September 30, 2014, a decrease of $359,040 (or approximately 2%) compared to the same period in 2013. This significant decrease was primarily attributable to the decrease in the selling price of bromine and crude salt.
Effective Tax Rate. Our effective tax rate for the nine-month period ended September 30, 2014 and 2013 was 25% and 27%, respectively. The effective tax rate of 27% for the nine-month period ended September 30, 2013 differs from the PRC statutory income tax rate of 25% due to the US federal net operating loss incurred by the Company.
LIQUIDITY AND CAPITAL RESOURCES
As of September 30, 2014, cash and cash equivalents were $131,866,548 as compared to $107,828,800 as of December 31, 2013. The components of this increase of $24,037,748 are reflected below.
Statement of Cash Flows
|
Nine-Month Period Ended September 30,
|
||||||||
|
2014
|
2013
|
|||||||
|
Net cash provided by operating activities
|
$
|
32,476,141
|
$
|
31,388,975
|
||||
|
Net cash used in investing activities
|
$
|
(7,101,842
|
)
|
$
|
(951,640
|
)
|
||
|
Net cash used in financing activities
|
$
|
(304,806
|
)
|
$
|
(302,497
|
)
|
||
|
Effects of exchange rate changes on cash and cash equivalents
|
$
|
(1,031,745
|
)
|
$
|
1,828,730
|
|||
|
Net (decrease)/increase in cash and cash equivalents
|
$
|
24,037,748
|
$
|
31,963,568
|
||||
For the nine-month period ended September 30, 2014, we met our working capital and capital investment requirements mainly by using cash flow from operations and cash on hand. We intend to continue to explore more brine water resources and obtain bromine assets through acquisitions, develop new projects and continually look for attractive horizontal and vertical acquisition targets.
Net Cash Provided by Operating Activities
During the nine-month period ended September 30, 2014 and 2013, we had positive cash flow from operating activities of $32.5 million and $31.4 million, respectively, primarily attributable to net income.
During the nine-month period ended September 30, 2014, cash flow from operating activities of $32.5 million exceeded our net income of $15.0 million, mainly due to (i) substantial non-cash charges of $21.7 million, primarily in the form of depreciation and amortization of property, plant and equipment, and write-off/impairment loss on property, plant and equipment; partially offset by (ii) cash used in working capital of $4.2 million, which mainly consisted of an increase in accounts receivable and decrease in tax payable, partially offset by the increase in accounts payable and accrued expenses.
During the nine-month period ended September 30, 2013, cash flow from operating activities of $31.4 million exceeded our net income of $15.3 million, mainly due to (i) substantial non-cash charges of $19.6 million, primarily in the form of depreciation and amortization of property, plant and equipment, exchange loss on intercompany balances and stock-based compensation; partially offset by (ii) cash used in working capital of $3.6 million, which mainly consisted of the increase in accounts receivable and decrease in retention payable, partially offset by the increase in taxes payable and decrease in inventories.
Accounts receivable
Cash collections on our accounts receivable had a major impact on our overall liquidity. The following table presents the aging analysis of our accounts receivable as of September 30, 2014 and December 31, 2013.
|
September 30, 2014
|
December 31, 2013
|
|||||||||||||||
|
% of total
|
% of total
|
|||||||||||||||
|
Aged 1-30 days
|
$
|
11,119,510
|
23
|
%
|
$
|
11,694,338
|
26
|
%
|
||||||||
|
Aged 31-60 days
|
$
|
12,520,029
|
26
|
%
|
$
|
11,199,632
|
25
|
%
|
||||||||
|
Aged 61-90 days
|
$
|
10,569,822
|
22
|
%
|
$
|
10,256,456
|
23
|
%
|
||||||||
|
Aged 91-120 days
|
$
|
10,500,437
|
22
|
%
|
$
|
8,687,636
|
19
|
%
|
||||||||
|
Aged 121-150 days
|
$
|
3,624,672
|
7
|
%
|
$
|
3,047,292
|
7
|
%
|
||||||||
|
Total
|
$
|
48,334,471
|
100
|
%
|
$
|
44,885,354
|
100
|
%
|
||||||||
The overall accounts receivable balance as of September 30, 2014 increased by $3,449,116 (or 8%), as compared to those as of December 31, 2013. Such increase is mainly attributable to the extended settlement days by customers due to the macro-economic tightening policy imposed by PRC government to slow down the economy, which in turn lengthened the average turnover days of accounts receivable from customers from 125 days for the fiscal year 2013 to 144 days for the nine-month period ended September 30, 2014. Normally, a 90 to 120-day credit period is granted to customers with good payment history. No allowance for doubtful debts is required for the nine-month period ended September 30, 2014 as we are not aware of any situation indicating collection problem. Approximately 70% of the balances of accounts receivable as of September 30, 2014 aged more than 90 days was settled in October 2014. We have policies in place to ensure that sales are made to customers with an appropriate credit history and we perform ongoing credit evaluation on the financial condition of our customers.
Inventory
Our inventory consists of the following:
|
September 30, 2014
|
December 31, 2013
|
|||||||||||||||
|
% of total
|
% of total
|
|||||||||||||||
|
Raw materials
|
$
|
1,214,560
|
23.0
|
%
|
$
|
651,810
|
12.3
|
%
|
||||||||
|
Finished goods
|
$
|
4,065,178
|
77.1
|
%
|
$
|
4,656,814
|
87.8
|
%
|
||||||||
|
$
|
5,279,738
|
100.1
|
%
|
$
|
5,308,624
|
100.1
|
%
|
|||||||||
|
Allowance for obsolete and slowing-moving inventory
|
$
|
(6,569
|
)
|
(0.1
|
%)
|
$
|
(6,629
|
)
|
(0.1
|
%)
|
||||||
|
Total
|
$
|
5,273,169
|
100.0
|
%
|
$
|
5,301,995
|
100.0
|
%
|
||||||||
The net inventory level as of September 30, 2014 decreased by $28,826 (or 0.5%), as compared to the net inventory level as of December 31, 2014.
Raw materials increase by 86% as of September 30, 2014 as compared to December 31, 2013. All of the raw materials are basic chemical industry materials, few of which have a possibility of loss over time, or major fluctuations in their prices. We concluded that all of our raw materials as of September 30, 2014 are fully realizable for production of finished goods without any impairment.
Our finished goods consist of bromine, crude salt and chemical products. Our chemical products are similar to raw materials, with no loss over time, a stable market price and a gross profit margin of 36% for the nine-month period ended September 30, 2014 as compared to 32% for the same period in fiscal year 2013. Therefore, we believe that the realization of the chemical products is 100%.
Similarly, as there is no depletion of bromine and the gross profit margin in the nine-month period ended September 30, 2014 as compared to the same period in fiscal year 2013 increased to 26% from 25%, we believe that the realization of it is also 100%. We anticipated that the price for the rest of 2014 will not fluctuate significantly to impair the cost of bromine.
The annual loss of crude salt due to evaporation is approximately 3%. The average selling price of crude salt per tonne decreased from $38.53 in the first quarter of 2014 to $27.88 in the third quarter of 2014. In the same period, gross profit also decreased from 32% for the nine –month period ended September 30, 2014 to 10% for the same period in 2014. If the selling price continues to decrease, there will be an impact on our crude salt realization value.
Net Cash Used in Investing Activities
In the nine-month period ended September 30, 2014, we used approximately $0.66 million cash for the prepayment of land leases. In the same period, we also used approximately $6.46 million cash in the third phase enhancement project related to the protective shells to transmission channels and ducts in Factory No. 10 and 11.
In the nine-month period ended September 30, 2013, we used approximately $0.6 million cash for the prepayment of land leases.We also used approximately $0.3 million cash for the construction of our new Factory No.3 due to the resumption of leased land by the Transportation Bureau of Dongying City and other local government agencies for railway construction.
The investing activities described above were financed by opening cash balances as of December 31, 2013, and 2012, and cash generated from operation during the nine-month period ended September 30, 2014.
Net Cash Used in Financing Activities
We repaid approximately $0.3 million cash for our capital lease obligation for the nine-month period ended September 30, 2014.
We believe that our available funds and cash flows generated from operations will be sufficient to meet our anticipated ongoing operating needs for the next twelve (12) months. However we will likely need to raise additional capital in order to fund the ongoing program of acquiring unlicensed bromine properties, increase our chemical production capacity and develop a new bromine and crude salt production line in Sichuan Province, PRC. We expect to raise those funds through credit facilities obtained with lending institutions. There can be no guarantee that we will be able to obtain such funding, whether through the issuance of debt or equity, on terms satisfactory to management and our board of directors.
Working capital was approximately $174.9 million at September 30, 2014 as compared to approximately $146.8 million at December 31, 2013. The increase was mainly attributable to the cash provided by operating activities during the nine-month period ended September 30, 2014.
We had available cash of approximately $131.9 million at September 30, 2014, most of which is in highly liquid current deposits which earn no or little interest. We intend to retain the cash for future expansion of our bromine and crude salt businesses through acquisition, enhancement work to our existing bromine and crude salt business, and exploration cost of new brine water resources in Sichuan Province. We do not anticipate paying cash dividends in the foreseeable future.
In the future, we intend to focus our efforts on the activities of SCHC and SYCI as these segments continue to expand within the Chinese market. We also intend to explore the possibility of cooperation with overseas large-scale bromine manufacturers for expansion into overseas markets. As a result, we may issue additional shares of our capital stock and incur new debt in order to raise cash for acquisitions and other capital expenditures during the next twelve months.
We may not be able to identify, successfully integrate or profitably manage any businesses or business segment we may acquire, or any expansion of our business. An expansion may involve a number of risks, including possible adverse effects on our operating results, diversion of management attention, inability to retain key personnel, risks associated with unanticipated events and the financial statement effect of potential impairment of acquired intangible assets, any of which could have a materially adverse effect on our condition and results of operations. In addition, if competition for acquisition candidates or operations were to increase, the cost of acquiring businesses could increase materially. We may effect an acquisition with a target business which may be financially unstable, under-managed, or in its early stages of development or growth. In addition, if competition for acquisition candidates or operations were to increase, the cost of acquiring businesses could increase materially. Our inability to implement and manage our expansion strategy successfully may have a material adverse effect on our business and future prospects.
Contractual Obligations and Commitments
We have no significant contractual obligations not fully recorded on our condensed consolidated balance sheets or fully disclosed in the notes to our condensed consolidated financial statements. Additional information regarding our contractual obligations and commitments at September 30, 2014 is provided in the notes to our condensed consolidated financial statements. See “Notes to Condensed Consolidated Financial Statements, Note 18 – Capital Commitment and Operating Lease Commitments”.
Material Off-Balance Sheet Arrangements
We do not currently have any off balance sheet arrangements falling within the definition of Item 303(a) of Regulation S-K.
Critical Accounting Policies and Estimates
Our consolidated financial statements have been prepared in accordance with accounting principles generally accepted in the United States of America and this requires management to make estimates and assumptions that affect the reported amounts of assets and liabilities at the date of the consolidated financial statements and the reported amounts of revenues and expenses during the reporting period. We base these estimates on historical experience and on various other assumptions that are believed to be reasonable under the circumstances. Accordingly, actual results may differ significantly from these estimates under different assumptions or conditions. We have identified the following critical accounting policies and estimates used by us in the preparation of our financial statements: accounts receivable and allowance for doubtful accounts, assets retirement obligation, property, plant and equipment, recoverability of long lived assets, mineral rights, revenue recognition, income taxes, and stock-based compensation. These policies and estimates are described in the Company’s 2013 Form 10-K.
Pursuant to Item 305(e) of Regulation S-K (§ 229.305(e)), the Company is not required to provide the information required by this Item as it is a “smaller reporting company,” as defined by Rule 229.10(f)(1).
(a) Evaluation of Disclosure Controls and Procedures
We maintain disclosure controls and procedures (as such term is defined in Exchange Act Rules 13a-15(e) and 15d-15(e)) that are designed to ensure that information required to be disclosed in our reports filed pursuant to the Exchange Act is recorded, processed, summarized and reported within the time periods specified in the SEC’s rules, regulations and related forms, and that such information is accumulated and communicated to our management, including our Chief Executive Officer (“CEO”) and Chief Financial Officer (“CFO”), as appropriate, to allow timely decisions regarding required disclosure.
Under the supervision and with the participation of our management, including our CEO and CFO, we conducted an evaluation of the effectiveness of the design and operation of our disclosure controls and procedures as of the end of the period covered by this report. Based on this evaluation, our CEO and CFO concluded that our disclosure controls and procedures were effective as of the end of the period covered by this Form 10-Q.
(b) Changes in internal controls
There were no changes in our internal control over financial reporting (as such term is defined in Rules 13a-15(f) under the Exchange Act) during our most recently completed fiscal quarter, which is the subject of this report, that have materially affected, or are reasonably likely to materially affect, our internal control over financial reporting.
Item 1. Legal Proceedings
None.
This information has been omitted based on the Company’s status as a smaller reporting company.
Item 2. Unregistered Shares of Equity Securities and Use of Proceeds
None.
Item 3. Defaults Upon Senior Securities
None.
Item 4. Mine Safety Disclosures
Not applicable.
Item 5. Other Information
None.
Item 6. Exhibits
|
Exhibit No.
|
Description
|
|
31.1
|
Certification of Chief Executive Officer pursuant to Rule 13a-14(a) and 15d-14(a), as adopted pursuant to Section 302 of the Sarbanes-Oxley Act of 2002.
|
|
31.2
|
Certification of Chief Financial Officer pursuant to Rule 13a-14(a) and 15d-14(a), as adopted pursuant to Section 302 of the Sarbanes-Oxley Act of 2002.
|
|
32.1
|
Certification pursuant to 18 U.S.C. Section 1350, as adopted pursuant to Section 906 of the Sarbanes-Oxley Act of 2002.
|
|
101.1
|
The following financial statements from Gulf Resources, Inc.’s Quarterly Report on Form 10-Q for the quarterly period ended September 30, 2014 formatted in XBRL (eXtensible Business Reporting Language): (i) the Consolidated Balance Sheets; (ii) the Consolidated Statements of Operations and Other Comprehensive Income (Loss); (iii) the Consolidated Statements of Changes in Equity; (iv) the Consolidated Statement of Cash Flows; and, (v) the Notes to Consolidated Financial Statements, tagged as blocks of text.
|
Pursuant to the requirements of Section 13 or 15(d) of the Securities Exchange Act of 1934, the registrant has duly caused this report to be signed on its behalf by the undersigned, thereunto duly authorized.
|
GULF RESOURCES, INC.
|
||
|
Dated: November 7, 2014
|
By:
|
/s/ Xiaobin Liu
|
|
Xiaobin Liu
|
||
|
Chief Executive Officer
|
||
|
(principal executive officer)
|
||
|
Dated: November 7, 2014
|
By:
|
/s/ Min Li
|
|
Min Li
|
||
|
Chief Financial Officer
|
||
|
(principal financial and accounting officer)
|
||
42