Attached files
| file | filename |
|---|---|
| 8-K - 8-K - Discover Financial Services | d815899d8k.htm |
 2014 BancAnalysts Association of Boston Conference
©2014 DISCOVER FINANCIAL SERVICES
Mark Graf
EVP & Chief Financial Officer
November 7, 2014
Exhibit 99.1 |
 2
Notice
The following slides are part of a presentation by Discover Financial Services (the "Company")
and are intended to be viewed as part of that presentation. No representation is made
that the information in these slides is complete. The presentation contains forward-looking statements. You are cautioned not to place undue
reliance on forward-looking statements, which speak only as of the date on which they are
made, which reflect management’s estimates, projections, expectations or beliefs at that
time, and which are subject to risks and uncertainties that may cause actual results to differ
materially. For a discussion of certain risks and uncertainties that may affect the future results of
the Company, please see "Special Note Regarding Forward-Looking Statements,"
"Risk Factors," "Business – Competition," "Business – Supervision and
Regulation" and "Management’s Discussion and Analysis of Financial Condition and Results
of Operations" in the Company’s Annual Report on Form 10-K for the year ended
December 31, 2013 and "Management’s Discussion and Analysis of Financial Condition and
Results of Operations" in the Company's Quarterly Reports on Form 10-Q for the quarters ended March 31, 2014,
June 30, 2014 and September 30, 2014, which are available on the Company’s website and the
SEC’s website. The Company does not undertake to update or revise forward-looking
statements as more information becomes available. We own or have rights to use the trademarks, trade names and service marks that we use in conjunction
with the operation of our business, including, but not limited to: Discover
®
, PULSE
®
, Cashback Bonus
®
, Discover Cashback Checking
Discover it
®
, Discover
®
Network and Diners Club International ®
. All other trademarks, trade names and service marks included
in this presentation are the property of their respective owners.
Throughout these materials, direct-to-consumer deposits are referred to as DTC deposits.
DTC deposits include deposit products that we offer to customers through direct marketing,
internet origination and affinity relationships. DTC deposits include certificates of
deposits, money market accounts, online savings and checking accounts, and IRA certificates of deposit.
SM
, |
 3
Positioning to be the leading direct bank
U.S. Card
Issuing
•
$54Bn in card receivables
•
Leading cash rewards
program
•
1 in 4 U.S. households
Deposits and
Lending
•
$29Bn direct-to-consumer
deposits
•
$13Bn personal loans and
private student loans
•
$2.5Bn home loan
originations
•
Home equity installment
loans
Direct Banking Strategy
•
Discover to become the leading direct
bank by leveraging our unique assets
and capabilities to grow credit card
market share and pursue other high-
return direct consumer banking
opportunities in the U.S.
Direct Banking Segment
(97% of DFS Pre-Tax Profit)
Note(s):
Balances as of September 30, 2014; direct mortgage originations and pre-tax
profit based on the trailing four quarters ending 3Q14 Consumer Strategic
Shift Today:
"My favorite credit card”
Near
Term:
“My
favorite
provider
of
credit
cards and other financial services”
Ultimately:
"My bank" |
 4
Discover
Milestones:
U.S. Deposit Growth vs. Fed Funds Rate
Today -
uncharted environment
Source:
Federal
Reserve
Board
Flow
of
Funds
and
Fed
Funds
rate
reported
annually
$28Bn
DTC
(1)
$13Bn
DTC
(1)
DFS
Spin
Note(s):
1.
Direct-to-consumer deposits (DTC); see Notice for complete definition
|
 5
Deposits strategy –
Great service and good pricing
•
Segment: Savvy, value-oriented consumers
•
Value Proposition
Outstanding service and convenience
Consistently good rates
•
Execution Path
Expand product breadth with distinctive offerings over time
Enhance product features and functionality
Integrate brands across platforms to drive cross-sell
|
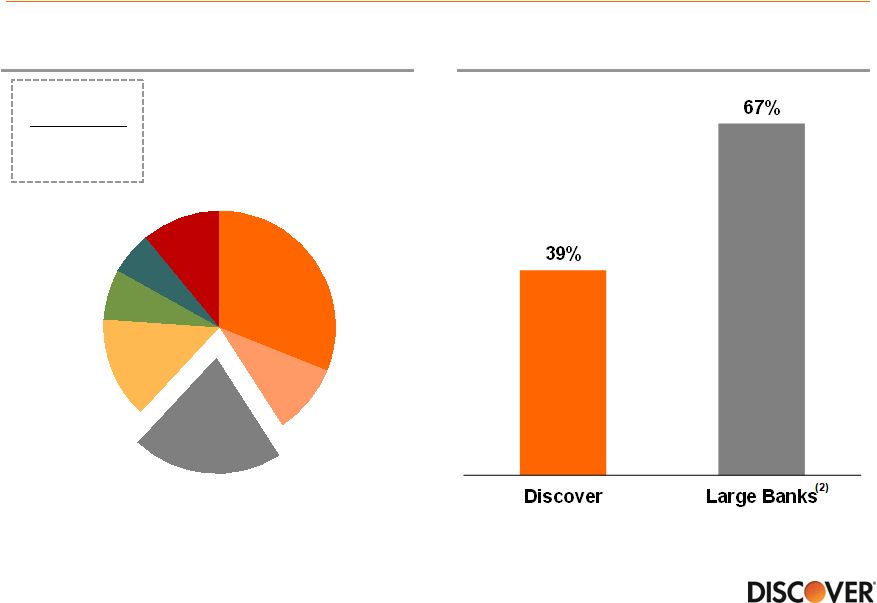 6
2013 Efficiency Ratio
Preference for direct channels has grown among
consumers
Preferred Banking Channel
Source:
American
Bankers
Association
Survey
2014
Branch
Preference
2008: 34%
2014: 21%
Source:
SNL
Note(s):
1.
Total operating expenses divided by revenue net of interest expense
2.
Bank holding companies participating in the 2014 Comprehensive Capital Analysis and
Review (CCAR); excludes Discover (1)
Internet,
31%
Mobile,
10%
Branch,
21%
ATM,
14%
Phone,
7%
Mail, 6%
NA, 11% |
 7
Funding asset growth with deposits
Direct-to-Consumer
Deposits ($Bn)
(1)
Funding Mix
(1)
Note(s):
1.
Includes affinity deposits
Senior Bank Notes
ABS and Other
Brokered Deposits
Direct Deposits
$3
$7
$13
$21
$27
$28
$28
$29
2007
2008
2009
2010
2011
2012
2013
3Q14 |
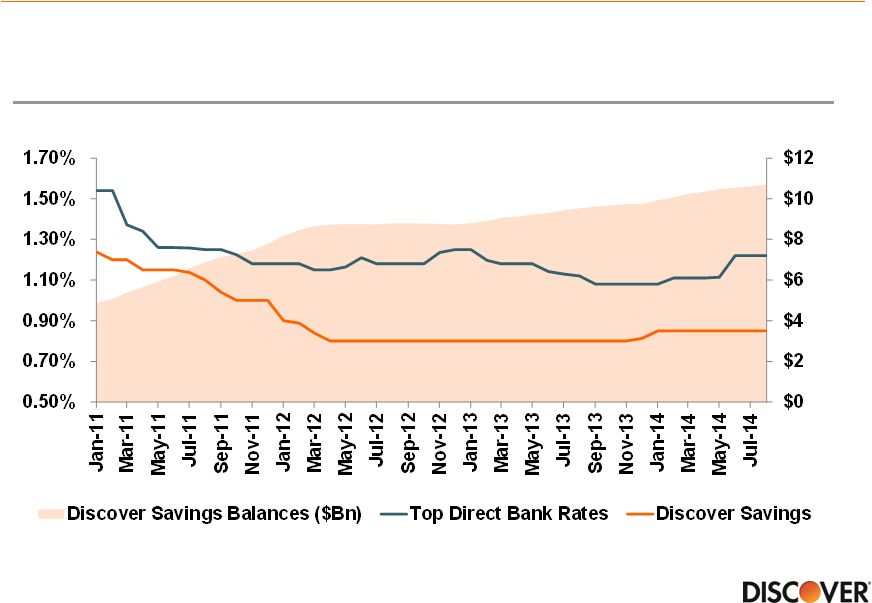 8
Pricing to balance growth and stability of book
Discover
Savings
Rate
vs.
Top
Direct
Bank
Rates
(1)
Note(s):
1.
Data set through August 2014; Top Direct Bank Rates reflects monthly average of top
three rates posted online weekly by banks without a traditional branch
network Source:
Internal
data
&
Informa
Research
Services
(1) |
 9
Optimizing product mix to manage rate sensitivity
Indeterminate Balances Acquired at
10%+
Above
Competitor
Rates
(1,2)
Indeterminate Balances as a % of
Deposits
Portfolio
(1)
(3)
(3)
Note(s):
1. Indeterminate Balances defined as savings and money
market balances 2.
Competitor
Rates
reflects
monthly
average
of
rates
posted
online
by
peer
banks,
which
include
banks
without
a
traditional
branch
network
3.
2014 YTD is as of 9/30/2014
48%
49%
54%
57%
2011
2012
2013
2014 YTD
39%
39%
33%
30%
2011
2012
2013
2014 YTD |
 10
Optimizing customer mix to manage rate sensitivity
Note(s):
1.2014 YTD is as of 9/30/2014
Deposits from
Card or Affinity Customers
(% of Total)
New Deposit Accounts Opened by
Card or Affinity Customers
(% of Total)
(1)
(1)
66%
69%
78%
84%
2011
2012
2013
2014 YTD
54%
56%
60%
62%
2011
2012
2013
2014 YTD |
 11
Positive trends in depositor behavior
DTC Balances by Life of
Relationship
CD Retention Rates
(1)
$21Bn
$29Bn
(2)
Note(s):
1. CD retention rates based on direct-to-consumer
CDs; excludes brokered CDs 2.
2014 YTD is as of 9/30/2014
(2)
78%
82%
2010
2014 YTD
9%
44%
16%
33%
75%
23%
2010
2014 YTD
Less than 2 Years
2 to 4 Years
Over 4 Years |
 12
Our beta will be higher than a “traditional”
bank but
not “1”
DFS vs. Traditional Bank
Illustrative
Betas
(1)
•
Similar to “traditional”
bank, strong
synergy between right and left hand
side of balance sheet
62% of current accounts have a loan
product relationship with DFS
78% of new accounts have a loan
product relationship with DFS
•
Different from “traditional”
bank…
Checking deposits are still relatively
small (<1% of DFS funding)
Funding stack relies on ABS, DTC
and Brokered Deposits
Note(s):
1.
Defined as the ratio of expected change in deposit pricing relative to Fed
increases in short term interest rates 0.0
0.5
1.0
Traditional
Bank Deposit
Pricing
Discover DTC
Deposit
Pricing
Brokered CD
Pricing |
 13
•
Achieves cost of funds benefit in a
rising rate environment
•
Deepens customer relationships
given transactional nature of product
•
Delivers richer product features and
better value given lower direct
banking cost structure
•
Leverages Discover and PULSE
networks
Establish core banking presence and lower long term cost
of funds with checking product
Strategic Rationale
Note(s):
Checking
product
currently
limited
to
existing
deposit
and
card
customers;
Broad
market
launch
expected
in
2015 |
 14
Strong digital presence with great customer service is key
|
 15
Summary
•
Utilizing all current funding channels
•
Focusing on funding that is favorable in terms of cost, beta, liquidity and
term •
Committed to DTC funding channel as a large percentage of funding mix
•
Focusing on product mix and customer retention to prepare for rising rate
environment |