Attached files
| file | filename |
|---|---|
| 8-K - 8-K - Bristow Group Inc | d815457d8k.htm |
 November 7, 2014
Second quarter FY15 earnings presentation
Bristow Group Inc.
Exhibit 99.1 |
 2
Second quarter FY15 earnings call agenda
Introduction
CEO remarks and safety review
Operational highlights
Current and future financial performance
Closing remarks
Questions and answers
Linda McNeill, Director Investor Relations
Jonathan Baliff, President and CEO
Jeremy Akel, SVP and COO
John Briscoe, SVP and CFO
Jonathan Baliff, President and CEO |
 3
Forward-looking statements
This presentation may contain “forward-looking statements” within the meaning of the
Private Securities Litigation Reform Act of 1995. Forward-looking statements include
statements about our future business, operations, capital expenditures, fleet composition, capabilities
and results; modeling information, earnings and adjusted earnings growth guidance, expected contract
revenue, expected operating margins, cash flow stability and other financial projections; future
dividends, share repurchases and other uses of excess cash; plans, strategies and objectives of
our management, including our plans and strategies to grow earnings and our business, our general strategy
going forward, our
business model and our operational excellence initiative; expected actions by us and by third
parties, including our customers, competitors and regulators; impact of grounding and the
effects thereof; the valuation of our company and its valuation relative to relevant financial
indices; assumptions underlying or relating to any of the foregoing, including assumptions regarding factors impacting
our business, financial results and industry; expected input of our investment in Eastern Airways;
aircraft delivery dates and other matters. Our forward-looking statements reflect our views
and assumptions on the date of this presentation regarding future events and operating
performance. They involve known and unknown risks, uncertainties and other factors, many of which may
be beyond our control, that may cause actual results to differ materially from any future
results, performance or achievements expressed or implied by the forward-looking statements.
These risks, uncertainties and other factors include fluctuations in the demand for our services; fluctuations in worldwide prices
of and demand for natural gas and oil; fluctuations in levels of natural gas and oil exploration,
development and production activities; the impact of competition; actions by customers; the risk
of reductions in spending on aircraft services by governmental agencies; changes in tax and
other laws and regulations; changes in foreign exchange rates and controls; risks associated with international operations;
operating risks inherent in our business, including the possibility of declining safety performance;
general economic conditions including the capital and credit markets; our ability to obtain
financing; the possibility that we may lack sufficient liquidity to continue to repurchase shares
or pay a quarterly dividend; the risk of grounding of segments of our fleet for extended periods of
time or indefinitely; our ability to re-deploy our aircraft to regions with greater demand;
our ability to acquire additional aircraft and dispose of older aircraft through sales into the
aftermarket; the possibility that we or our suppliers will be unable to deliver new aircraft on time
or on budget; the possibility that we do not achieve the anticipated benefit of our fleet
investment program; availability of employees; political instability, war or acts of terrorism in any
of the countries where we operate; and
those discussed under the captions “Risk Factors” and “Management’s Discussion and Analysis of
Financial Condition and Results of Operations” in our Annual Report on Form 10-K for the
fiscal year ended March 31, 2014 and our Quarterly Report on Form 10-Q for the quarter ended
September 30, 2014. We do not undertake any obligation, other than as required by law, to update
or revise any forward-looking statements, whether as a result of new information, future events or otherwise.
|
 CEO
remarks and safety review Jonathan Baliff, President and CEO
|
 5
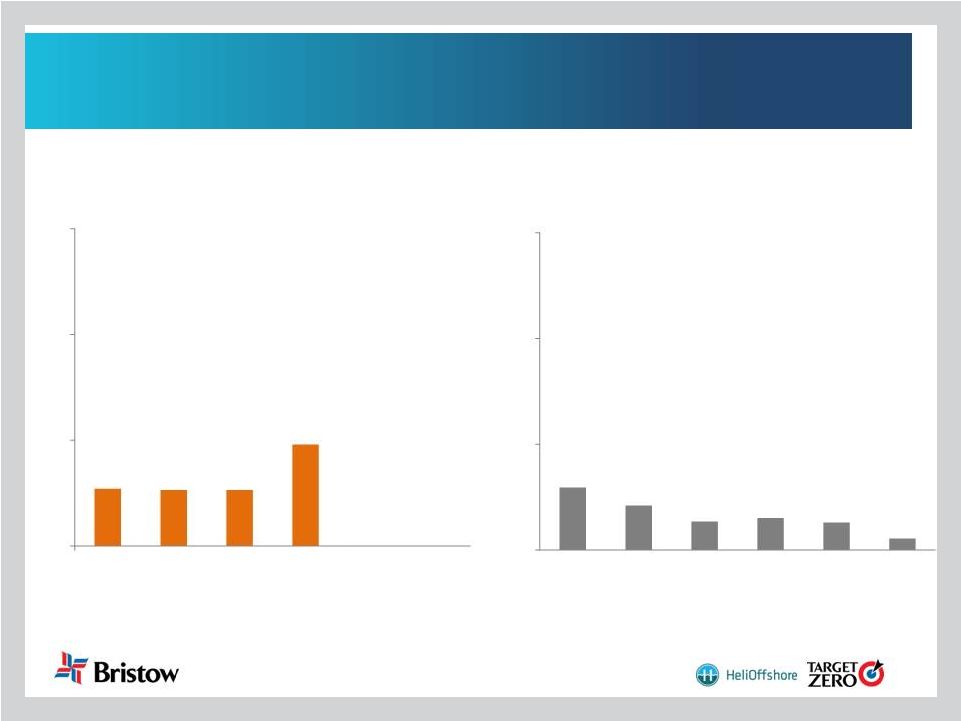
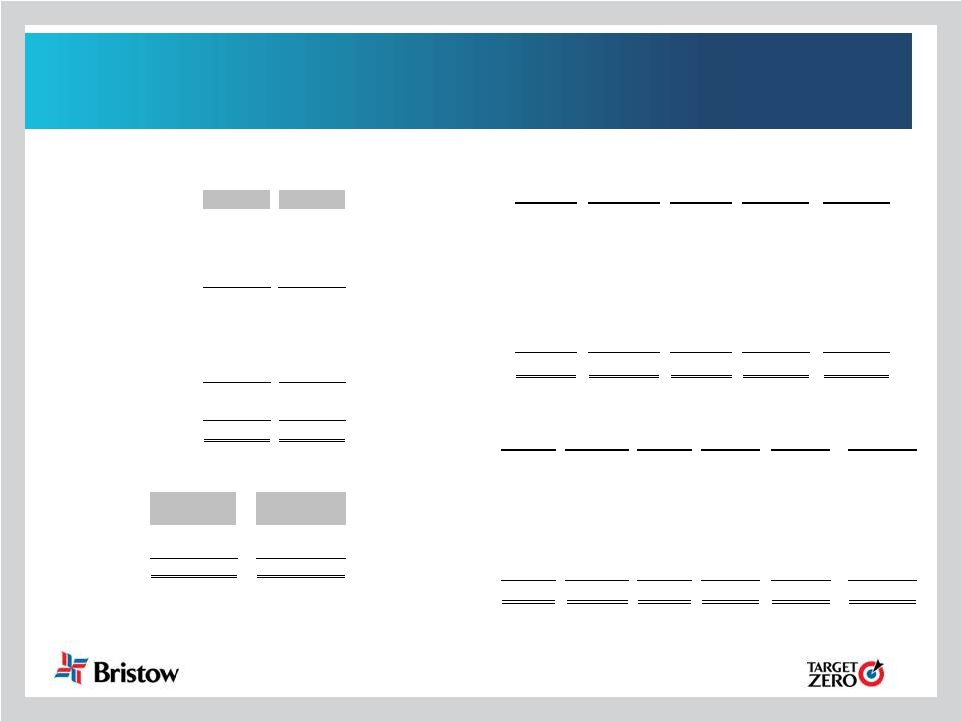
Operational safety review
1)
AAR includes consolidated commercial operations only
2)
TRIR includes consolidated commercial operations, corporate and Bristow Academy
employees Total
Recordable
Injury
Rate
2
(TRIR)
per
200,000
man hours (cumulative)
Commercial
Air
Accident
Rate
1
(AAR)
per
100,000
flight hours (fiscal year)
0.54
0.53
0.53
0.96
0.00
0.00
0.00
1.00
2.00
3.00
FY10
FY11
FY12
FY13
FY14
YTD FY15
0.59
0.42
0.27
0.31
0.26
0.11
0.00
1.00
2.00
3.00
FY10
FY11
FY12
FY13
FY14
YTD FY15 |
 6
Q2 FY15 highlights
Adjusted EPS and adjusted EBITDAR amounts exclude gains and losses on dispositions
of assets and any special items during the period. See reconciliation of these items to GAAP measures in the
appendix hereto and in our earnings release for the quarter ended September 30,
2014. Bristow Value Added (BVA) is calculated by taking gross cash flow less
the product of gross operating assets times a capital charge of 10.5%. Example calculation can be found in the appendix hereto.
Please see our earnings release and slide 22 for more information regarding earnings
guidance range. *
**
***
•
Continued revenue and LACE rate growth in Q2 FY15 both-over-year and
sequentially •
Adjusted EBITDAR increased year-over-year, but adjusted EPS is down due
primarily to unfavorable changes in foreign exchange rates
•
Q2 FY15 BVA** is up $3.7 million year-over-year and up $1.6 million
sequentially; with returns growing due to excellent capital management
•
Cash flow growth has led to increased liquidity of $613 million
•
EPS guidance for the full year FY15 is reaffirmed at $4.70 -
$5.20***
•
Q2 operating revenue of $440.5M (16.3% increase from Q2 FY14, 0.7 % increase from
Q1 FY15) •
Q2 GAAP EPS of $0.73 (75.7% decrease from Q2 FY14, 40.7% decrease from Q1
FY15) •
Q2 adjusted EPS* of $0.87 (31.5% decrease from Q2 FY14, 34.1% decrease from Q1
FY15) •
Q2 adjusted EBITDAR* of $112.1M (3.3% increase from Q2 FY14, 12.2% decrease from
Q1 FY15) |
 7
•
Recent declines in oil prices are supply oriented and expected to
be shorter term in nature, with increased finding/production costs
supporting a sustainable higher price in the long term
•
Regardless, our business model has not been impacted by short
term
commodity
price
declines,
but
more
from
our
clients’
short
term cost and capital restrictions; the long term outlook remains
positive
•
Global growth in helicopter demand is good, while large helicopter
supply remains constrained. Total value of identified future
helicopter opportunities is comparable to our last update
•
SAR discussions are ongoing for multiple aircraft opportunities in
various countries including Australia, Brazil, the Falklands,
Greenland, Nigeria, Norway, Trinidad and the UK
Market environment outlook |
 Operational highlights
Jeremy Akel, SVP and COO |
 9
•
Europe contributed 49% of Bristow operating revenue
and 54% of adjusted EBITDAR* in Q2 FY15
•
Operating revenue increased 32% to $206.3M in Q2
FY15 from $156.4M in Q2 FY14 with the net addition
of eight LACE, an overall increase in activity under
existing and new contracts over the comparable
quarter and the addition of Eastern Airways
•
Adjusted EBITDAR increased 26% to $69.5M in Q2
FY15 from $55.2M in Q2 FY14 with adjusted
EBITDAR margin of 33.7% in Q2 FY15 vs. 35.3% in
Q2 FY14
Outlook:
Higher demand for newer technology aircraft in the
Southern North Sea resulting from CAP 1145
implementation
Three LACE contracted for one year in the Falkland
Islands commencing February 2015
One LACE contracted for two and a half years in
Norway commencing January 2015
Europe (EBU)
* Operating revenue and adjusted EBITDAR percentages exclude corporate and
other FY15 adjusted EBITDAR margin expected to be
~ low thirties |
 10
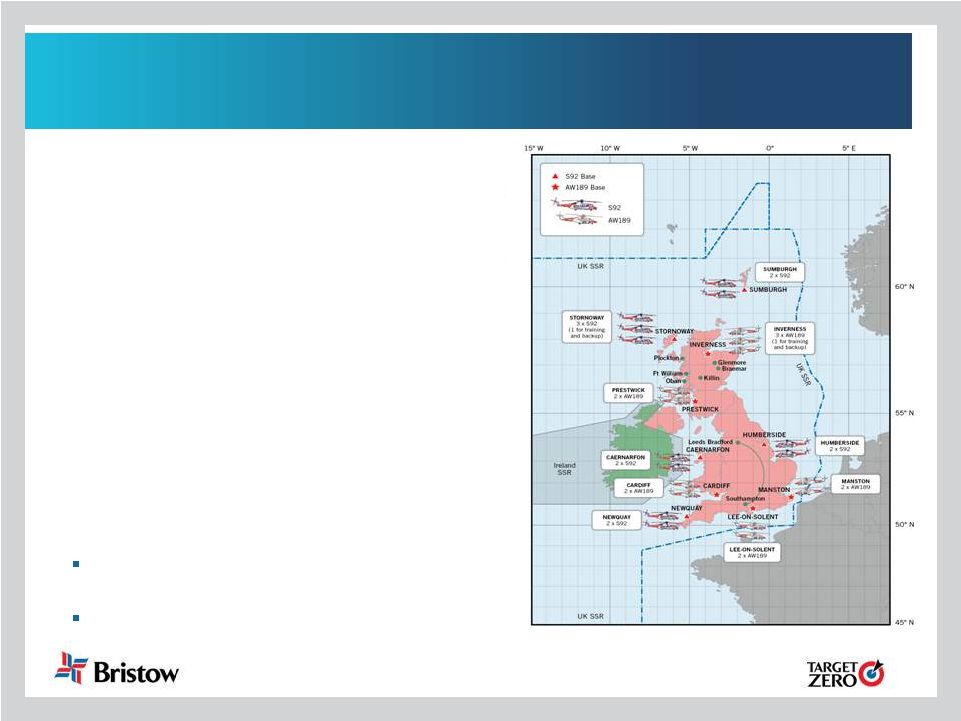
UK SAR update
•
From the start of the GAP SAR contract in
June 1, 2013 through September 30, 2014, we have
conducted over 445 missions and rescued and/or
assisted over 420 people
•
Sumburgh and Stornoway bases generated $13.0M
of operating revenue in Q2 FY15 and $63.9M since
the beginning of the contract
•
Construction of the first two UK SAR bases
continues in Inverness and Humberside and
expected to become fully operational in Q1 FY16
•
Completed sale-leaseback of four GAP SAR S-92s
•
Completed lease financing of remaining UK SAR
S-92s, including two that were delivered during the
current quarter
Outlook:
UK SAR implementation and start-up are on
schedule and on budget
Expect to complete lease financing of each
AW189 upon delivery |
 11
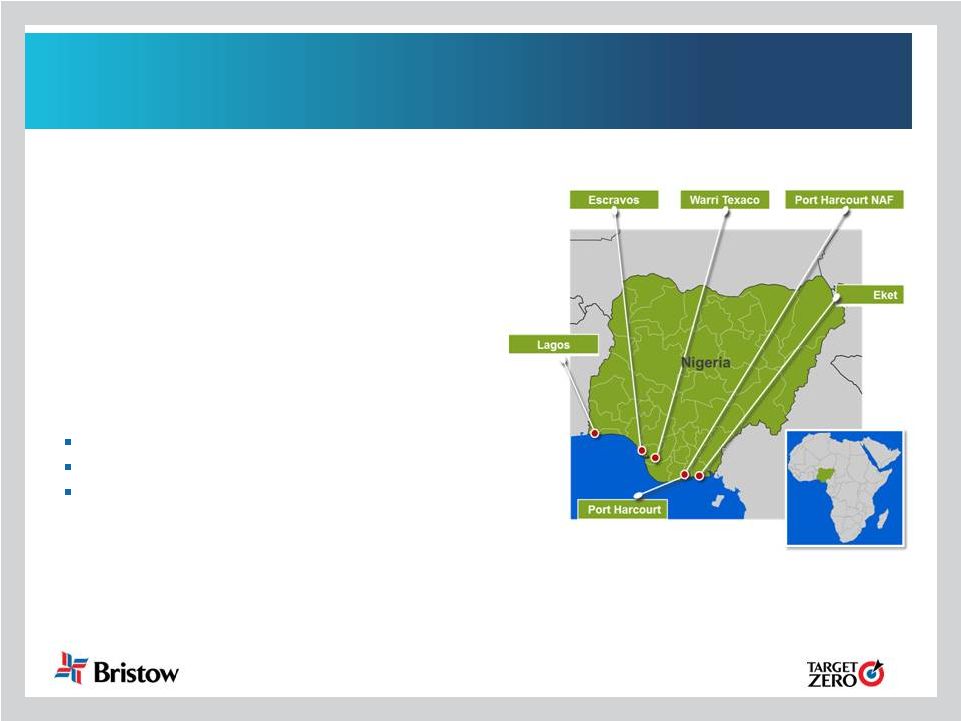
West Africa (WASBU)
•
West Africa (Nigeria) contributed 19% of Bristow
operating revenue and 19% of adjusted EBITDAR* in
Q2 FY15
•
Operating revenue increased to $80.1M in Q2 FY15
from $75.9M in Q2 FY14 due to improved contract
terms
•
Adjusted EBITDAR increased to $24.9M in Q2 FY15
from $23.1M in Q2 FY14 and adjusted EBITDAR
margin increased to 31.1% in Q2 FY15 vs. 30.4% in
Q2 FY14 due to increased revenue and cost control
measures
Outlook:
Contracts continue to be extended
Two LACE medium term extension
Introduction of new fixed wing service in Q4 FY15
to meet client demand
* Operating revenue and adjusted EBITDAR percentages exclude corporate and
other FY15 adjusted EBITDAR margin expected to be
~ low thirties |
 12
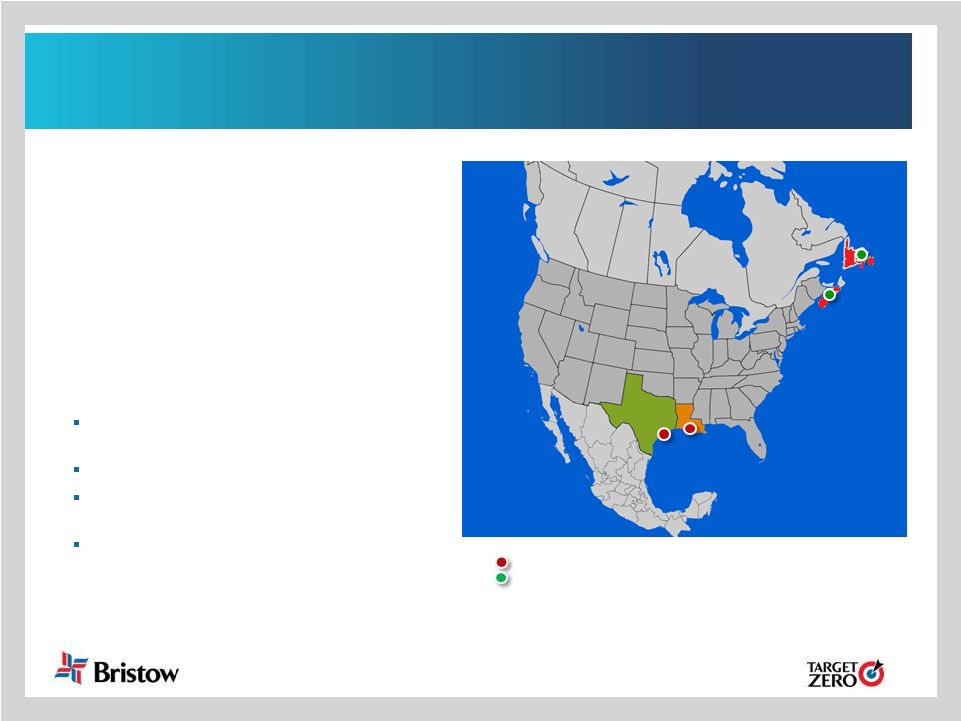
•
North America contributed 13% of Bristow operating
revenue and 14% of adjusted EBITDAR* in Q2 FY15
•
Operating revenue decreased slightly to $56.0M in
Q2 FY15 from $60.4M in Q2 FY14 primarily due to
the planned closure of our Alaska operations and a
decline in the number of small aircraft on contract
•
Adjusted EBITDAR decreased slightly to $18.1M in
Q2 FY15 vs. $18.7M in Q2 FY14 while adjusted
EBITDAR margin increased to 32.4% from 31.0% in
Q2 FY14, driven by a change in the contracted fleet
mix
Outlook:
Two LACE moving into GOM in second half of
FY15 to service client demand
Additional LACE in Canada in Q3 FY15
Secured $1.1 billon contract in Canada for up to
nine LACE (two new LACE) beginning in FY16
Facility improvements remain on schedule and
on budget
FY15 adjusted EBITDAR margin
expected to be ~ low-to-mid thirties
North America (NABU)
* Operating revenue and adjusted EBITDAR percentages exclude corporate and
other Bristow operated bases
Cougar operated bases |
 13
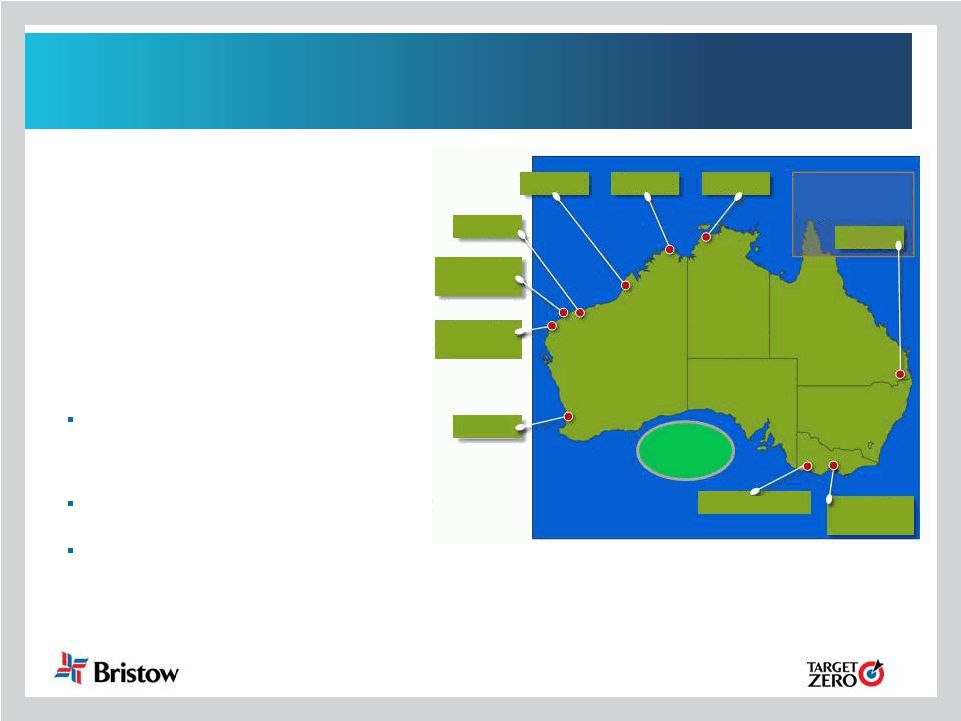
Australia (AUSBU)
•
Australia contributed 11% of Bristow operating
revenue and 8% of adjusted EBITDAR* in
Q2 FY15
•
Operating revenue increased by 33.6% to $47.2M
in Q2 FY15 from $35.3M in Q2 FY14
•
Adjusted EBITDAR increased 44.2% to $10.7M in
Q2 FY15 from $7.4M in Q2 FY14 and adjusted
EBITDAR margin increased to 22.6% in Q2 FY15
from 21% in Q2 FY14 due to the ramp up of the
INPEX contract, offset by the conclusion of certain
short term contracts
Outlook:
Inpex operations continue to ramp up with an
oil and gas SAR LACE that commenced in
October and one additional LACE commencing
in November
One LACE contracted for one year beginning in
Q1 FY16
Full EC225 fleet has returned to service
FY15 adjusted EBITDAR margin expected to
be ~ low twenties
* Operating revenue and adjusted EBITDAR percentages exclude corporate and
other Great
Australian
Bight
Karratha
Exmouth
Learmonth
Varanus Is
Barrow Is
Australia
Perth
Essendon
Tooradin
Broome
Truscott
Darwin
BDI provide support
to the Republic of
Singapore Air Force
Oakey
Warrnambool |
 14
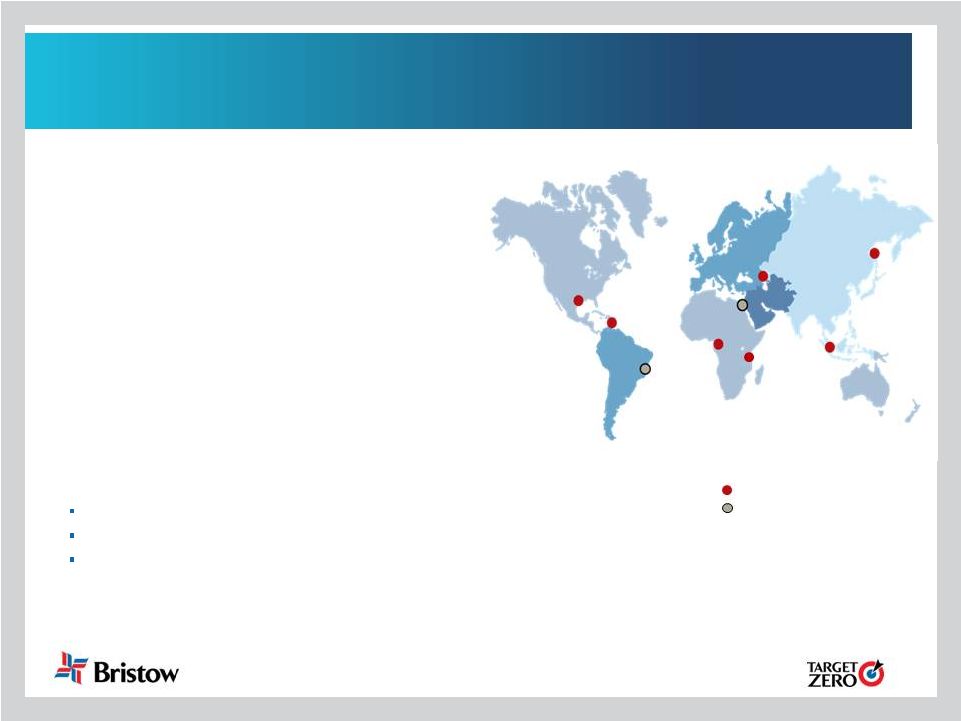
•
Other International contributed 8% of Bristow operating
revenue and 5% of adjusted EBITDAR* in Q2 FY15
•
Operating revenue increased to $35.8M in Q2 FY15 vs.
$32.2M in Q2 FY14 due to addition of a contract in
Tanzania and increased activity in Trinidad
•
Adjusted EBITDAR decreased to $6.6M in Q2 FY15 vs.
$12.6M in Q2 FY14 and adjusted EBITDAR margin
decreased to 18.5% in Q2 FY15 from 39.3% in Q2 FY14
primarily due to a decrease in earnings from
unconsolidated affiliates and the end of a contract in
Malaysia, partially offset by activity in Trinidad and
Tanzania
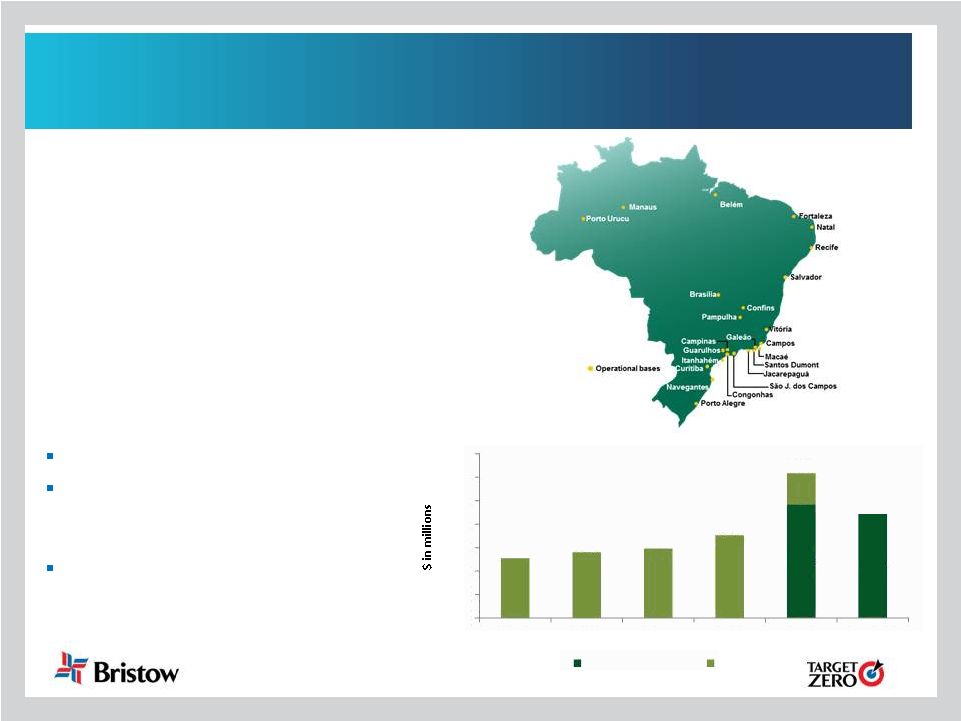
•
Unconsolidated earnings from Líder decreased $5.5M
primarily due to unfavorable changes in foreign
exchange rates
* Operating revenue and adjusted EBITDAR percentages exclude corporate and
other Consolidated in OIBU
Unconsolidated Affiliate
Other International (OIBU)
Outlook:
New opportunities in Africa, the Black Sea and Brazil
Additional long term opportunity for 1/2 LACE in Trinidad
Developing opportunities to introduce new technology LACE in emerging
markets FY15 adjusted EBITDAR margin expected to ~ mid thirties
|
 15
Líder update
* Reconciliation of adjusted EBITDAR, leverage and BVA provided in the
appendix Líder adjusted EBITDAR*
•
YTD CY14 adjusted EBITDAR decreased 8.5%
year-over-year due primarily due to unfavorable
changes in foreign currency rates
•
Absolute BVA contribution to Bristow from Líder
was $3.9M* in Q2 FY15 (September 30, 2014)
•
Adjusted debt to TTM adjusted EBITDAR
increased to 3.2x as of September 30, 2014 from
2.8x as of September 30, 2013
Outlook:
96.9
88.7
51.0
56.0
59.1
70.5
123.2
0
20
40
60
80
100
120
140
CY09
CY10
CY11
CY12
CY13
YTD CY14
Comparable period
Full year
One LACE renewal for two years
Petrobras is pressing ahead with
changing its fleet mix to large
aircraft
Additional long term LACE
requirements anticipated |
 Current and future financial
performance
John Briscoe, SVP and CFO |
 17
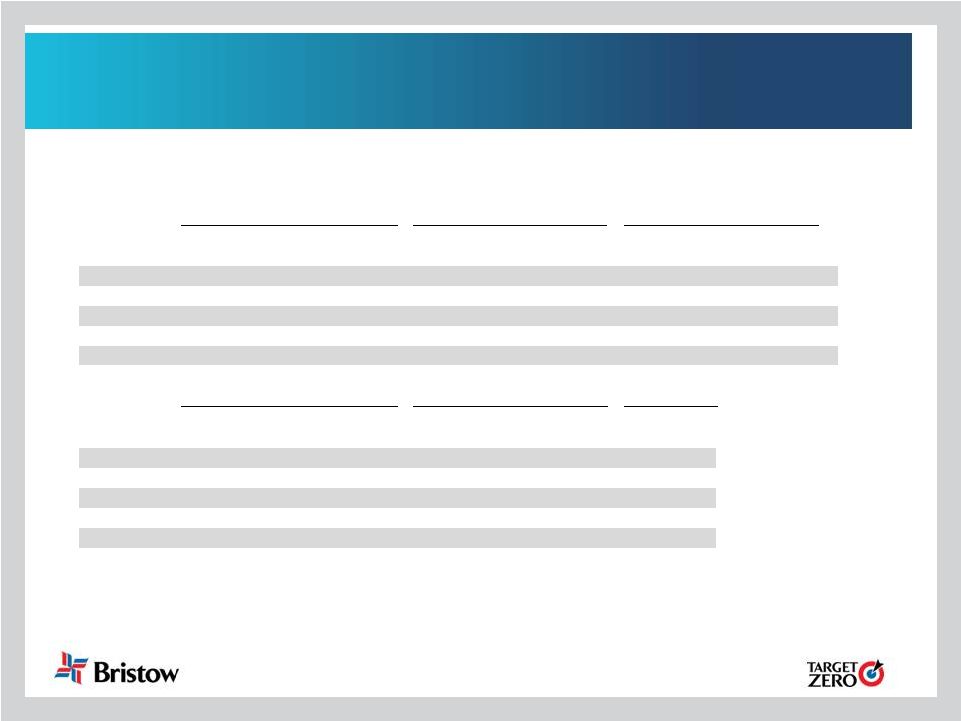
$1.27
$0.87
$0.04
$0.33
$0.11
Q2 FY14
Operations
Corporate and Other
FX Changes
Q2 FY15
Financial highlights:
Adjusted EPS and adjusted EBITDAR summary year-over-year
Q2 FY14 to Q2 FY15 adjusted EPS bridge
$108.5
$112.1
$17.2
$8.3
$5.3
Q2 FY14
Operations
Corporate and Other
FX Changes
Q2 FY15
Q2 FY14 to Q2 FY15 adjusted EBITDAR bridge (in millions)
Note: Adjusted EPS and adjusted EBITDAR amounts exclude gains and losses on
dispositions of assets and any special items during the period. See reconciliation of these items
to GAAP in our earnings release for the quarter ended September 30, 2014.
|
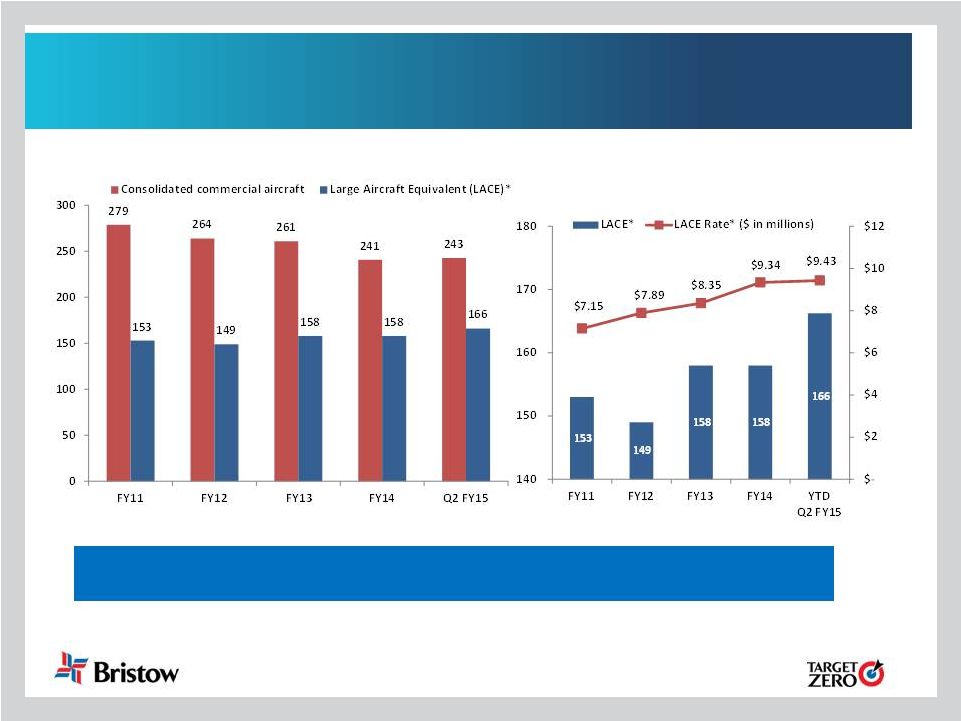 18
LACE and LACE rate continue to increase led by new
technology aircraft and improved utilization/terms
* See appendix hereto for more information on LACE and LACE
rate. Consolidated commercial aircraft, LACE and LACE rate exclude Bristow Academy, affiliate aircraft, fixed
wing aircraft, aircraft held for sale, aircraft construction in progress and
reimbursable revenue FY15 average LACE guidance range reaffirmed at 161 - 167 and average
LACE rate guidance range of $9.50 - $10.50 million |
 19
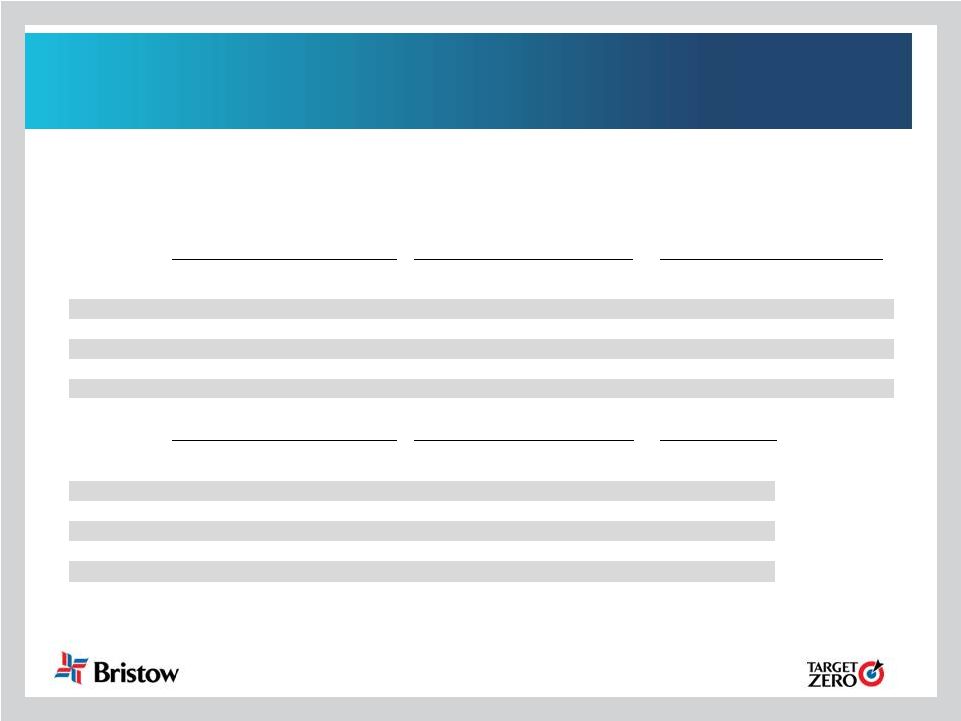
$2.28
$2.19
$0.24
$0.02
$0.35
YTD Q2 FY14
Operations
Corporate and Other
FX Changes
YTD Q2 FY15
Financial highlights:
Adjusted EPS and adjusted EBITDAR summary year-over-year
YTD Q2 FY14 to YTD Q2 FY15 adjusted EPS bridge
$211.8
$239.7
$39.1
$0.7
$11.9
YTD Q2 FY14
Operations
Corporate and Other
FX Changes
YTD Q2 FY15
YTD Q2 FY14 to YTD Q2 FY15 adjusted EBITDAR bridge (in millions)
Note: Adjusted EPS and adjusted EBITDAR amounts exclude gains and losses on
dispositions of assets and any special items during the period. See reconciliation of these items
to GAAP in our earnings release for the quarter ended September 30, 2014.
|
 20
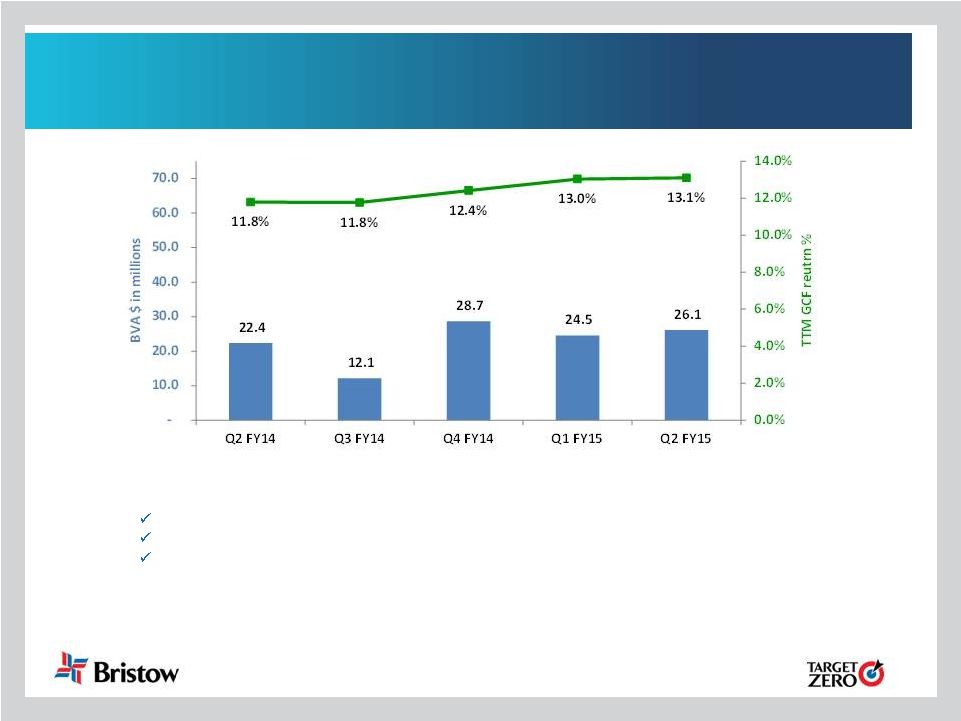
Bristow Value Added (BVA) drives improving Gross Cash
Flow (GCF) performance
•
Q2 FY15 absolute BVA is positive $26.1M, a $3.7M increase from Q2 FY14
•
Year-over-year change in BVA is driven by:
Excellent revenue growth
Margin improvement
Capital efficiency efforts
•
EBU and NABU generated key improvements year-over-year
Note: BVA is computed by subtracting a capital charge (10.5%) for the use of gross
invested capital from after tax operating cash flow. GCF Return % is based
on trailing twelve months after tax operating cash flows (Gross Cash Flow) over average quarterly gross invested capital (Gross Operating Assets).
Refer to the appendix for additional details. |
 21
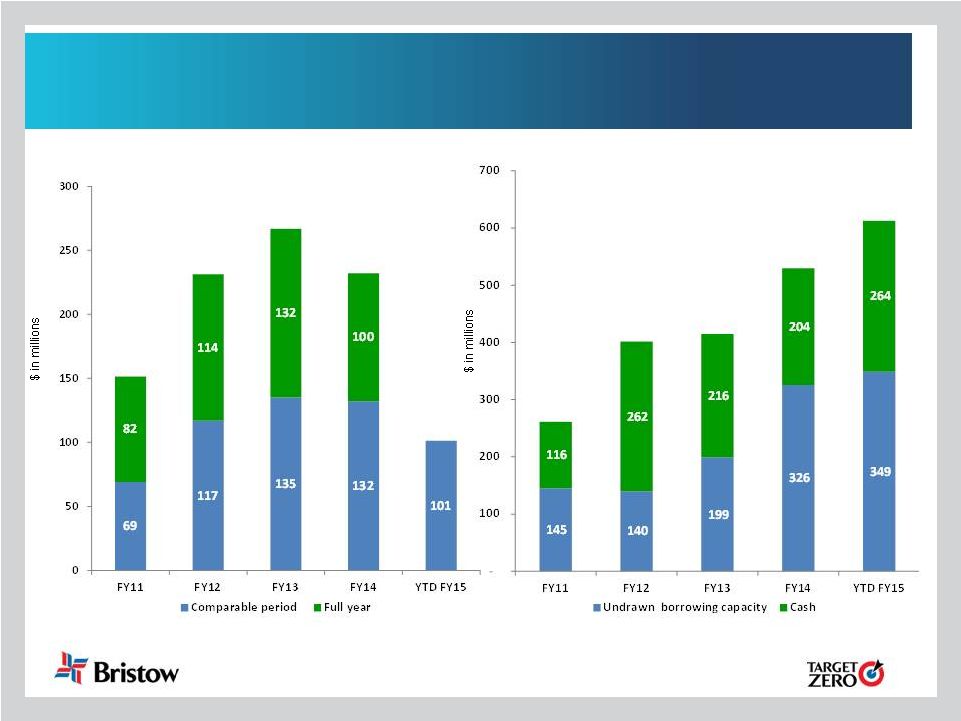
Our progress on BVA yields stronger liquidity for growth,
dividends and share repurchases . . .
1)
See 10-Q for more information on cash flow provided by operating
activities 2)
At period end
261
402
415
530
613
151
231
267
232
Net
cash
provided
by
operating
activities
1
Total liquidity
2 |
 22
FY15 guidance reaffirmed . . .
•
FY15
adjusted
EPS
guidance
range
is
reaffirmed
at
$4.70
-
$5.20,
excluding special items and aircraft sales. Other specific items
include:
*Assuming
FY15
revenue
earned
in
same
regions
and
same
mix
as
in
FY14
Highlighted figures have changed since the last earnings release. FY15
guidance as presented last quarter is included in the appendix for reference.
Long term adjusted EPS growth of 10 -
15% combined with a 20 -
30%
dividend payout policy based on forward adjusted EPS reflects
management’s commitment to deliver a stable, growing and predictable total
return for shareholders
Average LACE (Large AirCraft
Equivalent)
~161 - 167
Interest expense
~ $28 - $32M
Average LACE Rate
~ $9.50 - $10.50M
Rent expense (a/c only)
~$140 - $145M
G & A expense (all inclusive)
~ $220 - $225M
Tax rate*
~ 20 - 23%
Depreciation expense
~ $100 - $105M
Adj. EPS guidance
$4.70 - $5.20
FY15 guidance |
 23
. . . as we continue to deliver strong results in FY15
•
Declines in recent oil prices have not impacted our production
and infrastructure oriented business model
•
We continue to work with clients to identify cost effective
logistics solutions with Bristow’s global fleet and stable
balance sheet driving demand for our services
•
$4.3 billion of contracts are being implemented on schedule
and on budget starting in FY16
•
Macro economic volatility did impact Q2 FY15 adjusted EPS,
but strong BVA and cash flow performance continues
•
Our fiscal year 2015 adjusted EPS guidance range reaffirmed
at $4.70 -
$5.20 |
 Appendix |
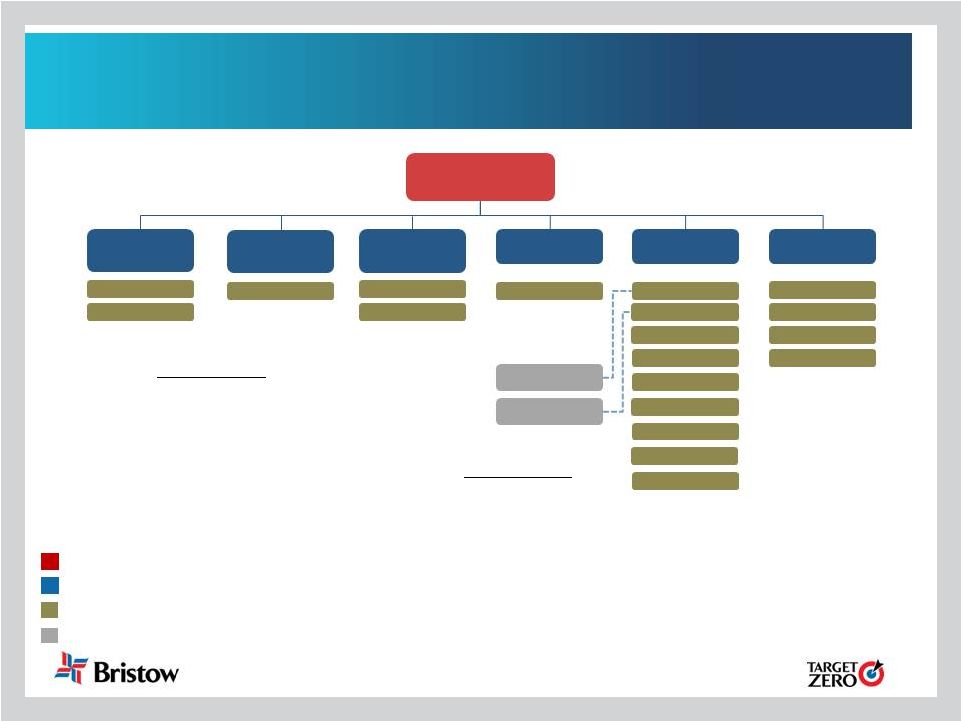 25
Organizational chart -
as of September 30, 2014
Business
Unit
(%
of
FY15
operating
revenue)
Corporate
Region
( # of aircraft / # of locations)
Joint
Venture
(#
of
aircraft)
Key
Operated Aircraft
Bristow owned and/or operated 363
aircraft as of September 30, 2014
Affiliated Aircraft
Bristow affiliates and joint
ventures operated 131 aircraft
as of September 30, 2014
* Includes corporate and other
Bristow
EBU
46%
WASBU
18%
NABU
13%
AUSBU
11%
OIBU
8%
BRS Academy
4%*
UK –
85/6
Norway –
21/4
Nigeria –
47/6
U.S.
GoM
–
59/6
Canada
–
8/2
Australia –
29/12
Brazil –
11/5
Egypt –
0/0
Malaysia –
1/1
Mexico –
2/1
Russia –
7/3
Tanzania –
3/1
Trinidad –
10/1
Turkmenistan –
2/1
Florida –
54/1
Louisiana –
13/1
Nevada –
3/1
UK –
4/1
Lider –
86
PAS –
45
Other –
4/1 |
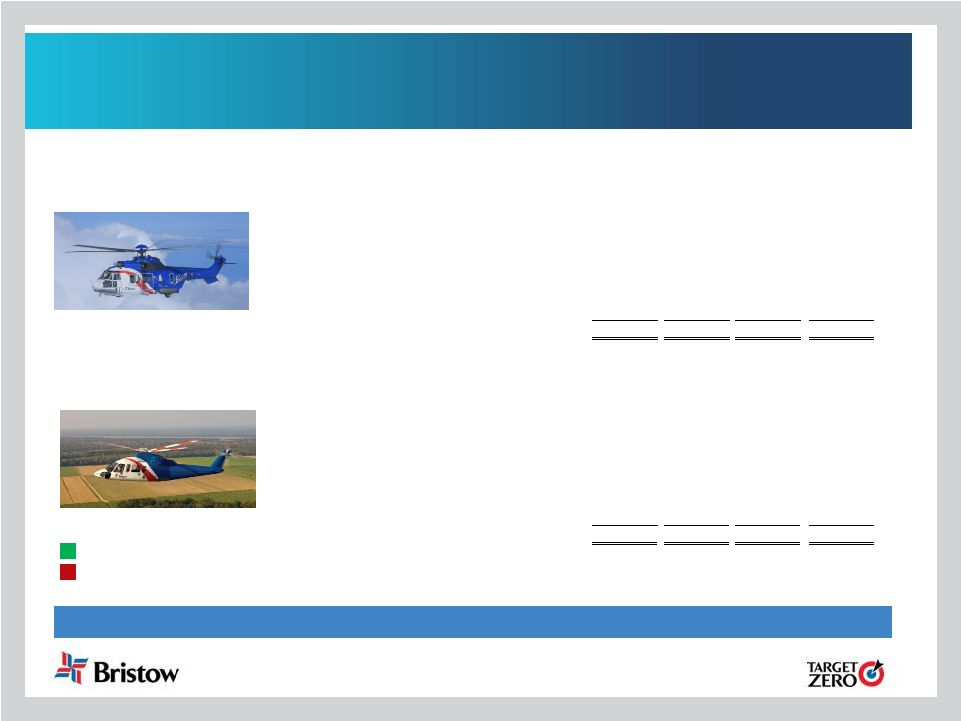 26
Aircraft fleet –
medium and large
as of September 30, 2014
Next Generation Aircraft
Medium capacity 12-15 passengers
Large capacity 16-25 passengers
Mature Aircraft
Fair
market
value
of
our
owned
fleet
is
~$1.8
billion
and
leased
fleet
is
~$1.4
billion
Aircraft
Type
No. of PAX
Engine
Consl
Unconsl
Total
Ordered
Large Helicopters
AS332 L Super Puma
18
Twin Turbine
18
-
18
-
AW189
16
Twin Turbine
2
-
2
15
EC175
16
Twin Turbine
-
-
-
5
EC225
19
Twin Turbine
23
-
23
2
Mil Mi 8
20
Twin Turbine
7
-
7
-
Sikorsky S-61
25
Twin Turbine
2
-
2
-
Sikorsky S-92
19
Twin Turbine
65
8
73
6
117
8
125
28
LACE
110
Medium Helicopters
AW139
12
Twin Turbine
18
2
20
-
Bell 212
12
Twin Turbine
-
14
14
-
Bell 412
13
Twin Turbine
23
19
42
-
EC155
13
Twin Turbine
1
-
1
-
Sikorsky S-76A/A++
12
Twin Turbine
2
5
7
-
Sikorsky S-76C/C++
12
Twin Turbine
51
34
85
-
Sikorsky S-76D
12
Twin Turbine
3
-
3
7
98
74
172
7
LACE
46
|
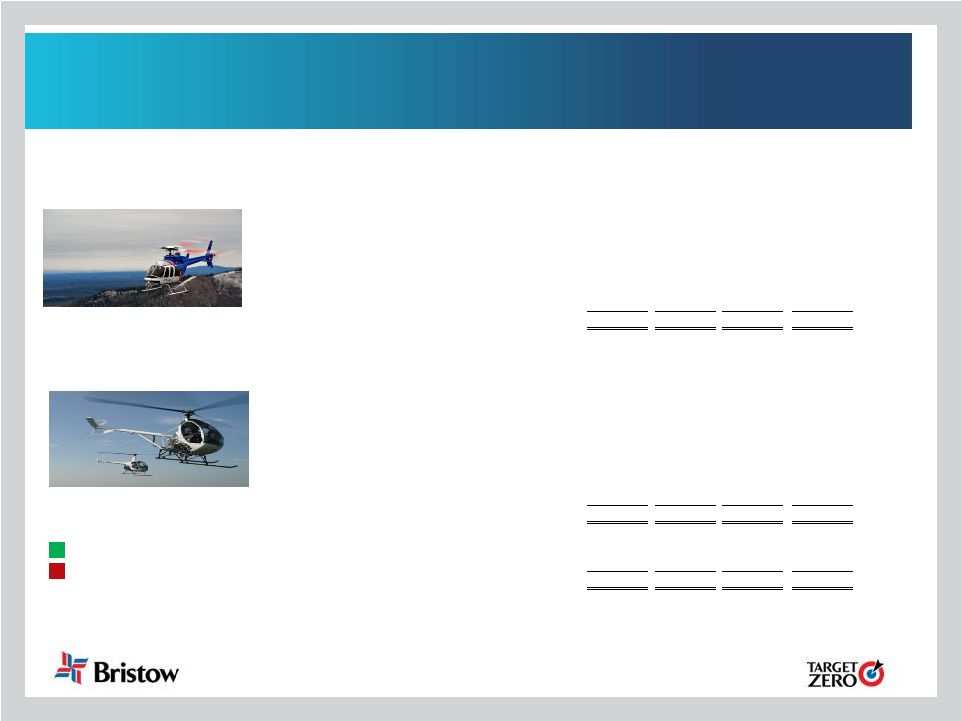 27
Aircraft fleet –
small, training and fixed
as of September 30, 2014 (continued)
Mature Aircraft
Small capacity 4-7 passengers
Training capacity 2-6 passengers
* LACE does not include held for sale, training helicopters and fixed wing
Next Generation Aircraft
Aircraft
Type
No. of PAX
Engine
Consl
Unconsl
Total
Ordered
Small Helicopters
AW109
6
Twin Turbine
-
1
1
AS 350BB
4
Turbine
-
2
2
Bell 206B
4
Turbine
1
2
3
-
Bell 206 L Series
6
Turbine
5
6
11
-
Bell 407
6
Turbine
33
-
33
-
BK-117
7
Twin Turbine
2
-
2
-
EC135
6
Twin Turbine
-
3
3
-
41
14
55
-
LACE
10
Training Helicopters
AW109
6
Twin Turbine
2
-
2
-
AS 355
5
Twin turbine
2
-
2
-
Bell 206B
4
Turbine
12
-
12
-
Robinson R22
2
Piston
8
-
8
-
Robinson R44
4
Piston
7
-
7
-
Sikorsky 300CB/CBi
2
Piston
42
-
42
-
Fixed Wing
1
-
1
-
74
-
74
-
Fixed Wing
33
35
68
-
Total
363
131
494
35
TOTAL LACE (Large Aircraft Equivalent)*
166 |
 28
Operating lease strategy: lowering the cost and amount of
capital needed to grow
•
Of the 110 aircraft currently leased in our fleet, 67 are commercial (56 LACE), 30
are training and 13 fixed wing
•
56 LACE aircraft represent approximately 34% of our commercial fleet
•
Our
goal
is
for
commercial
fleet
operating
leases
to
account
for
approximately
30-35% of our LACE
Leased aircraft as of September 30, 2014
Small
Medium
Large
Total
Leased LACE
Total LACE
% Leased
EBU
-
1
35
36
36
67
53%
WASBU
-
1
1
2
2
23
7%
NABU
1
13
5
19
12
32
36%
AUSBU
2
2
6
10
8
22
35%
OIBU
-
-
-
-
-
23
-
Total
3
17
47
67
56
166
34%
*
* The percentage of LACE leased is calculated by taking the total LACE for leased aircraft divided by
the total LACE for all aircraft we operate, including both owned and leased aircraft.
See 10-Q Note 5 “Commitments and Contingencies” for more information provided on
operating leases. |
 29
Consolidated fleet changes and aircraft sales for
Q2 FY15
Small
Medium
Large
Training
Total
EBU
-
-
5
-
5
WASBU
-
2
-
-
2
NABU
-
-
-
-
-
AUSBU
-
-
2
-
2
OIBU
-
4
-
-
4
Academy
-
-
-
1
1
Total
-
6
7
1
14
Held for sale aircraft in consolidated fleet
Small
Medium
Large
Training
Fixed wing
Total
EBU
-
1
35
-
13
49
WASBU
-
1
1
-
-
2
NABU
1
13
5
-
-
19
AUSBU
2
2
6
-
-
10
OIBU
-
-
-
-
-
-
Academy
-
-
-
30
-
30
Total
3
17
47
30
13
110
Leased aircraft in consolidated fleet
# of a/c Sold
Cash
received*
Q1 FY15
4
4.7
$
Q2 FY15
7
8.2
$
Total
11
12.9
$
* Amounts stated in millions
Q1 FY15
Q2 FY15
Fleet Count Beginning
363
363
Delivered
Large
6
2
Medium
3
-
Total Delivered
9
2
Removed
Sales
(4)
(7)
Other*
(5)
5
Total Removed
(9)
(2)
363
363
* Includes writeoffs, lease returns and commencements
Fleet changes
See 10-Q Note 5 “Commitments and Contingencies” for more information provided on
operating leases |
 30
Operating revenue, LACE and LACE rate by BU
1)
$ in millions
2)
LACE rate is annualized
3)
$ in millions per LACE
4)
Excludes Bristow Academy and Eastern Airways
Op revenue
1
LACE
LACE Rate
2,3
EBU
$328
67
$9.78
WASBU
160
23
14.23
NABU
113
32
7.04
AUSBU
94
22
8.72
OIBU
71
23
6.20
Total
$784
166
$9.43
Operating Revenue, LACE, and LACE Rate by BU
as of September 30, 2014
4 |
 31
Historical LACE by BU
Q1
Q2
Q3
Q4
Q1
Q2
Q3
Q4
Q1
Q2
Q3
Q4
EBU
45
45
45
42
42
43
48
46
44
46
46
45
WASBU
23
23
24
25
24
24
21
22
23
22
22
22
NABU
39
36
36
36
39
35
34
29
30
29
30
30
AUSBU
20
20
22
22
20
23
24
20
19
20
20
19
OIBU
36
34
34
35
33
33
33
38
39
38
38
34
Consolidated
163
158
161
160
157
158
159
154
154
154
155
149
Q1
Q2
Q3
Q4
Q1
Q2
Q3
Q4
Q1
Q2
EBU
47
45
51
55
57
59
59
56
61
67
WASBU
22
22
20
21
21
21
22
23
23
23
NABU
30
31
39
37
37
33
34
34
33
32
AUSBU
18
17
17
19
19
19
20
22
23
22
OIBU
32
28
27
27
27
28
28
24
25
23
Consolidated
147
142
154
158
161
160
162
158
163
166
LACE
FY11
FY12
FY10
FY13
FY14
FY15 |
  32
Historical LACE rate by BU
1) $ in millions
2) LACE rate is annualized
Q1
Q2
Q3
Q4
Q1
Q2
Q3
Q4
Q1
Q2
Q3
Q4
EBU
$8.36
$8.28
$8.40
$8.76
$8.20
$8.50
$7.90
$8.40
$9.80
$9.60
$9.63
$10.09
WASBU
9.08
8.81
8.66
8.34
9.70
9.40
10.70
9.90
9.10
10.30
11.17
11.46
NABU
5.05
5.44
5.26
5.23
5.40
6.10
6.00
6.60
5.80
6.30
5.89
5.79
AUSBU
5.38
5.56
5.59
5.67
6.80
6.00
6.00
7.50
8.60
7.10
6.96
7.78
OIBU
3.66
4.09
4.06
3.78
3.90
4.10
4.40
3.90
3.50
3.70
3.78
4.22
Consolidated
$6.31
$6.52
$6.49
$6.45
$6.70
$6.90
$6.90
$7.10
$7.30
$7.40
$7.43
$7.89
Q1
Q2
Q3
Q4
Q1
Q2
Q3
Q4
Q1
Q2
EBU
$10.60
$11.03
$9.74
$9.13
$9.63
$9.95
$10.30
$10.84
$10.60
$9.78
WASBU
12.35
12.24
13.71
13.28
14.26
14.62
14.17
13.99
14.21
14.23
NABU
7.05
7.11
5.84
6.12
6.34
7.13
6.75
6.84
7.02
7.04
AUSBU
8.48
9.29
9.55
8.58
8.04
7.74
7.21
6.76
8.27
8.72
OIBU
4.22
4.62
4.76
4.94
4.97
4.73
4.58
5.57
5.80
6.20
Consolidated
$8.55
$8.95
$8.49
$8.35
$8.78
$9.07
$8.97
$9.34
$9.55
$9.43
LACE Rate
1,2
FY10
FY11
FY12
FY13
FY14
FY15 |
 33
Order and options book as of September 30, 2014
#
Helicopter
Class
Delivery Date
1
Large
September 2015
1
Large
December 2015
1
Medium
December 2015
1
Large
March 2016
3
Medium
March 2016
3
Large
June 2016
3
Medium
June 2016
3
Large
September 2016
2
Medium
September 2016
4
Large
December 2016
1
Medium
December 2016
2
Large
March 2017
1
Medium
March 2017
4
Large
June 2017
1
Medium
June 2017
3
Large
September 2017
1
Medium
September 2017
4
Large
December 2017
3
Medium
December 2017
1
Large
March 2018
2
Medium
March 2018
1
Large
June 2018
1
Large
September 2018
1
Large
December 2018
48
OPTIONS BOOK
#
Helicopter
Class
Delivery Date
Location
Contracted
1
Large
December-14
AUSBU
1 of 1
1
Large
March-15
EBU
2
Medium
June-15
WASBU
1
Large
June-15
EBU
1
Medium
June-15
NABU
4
Medium
September-15
WASBU
1
Large
September-15
EBU
2
1
Large
September-15
NABU
1 of 1
1
Large
December-15
AUSBU
1 of 1
2
1
Large
December-15
AUSBU
1 of 1
2
Large
December-15
EBU
2
1
Large
December-15
IBU
1
Large
March-16
EBU
1
Large
June-16
EBU
2
Large
June-16
NABU
1
Large
September-16
NABU
2
Large
December-16
NABU
24
4 of 24
ORDER BOOK
1
1)
Five large aircraft on order and seven large aircraft on option are subject to the successful
development and certification of the aircraft
2)
SAR configured
3)
The aircraft that are indicated in grey italic will be leased upon delivery |
 34
Order and options book as of September 30, 2014 (continued)
#
Helicopter
Class
Delivery Date
Location
Contracted
1
Large
December-14*
EBU
1 of 1
2
Large
December-14
EBU
2 of 2
3
Large
March-15
EBU
3 of 3
2
Large
March-15
EBU
2 of 2
2
Large
June-15
EBU
2 of 2
1
Large
June-15
EBU
1 of 1
2
Large
September-15
EBU
2 of 2
1
Large
September-15
EBU
1 of 1
2
Large
December-15
EBU
2 of 2
16
16 of 16
The aircraft that are indicated in grey italic will be leased upon delivery
UK SAR CONFIGURED ORDER BOOK
*This aircraft was delivered on October 8, 2014 |
 35
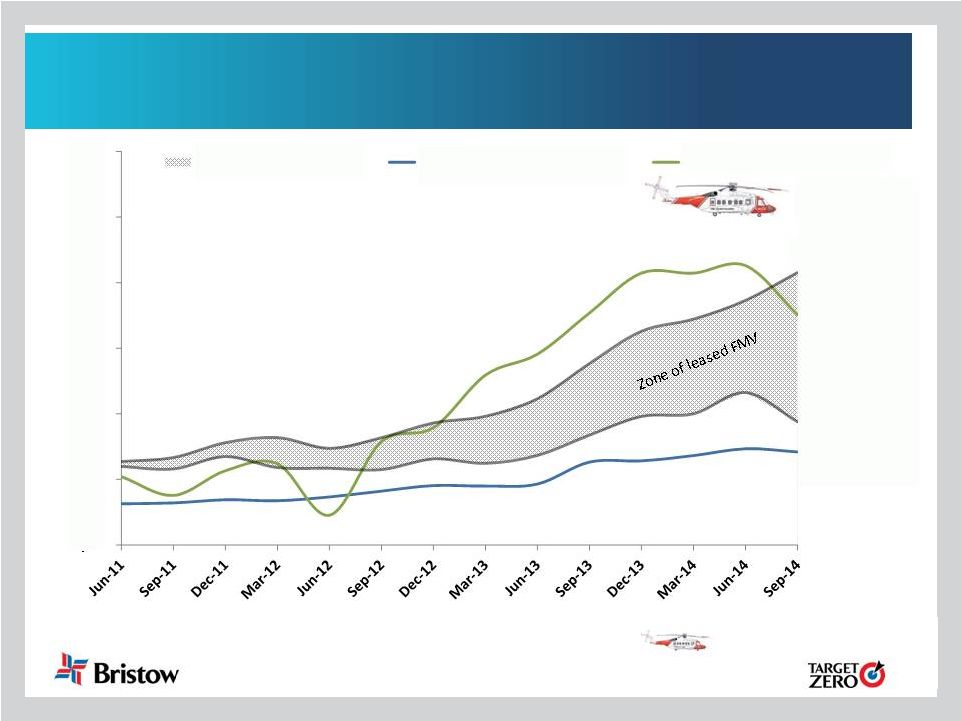
Total net asset FMV with and without leased aircraft FMV
NOTE: The gray shaded area represents the range of FMV with and without the impact
of leased aircraft (upper range includes leased aircraft and related NPV of lease payments; lower
range excludes FMV of leased aircraft as well as the NPV of lease payments).
$87.99
49.19
70.12
$76.55
53.79
$35
$45
$55
$65
$75
$85
$95
Net asset FMV per share
Book value of equity per share
Average stock price
The reconciliation for net asset FMV per share (shaded area) and net asset
FMV per share implied by our UK SAR aircraft ( ) is provided on
the following pages |
 36
Net asset FMV reconciliation as of September 30, 2014
(in millions)
Including leases
Excluding leases
(+) FMV of a/c
1,829
$
1,829
$
(+) FMV of leased a/c
1,415
-
(+) NBV of PPE w/o a/c
581
581
(+) Working capital
350
350
(-) LT debt
(766)
(766)
(-) Leased imputed debt
(602)
-
(-) Pension liability
(72)
(72)
Net asset FMV
2,735
$
1,922
$
# of common shares
35.7
35.7
Net asset FMV per share
76.55
$
53.79
$
September 30, 2014 |
 37
UK SAR net asset FMV reconciliation
UK SAR contribution
(in millions)
September 30, 2014
FY16 - FY17
Implied
(+) FMV of a/c
1,829
79
1,908
(+) FMV of leased a/c
1,415
289
1,704
(+) NBV of PPE w/o a/c
581
113
694
(+) Working
capital 350
174
524
(-) LT
debt (766)
(88)
(854)
(-) Leased
imputed debt (602)
(158)
(760)
(-) Pension
liability (72)
-
(72)
Net
asset FMV 2,735
$
409
$
3,144
$
# of common shares
35.7
35.7
35.7
Net asset FMV per
share 76.55
$
11.44
$
87.99
$
|
 38
Adjusted EBITDAR margin* trend
Q1
Q2
Q3
Q4
Full Year
Q1
Q2
Q3
Q4
Full Year
EBU
33.0%
31.4%
30.7%
36.1%
32.9%
32.2%
34.6%
39.5%
38.3%
36.2%
WASBU
29.5%
35.5%
37.2%
36.6%
35.0%
31.9%
26.5%
35.0%
31.8%
31.5%
NABU
14.3%
20.6%
14.8%
19.4%
17.3%
23.2%
20.7%
29.1%
29.5%
25.7%
AUSBU
20.2%
14.4%
23.5%
35.6%
24.3%
27.0%
28.0%
27.3%
26.0%
27.1%
OIBU
48.1%
19.1%
47.8%
42.9%
39.5%
36.2%
44.2%
55.7%
51.6%
46.6%
Consolidated
23.4%
24.0%
27.6%
31.2%
26.6%
26.3%
26.1%
31.5%
29.4%
28.3%
Q1
Q2
Q3
Q4
Full Year
Q1
Q2
EBU
30.3%
35.3%
35.3%
37.3%
34.7%
34.1%
33.7%
WASBU
31.3%
30.4%
33.5%
33.2%
32.1%
25.6%
31.1%
NABU
29.2%
31.0%
33.1%
35.4%
32.1%
39.7%
32.4%
AUSBU
17.7%
21.0%
15.0%
24.0%
19.6%
23.7%
22.6%
OIBU
67.4%
39.3%
33.2%
53.3%
47.7%
41.4%
18.5%
Consolidated
28.5%
28.7%
27.0%
30.4%
28.6%
29.2%
25.4%
FY13
FY14
FY12
FY15
*
Adjusted EBITDAR excludes special items and asset dispositions and margin is calculated by taking
adjusted EBITDAR divided by operating revenue |
 39
Adjusted EBITDAR* reconciliation
* Adjusted EBITDAR excludes special items and asset dispositions
($ in millions)
Q1
Q2
Q3
Q4
FY12
Q1
Q2
Q3
Q4
FY13
Net income
$21
$3
$26
$15
$65
$24
$30
$37
$40
$132
Income tax expense
$7
-$2
$7
$2
$14
$6
$8
$8
$13
$35
Interest expense
$9
$9
$10
$10
$38
$9
$9
$15
$10
$42
Gain on disposal of assets
-$1
$2
$3
$29
$32
$5
$1
-$7
-$7
-$8
Depreciation and amortization
$23
$25
$23
$25
$96
$21
$23
$25
$27
$96
Special items
$0
$25
$0
$3
$28
$2
-$2
$15
$2
$16
Adjusted EBITDA Subtotal
$58
$62
$69
$84
$273
$68
$70
$92
$85
$314
Rental expense
$9
$9
$13
$15
$46
$16
$15
$18
$18
$67
Adjusted EBITDAR
$67
$71
$82
$99
$319
$84
$85
$109
$103
$381
($ in millions)
Q1
Q2
Q3
Q4
FY14
Q1
Q2
Net income
$27
$110
$19
$32
$188
$45
$28
Income tax expense
$8
$41
$3
$6
$57
$12
$6
Interest expense
$20
$9
$7
$8
$45
$7
$8
Gain on disposal of assets
$2
$3
-$4
$0
$1
-$1
$0
Depreciation and amortization
$23
$24
$24
$26
$96
$25
$28
Special items
$0
-$102
$24
$20
-$59
$6
$7
Adjusted EBITDA Subtotal
$79
$85
$72
$92
$328
$95
$77
Rental expense
$23
$23
$28
$31
$106
$33
$35
Adjusted EBITDAR
$102
$109
$101
$123
$434
$128
$112
Fiscal year ended,
3/31/2012
3/31/2013
3/31/2014
3/31/2015
Fiscal year ended, |
 40
Bristow Value Added (BVA)
Sample calculation for Q2 FY15 and Q2 FY14
Bristow
Value
Added
=
Gross
Cash
Flow
–
(Gross
Operating
Assets
X
Capital
Charge)
BVA
= GCF -
(
GOA X 10.5%** )
Bristow Value Added calculation for Q2 FY15
$26.1
= $120.0* -
( $3,575*
X 2.625%**) Bristow Value Added
calculation for Q2 FY14 $22.4
=
$109.2*
-
(
$3,309*
X
2.625%**)
* Reconciliation for these items follows right after this
slide ** Quarterly capital charge of 2.625% is based on annual
capital charge of 10.5% |
 41
Bristow gross cash flow reconciliation
(in millions)
Gross cash flow reconciliation
Q2 FY14
Q2 FY15
Net income
111
26
Depreciation and amortization
24
28
Interest expense
9
8
Interest income
(1)
(0)
Rent
23
35
Other income/expense-net
(105)
3
Gain/loss on asset sale
3
(0)
Special items
3
6
Tax effect from special items
35
(2)
Earnings (losses) from unconsolidated affiliates, net
(3)
3
Non-controlling interests
(1)
2
Gross cash flow before Lider
$98
$109
Gross cash flow - Lider proportional
12
11
Gross cash flow after Lider
$109
$120 |
 42
Bristow adjusted gross operating assets reconciliation
(in millions)
Adjusted gross operating assets reconciliation
Q2 FY14
Q2 FY15
Total assets
3,166
3,280
Accumulated depreciation
518
511
Capitalized operating leases
373
610
Cash and cash equivalents
(314)
(264)
Current assets from discontinued operations
0
0
Long-term assets from discontinued operations
0
0
Assets from discontinued operations
-
-
Investment in unconsolidated entities
(272)
(261)
Goodwill
(30)
(56)
Prepaid pension cost
-
-
Intangibles
(2)
(17)
Assets held for sale: net
(27)
(32)
Assets held for sale: gross
56
74
Adj. for gains & losses on assets sales
(8)
24
Accounts payable
(70)
(80)
Accrued maintenance and repairs
(17)
(20)
Other accrued taxes
(10)
(11)
Accrued wages, benefits and related taxes
(49)
(63)
Other accrued liabilities
(24)
(184)
Income taxes payable
(33)
(9)
Deferred revenue
(21)
(30)
ST deferred taxes
(2)
(12)
LT deferred taxes
(155)
(166)
Adjusted gross operating assets before Lider
$3,079
$3,296
Adjusted gross operating assets - Lider proportional
230
279
Adjusted gross operating assets after Lider
3,309
3,575
|
 43
Líder Bristow Value Added (BVA)
Sample calculation for Q2 FY15 and Q2 FY14
Bristow
Value
Added
=
Gross
Cash
Flow
–
(Gross
Operating
Assets
X
Capital
Charge)
BVA
= GCF -
(
GOA X 10.5%** )
Bristow Value Added calculation for Q2 FY15
$3.9
=
$11.3*
-
(
$279*
X
2.625%**)
Bristow Value Added calculation for Q2 FY14
$5.6
=
$11.6*
-
(
$230*
X
2.625%**)
* Reconciliation for these items follows right after this
slide ** Quarterly capital charge of 2.625% is based on annual
capital charge of 10.5% |
 44
Líder gross cash flow reconciliation
($ in millions)
Gross cash flow reconciliation
Q2 FY14
Q2 FY15
Net income (loss)
22.1
$
11.7
$
Depreciation and amortization
4.1
3.5
Rent
6.6
7.3
Interest expense
3.7
4.1
Interest income
(0.9)
(1.5)
FX (gains) losses
(10.6)
2.4
Other income/expense-net
(2.0)
(0.2)
Special Adjustment- remove Lider tax per income stmt.
12.0
3.7
Earnings (losses) from unconsolidated affiliates, net
0.3
-
Non-controlling Interests
(0.3)
(0.8)
Gross cash flow
34.9
30.2
Special item outside of Lider - add Bristow tax calc.
(7.6)
(3.4)
Gross cash flow
27.4
26.9
42.5% Lider proportional consolidation - GCF
11.6
$
11.3
$ |
 45
Líder adjusted gross operating assets reconciliation
($ in millions)
Adjusted gross operating assets reconciliation
Q2 FY14
Q2 FY15
Total assets
595.2
$
641.7
$
Cash and cash equivalents
(98.2)
(64.5)
Accumulated depreciation
71.8
85.8
Capitalized operating leases
132.2
146.7
Investments & escrow deposits
(31.8)
(49.8)
Intangibles
(5.2)
(5.8)
Intangibles, amortization
4.0
4.4
Other, non operating assets
(24.1)
(9.7)
Adj. for gains & losses on assets sales
-
-
Accounts payable
(27.0)
(43.0)
Other payables
(2.4)
(2.1)
Other accrued taxes
-
(3.5)
Accrued wages, benefits and related taxes
(20.0)
(19.7)
Income taxes payable
(6.3)
(4.9)
Deferred revenue
(14.0)
(9.8)
LT deferred taxes
(33.5)
-
Adjusted gross operating assets
540.8
665.8
42.5% Lider proportional consolidation GOA
229.8
$
278.8
$ |
 46
Líder's adjusted EBITDAR* reconciliation
* Adjusted EBITDAR excludes special items and asset dispositions
($ in millions)
Q3 CY13
Q4 CY13
Q1 CY14
Q2 CY14
Q3 CY14
Gross revenue
116.8
119.3
121.2
113.7
116.4
(-) Revenue deductions
(6.6)
(7.6)
(5.9)
(7.3)
(7.7)
Net operating revenue
110.2
111.3
115.3
106.4
108.7
(-) Cost of products and services
(84.2)
(87.0)
(90.8)
(79.5)
(82.0)
Gross profit
26.0
24.6
24.5
26.9
26.6
(-) Selling and administrative expenses
(10.3)
(9.6)
(7.0)
(7.5)
(8.8)
(+) Equity income of associates
0.4
(0.0)
0.5
0.8
(0.6)
(+) Other operating income/expenses
1.2
0.7
0.2
0.2
0.2
Operating result
17.3
15.7
18.3
20.4
17.5
(+) Depreciation and amortization - cost
3.4
3.2
3.2
3.3
3.3
(+) Depreciation and amortization - expenses
0.2
0.2
0.2
0.2
0.2
EBITDA
21.0
19.2
21.6
23.9
21.0
Leasing costs
6.5
7.3
7.4
7.3
7.4
Adjusted EBITDAR
27.4
26.4
29.1
31.2
28.4
|
 47
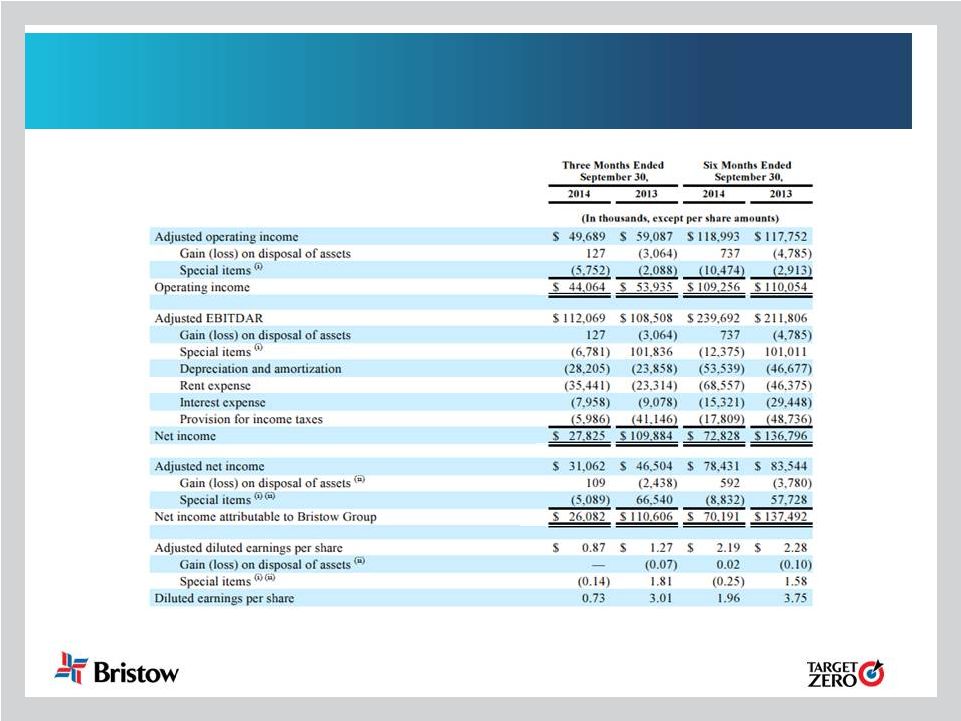
GAAP reconciliation
(i) See information about special items in 10-Q or earnings release for Q2
FY15 (ii)
These amounts are presented after applying the appropriate tax effect to each item
and dividing by the weighted average shares outstanding during the related period to calculate the earnings per share impact |
 48
Bristow leverage reconciliation
*Adjusted EBITDAR excludes gains and losses on dispositions of assets
Debt
Investment
Capital
Leverage
(a)
(b)
(c) = (a) + (b)
(a) / (c)
(in millions)
As of September 30, 2014
779.5
$
1,757.5
$
2,537.0
$
30.7%
Adjust for:
Unfunded Pension Liability
71.8
71.8
NPV of Lease Obligations
602.2
602.2
Letters of credit
2.6
2.6
Adjusted
1,456.1
$
(d)
1,757.5
$
3,213.6
$
45.3%
Calculation of debt to adjusted EBITDAR multiple
TTM Adjusted EBITDAR*:
FY 2015
461.5
$
(e) |
 49
Líder leverage reconciliation
(in millions)
Sep-13
Sep-14
Total book debt
279
$
317
$
NPV of leases
75
51
Total adjusted debt
354
368
TTM adjusted EBITDAR
125
$
115
$
Adjusted debt / TTM adj. EBITDAR
2.8x
3.2x |
 50
FY15 guidance
Average LACE (Large AirCraft
Equivalent)
~161 -
167
Interest expense
~ $30 -
$35M
Average LACE Rate
~ $9.50 -
$10.50M
Rent expense (a/c only)
~$137 -
$142M
G & A expense (all inclusive)
~ $190 -
$200M
Tax rate*
~ 21 -
25%
Depreciation expense
~ $97 -
$102M
Adj. EPS guidance
$4.70 -
$5.20
FY15 guidance as of June 30, 2014
Average LACE (Large AirCraft
Equivalent)
~161 -
167
Interest expense
~ $28 -
$32M
Average LACE Rate
~ $9.50 -
$10.50M
Rent expense (a/c only)
~$140 -
$145M
G & A expense (all inclusive)
~ $220 -
$225M
Tax rate*
~ 20 -
23%
Depreciation expense
~ $100 -
$105M
Adj. EPS guidance
$4.70 -
$5.20
FY15 guidance as of September 30, 2014 |
 51
Bristow Group Inc. (NYSE: BRS)
2103 City West Blvd., 4
th
Floor
Houston, Texas 77042
t
713.267.7600
f
713.267.7620
bristowgroup.com
Contact us |