Attached files
| file | filename |
|---|---|
| 8-K - FORM 8-K - REDWOOD TRUST INC | d796617d8k.htm |
| EX-99.1 - EX-99.1 - REDWOOD TRUST INC | d796617dex991.htm |
| EX-99.3 - EX-99.3 - REDWOOD TRUST INC | d796617dex993.htm |
Exhibit 99.2


| T A B L E O F C O N T E N T S |
| Introduction |
5 | |||
| Shareholder Letter |
6 | |||
| Quarterly Overview |
8 | |||
| Financial Insights |
15 | |||
|
„ GAAP Income |
15 | |||
|
„ Balance Sheet |
20 | |||
|
„ Taxable Income and Dividends |
29 | |||
| Business Segments |
31 | |||
|
„ Residential Mortgage Banking |
32 | |||
|
„ Residential Investments |
33 | |||
|
„ Commercial Mortgage Banking and Investments |
35 | |||
| Appendix |
38 | |||
|
„ Redwood’s Business Strategy |
39 | |||
|
„ Glossary |
41 | |||
|
„ Financial Tables |
50 | |||
THE REDWOOD REVIEW | 3RD QUARTER 2014 1
| C A U T I O N A R Y S T A T E M E N T |
This Redwood Review contains forward-looking statements within the meaning of the safe harbor provisions of the Private Securities Litigation Reform Act of 1995. Forward-looking statements involve numerous risks and uncertainties. Our actual results may differ from our expectations, estimates, and projections and, consequently, you should not rely on these forward-looking statements as predictions of future events. Forward-looking statements are not historical in nature and can be identified by words such as “anticipate,” “estimate,” “will,” “should,” “expect,” “believe,” “intend,” “seek,” “plan,” and similar expressions or their negative forms, or by references to strategy, plans, goals, or intentions. These forward-looking statements are subject to risks and uncertainties, including, among other things, those described in our most recent Annual Report on Form 10-K under the caption “Risk Factors.” Other risks, uncertainties, and factors that could cause actual results to differ materially from those projected are described below and may be described from time to time in reports we file with the Securities and Exchange Commission, including reports on Forms 10-K, 10-Q, and 8-K. We undertake no obligation to update or revise forward-looking statements, whether as a result of new information, future events, or otherwise.
Statements regarding the following subjects, among others, are forward-looking by their nature: (i) statements we make regarding Redwood’s business strategy and strategic focus, including statements relating to our confidence in our overall market position, strategy and long-term prospects, and our belief in the long-term efficiency of private label securitization as a form of mortgage financing; (ii) statements we make regarding our new risk-sharing arrangement with Fannie Mae, including our belief that, under this arrangement, we can enhance the profitability of transacting in conforming loans that we plan to sell to Fannie Mae during the fourth quarter of 2014, as well as our expectations of reducing taxpayer risk through an upfront credit risk transfer and by increasing the role of private capital in the mortgage market; (iii) statements we make regarding our new business relationships with the Federal Home Loan Bank of Chicago (FHLBC), including our plan to acquire eligible residential loans from up to approximately 750 Federal Home Loan Bank members and our expectations regarding the timing for commencing the acquisition program, and our statements relating to quantifying the acquisition opportunity; (iv) statements we make regarding the FHFA’s notice of proposed rulemaking (NPR) relating to FHLB membership requirements, including the potential implications for our captive insurance subsidiary’s membership in the FHLB; (v) statements we make regarding the outlook for our commercial business, including our positioning to benefit from a substantial wave of refinance opportunities set to begin in 2015, industry estimates relating to maturing CMBS loans, our pipeline of loans under application for the fourth quarter of 2014, and our projected total origination volume for 2014; (vi) statements we make regarding the outlook for the residential mortgage market, including expectations relating to residential loan originations in 2014; (vii) statements related to our residential mortgage banking activities, including our long-term loan sale profit margin target of 25-to-50 basis points, our expectation to complete at least one more Sequoia securitization in the fourth quarter of 2014, our expectation for whole loan sales to remain our most active distribution channel for the remainder of 2014, statements we make relating to the risk retention rules applicable to residential securitization transactions and our expectation of their impact on our
THE REDWOOD REVIEW | 3RD QUARTER 2014 2
| C A U T I O N A R Y S T A T E M E N T |
business and our expectations regarding the impact of timing differences related to loans identified for purchase at September 30, 2014 on our reported income in the fourth quarter of 2014; (viii) statements relating to acquiring residential mortgage loans in the future that we have identified for purchase or plan to purchase, including the amount of such loans that we identified for purchase during the third quarter of 2014 and at September 30, 2014, and statements relating to expected fallout and the corresponding volume of residential mortgage loans expected to be available for purchase; (ix) statements relating to our estimate of our investment capacity (including that we estimate our investment capacity at September 30, 2014 to be approximately $145 million), our statements related to sourcing additional capital prior to the end of 2014, our belief that our remaining investment capacity is sufficient to fund our near-term investment activities, the likelihood of needing additional capital to make sustained long-term investments over the coming quarters, and our consideration of raising capital from outside sources, such as through a convertible debt offering or other medium- or long-term debt issuance; (x) statements we make regarding our dividend policy and our process for determining dividends; and (xi) statements regarding our expectations and estimates relating to the characterization for income tax purposes of our dividend distributions, our expectations and estimates relating to tax accounting, tax liabilities and tax savings, and GAAP tax provisions, our estimates of REIT taxable income and TRS taxable income, and our anticipation of additional credit losses for tax purposes in future periods (and, in particular, our statement that, for tax purposes, we expect an additional $36 million of tax credit losses on residential securities we currently own to be realized over an estimated three- to five-year period).
Important factors, among others, that may affect our actual results include: general economic trends, the performance of the housing, commercial real estate, mortgage, credit, and broader financial markets, and their effects on the prices of earning assets and the credit status of borrowers; federal and state legislative and regulatory developments, and the actions of governmental authorities, including those affecting the mortgage industry or our business; developments related to the fixed income and mortgage finance markets and the Federal Reserve’s statements regarding its future open market activity and monetary policy; our exposure to credit risk and the timing of credit losses within our portfolio; the concentration of the credit risks we are exposed to, including due to the structure of assets we hold and the geographical concentration of real estate underlying assets we own; our exposure to adjustable-rate mortgage loans; the efficacy and expense of our efforts to manage or hedge credit risk, interest rate risk, and other financial and operational risks; changes in credit ratings on assets we own and changes in the rating agencies’ credit rating methodologies; changes in interest rates; changes in mortgage prepayment rates; the availability of assets for purchase at attractive prices and our ability to reinvest cash we hold; changes in the values of assets we own; changes in liquidity in the market for real estate securities and loans; our ability to finance the acquisition of real estate-related assets with short-term debt; the ability of counterparties to satisfy their obligations to us; our involvement in securitization transactions, the profitability of those transactions, and the risks we are exposed to in engaging in securitization transactions; exposure to claims and litigation, including litigation arising from our involvement in securitization transactions; whether we have sufficient liquid assets to meet short-term needs;
THE REDWOOD REVIEW | 3RD QUARTER 2014 3
| C A U T I O N A R Y S T A T E M E N T |
our ability to successfully compete and retain or attract key personnel; our ability to adapt our business model and strategies to changing circumstances; changes in our investment, financing, and hedging strategies and new risks we may be exposed to if we expand our business activities; exposure to environmental liabilities; our failure to comply with applicable laws and regulations; our failure to maintain appropriate internal controls over financial reporting and disclosure controls and procedures; the impact on our reputation that could result from our actions or omissions or from those of others; changes in accounting principles and tax rules; our ability to maintain our status as a REIT for tax purposes; limitations imposed on our business due to our REIT status and our status as exempt from registration under the Investment Company Act of 1940; decisions about raising, managing, and distributing capital; and other factors not presently identified.
This Redwood Review may contain statistics and other data that in some cases have been obtained from or compiled from information made available by servicers and other third-party service providers.
THE REDWOOD REVIEW | 3RD QUARTER 2014 4
| I N T R O D U C T I O N |
Note to Readers:
We file annual reports (on Form 10-K) and quarterly reports (on Form 10-Q) with the Securities and Exchange Commission. These filings and our earnings press releases provide information about Redwood and our financial results in accordance with generally accepted accounting principles (GAAP). We urge you to review these documents, which are available through our website, www.redwoodtrust.com.
This document, called The Redwood Review, is an additional format for providing information about Redwood through a discussion of our GAAP financial results, as well as other metrics, such as taxable income. Supplemental information is also provided in the Financial Tables in this Review to facilitate more detailed understanding and analysis of Redwood. We may also provide non-GAAP financial measures in this Review. When we use non-GAAP financial measures it is because we believe that these figures provide additional insight into Redwood’s business. In each case in which we discuss a non-GAAP financial measure you will find an explanation of how it has been calculated, why we think the figure is important, and a reconciliation between the GAAP and non-GAAP figures.
References herein to “Redwood,” the “company,” “we,” “us,” and “our” include Redwood Trust, Inc. and its consolidated subsidiaries. Note that because we round numbers in the tables to millions, except per share amounts, some numbers may not foot due to rounding. References to the “third quarter” refer to the quarter ending September 30, 2014, and references to the “second quarter” refer to the quarter ending June 30, 2014, unless otherwise specified.
We hope you find this Review helpful to your understanding of our business. We thank you for your input and suggestions, which have resulted in our changing the form and content of The Redwood Review over time.
| Selected Financial Highlights | ||||||||||
| Quarter:Year | GAAP Income per Share |
REIT Taxable Income per Share (1) |
Annualized GAAP Return on Equity |
GAAP Book Value per Share |
Dividends per Share | |||||
| Q314 | $0.50 | $0.21 | 14% | $15.21 | $0.28 | |||||
| Q214 | $0.18 | $0.17 | 5% | $15.03 | $0.28 | |||||
| Q114 | $0.14 | $0.19 | 4% | $15.14 | $0.28 | |||||
| Q413 | $0.29 | $0.20 | 8% | $15.10 | $0.28 | |||||
| Q313 | $0.25 | $0.24 | 7% | $14.65 | $0.28 | |||||
| Q213 | $0.71 | $0.25 | 22% | $14.69 | $0.28 | |||||
| Q113 | $0.69 | $0.20 | 21% | $14.54 | $0.28 | |||||
| Q412 | $0.50 | $0.21 | 15% | $13.95 | $0.25 | |||||
| Q312 | $0.48 | $0.19 | 16% | $12.88 | $0.25 | |||||
| (1) | REIT taxable income per share for 2014 are estimates until we file tax returns. |
THE REDWOOD REVIEW | 3RD QUARTER 2014 5
| S H A R E H O L D E R L E T T E R |
Dear Fellow Shareholders:
During the third quarter of 2014, we made solid financial and operating progress as we continued to leverage our residential and commercial loan platforms by expanding the types of loan products we acquire, our group of loan sellers, and our distribution capabilities. Our loan platforms are multidimensional and competitively strong. They provide us with the means to create proprietary investments, generate fees, and build franchise value for shareholders.
Our residential mortgage-banking business had an impressive quarter, especially in light of the challenging post-refinance market conditions for loan originations. Loan acquisitions were $3.4 billion, an 89% increase over the prior quarter, with our new initiative of acquiring conforming loans generating 46% of that total. Also of note, the gross margin on conforming loan sales turned positive this quarter following our early focus on building market share and establishing a meaningful competitive presence with our sellers. In our traditional business of acquiring jumbo loans, gross margins remained strong and in excess of our long-term target range of 25-to-50 basis points. Overall, the results of this quarter indicate to us that we have moved beyond the start-up phase of platform building and into a more efficient operational phase.
We have said many times that one of our strategic goals is to develop multiple ways to invest in newly originated prime residential mortgage credit, particularly loans that were underwritten and acquired through our mortgage-banking platform. This meant expanding beyond our flagship Sequoia jumbo securitization program, which has remained the industry leader in terms of post-crisis RMBS issuance activity. Since 2010, our Sequoia program has created nearly $600 million of credit investments for our portfolio, as well as more than $200 million of investments in interest-only securities and mortgage-servicing rights.
In September, we further expanded our entry into the conforming loan space by entering into our first risk-sharing arrangement with Fannie Mae. Under this arrangement, Redwood can enhance the profitability of transacting in conforming loan products by committing to absorb the first one percent of credit losses on $1.1 billion of new conforming loans that we plan to sell to Fannie Mae during the fourth quarter of 2014.
This risk-sharing arrangement provides a strong, direct alignment of interests between Redwood and Fannie Mae for the acquisition and sale of high-quality mortgage loans. Additionally, this transaction is expected to reduce taxpayer risk through an upfront credit risk transfer and by increasing the role of private capital in the mortgage market, which is one of the goals set forth in the 2014 FHFA Scorecard issued by the FHFA (Fannie Mae’s regulator). We hope that it is the first of many such transactions for Redwood.
The Fannie Mae risk-sharing arrangement comes on the heels of our recent joint announcement with the Federal Home Loan Bank of Chicago (FHLBC) that we plan to acquire eligible residential loans from up to approximately 750 participating Federal Home Loan Bank (FHLB) members. We also announced that one of our wholly-owned subsidiaries, a captive insurance company, had become a member of the FHLBC, providing it with access to attractive
THE REDWOOD REVIEW | 3RD QUARTER 2014 6
| S H A R E H O L D E R L E T T E R |
financing for well-underwritten residential loans that it may acquire from other Redwood subsidiaries or other sources.
Our insurance subsidiary’s membership in the FHLBC may be limited to five years under a proposed rule that was issued by the FHFA in September. The Notice of Proposed Rulemaking (NPR) seeks comments on a range of membership issues, including whether the FHFA should move forward with its proposed ban on captive insurance company membership and a five-year phase out of current captive insurance members. We plan to file a comment letter that will clearly state how the business of our captive insurance subsidiary is closely aligned with the mission of the FHLB System and meets the high safety and soundness standards of the FHLB System. Notably, the outcome of the NPR will not affect our separate loan purchase program with the FHLBC.
We will not attempt to put odds on the likelihood of this proposed rule change going into effect. We can say that the initial public comment responses we have reviewed have been decidedly opposed to the proposed rule changes applicable to captive insurance company members of the FHLB system.
In our commercial business, we continued to grow our platform as a provider of both senior and mezzanine financing for stabilized commercial properties. In the third quarter of 2014, we originated $340 million of senior loans, a 128% increase over the prior quarter and our largest quarterly origination volume to date. While gross margins declined modestly, they remain well above historical industry averages and continue to exceed our long-term expectations. We continued to add experienced staff in this business line during the third quarter as we prepare to capitalize on the wave of refinance opportunities set to begin in 2015. The refinancing wave is the product of the record $635 billion of CMBS issuance between 2005 and 2007. Industry estimates suggest that the maturing CMBS loans represent about one-quarter of the maturing commercial real estate loans over that time, which should result in a material opportunity to provide commercial financing over the next few years.
Overall, we remain energized and focused on delivering value to those we do business with and to you, our shareholders.
We appreciate your continued support.

|

| |
| Martin S. Hughes |
Brett D. Nicholas | |
| CEO |
President |
THE REDWOOD REVIEW | 3RD QUARTER 2014 7
| Q U A R T E R L Y O V E R V I E W |
Third Quarter 2014 Results
Overview
Our businesses generated strong operating and financial results in the third quarter of 2014, despite persistent market volatility that may continue to impact our near-term quarterly results. Our GAAP earnings more than covered our dividend payment to shareholders in the third quarter of 2014, and we generated significant increases in our residential and commercial loan purchase and origination volumes. We also achieved another strategic milestone in the third quarter of 2014 by implementing a risk-sharing arrangement with Fannie Mae for conforming residential loans. Our jumbo loan purchase program with the FHLBC continues to move forward through its implementation phase, while our FHLB member subsidiary has been actively financing jumbo loans at attractive terms. Finally, our commercial team completed a record quarter of senior loan originations. Given the progress we are making in our businesses, our rate of capital deployment increased during the third quarter and remained elevated through October 2014.
Before we get into any further details, here is a summary of Redwood’s third quarter 2014 results:
| „ | Earnings per share were $0.50 for the third quarter of 2014, up from $0.18 per share in the second quarter of 2014. The increase in earnings is largely attributable to higher mortgage banking income, particularly from our residential mortgage banking activities and a favorable timing difference, combined with a steady contribution of net interest income from our investment portfolio. |
| „ | Our GAAP book value per share was $15.21 at September 30, 2014, an increase from $15.03 per share at June 30, 2014. The increase was primarily driven by GAAP earnings that more than covered our third quarter dividend of $0.28 per share. |
| „ | Our residential loan acquisition volume was $3.4 billion in the third quarter of 2014, up 89% from the second quarter of 2014. At September 30, 2014, our pipeline of loans identified for purchase was $1.6 billion and included $1.3 billion of jumbo loans and $0.3 billion of conforming loans, unadjusted for fallout expectations. |
| „ | We originated $340 million of senior commercial loans and $26 million of mezzanine commercial loans in the third quarter of 2014. Our senior commercial loan pipeline, defined as loans under application, totaled $199 million at September 30, 2014. |
| „ | We sold $456 million of securities in the third quarter of 2014 that were not part of our long- term core holdings in order to free up capital for reinvestment. As a result, our residential securities portfolio declined to $1.4 billion at September 30, 2014. |
THE REDWOOD REVIEW | 3RD QUARTER 2014 8
| Q U A R T E R L Y O V E R V I E W |
We also reached an agreement in October 2014 to settle with the plaintiff, on mutually satisfactory terms, the legacy Sequoia RMBS-related case that had been brought in 2010 relating to our Sequoia Mortgage Trust 2006-1 securitization transaction. The terms of the settlement remain confidential.
Residential Update
Our residential mortgage banking business posted strong third quarter 2014 results. Jumbo loan acquisitions doubled to $1.8 billion compared to the second quarter of 2014, while our conforming loan acquisitions increased 78% to $1.5 billion over the same period. Higher loan purchase volumes contributed positively to our mortgage banking results for the third quarter, and also contributed to an increase in our investment in mortgage servicing rights (MSRs) – which has roughly doubled over the past three quarters to a total of $135 million at September 30, 2014. For the first nine months of 2014, total residential loan acquisitions (jumbo and conforming) were $6.3 billion, down less than 3% from the same period in 2013. Our business continues to benefit from the persistent expansion of our group of loan sellers, which increased by a net 12 to 152 sellers at September 30, 2014.
Despite stronger macroeconomic data, including second quarter 2014 revised GDP growth of 4.6%, interest rates were relatively steady in the third quarter as the 10 year Treasury Note yield ended unchanged from the beginning of the quarter. While broader economic growth appears to be moving forward, the housing market is now lagging the recovery. Mortgage rates are up meaningfully from 2013 lows (the 30-year fixed mortgage rate averaged 3.50% for the first five months of 2013), averaging 4.24% for the first nine months of 2014. The resulting reduction in refinancing activity has reverberated through the industry, with the Mortgage Bankers Association further trimming their annual forecast for industry originations to $1 trillion for 2014, down 43% from 2013 originations.
We executed our second and third Sequoia securitizations of 2014 in July and September, and we expect to complete at least one more in the fourth quarter of 2014. These securitizations created $39 million of subordinate investment securities for our portfolio. Although the difference has narrowed, our whole loan sale execution for most jumbo loans continues to be more attractive than our securitization execution as a result of strong loan demand from banks. We expect whole loan sales to remain our most active distribution channel for the remainder of 2014. However, our subsidiary’s recently established FHLB financing capabilities provide us with an alternative to selling or securitizing jumbo loans that we also plan to utilize. During the third quarter of 2014, our FHLB member subsidiary financed $236 million of jumbo loans with the FHLBC, investing approximately $37 million of our own capital at attractive levels.
THE REDWOOD REVIEW | 3RD QUARTER 2014 9
| Q U A R T E R L Y O V E R V I E W |
Risk Retention Rules
In October 2014, Federal regulators released the final risk retention rules applicable to residential securitization transactions. Of note, these rules require risk retention by a sponsor in the event that non-QM loans are included in a securitization transaction. Although we have recently included non-QM loans in our Sequoia securitizations, we do not expect these rules to have any adverse impact on our business. As a long-time investor in mortgage credit risk, our residential business model is built to create and retain first-loss credit risk through the retention of the subordinate securities issued through our Sequoia securitization platform – regardless of whether they include QM or non-QM loans. We continue to explore alternative ways to source more high-quality non-QM loans made to borrowers of the type we have traditionally financed in the past.
MPF DirectTM
We are making steady progress on our initiative to acquire jumbo loans through the FHLBC’s MPF DirectTM product. In the third quarter, we launched a pilot program with certain MPF participating member banks to begin the process of making purchases of jumbo loans through MPF DirectTM. To date, we are moving forward with 10 banks and we expect to begin acquiring loans late in the fourth quarter of 2014. After this initial test phase, we plan to do a further roll out to all interested MPF participants in 2015. It is too early to provide any metrics around the potential size of this opportunity. For now, we think it has the potential to be a meaningful source of residential loan acquisitions over time.
Commercial Update
Our commercial mortgage-banking and investments business had a very strong third quarter of 2014. During the third quarter, we originated 24 senior commercial loans totaling $340 million, as compared to 15 loans totaling $149 million in the second quarter of 2014. Through the first three quarters of 2014, we originated $608 million of senior commercial loans, as compared to $563 million for the first three quarters of 2013. We entered the fourth quarter with a pipeline of loans under application of $199 million, and when combined with the applications received in October, we project our total origination volume will likely exceed $900 million for 2014, as compared to $805 million in 2013.
During the third quarter, we added a senior originator in the Los Angeles area. Together with other recent hiring in the New York area, this should position us well for 2015, which we expect to be the first year of a wave of commercial refinancing activity resulting from the record volumes of 10-year CMBS loans originated between 2005 and 2007.
THE REDWOOD REVIEW | 3RD QUARTER 2014 10
| Q U A R T E R L Y O V E R V I E W |
Summary of Financial Results
GAAP Earnings
In the third quarter of 2014, we earned $45 million, or $0.50 per share, an increase from $16 million, or $0.18 per share, in the second quarter of 2014. The following table sets forth the components of Redwood’s GAAP income for the third and second quarters of 2014.
| GAAP Income | ||||||||
| ($ in millions, except per share data) | ||||||||
| Three Months Ended | ||||||||
| 9/30/2014 | 6/30/2014 | |||||||
| Net interest income |
40 | 37 | ||||||
| Reversal of provision for loan losses |
2 | - | ||||||
| Noninterest income |
||||||||
| Mortgage banking activities, net |
18 | 6 | ||||||
| MSR income, net |
6 | (2 | ) | |||||
| Other market valuation adjustments, net |
(4 | ) | (4 | ) | ||||
| Realized gains, net |
9 | 1 | ||||||
| Total noninterest income, net |
29 | 1 | ||||||
| Operating expenses |
(21 | ) | (22 | ) | ||||
| Other income |
2 | - | ||||||
| Provision for income taxes |
(5 | ) | - | |||||
| GAAP income |
$ | 45 | $ | 16 | ||||
| GAAP income per share |
$ | 0.50 | $ | 0.18 | ||||
The increase in earnings shown above primarily resulted from a $28 million improvement in noninterest income, predominately related to increased income from mortgage banking activities, net. As noted above, mortgage banking income was higher as a result of a significant increase in residential loan acquisition activity combined with higher margins. In addition, as has been the case in recent prior quarters, our residential mortgage banking results were effected by timing differences related to how we are required to account for loans in our jumbo pipeline that are identified and hedged but not yet purchased at quarter end. Income from mortgage banking activities benefited from these timing differences in the third quarter of 2014, whereas it was negatively impacted in the second quarter of 2014. These timing differences are discussed further on page 17 in the Mortgage Banking Activities portion of the Financial Insights section that follows.
THE REDWOOD REVIEW | 3RD QUARTER 2014 11
| Q U A R T E R L Y O V E R V I E W |
Other noninterest income increased due to $7 million of net gains from the sale of $456 million of primarily senior residential securities during the third quarter of 2014. Net interest income remained steady on our core holdings and increased quarter over quarter as a result of higher average balances of residential and commercial loans held for sale or securitization.
Other income of $2 million reflects a reduction in our aggregate litigation reserve relating to the three legacy Sequoia RMBS-related cases we reserved for in the fourth quarter of 2013.
GAAP Book Value
At September 30, 2014, our GAAP book value was $1.3 billion, or $15.21 per share, an increase from $15.03 per share at June 30, 2014. The following table sets forth the changes in Redwood’s GAAP book value per share for the third and second quarters of 2014.
| Changes in GAAP Book Value Per Share
($ in per share) |
||||||||||||
| Q3 2014 | Q2 2014 | Variance | ||||||||||
| Beginning book value |
$ | 15.03 | $ | 15.14 | $ | (0.11 | ) | |||||
| Net income |
0.50 | 0.18 | 0.32 | |||||||||
| Change in unrealized gains (losses), net |
(0.09 | ) | 0.09 | (0.18 | ) | |||||||
| Equity award distributions |
(0.02 | ) | (0.14 | ) | 0.12 | |||||||
| Other, net |
0.07 | 0.04 | 0.03 | |||||||||
| Dividends |
(0.28 | ) | (0.28 | ) | - | |||||||
| Ending book value |
$ | 15.21 | $ | 15.03 | $ | 0.18 | ||||||
The increase in GAAP book value per share was primarily driven by GAAP earnings that more than covered our third quarter dividend of $0.28 per share, in addition to covering a decline in the value of hedges on our long-term debt. While in aggregate prices increased on our securities portfolio, the realization of gains on sales of securities combined with a reduction in the value of cash flow hedges on our long-term debt contributed to an overall reduction in unrealized gains in the third quarter. The Financial Insights section on page 20 provides a detailed analysis of the components of our GAAP balance sheet and book value.
THE REDWOOD REVIEW | 3RD QUARTER 2014 12
| Q U A R T E R L Y O V E R V I E W |
Quarterly Investment Activity
Our deployment of capital increased significantly in the third quarter of 2014 compared to the prior quarter. The following table details our capital invested for the third and second quarters of 2014.
| Quarterly Investment Activity
($ in millions) |
||||||||
| Q3 2014 | Q2 2014 | |||||||
| Residential |
||||||||
| Sequoia RMBS |
$ | 41 | $ | 85 | ||||
| Third-party RMBS |
2 | 56 | ||||||
| Less: Short-term debt/Other liabilities |
(25 | ) | (121 | ) | ||||
| Total RMBS, net |
18 | 20 | ||||||
| GSE risk sharing transaction |
11 | - | ||||||
| Loans, net – FHLB (1) |
37 | - | ||||||
| MSR investments |
62 | 12 | ||||||
| Total residential |
128 | 32 | ||||||
| Commercial |
||||||||
| Mezzanine loans |
26 | 6 | ||||||
| Less: Borrowings |
- | (2 | ) | |||||
| Total commercial |
26 | 4 | ||||||
| Capital invested |
$ | 154 | $ | 36 | ||||
| (1) | Includes loans pledged to FHLBC and FHLBC stock acquired, less FHLBC borrowings. |
Net of financing, we deployed $154 million of capital in third quarter, up substantially from $36 million in the second quarter of 2014. The increase in investment activity reflects a combination of strong growth in our loan purchase volume and growing opportunities to put capital to work. Notable investments in the third quarter included $39 million in retained subordinate securities and $2 million of IO’s created from our two Sequoia securitizations, $37 million of capital invested in $236 million of loans financed through our FHLB member subsidiary, and $62 million of investments in MSRs.
Following the end of the third quarter of 2014 and through October 31, 2014, we invested net capital of $21 million in loans financed through our FHLB member subsidiary, $8 million in MSRs and $3 million in commercial mezzanine loans.
THE REDWOOD REVIEW | 3RD QUARTER 2014 13
| Q U A R T E R L Y O V E R V I E W |
At September 30, 2014, our residential securities portfolio had a market value of $1.4 billion, down from $1.8 billion at June 30, 2014. This decline included $456 million of sales, and $49 million of principal paydowns, partially offset by $43 million of acquisitions, and $11 million in discount accretion. Included in this portfolio at quarter-end were $101 million of Sequoia senior and IO securities, which are included in our Residential Mortgage Banking segment for financial reporting purposes.
Capital and Liquidity
We maintained capital of $1.7 billion at September 30, 2014. This included $1.3 billion of equity capital, $140 million of long-term debt due in 2037, and $288 million of medium-term convertible debt due in 2018. It did not include $1.2 billion of residential loan warehouse debt, which we primarily use to finance our inventory of residential loans awaiting sale, securitization, or long-term financing by one of our subsidiaries through the utilization of FHLB advances. It also did not include $647 million of financing through repurchase facilities for securities that we believe offer an attractive levered return profile but do not otherwise meet our internal capital return targets.
At September 30, 2014, we held $150 million in cash, and our investment capacity (defined as the approximate amount of capital we had readily available for long-term investments) was estimated to be approximately $145 million. As we mentioned in our last Redwood Review, our rate of capital deployment in the second half of 2014 is requiring us to source additional capital prior to the end of the year to support the growth in our investment opportunities. During the third quarter of 2014, we generated approximately $49 million of internal capital through the sale of $456 million of residential securities. The securities we sold included lower yielding mezzanine securities and other senior securities financed with short-term repurchase debt and capital. These sales resulted in $7 million of realized gains and reduced our short-term repurchase debt to $647 million at September 30, 2014, from $854 million at June 30, 2014. We also generated capital by more efficiently financing our accumulation of residential and commercial loans held for sale, utilizing warehouse financing facilities where we deemed it appropriate. While we believe our remaining investment capacity is sufficient to fund our near-term investment activities, we will likely need additional capital to make sustained long-term investments over the coming quarters. As a result, we are considering raising capital from outside sources, such as through a convertible debt offering or other medium- or long-term debt issuance.
THE REDWOOD REVIEW | 3RD QUARTER 2014 14
| F I N A N C I A L I N S I G H T S |
Our consolidated GAAP net income for the third quarter of 2014 was $45 million, or $0.50 per diluted common share, as compared to $16 million, or $0.18 per diluted common share, for the second quarter of 2014. The following table presents the GAAP income statements for the third and second quarters of 2014.
| Consolidated Statements of Income | ||||||||
| ($ in millions, except per share data) | ||||||||
| Three Months Ended | ||||||||
| 9/30/14 | 6/30/14 | |||||||
| Interest income |
$ | 53 | $ | 48 | ||||
| Net discount (premium) amortization |
10 | 10 | ||||||
| Total interest income |
63 | 58 | ||||||
| Interest expense |
(23 | ) | (21 | ) | ||||
| Net interest income |
40 | 37 | ||||||
| Reversal of provision for loan losses |
2 | - | ||||||
| Net interest income after provision |
42 | 37 | ||||||
| Noninterest income |
||||||||
| Mortgage banking activities, net |
18 | 6 | ||||||
| MSR income, net |
6 | (2 | ) | |||||
| Other market valuation adjustments, net |
(4 | ) | (4 | ) | ||||
| Realized gains, net |
9 | 1 | ||||||
| Total noninterest income, net |
29 | 1 | ||||||
| Operating expenses |
(21 | ) | (22 | ) | ||||
| Other income |
2 | - | ||||||
| Provision for income taxes |
(5 | ) | - | |||||
| Net income |
$ | 45 | $ | 16 | ||||
| Net income per share |
$ | 0.50 | $ | 0.18 | ||||
THE REDWOOD REVIEW | 3RD QUARTER 2014 15
| F I N A N C I A L I N S I G H T S |
Net Interest Income
Net interest income was $40 million in the third quarter of 2014, an increase of $3 million from the second quarter of 2014. The following table highlights the components of net interest income for the third and second quarters of 2014.
| Net Interest Income | ||||||||
| ($ in millions) | ||||||||
| Three Months Ended | ||||||||
| 9/30/14 | 6/30/14 | |||||||
| Net interest income by segment |
||||||||
| Residential Mortgage Banking |
$ | 13 | $ | 10 | ||||
| Residential Investments |
25 | 25 | ||||||
| Commercial Mortgage Banking and Investments |
8 | 7 | ||||||
| Corporate/Other net interest expense (1) |
(5 | ) | (5 | ) | ||||
| Total Net Interest Income |
$ | 40 | $ | 37 | ||||
| (1) | For each of the three months ended 9/30/14 and 6/30/14, net interest income from Corporate/Other includes $6 million of interest expense from long-term debt that is not directly assigned or allocated to any segment and $1 million of net interest income from legacy Sequoia entities. |
Net interest income from our residential mortgage banking operations increased $3 million in the third quarter of 2014, as the average balance of residential loans held-for-sale increased 43% to $1.3 billion primarily as a result of increased loan acquisitions. The amount of interest income earned from loans held-for-sale is dependent on many factors, including the amount of loans, the length of time they are on our balance sheet, and their interest rates.
Net interest income from our residential investments portfolio remained stable as a decrease in interest income from a lower average balance of securities was mostly offset by higher average yields in the current quarter. The average balance of our available-for-sale securities decreased 12% to $1.3 billion in the third quarter of 2014, primarily from the sale of $395 million of securities during the third quarter of 2014. The average yield on our available-for-sale securities increased to 8.0% in the third quarter from 7.4% in the second quarter of 2014, primarily resulting from the securities sold during the third quarter that had lower average yields than the remainder of the portfolio.
Net interest income from our commercial operations increased as the average balances of senior loans held-for-sale increased 127% to $170 million, primarily as a result of increased loan originations in the third quarter of 2014.
THE REDWOOD REVIEW | 3RD QUARTER 2014 16
| F I N A N C I A L I N S I G H T S |
Mortgage Banking Activities, Net
The following table presents the components of our mortgage banking activities for the third and second quarters of 2014.
| Mortgage Banking Activities | ||||||||
| ($ in millions) | ||||||||
| Three Months Ended | ||||||||
| 9/30/14 | 6/30/14 | |||||||
| Residential mortgage banking activities |
||||||||
| Residential loans |
$ | 17 | $ | 18 | ||||
| Risk management derivatives |
(4 | ) | (8 | ) | ||||
| Sequoia securities |
(1 | ) | (9 | ) | ||||
| Total residential mortgage banking activities |
11 | 1 | ||||||
| Commercial mortgage banking activities |
||||||||
| Commercial loans |
5 | 6 | ||||||
| Risk management derivatives |
2 | (1 | ) | |||||
| Total commercial mortgage banking activities |
6 | 5 | ||||||
| Total mortgage banking activities, net |
$ | 18 | $ | 6 | ||||
Income from mortgage banking activities was $18 million for the third quarter of 2014, as compared to $6 million in the second quarter of 2014.
Income from residential mortgage banking activities increased to $11 million in the third quarter of 2014, as compared to $1 million in the second quarter of 2014. The improvement primarily resulted from an increase in loan acquisition volume and related fair value gains during the third quarter, with residential loan acquisitions increasing to $3.4 billion in the third quarter of 2014 from $1.8 billion in the second quarter of 2014. The increase in acquisition volume occured in both jumbo and conforming loans and resulted from a broad-based increase in acquisition volume across our group of loan sellers.
Consistent with prior quarters, we continue to experience timing differences related to our jumbo mortgage pipeline (defined as those loans we have identified for purchase), and the hedging for those loans, making it difficult to fully ascertain our quarterly operating performance from our high-level GAAP results. In both the third and second quarters of 2014, we recorded expenses resulting from changes in the value of hedges associated with our jumbo mortgage pipeline. However, the corresponding changes in value of the $1.3 billion and $1.6 billion (unadjusted for expected fallout) of loans in our jumbo mortgage pipeline at September 30, 2014 and June 30, 2014, respectively, were not recorded in earnings during the respective periods. As a result of the timing differences at June 30, 2014, income from mortgage banking activities benefited in the third quarter of 2014 and was negatively impacted in the second quarter of 2014. We do not expect the timing difference related to the loans we
THE REDWOOD REVIEW | 3RD QUARTER 2014 17
| F I N A N C I A L I N S I G H T S |
had identified for purchase at September 30, 2014 to have a significant impact on our reported income in the fourth quarter 2014.
Our commercial operations generated income from mortgage banking activities of $7 million in the third quarter of 2014, up from $5 million in the second quarter of 2014. The improvement was primarily due to higher origination volume in the third quarter of 2014. The benefit from higher origination volume was partially offset by lower profit margins realized during the third quarter. During the third quarter of 2014, we originated 24 senior commercial loans totaling $340 million, as compared to 15 loans totaling $149 million in the second quarter of 2014.
MSR Income, Net
Income from our investments in mortgage servicing rights was $6 million in the third quarter of 2014, as compared to negative $2 million in the second quarter of 2014. Fee income generated from MSRs was $5 million for the third quarter of 2014, as compared to $4 million in the second quarter, as the aggregate principal amount of loans associated with our servicing rights increased by $5.1 billion to $12.2 billion at September 30, 2014. The significant increase in MSRs in the third quarter was primarily due to the bulk acquisition of MSRs associated with $3.5 billion aggregate principal amount of loans that was completed on September 30, 2014 and will not generate fee increases for us until the fourth quarter of 2014. Our third quarter MSR income also benefited from $2 million of positive market valuation adjustments, as compared to negative $6 million in the second quarter, which resulted from declining interest rates in the third quarter.
Other Market Valuation Adjustments, Net
Other market valuation adjustments were negative $4 million for both the third and second quarters of 2014. In the third quarter of 2014, half of the adjustments were attributable to interest rate hedging derivatives, with the remainder resulting from decreases in the market value of trading securities and loans held-for-investment at fair value. The majority of adjustments in the second quarter were attributable to declines in the value of interest-rate hedging derivatives. These derivatives are used to manage risks associated with the net interest rate exposure at our Residential Investments segment.
Realized Gains, Net
In the third and second quarters of 2014, we recognized $9 million and $1 million of gains, respectively, related to sales and calls of residential investment securities. During the third quarter of 2014, we sold $456 million of securities with the primary intent to generate capital for reinvestment.
Operating Expenses
Operating expenses remained relatively stable at $21 million for the third quarter of 2014, as compared to $22 million for the second quarter of 2014.
THE REDWOOD REVIEW | 3RD QUARTER 2014 18
| F I N A N C I A L I N S I G H T S |
Other Income
Other income of $2 million reflects a reduction in our aggregate litigation reserve relating to the three legacy Sequoia RMBS-related cases we reserved for in the fourth quarter of 2013.
Provision for Income Taxes
During the third quarter of 2014, we recognized a provision for income taxes of $5 million, compared to less than $1 million in the prior quarter, primarily related to higher GAAP income from mortgage banking activities generated at our taxable REIT subsidiaries in the third quarter of 2014. See the Taxable Income and Dividends section on page 29 for further information.
THE REDWOOD REVIEW | 3RD QUARTER 2014 19
| F I N A N C I A L I N S I G H T S |
The following table shows the components of our balance sheet at September 30, 2014.
|
Consolidating Balance Sheet (1)
September 30, 2014
($ in millions) |
||||||||||||
| At Redwood | Consolidated VIEs (2) |
Redwood Consolidated |
||||||||||
| Residential loans |
$ | 1,741 | $ | 1,547 | $ | 3,288 | ||||||
| Commercial loans |
293 | 205 | 498 | |||||||||
| Real estate securities – Third party |
619 | 233 | 853 | |||||||||
| Real estate securities – Sequoia (3) |
542 | - | 542 | |||||||||
| Mortgage servicing rights |
135 | - | 135 | |||||||||
| Cash and cash equivalents |
150 | - | 150 | |||||||||
| Total earning assets |
3,480 | 1,985 | 5,466 | |||||||||
| Other assets |
114 | 32 | 146 | |||||||||
| Total assets |
$ | 3,594 | $ | 2,017 | $ | 5,612 | ||||||
| Short-term debt |
||||||||||||
| Mortgage loan warehouse debt |
$ | 1,241 | $ | - | $ | 1,241 | ||||||
| Security repurchase facilities |
647 | - | 647 | |||||||||
| Other liabilities |
102 | 2 | 104 | |||||||||
| Asset-backed securities issued |
- | 1,656 | 1,656 | |||||||||
| Long-term debt |
697 | - | 697 | |||||||||
| Total liabilities |
2,687 | 1,658 | 4,345 | |||||||||
| Stockholders’ equity |
907 | 359 | 1,267 | |||||||||
| Total liabilities and equity |
$ | 3,594 | $ | 2,017 | $ | 5,612 | ||||||
| (1) | The format of this consolidating balance sheet is provided to more clearly delineate between (i) the $2.0 billion of assets belonging to certain securitization entities (variable interest entities, or VIEs) that we are required to consolidate on our balance sheet in accordance with GAAP, but which are not legally ours, and the $1.7 billion of liabilities of these VIEs, which are payable only from the cash flows generated by their assets and are, therefore, nonrecourse to us, and (ii) the $3.6 billion of assets that are legally ours and the $2.7 billion of liabilities of ours for which there is recourse to us. |
| (2) | Consolidated VIEs include certain Sequoia securitizations completed prior to 2012 as well as the Residential Resecuritization and Commercial Securitization transactions we completed in 2011 and 2012, respectively, that we are required to consolidate under GAAP. Our estimated GAAP investment in these entities was $359 million at September 30, 2014, representing the difference between the aggregate assets and liabilities of these entities. Legally, we own only the securities and interests that we acquired from these VIEs. |
| (3) | Sequoia securitizations completed in 2012 and subsequently are treated as sales for GAAP, and the $542 million of securities we have retained from these transactions, are reflected in the “At Redwood” column above in “Real Estate Securities – Sequoia.” |
THE REDWOOD REVIEW | 3RD QUARTER 2014 20
| F I N A N C I A L I N S I G H T S |
Residential Loans
The table below details residential loan activity at Redwood during the third and second quarters of 2014.
| Residential Loans at Redwood | ||||||||
| ($ in millions) | ||||||||
| Three Months Ended | ||||||||
| 9/30/14 | 6/30/14 | |||||||
| Beginning fair value |
$ | 1,108 | $ | 775 | ||||
| Acquisitions |
3,388 | 1,791 | ||||||
| Sales |
(2,758 | ) | (1,467 | ) | ||||
| Principal payments |
(10 | ) | (5 | ) | ||||
| Change in fair value, net |
12 | 14 | ||||||
| Ending fair value |
$ | 1,741 | $ | 1,108 | ||||
Our $1.7 billion of residential loans at Redwood are comprised of loans held-for-sale through our residential mortgage banking segment and loans held-for-investment in our residential investments segment. In our residential mortgage banking segment, at September 30, 2014, we owned $1.5 billion of prime residential loans, including $1.1 billion of jumbo loans and $400 million of conforming loans held-for-sale. These loans included $1.2 billion of 30-year fixed-rate loans, $101 million of 10 to 25-year fixed-rate loans, $164 million of hybrid loans, and $1 million of ARM loans. At September 30, 2014, our pipeline of loans identified for purchase (unadjusted for fallout) included $1.3 billion of jumbo loans and $324 million of conforming loans. See the Residential Mortgage Banking section on page 32 for additional information.
During the third quarter of 2014, we transferred $239 million of held-for-sale loans from our residential mortgage banking segment to our residential investments and reclassified the loans as held-for-investment. As of September 30, 2014, these loans were financed through our FHLB member subsidiary.
The remainder of our residential loans, totaling $1.5 billion, are held in consolidated Sequoia entities. Our investments in these entities, as estimated for GAAP, totaled $67 million at September 30, 2014. This amount reflects the book value of our retained investments in consolidated Sequoia entities and is based on the difference between the consolidated assets and liabilities of the entities in the aggregate according to their GAAP carrying amounts.
THE REDWOOD REVIEW | 3RD QUARTER 2014 21
| F I N A N C I A L I N S I G H T S |
Commercial Loans
The following table details commercial loan activity during the third and second quarters of 2014.
| Commercial Loans
Three Months Ended September 30, 2014
($ in millions) |
||||||||||||||||||||
| Senior | A/B Notes | Unsecuritized Mezzanine |
Securitized Mezzanine |
Total | ||||||||||||||||
| Beginning carrying value |
$ | 51 | $ | 71 | $ | 92 | $ | 255 | $ | 469 | ||||||||||
| Originations |
340 | - | 26 | - | 366 | |||||||||||||||
| Sales |
(291 | ) | - | - | - | (291 | ) | |||||||||||||
| Principal payments/amortization |
- | - | - | (51 | ) | (51 | ) | |||||||||||||
| Change in fair value, net |
4 | - | - | - | 4 | |||||||||||||||
| Change in allowance for loan losses |
- | - | - | 1 | 1 | |||||||||||||||
| Ending carrying value |
$ | 105 | $ | 71 | $ | 118 | $ | 205 | $ | 498 | ||||||||||
| Commercial Loans
Three Months Ended June 30, 2014
($ in millions) |
||||||||||||||||||||
| Senior | A/B Notes | Unsecuritized Mezzanine |
Securitized Mezzanine |
Total | ||||||||||||||||
| Beginning carrying value |
$ | 77 | $ | 69 | $ | 87 | $ | 257 | $ | 491 | ||||||||||
| Originations |
149 | - | 6 | - | 155 | |||||||||||||||
| Sales |
(181 | ) | - | - | - | (181 | ) | |||||||||||||
| Transfers to other categories |
- | - | - | - | - | |||||||||||||||
| Principal payments/amortization |
- | - | - | (2 | ) | (2 | ) | |||||||||||||
| Change in fair value, net |
6 | 2 | - | - | 7 | |||||||||||||||
| Change in allowance for loan losses |
- | - | - | - | - | |||||||||||||||
| Ending carrying value |
$ | 51 | $ | 71 | $ | 92 | $ | 255 | $ | 469 | ||||||||||
At September 30, 2014, we owned $498 million of commercial loans, as compared to $469 million of commercial loans at June 30, 2014. During the third quarter of 2014, we originated 24 senior loans and sold 24 senior loans. Additionally, we originated five mezzanine loans during the third quarter. See the Commercial Mortgage Banking Activities section on page 35 for additional information.
THE REDWOOD REVIEW | 3RD QUARTER 2014 22
| F I N A N C I A L I N S I G H T S |
Real Estate Securities
The following table presents the fair value of our residential real estate securities at September 30, 2014. We categorize our Sequoia and third-party securities by portfolio vintage (the year(s) the securities were issued), priority of cash flow (senior, re-REMIC, and subordinate) and the underwriting characteristics of the underlying loans (prime and non-prime).
| Real Estate Securities (1)
September 30, 2014
($ in millions) |
||||||||||||||||||||||||
|
Sequoia 2012-2014 |
Third-party Securities | Total Securities |
% of Total Securities |
|||||||||||||||||||||
| <=2005 | 2006-2008 | 2012-2014 | ||||||||||||||||||||||
| Seniors |
||||||||||||||||||||||||
| Prime |
$ | 101 | $ | 278 | $ | 81 | $ | - | $ | 459 | 33 | % | ||||||||||||
| Non-prime (2) |
- | 190 | 4 | - | 194 | 14 | % | |||||||||||||||||
| Total seniors |
101 | 467 | 85 | - | 653 | 47 | % | |||||||||||||||||
| Prime re-REMIC |
- | 60 | 116 | - | 176 | 13 | % | |||||||||||||||||
| Prime Subordinates |
||||||||||||||||||||||||
| Mezzanine (3) |
357 | - | - | 55 | 412 | 30 | % | |||||||||||||||||
| Subordinate |
85 | 54 | 1 | 13 | 154 | 11 | % | |||||||||||||||||
| Prime subordinates |
442 | 54 | 1 | 69 | 565 | 41 | % | |||||||||||||||||
| Total real estate securities |
$ | 543 | $ | 581 | $ | 203 | $ | 69 | $ | 1,395 | 100 | % | ||||||||||||
| (1) | Included in the real estate securities table above are $233 million of senior securities that are included in the Residential Resecuritization that we completed in July 2011. Under GAAP accounting, we account for the resecuritization as a financing even though these securities are owned by the resecuritization entity and are legally not ours. We own only the securities and interests that we acquired from the resecuritization entity, which amounted to $167 million at September 30, 2014. As a result, to adjust at September 30, 2014 for the legal and economic interests that resulted from the resecuritization, Total Senior Securities would be decreased by $233 million to $421 million, Prime Re-REMIC Securities would be increased by $167 million to $343 million, and Total Real Estate Securities would be reduced by $66 million to $1.33 billion. |
| (2) | Non-prime residential securities consist of Alt-A senior securities. |
| (3) | Prime mezzanine includes securities initially rated AA, A, and BBB- and issued in 2012 or later. |
THE REDWOOD REVIEW | 3RD QUARTER 2014 23
| F I N A N C I A L I N S I G H T S |
The table below details the change in fair value of real estate securities during the third and second quarters of 2014.
| Real Estate Securities | ||||||||
| ($ in millions) | ||||||||
| Three Months Ended | ||||||||
| 9/30/14 | 6/30/14 | |||||||
| Beginning fair value |
$ | 1,845 | $ | 1,743 | ||||
| Acquisitions |
||||||||
| Sequoia securities |
41 | 85 | ||||||
| Third-party securities |
2 | 56 | ||||||
| Sales |
||||||||
| Sequoia securities |
(113 | ) | - | |||||
| Third-party securities |
(342 | ) | (1 | ) | ||||
| Gain on sale |
8 | 1 | ||||||
| Effect of principal payments |
(46 | ) | (51 | ) | ||||
| Change in fair value, net |
1 | 12 | ||||||
| Ending fair value |
$ | 1,395 | $ | 1,845 | ||||
During the third quarter of 2014, we acquired $2 million of senior Sequoia IO securities, $39 million of mezzanine and subordinate Sequoia securities, and $2 million of third-party senior securities. During the third quarter of 2014, we sold $456 million of securities that resulted in a $7 million gain. Included in these sales were $319 million of third-party senior securities, $59 million of senior Sequoia securities, $16 million of Re-REMICs, $8 million of third-party subordinate securities, and $54 million of mezzanine Sequoia securities.
At September 30, 2014, residential securities we owned (as a percentage of current market value) consisted of fixed-rate assets (55%), adjustable-rate assets (17%), hybrid assets that reset within the next year (27%), and hybrid assets that reset between 12 and 36 months (1%).
THE REDWOOD REVIEW | 3RD QUARTER 2014 24
| F I N A N C I A L I N S I G H T S |
Mortgage Servicing Rights (MSRs)
The table below details the change in fair value of Redwood’s MSRs during the third and second quarters of 2014.
| MSRs | ||||||||
| ($ in millions) | ||||||||
| Three Months Ended | ||||||||
| 9/30/14 | 6/30/14 | |||||||
| Beginning fair value |
$ | 71 | $ | 65 | ||||
| Additions |
62 | 12 | ||||||
| Change in fair value, net |
2 | (6 | ) | |||||
| Ending fair value |
$ | 135 | $ | 71 | ||||
At September 30, 2014, we owned $61 million of jumbo MSR investments and $74 million of conforming MSR investments associated with residential loans with aggregate principal balances of $6.0 billion and $6.3 billion, respectively. We earn fees from these MSRs, but outsource the actual servicing of the associated loans to a third-party servicer.
During the third quarter of 2014, we added $62 million of MSRs associated with $5.4 billion of residential loans. Included in this amount are $43 million of bulk-purchased MSRs, and $19 million of MSRs acquired through our residential mortgage banking operations. The GAAP carrying value, which is the estimated fair value of our MSRs at September 30, 2014, was equal to 1.10% of the aggregate principal balance of the associated residential loans. At September 30, 2014 the 60 day plus delinquency ratio was 0.01% and there were no loans greater than 90 days delinquent.
THE REDWOOD REVIEW | 3RD QUARTER 2014 25
| F I N A N C I A L I N S I G H T S |
Derivatives
The following table presents the fair value and notional value of derivative financial instruments held at September 30, 2014 and June 30, 2014, which are components of other assets and other liabilities on our consolidated balance sheet.
|
Derivatives
($ in millions) |
||||||||||||||||
| 9/30/14 | 6/30/14 | |||||||||||||||
| Fair Value (1) | Notional | Fair Value (1) | Notional | |||||||||||||
| Risk management derivatives by segment: |
||||||||||||||||
| Residential mortgage banking |
$ | - | $ | 2,529 | $ | - | $ | 1,641 | ||||||||
| Residential investments |
1 | 80 | (2 | ) | 256 | |||||||||||
| Commercial mortgage banking and investments |
2 | 155 | - | 65 | ||||||||||||
| Loan purchase and forward sale commitments |
1 | 652 | 1 | 625 | ||||||||||||
| Cash flow hedges on long-term debt |
(34 | ) | 140 | (31 | ) | 140 | ||||||||||
| Total derivative financial instruments, net |
$ | (31 | ) | $ | 3,555 | $ | (33 | ) | $ | 2,726 | ||||||
| (1) | Fair values presented in this table represent the net value of derivative assets and liabilities associated with each of our segments. |
We use derivative financial instruments in part to mitigate the interest rate risk associated with some of our residential and commercial loan activity, in addition to the net interest rate exposure within our investment portfolio. Net changes in the fair value of risk management derivatives are reflected in our income statement in Mortgage banking activities, net, for residential and commercial mortgage banking segments and in Other market valuation adjustments, net, for our residential investments segment. The timing of when we enter into and exit these derivatives, and the corresponding levels of benchmark interest rates, has a significant effect on the amount of valuation income or loss recognized. During the third quarter of 2014, the aggregate fair value of risk management derivatives, including those agreements that we exited during the quarter, declined by $4 million.
As part of our residential mortgage banking activities, we enter into agreements to purchase and to sell conforming residential loans. These commitments qualify as derivatives and changes in their fair values are recorded in Mortgage banking activities, net, in our income statement.
Falling benchmark interest rates resulted in a $3 million increase to our derivative liability related to cash flow hedges on our long-term debt. Changes in the fair value of our cash flow hedges were recorded in shareholders’ equity through accumulated other comprehensive income.
THE REDWOOD REVIEW | 3RD QUARTER 2014 26
| F I N A N C I A L I N S I G H T S |
Short-Term Debt
At September 30, 2014, we had short-term residential mortgage warehouse debt outstanding of $1.2 billion, which was used to finance a portion of the $1.5 billion inventory of residential mortgage loans held-for-sale. We also had short-term commercial mortgage warehouse debt outstanding of $53 million, which was used to finance a portion of the $118 million inventory of mezzanine commercial mortgage loans held-for-investment.
At September 30, 2014, we had five uncommitted residential mortgage warehouse facilities with an aggregate borrowing capacity of $1.6 billion, and an uncommitted commercial mortgage warehouse facility for senior loans with a borrowing capacity of $190 million. In addition, as of September 30, 2014, one uncommitted commercial mortgage warehouse facility for mezzanine loans and B-notes with a borrowing capacity of $150 million was reclassified to short-term debt from long-term debt, due to the remaining term of the facility falling below 12 months.
At September 30, 2014, we had short-term debt incurred through securities repurchase facilities of $647 million, which was secured by $812 million of residential securities.
The table below details the activity of short-term debt during the third and second quarters of 2014.
| Short-Term Debt by Collateral Type | ||||||||||||||||||||||||
| ($ in millions) | ||||||||||||||||||||||||
| Residential Loans | Residential Securities | Commercial Loans | ||||||||||||||||||||||
| Q3 2014 | Q2 2014 | Q3 2014 | Q2 2014 | Q3 2014 | Q2 2014 | |||||||||||||||||||
| Beginning balance |
$ | 852 | $ | 512 | $ | 854 | $ | 708 | $ | 12 | $ | 68 | ||||||||||||
| Borrowings |
2,758 | 1,230 | 256 | 180 | 184 | 87 | ||||||||||||||||||
| Repayments |
(2,422 | ) | (890 | ) | (464 | ) | (34 | ) | (195 | ) | (143 | ) | ||||||||||||
| LT to ST Debt |
- | - | - | - | 53 | - | ||||||||||||||||||
| Ending balance |
$ | 1,188 | $ | 852 | $ | 647 | $ | 854 | $ | 53 | $ | 12 | ||||||||||||
THE REDWOOD REVIEW | 3RD QUARTER 2014 27
| F I N A N C I A L I N S I G H T S |
Long-Term Debt and ABS Issued
During the third quarter of 2014, our FHLB member subsidiary entered into a borrowing agreement with the FHLBC. Under this agreement, our subsidiary may incur borrowings secured by eligible collateral, including, but not limited to, residential mortgage loans and residential mortgage-backed securities. At September 30, 2014, we had $204 million of borrowings outstanding under this agreement.
At September 30, 2014, we had $288 million of convertible senior notes outstanding at a stated interest rate of 4.625% (excluding deferred issuance costs), that are convertible into 41.1320 shares of common stock per $1,000 principal amount (equivalent to a conversion price of $24.31 per common share and subject to certain adjustments) on or before their maturity in April 2018.
At September 30, 2014, we had $140 million of other long-term debt outstanding due in 2037 with a stated interest rate of three-month LIBOR plus 225 basis points (excluding deferred issuance costs). In 2010, we effectively fixed the interest rate on this long-term debt at approximately 6.75% (excluding deferred issuance costs) through interest rate swaps.
At September 30, 2014, we had commercial secured borrowings of $66 million as a result of our requirement under GAAP to classify certain senior commercial loans we originated and sold to third parties as financings and not sales. These secured borrowings are recorded at their fair value, which is equal to the fair value of the associated senior loans that were sold, but remain on our balance sheet in accordance with GAAP.
At September 30, 2014, we had $1.7 billion outstanding of non-recourse, asset-backed debt (ABS) issued at consolidated variable interest entities (VIEs). Included in this amount was $57 million at a stated interest rate of one-month LIBOR plus 200 basis points related to our Residential Resecuritization, $115 million at a stated interest rate of 5.62% (excluding deferred issuance costs) related to our Commercial Securitization, and $1.5 billion at consolidated Sequoia entities.
THE REDWOOD REVIEW | 3RD QUARTER 2014 28
| F I N A N C I A L I N S I G H T S |
Summary
As a REIT, Redwood is required to distribute to shareholders at least 90% of its REIT taxable income. REIT taxable income is defined as taxable income earned at Redwood and its qualified REIT subsidiaries. To the extent Redwood retains REIT taxable income, it is taxed at corporate tax rates. Redwood also earns taxable income at its taxable REIT subsidiaries (TRS), which it is not required to distribute.
Dividend Policy Overview
Our Board of Directors has maintained a policy of paying regular quarterly dividends, although we have not been required to distribute dividends in recent years under the provisions of the Internal Revenue Code applicable to REITs. In November 2013, the Board of Directors announced its intention to pay a regular dividend of $0.28 per share per quarter in 2014. On November 6, 2014, the Board of Directors declared a regular dividend of $0.28 per share for the fourth quarter which is payable on December 29, 2014, to shareholders of record on December 15, 2014.
Our Board’s practice has been to announce its intention with respect to the regular quarterly dividend for the upcoming calendar year towards the end of the fourth quarter of each year. The consistency and sustainability of the dividend over time has always been an important consideration and priority. In recent years, the quarterly dividend rate has not been directly tied to GAAP or REIT taxable earnings for any particular quarter. In addition, in deliberating about dividends, the Board has generally considered numerous factors, including management’s projections for the company’s GAAP and REIT taxable earnings, and also projections of cash flows, capital, and liquidity. For example, in 2011, no change to the dividend rate was made, even though our earnings were lower than the quarterly dividend, as we invested in building our residential and commercial platforms.
Dividend Distribution Requirement
Our estimated REIT taxable income was $18 million, or $0.21 per share, for the third quarter of 2014 and $14 million, or $0.17 per share, for the second quarter of 2014. Under normal circumstances, our minimum REIT dividend requirement would be 90% of our annual REIT taxable income. However, we currently maintain a federal $70 million REIT net operating loss carry forward (NOL) that affords us the option of retaining REIT taxable income up to the NOL amount, tax free, rather than distributing it as dividends. Federal income tax rules require the dividends paid deduction to be applied to reduce taxable income before the applicability of NOLs is considered. We do not expect our estimated REIT taxable income to exceed our dividend distributions in 2014; therefore, our entire NOL will likely carry forward into 2015.
THE REDWOOD REVIEW | 3RD QUARTER 2014 29
| F I N A N C I A L I N S I G H T S |
Income Tax Characterization of Dividend for Shareholders
Irrespective of our minimum distribution requirement, federal income tax rules require that the actual dividends we distribute in 2014 be taxed at the shareholder level based on our full-year 2014 taxable income plus net capital gains before application of any loss carry forwards. Based on this requirement, we expect much of the dividends we distribute in 2014 will be taxable as ordinary income to shareholders and a smaller portion to be a return of capital, which is generally non-taxable. None of Redwood’s 2014 dividend distributions are expected to be characterized as long-term capital gains for federal income tax purposes. Factors that significantly affect the taxation of our 2014 dividends to shareholders include but are not limited to: (i) capital gains on sales of securities and (ii) the timing of realized credit losses on legacy investments.
(i) For the nine months ended September 30, 2014, we realized net capital gains of $15 million at the REIT level for tax purposes. Net capital gains generated by the REIT for the entire year could increase the portion of our 2014 dividends that are characterized as ordinary income to our shareholders. However, if the REIT realizes net capital losses for 2014, those losses would have no effect on the taxability of our 2014 dividends. None of our 2014 dividend distributions are expected to be characterized as long-term capital gains based on applicable federal income tax rules.
(ii) Our estimated REIT taxable income for the nine months ended September 30, 2014 included $5 million of realized credit losses on legacy investments that were taken in previous periods for GAAP reporting purposes. We anticipate an additional $36 million of tax credit losses to be realized over an estimated three to five-year period based on the securities we currently own. This is a decrease from $59 million at December 31, 2013 and $111 million at December 31, 2012. Even though the impact of realized losses on our current period taxable income is declining, our GAAP earnings, which have provisioned for these losses in prior periods, will likely continue to exceed our REIT taxable income.
GAAP Provision for Income Tax at Taxable REIT Subsidiaries
To the extent we expect to pay tax at the corporate level (generally as a result of activity at our taxable REIT subsidiaries), we are required to record a tax provision for GAAP reporting purposes. We recorded a tax provision of $5 million for the third quarter of 2014, as compared to a tax provision of less than $1 million for the second quarter of 2014. The provision was primarily due to GAAP income recorded at our TRS during the third quarter of 2014. Our total tax provision of $4 million through the first nine months of 2014 is not intended to reflect the actual amount we expect to pay as income tax expense in the current year, but rather a deferred GAAP expense that we expect to pay in future periods, as taxable income is earned at our TRS. A reconciliation of GAAP and taxable income is set forth in Table 2 of the Financial Tables of this Redwood Review. We do not expect to generate excess inclusion income in 2014, but in the event we do, it is our intention to retain it at our TRS and not pass it through to our shareholders.
THE REDWOOD REVIEW | 3RD QUARTER 2014 30
| B U S I N E S S S E G M E N T S |
Summary
We operate our business in three segments: residential mortgage banking, residential investments, and commercial mortgage banking and investments.
The table below presents our consolidated financial results for the third quarter of 2014 by presenting the direct contribution of each segment separately. The table also includes a reconciling column labeled “Corporate/Other” that includes the impact of our legacy consolidated Sequoia Entities, certain long-term debt, and corporate operations not directly attributable to our operating segments. Following the table below are descriptions of each segment along with a summary of activity in each segment. Additional detail on our segments and their results will be provided in our Quarterly Report on Form 10-Q for the period ended September 30, 2014.
| Segment Results | ||||||||||||||||||||
| Three Months Ended September 30, 2014 | ||||||||||||||||||||
| ($ in millions) | ||||||||||||||||||||
| Residential Mortgage Banking |
Residential Investments |
Commercial Mortgage Banking and Investments |
Corporate/ Other |
Total | ||||||||||||||||
| Interest income |
$ | 17 | $ | 28 | $ | 13 | $ | 6 | $ | 63 | ||||||||||
| Interest expense |
(4 | ) | (3 | ) | (5 | ) | (11 | ) | (23 | ) | ||||||||||
| Net interest income (expense) |
13 | 24 | 8 | (5 | ) | 40 | ||||||||||||||
| Reversal of provision for loan losses |
- | - | 1 | 1 | 2 | |||||||||||||||
| Net interest income (expense) after provision |
13 | 24 | 9 | (5 | ) | 42 | ||||||||||||||
| Noninterest income |
||||||||||||||||||||
| Mortgage banking activities, net |
11 | - | 6 | - | 18 | |||||||||||||||
| MSR income, net |
- | 6 | - | - | 6 | |||||||||||||||
| Other market valuation adjustments, net |
- | (3 | ) | - | - | (4 | ) | |||||||||||||
| Realized gains, net |
- | 8 | - | 1 | 9 | |||||||||||||||
| Total noninterest income (loss), net |
11 | 10 | 6 | 1 | 29 | |||||||||||||||
| Operating expenses |
(10 | ) | (1 | ) | (2 | ) | (8 | ) | (21 | ) | ||||||||||
| Other income |
- | - | - | 2 | 2 | |||||||||||||||
| Provision for income taxes |
(3 | ) | - | (2 | ) | - | (5 | ) | ||||||||||||
| Segment contribution |
$ | 11 | $ | 34 | $ | 11 | $ | (11 | ) | |||||||||||
| Net income |
$ | 45 | ||||||||||||||||||
| Additional Information: |
||||||||||||||||||||
| Residential loans |
$ | 1,502 | $ | 239 | $ | - | $ | 1,547 | $ | 3,288 | ||||||||||
| Commercial loans |
- | - | 498 | - | 498 | |||||||||||||||
| Real estate securities |
101 | 1,294 | - | - | 1,395 | |||||||||||||||
| Mortgage servicing rights |
- | 135 | - | - | 135 | |||||||||||||||
| Total Assets |
$ | 1,635 | $ | 1,696 | $ | 527 | $ | 1,753 | $ | 5,612 | ||||||||||
THE REDWOOD REVIEW | 3RD QUARTER 2014 31
| B U S I N E S S S E G M E N T S |
Summary
The Residential Mortgage Banking segment primarily consists of a mortgage loan conduit that acquires residential loans from third-party originators for subsequent sale. The jumbo loans we acquire are typically sold through our Sequoia private-label securitization program or to institutions that acquire pools of whole loans. The conforming loans we acquire are generally sold to Fannie Mae and Freddie Mac (GSEs). Our residential loan acquisitions are usually made on a flow basis as they are originated by banks or mortgage companies. We occasionally supplement our flow purchases with bulk acquisitions as well.
This segment’s main source of revenue is income from mortgage banking activities, which includes valuation increases (or gains) on the sale or securitization of loans, and from IO securities and derivatives used to manage risks associated with these activities. Additionally, this segment may generate interest income on loans held pending sale. Funding expenses, direct operating expenses, and tax expenses associated with these activities are also included.
| „ | During the third quarter of 2014, we identified $3.7 billion of loans for purchase and we acquired $3.4 billion of loans, compared to the second quarter of 2014, when we identified $3.2 billion of loans for purchase and we acquired $1.8 billion of loans. |
| „ | During the third quarter of 2014, we completed two prime jumbo securitizations totaling $636 million, seven jumbo whole loan sale transactions totaling $699 million, and $1.5 billion of conforming loan sales to the GSEs, as compared to the second quarter of 2014 when we completed one prime jumbo securitization totaling $351 million, six jumbo whole loan sale transactions totaling $357 million and sold $757 million of conforming loans to the GSEs. |
| „ | In the third quarter of 2014, industry-wide private-label jumbo RMBS issuance totaled $3.1 billion, compared to $1.0 billion in the second quarter of 2014, according to Inside Nonconforming Markets. |
| „ | Redwood has sponsored, through its Sequoia platform, $9.4 billion, or 40%, of the $23.7 billion of total private-label RMBS issuance from 2010 through September 30, 2014, as reported by Inside Nonconforming Markets. |
| „ | At September 30, 2014, the fair value of our residential loans held-for-sale was $1.5 billion, an increase from $1.1 billion at June 30, 2014. At September 30, 2014, our pipeline of residential loans identified for purchase (unadjusted for fallout) was $1.3 billion of jumbo loans and $324 million of conforming loans. At September 30, 2014, IO and senior securities retained from Sequoia securitizations totaled $101 million at this segment. |
| „ | Our group of residential loan sellers, which are third parties that can sell jumbo and conforming loans to us, increased to a total of 152 at September 30, 2014, from 140 at June 30, 2014. |
THE REDWOOD REVIEW | 3RD QUARTER 2014 32
| B U S I N E S S S E G M E N T S |
Summary
The Residential Investments segment includes a portfolio of investments in residential mortgage-backed securities (RMBS) retained from our Sequoia securitizations, as well as RMBS issued by third parties. This segment also includes mortgage servicing rights (MSRs) associated with residential loans securitized through our Sequoia program or sold to the GSEs or other third parties, and MSRs purchased from third parties.
This segment’s main source of revenue is net interest income from portfolio securities and income from MSRs. Additionally, this segment may realize gains upon the sale of securities or MSRs. Funding expenses, hedging expenses, direct operating expenses, and tax expenses associated with these activities are also included.
| „ | At September 30, 2014, the fair value of the securities in the residential investments segment totaled $1.3 billion, consisting of $359 million in prime senior securities, $194 million in non-prime senior securities, $176 million in Re-REMIC securities, $412 million in mezzanine securities, and $153 million in subordinate securities. The amortized cost of our available-for-sale securities, which accounted for all but $8.1 million of securities (held as trading securities) in this segment, was 75% of face value and the fair value was 88% of face value at September 30, 2014. |
| „ | We financed our holdings of residential securities through a combination of short-term debt secured by securities, our Residential Resecuritization, long-term debt and equity capital. During the third quarter of 2014, average short-term debt secured by securities was $801 million and the average asset-backed securities outstanding in the Residential Resecuritization was $61 million. |
| „ | During the third quarter of 2014, we sponsored two Sequoia securitizations and retained $2 million of IO securities in our Residential Mortgage Banking segment, $39 million of mezzanine and subordinate securities and $4 million of MSR investments. The IO securities retained from this securitization are included in the Residential Mortgage Banking segment. In the second quarter of 2014, we sponsored one Sequoia securitization. At September 30, 2014, retained investments acquired from Sequoia securitizations totaled $543 million, including $101 million of senior IO securities, $357 million of mezzanine securities, $85 million of subordinate securities, and $62 million of MSRs. |
| „ | Information on the residential securities we own is set forth in Tables 5 through 7 in the Appendix. |
THE REDWOOD REVIEW | 3RD QUARTER 2014 33
| B U S I N E S S S E G M E N T S |
Residential Investments (continued)
The following table presents information on residential securities in our residential investments segment at September 30, 2014. For GAAP, we account for the large majority of these securities as available-for-sale (AFS) and the others as trading securities, and in both cases the securities are reported at their fair value at the report date.
| Residential Securities
|
| |||||||||||||||||||||||
| September 30, 2014 | ||||||||||||||||||||||||
| ($ in millions) | ||||||||||||||||||||||||
| Senior | Subordinate | |||||||||||||||||||||||
| Prime | Non-prime | Re-REMIC | Mezzanine | Subordinate | Total | |||||||||||||||||||
| Available-for-sale securities |
||||||||||||||||||||||||
| Current face |
$ | 363 | $ | 203 | $ | 206 | $ | 436 | $ | 259 | $ | 1,466 | ||||||||||||
| Credit reserve |
(4 | ) | (10 | ) | (17 | ) | - | (43 | ) | (74 | ) | |||||||||||||
| Net unamortized discount |
(41 | ) | (34 | ) | (81 | ) | (38 | ) | (106 | ) | (299 | ) | ||||||||||||
| Amortized cost |
318 | 159 | 109 | 398 | 110 | 1,093 | ||||||||||||||||||
| Unrealized gains |
42 | 27 | 67 | 14 | 45 | 196 | ||||||||||||||||||
| Unrealized losses |
(1 | ) | - | - | (1 | ) | (2 | ) | (3 | ) | ||||||||||||||
| Trading securities |
- | 8 | - | - | - | 8 | ||||||||||||||||||
| Fair value of residential securities |
$ | 359 | $ | 194 | $ | 176 | $ | 412 | $ | 154 | $ | 1,294 | ||||||||||||
Investments in MSRs
In the third quarter of 2014, Redwood’s investments in MSRs increased to $135 million, as we added $62 million of MSRs associated with $5.4 billion aggregate principal amount of residential loans and recognized market valuation adjustments of $2 million. At September 30, 2014 the value of loans associated with our investment in MSRs was $12.2 billion and the GAAP carrying value of our MSRs was equal to 1.10% of the principal balance of the associated residential loans.
THE REDWOOD REVIEW | 3RD QUARTER 2014 34
| B U S I N E S S S E G M E N T S |
Commercial Mortgage Banking and Investments
Summary
The Commercial Mortgage Banking and Investments segment consists primarily of a mortgage loan conduit that originates senior commercial loans for subsequent sale to third-party CMBS sponsors or other investors. This segment also provides other forms of commercial real estate financing directly to borrowers that may include mezzanine loans, subordinate mortgage loans, and other forms of financing. We typically hold the mezzanine and other subordinate loans we originate in our commercial investment portfolio.
This segment’s main sources of revenue are mortgage banking income, which includes valuation increases (or gains) on the sale of senior commercial loans and associated hedges, and net interest income from mezzanine or subordinate loans held in our investment portfolio. Funding expenses, direct operating expenses, and tax expenses associated with these activities are also included.
| „ | Income from commercial mortgage banking activities was $6 million in the third quarter of 2014, as compared to $5 million in the second quarter of 2014. |
| „ | During the third quarter of 2014, we originated and funded 24 senior commercial loans for $340 million, and sold 24 senior loans totaling $291 million. This compares to the second quarter of 2014 when we originated and funded 15 senior loans for $149 million, and sold 13 senior loans totaling $181 million. |
| „ | At September 30, 2014, we had seven senior commercial loans held-for-sale with a carrying value of $105 million. |
| „ | At September 30, 2014, we had $71 million of commercial loans at fair value classified as held-for-investment. Of these loans, $66 million of A-notes were sold to third-parties but did not meet the sale criteria under GAAP, and remain on our balance sheet. As a result, we also recorded secured borrowings of $66 million, which are also carried at fair value. Our investments in the B-notes related to these loan sales were $5 million at September 30, 2014. |
| „ | During the third quarter of 2014, we originated five commercial mezzanine loans for $26 million, compared to two mezzanine loans for $6 million in the second quarter of 2014. At September 30, 2014, our unsecuritized and securitized portfolios of commercial mezzanine loans held for investment were $118 million and $205 million, respectively. |
| „ | At September 30, 2014, commercial loans held for investment had an outstanding principal balance of $332 million (excluding A-notes), unamortized discount of $2 million, an allowance for loan losses of $7 million, and a carrying value of $323 million. |
THE REDWOOD REVIEW | 3RD QUARTER 2014 35
| B U S I N E S S S E G M E N T S |
Commercial Mortgage Banking and Investments (continued)
| „ | On average, our commercial held-for-investment mezzanine loans have a maturity of more than five years, an unlevered yield in excess of 10% per annum before credit costs, a loan-to-value ratio of 73% at origination, and a debt service coverage ratio at origination of 1.31x based on underwritten cash flows at origination. |
| „ | At September 30, 2014, we had one loan with a carrying value of $26 million on our watch list. The loan is current and we currently expect to receive all amounts due according to the contractual terms of the loan. |
The following table and charts provide information on our commercial mezzanine loan portfolio as of September 30, 2014.
| Commercial Mezzanine Loans at Redwood
|
||||||||||||||||
| September 30, 2014 | ||||||||||||||||
| Property Type | Number of Loans | Original Weighted Average DSCR (1) |
Original Weighted Average LTV (2) |
Average Loan Size ($ in millions) |
||||||||||||
| Multifamily |
27 | 1.33x | 79 | % | $ | 8 | ||||||||||
| Hospitality |
10 | 1.41x | 63 | % | 4 | |||||||||||
| Office |
7 | 1.23x | 76 | % | 9 | |||||||||||
| Retail |
6 | 1.16x | 76 | % | 6 | |||||||||||
| Self Storage |
3 | 1.39x | 75 | % | 2 | |||||||||||
| Industrial |
2 | 1.37x | 70 | % | 8 | |||||||||||
| Total portfolio |
55 | 1.31x | 73 | % | $ | 6 | ||||||||||
| (1) | The debt service coverage ratio (DSCR) is defined as the property’s annual net operating income divided by the annual principal and interest payments. The weighted average DSCRs in this table are based on the ratios at the time the loans were originated and are not based on subsequent time periods during which there may have been increases or decreases in each property’s operating income. |
| (2) | The loan-to-value (LTV) calculation is defined as the sum of the senior and all subordinate loan amounts divided by the value of the property at the time the loan was originated. |
THE REDWOOD REVIEW | 3RD QUARTER 2014 36
| B U S I N E S S S E G M E N T S |
Commercial Mortgage Banking and Investments (continued)
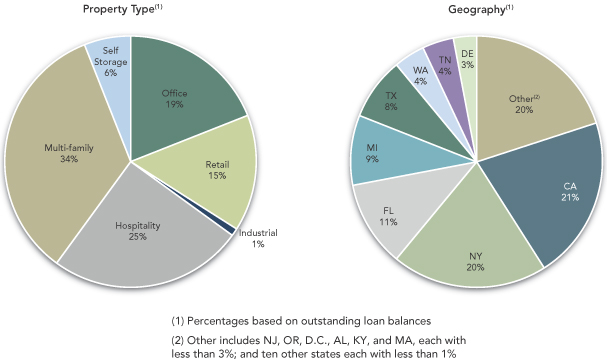
THE REDWOOD REVIEW | 3RD QUARTER 2014 37

| R E D W O O D’ S B U S I N E S S S T R A T E G Y |
We made a strategic decision in late 2009 to invest in and build out our residential and commercial loan platforms. We did this in order to create our own steady sources of attractive investments and fee-generating opportunities, as we assumed that large bank originators with excess liquidity would be more likely to retain their originations for their own investment portfolios than sell them into the secondary market to aggregators such as Redwood.
There is commonality between our residential and commercial business activities. In both cases, we have established ourselves as an intermediary between borrowers and senior investors in the capital markets. We believe that this strategy should work well with the structure of our balance sheet and the talents and extensive relationships of the professionals who make up our residential and commercial teams.
On the residential side, our focus since mid-2010 has been to acquire prime, jumbo mortgages and the related mortgage servicing rights and to sell the loans through private-label securitizations and whole-loan bulk-sales. While the initial market opportunity appeared small, our confidence was driven by three primary business assumptions: 1) the government would eventually reduce its outsized role in the mortgage market; 2) new bank regulation, Basel III, and legacy portfolio issues would open up an opportunity for independent mortgage companies; and 3) traditional triple-A institutional investors would return to the market to provide attractive financing for prime residential loans through their investments in private-label securities (“PLS”). In order to leverage the platform and to participate in risk-sharing transactions contemplated under GSE reform, in the fourth quarter of 2013 we entered the conforming segment of the market (defined as loans eligible for sale to Fannie Mae and Freddie Mac) and we began to acquire conforming loans and the related servicing rights from many of our jumbo loan sellers and new conforming-only loan sellers. Conforming loans we acquire are expected to be sold to Fannie Mae or Freddie Mac.
On the commercial side, our focus has been on commercial loan refinancing demand expected to result from the pre-crisis era of high-leverage lending. An immediate need was identified for mezzanine capital that could bridge the gap between commercial borrowers’ funding needs and what traditional senior lenders would provide in refinancing transactions. We also assumed that we would eventually position our platform to become an originator of senior commercial loans, offering value through greater flexibility and certainty of execution for borrowers. We have made progress in both areas, as we have originated more than $375 million of mezzanine loans since late 2010, and have originated more than $1.4 billion of senior commercial loans since mid-2012.
THE REDWOOD REVIEW | 3RD QUARTER 2014 39
| R E D W O O D’ S B U S I N E S S S T R A T E G Y |
Redwood’s Business Model
Our business model has evolved substantially since the financial crisis began in 2007. This evolution has been driven in part, by our desire to build a franchise with a value-producing business model positioned to capitalize on the expected eventual reform of Fannie Mae and Freddie Mac and to be competitive in the post-crisis era of greater regulatory and capital requirements for all mortgage market participants, particularly for the more heavily regulated banks.
Today, Redwood focuses on investing in mortgage- and other real estate-related assets and engaging in residential and commercial mortgage banking activities. While we remain structured as a REIT for tax purposes, we complement our tax-advantaged investments with mortgage-banking activities conducted through taxable REIT subsidiaries that pay taxes and, if desired, can generally retain earnings and reinvest the cash flows generated therein.
THE REDWOOD REVIEW | 3RD QUARTER 2014 40
| G L O S S A R Y |
A-NOTES
A-Notes are senior interests in commercial mortgage debt which are promissory notes secured by either a deed of trust or a mortgage. A-Notes are senior to any subordinate financing, such as B-Notes, and mezzanine financing. See B-Notes and Mezzanine Loan definitions.
ADJUSTABLE-RATE MORTGAGES (ARM)
Adjustable-rate mortgages (“ARMs”) are loans that have coupons that adjust at least once per year. We make a distinction between ARMs (loans with a rate adjustment at least annually) and hybrids (loans that have a fixed-rate period of 2-10 years and then become adjustable-rate).
AGENCY
Agency refers to government-sponsored enterprises (“GSEs”), including Federal National Mortgage Association (“Fannie Mae”), Federal Home Loan Mortgage Corporation (“Freddie Mac”), and Government National Mortgage Association (“Ginnie Mae”).
ALT-A SECURITIES and ALT-A LOANS
Alt-A securities are residential mortgage-backed securities backed by loans that have higher credit quality than subprime and lower credit quality than prime. Alt-A originally represented loans with alternative documentation, but the definition has shifted over time to include loans with additional risk characteristics and in some cases investor loans. In an Alt-A loan, the borrower’s income may not be verified, and in some cases, may not be disclosed on the loan application. Alt-A loans may also have expanded criteria that allow for higher debt-to-income ratios with higher accompanying loan-to-value ratios than would otherwise be permissible for prime loans.
AMORTIZED COST
Amortized cost is the initial acquisition cost of an available-for-sale (“AFS”) security, minus principal repayments or principal reductions through credit losses, plus or minus premium or discount amortization. At the point in time an AFS security is deemed other-than-temporarily impaired, the amortized cost is adjusted (by changing the amount of unamortized premium or discount) by the amount of other-than temporary impairment taken through the income statement.
ASSET-BACKED SECURITIES (ABS)
Asset-backed securities (“ABS”) are securities backed by financial assets that generate cash flows. Each ABS issued from a securitization entity has a unique priority with respect to receiving principal and interest cash flows and absorbing any credit losses from the assets owned by the entity.
AVAILABLE-FOR-SALE (AFS)
An accounting method for debt and equity securities in which the securities are reported at their fair value. Positive changes in the fair value are accounted for as increases to stockholders’ equity and do not flow through the income statement. Negative changes in fair value may be recognized through the income statement or balance sheet.
THE REDWOOD REVIEW | 3RD QUARTER 2014 41
| G L O S S A R Y |
B-NOTES
B-Notes are subordinate interests in commercial mortgage debt which are either (i) evidenced by a subordinated promissory note secured by the same mortgage that also secures the senior debt relating to the same property or (ii) junior participation interests in mortgage debt that are subordinate to senior participation interests in the same mortgage debt. B-Notes typically provide the holder with certain rights to approve modifications to related lending agreements and to trigger foreclosure under the mortgage following an event of default. B-Notes also typically provide the holder certain limited rights to cure a borrower default under senior debt secured by the same mortgage in order to keep the senior debt current and avoid foreclosure.
BOOK VALUE (GAAP)
Book value is the value of our common equity in accordance with GAAP.
COMMERCIAL MORTGAGE-BACKED SECURITIES (CMBS)
A type of mortgage-backed security that is secured by one or more loans on commercial properties.
CONFORMING LOAN
A conforming loan is a mortgage loan that conforms to the underwriting standards of Fannie Mae and Freddie Mac, including the maximum loan limit, which is currently $417,000 except in defined high-cost areas of the country, where the limit is higher. Changes to this maximum loan limit are announced annually by the Federal Housing Finance Agency (“FHFA”), which is the regulator and conservator of both Fannie Mae and Freddie Mac.
CONSTANT (or CONDITIONAL) PREPAYMENT RATE (CPR)
Constant (or conditional) prepayment rate (“CPR”) is an industry-standard measure of the speed at which mortgage loans prepay. It approximates the annual percentage rate at which a pool of loans is paying down due to unscheduled principal prepayments.
CREDIT SUPPORT
Credit support is the face amount of securities subordinate (or junior) to the applicable security that protects the security from credit losses and is generally expressed as a percentage of the securitization’s underlying pool balance.
DEBT
Debt is an obligation of Redwood. See Long-term debt and Short-term debt.
FALLOUT
The percentage of loans that an originator plans or commits to sell to a buyer that ultimately do not close and are not delivered to the buyer.
FASB
Financial Accounting Standards Board.
THE REDWOOD REVIEW | 3RD QUARTER 2014 42
| G L O S S A R Y |
FHFA
The FHFA refers to the Federal Housing Finance Authority.
FORWARD SALE COMMITMENT
A contract pertaining to the future sale of a loan at a specified price and within a specified time period. Mortgage bankers often use forward sale commitments to hedge interest rate risk between the date they agree to buy and the date in which the loan is sold, which is often between 30 and 60 days. This commitment qualifies as a derivative in accordance with GAAP. Any change in the value of this forward sale commitment is recorded as a market valuation adjustment in mortgage banking activities, net.
GAAP
Generally Accepted Accounting Principles in the United States.
GOVERNMENT SPONSORED ENTERPRISE (GSE)
A government sponsored enterprise is a financial services corporation created by the United States Congress to enhance the flow of credit to targeted sectors of the economy. Among the GSEs chartered by Congress are Fannie Mae, Freddie Mac, Ginnie Mae, and the Federal Home Loan Banks. When we refer to GSEs, we are generally referring to Fannie Mae and Freddie Mac.
INTEREST-ONLY SECURITIES (IOs)
Interest-only securities (“IOs”) are specialized securities created by securitization entities where the projected cash flows generated by the underlying assets exceed the cash flows projected to be paid to the securities that are issued with principal balances. Typically, IOs do not have a principal balance and they will not receive principal payments. Interest payments to IOs usually equal an interest rate formula multiplied by a “notional” principal balance. The notional principal balances for IOs are typically reduced over time as the actual principal balance of the underlying pool of assets pays down, thus reducing the cash flows to the IOs over time. Cash flows on IOs are typically reduced more quickly when asset prepayments increase.
INVESTMENT CAPACITY
The amount of capacity we estimate that we have to invest in new assets. Our estimate of our investment capacity takes into account, among other things, cash on hand, cash we estimate we could raise by prudently increasing short-term borrowings, and cash needed to cover short-term operations, working capital, and a liquidity cushion.
JUMBO LOAN
A jumbo loan is a mortgage loan that generally conforms to the underwriting standards of Fannie Mae and Freddie Mac except that the dollar amount of the loan exceeds the conforming loan limit set annually by the FHFA. See Conforming Loan Definition.
THE REDWOOD REVIEW | 3RD QUARTER 2014 43
| G L O S S A R Y |
LEVERAGE RATIOS
Leverage ratios measure financial leverage and are used to assess a company’s ability to meet its financial obligations. Financial leverage ratios are often expressed as debt to equity and assets to equity. In the mortgage banking industry, financial leverage is most commonly calculated using debt to equity. At Redwood, the two financial leverage ratios used are consolidated GAAP debt to equity and recourse debt to equity. The former calculation includes the consolidated ABS issued from certain Sequoia securitization entities (generally those issued prior to 2012) even though those obligations are not financial obligations of Redwood but are obligations of each the consolidated securitization trusts and are payable only from the cash flow from the assets owned by each of those trusts. The latter calculation of recourse debt to equity excludes debt related to consolidated securitizations and only includes debt for which Redwood has an obligation to repay. Both ratios are calculated at the bottom of Table 3: Book Value and Financial Ratios in the Appendix section.
LOAN PURCHASE COMMITMENT
A commitment to purchase a residential mortgage loan from a mortgage loan originator at a specified price and within a specified time period. A “best efforts” loan purchase commitment becomes effective once the originator has closed the loan with the borrower. A “mandatory” loan purchase commitment becomes effective once the commitment is entered into among the buyer and the originator, regardless if the originator has closed the loan. Mortgage buyers such as Redwood often issue 30 to 60 day loan purchase commitments to loan originators so they can in turn offer a similar commitments to their borrowers. To hedge interest rate risk during the commitment period, buyers will often enter in to a forward sale commitment or hedge the risk using derivatives. (See forward sale commitment definition.) A loan purchase commitment for a conforming loan qualifies as a derivative in accordance with GAAP. Any change in the value of a loan purchase commitment is recorded as a market valuation adjustment in mortgage banking activities, net. Our loan purchase commitment for a non-conforming loan does not qualify as a derivative in accordance with GAAP and is not recorded as an asset or liability.
LONG-TERM DEBT
Long-term debt is debt that is an obligation of Redwood that is not payable within a year and includes convertible debt, junior subordinated notes and trust preferred securities. We generally treat long-term debt as part of our capital base when it is not payable in the near future.
MARK-TO-MARKET (MTM) ACCOUNTING
Mark-to-market (“MTM”) accounting uses estimated fair values of assets, liabilities, and hedges. Many assets on our consolidated balance sheet are carried at their fair value rather than amortized cost. Taxable income is generally not affected by market valuation adjustments.
MARKET VALUATION ADJUSTMENTS (MVAs)
Market valuation adjustments (“MVAs”) are changes in market values for certain assets and liabilities that are reported through our GAAP income statement. They include all changes in market values for assets and liabilities accounted for at fair value, such as trading securities and derivatives. They also include the credit portion of other-than-temporary impairments on securities available-for-sale, as well as impairments of loans held-for-sale and REO properties.
THE REDWOOD REVIEW | 3RD QUARTER 2014 44
| G L O S S A R Y |
MEZZANINE LOAN
A mezzanine loan is a loan secured by the membership interests, partnership interests, and/or stock in a single purpose entity formed to own a commercial property, for example. If the mezzanine borrower fails to make its payments or otherwise defaults under the mezzanine loan documents, the mezzanine lender may pursue its remedies, including taking control of the single purpose entity that owns the property.
MEZZANINE SECURITIES
Mezzanine securities are a type of subordinate security and refer to the securities in a residential mortgage-backed securitization that are rated AA, A, and BBB. They rank junior to the AAA securities, and senior to the securities rated below BBB which typically include BB and B rated securities, and any non-rated securities.
MORTGAGE SERVICING RIGHT (MSR)
A mortgage servicing right (“MSR”) gives the holder the contractual right to service a mortgage loan. MSRs typically include the right to collect monthly mortgage principal and interest payments, as well as related tax and insurance payments, from borrowers, disburse funds to the mortgage debt holders and remit related insurance and tax payments, collect late payments, and process modifications and foreclosures. MSRs are created when mortgage loans are sold in a transaction in which the seller retains the right to service the loans. The holder of an MSR receives a monthly servicing fee (which generally ranges from 0.25% to 0.375% per annum of the outstanding principal balance of the related mortgage loan), which is deducted from the borrower’s monthly interest payments. For accounting purposes, MSRs are capitalized at the net present value of the servicing fee less the servicing cost. When Redwood holds MSRs relating to residential mortgage loans, it retains a sub-servicer to carry out actual servicing functions, as Redwood does not directly service residential mortgage loans.
NON-PRIME SECURITIES
Non-prime securities are Alt-A, option ARM, and subprime securities. See definitions of Alt-A, option ARM, and subprime securities.
OPTION ARM LOAN
An option ARM loan is a residential mortgage loan that generally offers a borrower monthly payment options such as: 1) a minimum payment that results in negative amortization; 2) an interest-only payment; 3) a payment that would fully amortize the loan over an original 31-year amortization schedule; and, 4) a payment that would fully amortize the loan over a 15-year amortization schedule. To the extent the borrower has chosen an option that is not fully amortizing the loan (or negatively amortizing the loan), after a period – usually five years or once the negatively amortized loan balance reaches a certain level (generally 15% to 25% higher than the original balance) – the loan payments are recast. This recast provision resets the payment at a level that fully amortizes the loan over its remaining life and the new payment may be materially different than under the borrowers’ previous option.
THE REDWOOD REVIEW | 3RD QUARTER 2014 45
| G L O S S A R Y |
PREFERRED EQUITY
A preferred equity investment is an investment in preferred equity of a special purpose entity that directly or indirectly owns a commercial property. An investor in preferred equity is typically entitled to a preferred return (relative to a holder of common equity of the same entity) and has the right, if the preferred return is not paid, to take control of the entity (and thereby control the underlying commercial property).
PRIME RESIDENTIAL REAL ESTATE LOANS
Prime loans are residential loans with higher quality credit characteristics, such as borrowers with higher FICO credit scores, lower loan-to-value ratios, lower debt-to-income ratios, greater levels of other assets, and more documentation.
PRIME SECURITIES
Prime securities are residential mortgage-backed securities backed by prime loans, generally with balances greater than conforming loan limits. Prime securities are typically backed by loans that have relatively high weighted average FICO scores (e.g., 700 or higher at origination), low weighted average LTVs (e.g., 75% or less at origination), limited concentrations of investor properties, and low percentages of loans with low FICO scores or high loan-to-value ratios.
PRINCIPAL-ONLY SECURITIES (POs)
Principal-only securities (“POs”) are specialized securities created by securitization entities where the holder is only entitled to receive regular cash flows that are derived from incoming principal repayments on an underlying mortgage loan pool. This security is created by splitting a mortgage-backed security into its interest and principal payments. The principal payments create a string of cash flows which are sold at a discount to investors. These investors will receive the principal portions of the monthly mortgage payments from the underlying pool of loans. The yield on a PO strip depends on the prepayment speed of the underlying loan. The faster the principal is repaid, the higher the yield an investor will receive.
PROFITABILITY RATIOS
Many financial institution analysts use asset-based profitability ratios such as interest rate spread and interest rate margin when analyzing financial institutions. These are asset-based measures. Since we consolidate the assets and liabilities of certain securitization entities for GAAP purposes, our total GAAP assets and liabilities may vary over time, and may not be comparable to assets typically used in profitability calculations for other financial institutions. As a result, we believe equity-based profitability ratios may be more appropriate than asset-based measures for analyzing Redwood’s operations and results. We provide various profitability ratios in Table 4 in the Financial Tables in this Review.
REAL ESTATE INVESTMENT TRUST (REIT)
A real estate investment trust (“REIT”) is an entity that makes a tax election to be taxed as a REIT, invests in real estate assets, and meets other REIT qualifications, including the distribution as dividends of at least 90% of its REIT taxable income. A REIT’s profits are not taxed at the corporate
THE REDWOOD REVIEW | 3RD QUARTER 2014 46
| G L O S S A R Y |
level to the extent that these profits are distributed as dividends to stockholders, providing an operating cost savings. On the other hand, the requirement to pay out as dividends most of the REIT’s taxable profits means it can be harder for a REIT to grow using only internally-generated funds (as opposed to raising new capital).
REAL ESTATE OWNED (REO)
Real estate owned (“REO”) refers to real property owned by the lender or loan owner that has been acquired through foreclosure.
REIT SUBSIDIARY
A REIT subsidiary is a subsidiary of a REIT that is taxed as a REIT.
REIT TAXABLE INCOME
REIT taxable income is not a measure calculated in accordance with GAAP. REIT taxable income is pretax income calculated for tax purposes at Redwood including only its qualifying REIT subsidiaries (i.e., excluding its taxable subsidiaries, with certain adjustments). REIT taxable income is an important measure as it is the basis of our dividend distribution requirements. We must annually distribute at least 90% of REIT taxable income as dividends to shareholders. As a REIT, we are not subject to corporate income taxes on the REIT taxable income we distribute. We pay corporate income tax on the REIT taxable income we retain, if any (and we are permitted to retain up to 10% of total REIT taxable income). A reconciliation of REIT taxable income to GAAP income appears in Table 2 in the Financial Tables in this Review.
REMIC
A real estate mortgage investment conduit (“REMIC”) is a special purpose vehicle used to pool real estate mortgages and issue mortgage-backed securities. REMICs are typically exempt from tax at the entity level. REMICs may invest only in qualified mortgages and permitted investments, including single family or multifamily mortgages, commercial mortgages, second mortgages, mortgage participations, and federal agency pass-through securities.
RE-REMIC SECURITY
A Re-REMIC is a re-securitization of asset-backed securities. The cash flows from and any credit losses absorbed by the underlying assets can be redirected to the resulting Re-REMIC securities in a variety of ways.
RESECURITIZATION
A resecuritization is a securitization of two or more mortgage-backed securities into a new mortgage-backed security.
RESIDENTIAL MORTGAGE-BACKED SECURITIES (RMBS)
A type of mortgage-backed security that is backed by a pool of mortgages on residential properties.
THE REDWOOD REVIEW | 3RD QUARTER 2014 47
| G L O S S A R Y |
RETURN ON EQUITY (ROE)
ROE is the amount of profit we generate each year per dollar of equity capital and equals GAAP income divided by GAAP equity.
SENIOR SECURITIES
Generally, senior securities have the least credit risk in a securitization transaction because they are generally the last securities to absorb credit losses. In addition, the senior securities have the highest claim on the principal and interest payments (after the fees to servicers and trustees are paid). To further reduce credit risk, most if not all, principal collected from the underlying asset pool is used to pay down the senior securities until certain performance tests are satisfied. If certain performance tests are satisfied, principal payments are shared between the senior securities and the subordinate securities, generally on a pro rata basis. At issuance, senior securities are generally triple A-rated.
SEQUOIA
Sequoia is the brand name for securitizations of residential real estate loans Redwood sponsors. Sequoia entities are independent securitization entities that acquire residential mortgage loans and create and issue asset-backed securities (“ABS”) backed by these loans. Most of the loans that Sequoia entities acquire are prime-quality loans. Most of the senior ABS created by Sequoia are sold to third-party investors. Redwood usually acquires most of the subordinated ABS and may also acquire the interest-only securities (“IOs”).
SHORT-TERM DEBT
Short-term debt is debt that is an obligation of Redwood and payable within a year. We may obtain this debt from a variety of Wall Street firms, banks, and other institutions. We may issue these or other forms of short term debt in the future. We may use short-term debt to finance the accumulation of assets prior to sale to a securitization entity and to finance investments in loans and securities.
SUBORDINATE DEBT INVESTMENTS
Subordinate Debt Investments mean Mezzanine Loans, Preferred Equity, and B-Notes.
SUBORDINATE SECURITIES (JUNIOR SECURITIES or NON-SENIOR SECURITIES)
Subordinate securities absorb the initial credit losses from a securitization structure, thus protecting the senior securities. Subordinate securities have a lower priority to receive principal and interest payments than the senior securities. Subordinate securities receive little, if any, principal payments until certain performance tests are satisfied. If certain performance tests are satisfied, principal payments are shared between the senior securities and the subordinate securities, generally on a pro rata basis. Subordinate securities generally receive interest payments even if they do not receive principal payments. At issuance, subordinate securities are generally rated double-A or below.
THE REDWOOD REVIEW | 3RD QUARTER 2014 48
| G L O S S A R Y |
SUBPRIME SECURITIES
Subprime securities are residential mortgage-backed securities backed by loans to borrowers who typically have lower credit scores and/or other credit deficiencies that prevent them from qualifying for prime or Alt-A mortgages and may have experienced credit problems in the past, such as late payments or bankruptcies. To compensate for the greater risks and higher costs to service the loans, subprime borrowers pay higher interest rates, points, and origination fees.
TAXABLE INCOME
Taxable income is not a measure calculated in accordance with GAAP. Taxable income is pre-tax income for Redwood and all its subsidiaries as calculated for tax purposes. Taxable income calculations differ significantly from GAAP income calculations. A reconciliation of taxable income to GAAP income appears in Table 2 in the Financial Tables in this Review.
TAXABLE SUBSIDIARY
A taxable subsidiary is a subsidiary of a REIT that is not taxed as a REIT and thus pays taxes on its income. A taxable subsidiary is not limited to investing in real estate and it can choose to retain all of its after-tax profits.
TO BE ANNOUNCED (TBA)
A term used to describe a forward Agency mortgage-backed securities trade. Pass-through securities issued by Freddie Mac, Fannie Mae and Ginnie Mae trade in the TBA market. The term TBA is derived from the fact that the actual mortgage-backed security that will be delivered to fulfill a TBA trade is not designated at the time the trade is made. The securities are “to be announced” 48 hours prior to the established trade settlement date.
THE REDWOOD REVIEW | 3RD QUARTER 2014 49

|
|
Table 1: GAAP Earnings (in thousands, except per share data)
|
|||||||||||||||||||||||
|
2014 Q3 |
2014 Q2 |
2014 Q1 |
2013 Q4 |
2013 Q3 |
2013 Q2 |
2013 Q1 |
2012 Q4 |
2012 Q3 |
Nine Months 2014 |
Nine Months |
||||||||||||||||||||||||||||||||||
| Interest income |
$ | 53,324 | $ | 48,347 | $ | 45,145 | $ | 48,331 | $ | 50,139 | $ | 51,195 | $ | 47,361 | $ | 48,025 | $ | 54,001 | $ | 146,816 | $ | 148,695 | ||||||||||||||||||||||
| Discount amortization on securities, net |
10,890 | 10,586 | 11,298 | 10,311 | 8,785 | 8,153 | 7,672 | 7,103 | 7,317 | 32,774 | 24,610 | |||||||||||||||||||||||||||||||||
| Premium amortization expense on loans |
(863 | ) | (940 | ) | (967 | ) | (1,150 | ) | (1,504 | ) | (1,629 | ) | (1,508 | ) | (1,731 | ) | (1,595 | ) | (2,770 | ) | (4,641 | ) | ||||||||||||||||||||||
| Total interest income |
63,351 | 57,993 | 55,476 | 57,492 | 57,420 | 57,719 | 53,525 | 53,397 | 59,723 | 176,820 | 168,664 | |||||||||||||||||||||||||||||||||
| Interest expense on short-term debt |
(8,441 | ) | (5,142 | ) | (3,826 | ) | (3,715 | ) | (5,227 | ) | (4,686 | ) | (3,808 | ) | (2,526 | ) | (2,737 | ) | (17,409 | ) | (13,721 | ) | ||||||||||||||||||||||
| Interest expense on ABS |
(6,718 | ) | (7,024 | ) | (7,288 | ) | (7,697 | ) | (8,183 | ) | (8,724 | ) | (9,347 | ) | (15,051 | ) | (21,370 | ) | (21,030 | ) | (26,254 | ) | ||||||||||||||||||||||
| ABS issuance expense amortization |
(593 | ) | (630 | ) | (633 | ) | (737 | ) | (811 | ) | (882 | ) | (985 | ) | (915 | ) | (552 | ) | (1,856 | ) | (2,678 | ) | ||||||||||||||||||||||
| ABS interest rate agreement expense |
(32 | ) | (39 | ) | (61 | ) | (62 | ) | (62 | ) | (68 | ) | (87 | ) | (11,561 | ) | (1,127 | ) | (132 | ) | (217 | ) | ||||||||||||||||||||||
| ABS issuance premium amortization expense |
(495 | ) | (490 | ) | (459 | ) | (407 | ) | (548 | ) | (576 | ) | (542 | ) | (412 | ) | (113 | ) | (1,444 | ) | (1,666 | ) | ||||||||||||||||||||||
| Total ABS expense consolidated from trusts (1) |
(7,838 | ) | (8,183 | ) | (8,441 | ) | (8,903 | ) | (9,604 | ) | (10,250 | ) | (10,961 | ) | (27,939 | ) | (23,162 | ) | (24,462 | ) | (30,815 | ) | ||||||||||||||||||||||
| Interest expense on long-term debt |
(7,071 | ) | (7,826 | ) | (6,792 | ) | (6,910 | ) | (6,894 | ) | (6,480 | ) | (3,534 | ) | (2,451 | ) | (2,377 | ) | (21,689 | ) | (16,908 | ) | ||||||||||||||||||||||
| Total interest expense |
(23,350 | ) | (21,151 | ) | (19,059 | ) | (19,528 | ) | (21,725 | ) | (21,416 | ) | (18,303 | ) | (32,916 | ) | (28,276 | ) | (63,560 | ) | (61,444 | ) | ||||||||||||||||||||||
| Net interest income |
40,001 | 36,842 | 36,417 | 37,964 | 35,695 | 36,303 | 35,222 | 20,481 | 31,447 | 113,260 | 107,220 | |||||||||||||||||||||||||||||||||
| (Provision for) reversal of provision for loan losses |
1,596 | 315 | (1,282 | ) | (4,243 | ) | (1,727 | ) | 3,272 | (2,038 | ) | (3,394 | ) | (1,319 | ) | 629 | (493 | ) | ||||||||||||||||||||||||||
| Net interest income after provision |
41,597 | 37,157 | 35,135 | 33,721 | 33,968 | 39,575 | 33,184 | 17,087 | 30,128 | 113,889 | 106,727 | |||||||||||||||||||||||||||||||||
| Noninterest income |
||||||||||||||||||||||||||||||||||||||||||||
| Mortgage banking activities, net |
17,872 | 6,310 | (232 | ) | 16,932 | (8,698 | ) | 48,723 | 45,537 | 21,765 | 12,775 | 23,950 | 85,562 | |||||||||||||||||||||||||||||||
| MSR income (loss), net |
5,821 | (1,777 | ) | 606 | 5,628 | 3,113 | 10,547 | 1,021 | (479 | ) | (472 | ) | 4,650 | 14,681 | ||||||||||||||||||||||||||||||
| Other market valuation adjustments, net |
(3,706 | ) | (4,121 | ) | (6,139 | ) | 390 | 462 | (6,258 | ) | (303 | ) | 1,941 | 957 | (13,966 | ) | (6,099 | ) | ||||||||||||||||||||||||||
| Realized gains on sales, net (2) |
8,532 | 1,063 | 105 | 1,935 | 10,469 | 223 | 12,266 | 20,336 | 13,940 | 9,700 | 22,958 | |||||||||||||||||||||||||||||||||
| Realized gains on calls, net |
- | - | 987 | 33 | - | 333 | - | 29 | - | 987 | 333 | |||||||||||||||||||||||||||||||||
| Realized gains, net |
8,532 | 1,063 | 1,092 | 1,968 | 10,469 | 556 | 12,266 | 20,365 | 13,940 | 10,687 | 23,291 | |||||||||||||||||||||||||||||||||
| Total noninterest income (loss), net |
28,519 | 1,475 | (4,673 | ) | 24,918 | 5,346 | 53,568 | 58,521 | 43,592 | 27,200 | 25,321 | 117,435 | ||||||||||||||||||||||||||||||||
| Fixed compensation expense |
(7,445 | ) | (6,872 | ) | (6,792 | ) | (5,750 | ) | (5,808 | ) | (6,080 | ) | (5,636 | ) | (4,275 | ) | (4,412 | ) | (21,109 | ) | (17,524 | ) | ||||||||||||||||||||||
| Variable compensation expense |
(2,418 | ) | (3,021 | ) | (2,731 | ) | (3,908 | ) | (5,621 | ) | (3,961 | ) | (4,836 | ) | (5,475 | ) | (5,602 | ) | (8,170 | ) | (14,418 | ) | ||||||||||||||||||||||
| Equity compensation expense |
(2,261 | ) | (2,824 | ) | (2,330 | ) | (2,196 | ) | (1,997 | ) | (3,396 | ) | (2,487 | ) | (2,499 | ) | (2,151 | ) | (7,415 | ) | (7,880 | ) | ||||||||||||||||||||||
| Severance expense |
(4 | ) | (222 | ) | - | - | (445 | ) | (3,366 | ) | (68 | ) | - | - | (226 | ) | (3,879 | ) | ||||||||||||||||||||||||||
| Other operating expense |
(9,278 | ) | (9,343 | ) | (8,119 | ) | (7,816 | ) | (8,449 | ) | (7,627 | ) | (7,160 | ) | (6,176 | ) | (4,946 | ) | (26,740 | ) | (23,236 | ) | ||||||||||||||||||||||
| Total operating expenses |
(21,406 | ) | (22,282 | ) | (19,972 | ) | (19,670 | ) | (22,320 | ) | (24,430 | ) | (20,187 | ) | (18,425 | ) | (17,111 | ) | (63,660 | ) | (66,937 | ) | ||||||||||||||||||||||
| Other income (expense), net |
1,600 | - | - | (12,000 | ) | - | - | - | - | - | 1,600 | - | ||||||||||||||||||||||||||||||||
| Benefit from (provision for) income taxes |
(5,213 | ) | (333 | ) | 1,843 | (1,835 | ) | 4,935 | (3,140 | ) | (10,908 | ) | (176 | ) | (516 | ) | (3,703 | ) | (9,113 | ) | ||||||||||||||||||||||||
| Net income |
$ | 45,097 | $ | 16,017 | $ | 12,333 | $ | 25,134 | $ | 21,929 | $ | 65,573 | $ | 60,610 | $ | 42,078 | $ | 39,701 | $ | 73,447 | $ | 148,112 | ||||||||||||||||||||||
| Diluted average shares |
96,956 | 85,033 | 84,941 | 84,395 | 84,422 | 96,172 | 87,345 | 82,498 | 80,764 | 85,031 | 93,234 | |||||||||||||||||||||||||||||||||
| Net income per share |
$ | 0.50 | $ | 0.18 | $ | 0.14 | $ | 0.29 | $ | 0.25 | $ | 0.71 | $ | 0.69 | $ | 0.50 | $ | 0.48 | $ | 0.84 | $ | 1.65 | ||||||||||||||||||||||
| (1) | Interest expense on ABS issued for the fourth quarter of 2012 includes accelerated recognition of $11 million of deferred hedging costs relating to Acacia entities upon deconsolidation of these entities. |
| (2) | Realized gains on sales, net includes $15 million of gains related to the deconsolidation of certain Sequoia and Acacia entities during the fourth quarter of 2012. |
| THE REDWOOD REVIEW | 3RD QUARTER 2014 | Table 1: GAAP Earnings 51 |

|
Table 2: Taxable and GAAP Income (1) Differences and Dividends (in thousands, except per share data)
|
|||||||||||||||||||
|
Estimated Nine Months 2014 (2) |
Actual Twelve Months 2013 (2) | Actual Twelve Months 2012 (2) | ||||||||||||||||||||||||||||||||||
| |
Taxable Income |
|
|
GAAP Income |
|
Differences | |
Taxable Income |
|
|
GAAP Income |
|
Differences | |
Taxable Income |
|
|
GAAP Income |
|
Differences | ||||||||||||||||
| Taxable and GAAP Income Differences |
||||||||||||||||||||||||||||||||||||
| Interest income |
$ | 149,538 | $ | 176,820 | $ | (27,282 | ) | $ | 209,318 | $ | 226,156 | $ | (16,838 | ) | $ | 160,737 | $ | 231,384 | $ | (70,647 | ) | |||||||||||||||
| Interest expense |
(58,014 | ) | (63,560 | ) | 5,546 | (55,099 | ) | (80,971 | ) | 25,872 | (26,187 | ) | (120,705 | ) | 94,518 | |||||||||||||||||||||
| Net interest income |
91,524 | 113,260 | (21,736 | ) | 154,219 | 145,185 | 9,034 | 134,550 | 110,679 | 23,871 | ||||||||||||||||||||||||||
| Provision for loan losses |
- | 629 | (629 | ) | - | (4,737 | ) | 4,737 | - | (3,648 | ) | 3,648 | ||||||||||||||||||||||||
| Realized credit losses |
(5,186 | ) | - | (5,186 | ) | (12,911 | ) | - | (12,911 | ) | (25,609 | ) | - | (25,609 | ) | |||||||||||||||||||||
| Mortgage banking activities, net |
8,925 | 23,950 | (15,025 | ) | 17,708 | 100,676 | (82,968 | ) | - | 1,539 | (1,539 | ) | ||||||||||||||||||||||||
| MSR income, net |
10,855 | 4,650 | 6,205 | 8,218 | 20,309 | (12,091 | ) | (401 | ) | 36,319 | (36,720 | ) | ||||||||||||||||||||||||
| Other market valuation adjustments, net |
- | (13,966 | ) | 13,966 | - | (5,709 | ) | 5,709 | 623 | (1,391 | ) | 2,014 | ||||||||||||||||||||||||
| Operating expenses |
(64,258 | ) | (63,660 | ) | (598 | ) | (77,543 | ) | (84,789 | ) | 7,246 | (56,156 | ) | (65,359 | ) | 9,203 | ||||||||||||||||||||
| Other income (expense) |
- | 1,600 | (1,600 | ) | - | (12,000 | ) | 12,000 | - | - | - | |||||||||||||||||||||||||
| Realized gains, net |
- | 10,687 | (10,687 | ) | - | 25,259 | (25,259 | ) | - | 54,921 | (54,921 | ) | ||||||||||||||||||||||||
| (Provision for) benefit from income taxes |
(97 | ) | (3,703 | ) | 3,606 | (291 | ) | (10,948 | ) | 10,657 | (93 | ) | (1,291 | ) | 1,198 | |||||||||||||||||||||
| Income |
$ | 41,763 | $ | 73,447 | $ | (31,684 | ) | $ | 89,400 | $ | 173,246 | $ | (83,846 | ) | $ | 52,914 | $ | 131,769 | $ | (78,855 | ) | |||||||||||||||
| REIT taxable income |
$ | 47,497 | $ | 72,422 | $ | 60,541 | ||||||||||||||||||||||||||||||
| Taxable (loss) income at taxable subsidiaries |
(5,734 | ) | 16,978 | (7,627 | ) | |||||||||||||||||||||||||||||||
| Taxable income |
$ | 41,763 | $ | 89,400 | $ | 52,914 | ||||||||||||||||||||||||||||||
| Shares used for taxable EPS calculation |
83,284 | 82,505 | 81,716 | |||||||||||||||||||||||||||||||||
| REIT taxable income per share (3) |
$ | 0.57 | $ | 0.88 | $ | 0.75 | ||||||||||||||||||||||||||||||
| Taxable income (loss) per share at taxable subsidiaries |
$ | (0.07 | ) | $ | 0.21 | $ | (0.09 | ) | ||||||||||||||||||||||||||||
| Taxable income per share (3) |
$ | 0.50 | $ | 1.09 | $ | 0.66 | ||||||||||||||||||||||||||||||
| Dividends |
||||||||||||||||||||||||||||||||||||
| Dividends declared |
$ | 69,616 | $ | 92,005 | $ | 80,134 | ||||||||||||||||||||||||||||||
| Dividends per share (4) |
$ | 0.84 | $ | 1.12 | $ | 1.00 | ||||||||||||||||||||||||||||||
| (1) | Taxable income for 2014 is an estimate until we file our tax returns for this year. |
| (2) | Reconciliation of GAAP income to taxable income (loss) for prior quarters is provided in the respective Redwood Reviews for those quarters. |
| (3) | REIT taxable income per share and taxable income (loss) per share are based on the number of shares outstanding at the end of each quarter. The annual REIT taxable income per share and taxable income (loss) per share are the sum of the four quarterly per share estimates. |
| (4) | Dividends in 2013 were characterized as 89% ordinary income, or $82 million, and 11% return of capital, or $10 million. Dividends in 2012 were characterized as 77% ordinary income, or $62 million, and 23% return of capital, or $18 million. The portion of Redwood’s dividends characterized as a return of capital is not taxable to a shareholder and reduces a shareholder’s basis for shares held at each quarterly distribution date, but not to below $0. |
| THE REDWOOD REVIEW | 3RD QUARTER 2014 | Table 2: Taxable and GAAP Income Differences and Dividends 52 |
|
|
Table 3: Book Value and Financial Ratios ($ in millions, except per share data)
|
|||||||||||||||||
|
2014 Q3 |
2014 Q2 |
2014 Q1 |
2013 Q4 |
2013 Q3 |
2013 Q2 |
2013 Q1 |
2012 Q4 |
2012 Q3 |
||||||||||||||||||||||||||||
| Short-term debt |
$ | 1,888 | $ | 1,719 | $ | 1,288 | $ | 863 | $ | 838 | $ | 1,446 | $ | 721 | $ | 552 | $ | 522 | ||||||||||||||||||
| Long-term debt |
631 | 480 | 479 | 476 | 472 | 444 | 444 | 140 | 140 | |||||||||||||||||||||||||||
| Total debt at Redwood (1) |
$ | 2,519 | $ | 2,199 | $ | 1,767 | $ | 1,339 | $ | 1,310 | $ | 1,890 | $ | 1,165 | $ | 692 | $ | 662 | ||||||||||||||||||
| Long-term debt-Commercial secured borrowing |
66 | 67 | 35 | - | - | - | - | - | - | |||||||||||||||||||||||||||
| ABS issued at consolidated entities |
||||||||||||||||||||||||||||||||||||
| Residential Resecuritization ABS issued |
57 | 70 | 82 | 95 | 112 | 134 | 149 | 165 | 179 | |||||||||||||||||||||||||||
| Commercial Securitization ABS issued |
115 | 145 | 148 | 154 | 159 | 160 | 160 | 172 | - | |||||||||||||||||||||||||||
| Legacy Sequoia entities ABS issued |
1,485 | 1,554 | 1,624 | 1,694 | 1,791 | 1,921 | 2,056 | 2,193 | 2,995 | |||||||||||||||||||||||||||
| Legacy Acacia entities ABS issued |
- | - | - | - | - | - | - | - | 255 | |||||||||||||||||||||||||||
| Total ABS issued |
1,657 | 1,769 | 1,854 | 1,943 | 2,062 | 2,214 | 2,365 | 2,530 | 3,429 | |||||||||||||||||||||||||||
| Consolidated GAAP Debt |
$ | 4,242 | $ | 4,035 | $ | 3,656 | $ | 3,282 | $ | 3,372 | $ | 4,104 | $ | 3,529 | $ | 3,222 | $ | 4,091 | ||||||||||||||||||
| Stockholders’ equity |
$ | 1,267 | $ | 1,249 | $ | 1,251 | $ | 1,245 | $ | 1,207 | $ | 1,209 | $ | 1,188 | $ | 1,140 | $ | 1,050 | ||||||||||||||||||
| Debt at Redwood to stockholders’ equity |
2.0x | 1.8x | 1.4x | 1.1x | 1.1x | 1.6x | 1.0x | 0.6x | 0.6x | |||||||||||||||||||||||||||
| Consolidated GAAP debt to stockholders’ equity |
3.4x | 3.2x | 2.9x | 2.6x | 2.8x | 3.4x | 3.0x | 2.8x | 3.9x | |||||||||||||||||||||||||||
| Shares outstanding at period end (in thousands) |
83,284 | 83,080 | 82,620 | 82,505 | 82,389 | 82,332 | 81,706 | 81,716 | 81,526 | |||||||||||||||||||||||||||
| Book value per share |
$ | 15.21 | $ | 15.03 | $ | 15.14 | $ | 15.10 | $ | 14.65 | $ | 14.69 | $ | 14.54 | $ | 13.95 | $ | 12.88 | ||||||||||||||||||
| (1) | Excludes obligations of consolidated securitization entities, including legacy Sequoia securitizations completed prior to 2012, the residential resecuritization completed in 2011, and the commercial securitization completed in 2012. Also excludes commercial secured borrowings associated with commercial A-note loans sold that were treated as secured borrowings under GAAP. |
| THE REDWOOD REVIEW | 3RD QUARTER 2014 | Table 3: Book Value and Financial Ratios 53 |
|
|
Table 4: Yields and Profitability Ratios (1) ($ in thousands)
|
|||||||||||||||||||||||
|
2014 Q3 |
2014 Q2 |
2014 Q1 |
2013 Q4 |
2013 Q3 |
2013 Q2 |
2013 Q1 |
2012 Q4 |
2012 Q3 |
Nine Months 2014 |
Nine Months 2013 |
||||||||||||||||||||||||||||||||||
| Interest income |
$ | 63,351 | $ | 57,993 | $ | 55,476 | $ | 57,492 | $ | 57,420 | $ | 57,719 | $ | 53,525 | $ | 53,397 | $ | 59,723 | $ | 176,820 | $ | 168,664 | ||||||||||||||||||||||
| Average consolidated earning assets |
$ | 5,354,090 | $ | 4,883,555 | $ | 4,558,020 | $ | 4,482,980 | $ | 4,808,815 | $ | 4,858,695 | $ | 4,569,121 | $ | 4,856,538 | $ | 5,178,913 | $ | 4,934,804 | $ | 4,746,421 | ||||||||||||||||||||||
| Asset yield |
4.73 | % | 4.75 | % | 4.87 | % | 5.13 | % | 4.78 | % | 4.75 | % | 4.69 | % | 4.40 | % | 4.61 | % | 4.78 | % | 4.74 | % | ||||||||||||||||||||||
| Interest expense |
$ | (23,350 | ) | $ | (21,151 | ) | $ | (19,059 | ) | $ | (19,528 | ) | $ | (21,725 | ) | $ | (21,416 | ) | $ | (18,303 | ) | $ | (32,916 | ) | $ | (28,276 | ) | $ | (63,560 | ) | $ | (61,444 | ) | |||||||||||
| Average consolidated interest-bearing liabilities |
$ | 4,133,152 | $ | 3,654,609 | $ | 3,361,509 | $ | 3,333,438 | $ | 3,710,613 | $ | 3,747,078 | $ | 3,494,668 | $ | 3,727,576 | $ | 4,166,828 | $ | 3,719,249 | $ | 3,651,577 | ||||||||||||||||||||||
| Cost of funds |
2.26 | % | 2.31 | % | 2.27 | % | 2.34 | % | 2.34 | % | 2.29 | % | 2.09 | % | 3.53 | % | 2.71 | % | 2.28 | % | 2.24 | % | ||||||||||||||||||||||
| Asset yield |
4.73 | % | 4.75 | % | 4.87 | % | 5.13 | % | 4.78 | % | 4.75 | % | 4.69 | % | 4.40 | % | 4.61 | % | 4.78 | % | 4.74 | % | ||||||||||||||||||||||
| Cost of funds |
(2.26 | %) | (2.31 | %) | (2.27 | %) | (2.34 | %) | (2.34 | %) | (2.29 | %) | (2.09 | %) | (3.53 | %) | (2.71 | %) | (2.28 | %) | (2.24 | %) | ||||||||||||||||||||||
| Interest rate spread |
2.47 | % | 2.44 | % | 2.60 | % | 2.79 | % | 2.43 | % | 2.47 | % | 2.59 | % | 0.87 | % | 1.90 | % | 2.50 | % | 2.49 | % | ||||||||||||||||||||||
| Net interest income |
$ | 40,001 | $ | 36,842 | $ | 36,417 | $ | 37,964 | $ | 35,695 | $ | 36,303 | $ | 35,222 | $ | 20,481 | $ | 31,447 | $ | 113,260 | $ | 107,220 | ||||||||||||||||||||||
| Average consolidated earning assets |
$ | 5,354,090 | $ | 4,883,555 | $ | 4,558,020 | $ | 4,482,980 | $ | 4,808,815 | $ | 4,858,695 | $ | 4,569,121 | $ | 4,856,538 | $ | 5,178,913 | $ | 4,934,804 | $ | 4,746,421 | ||||||||||||||||||||||
| Net interest margin |
2.99 | % | 3.02 | % | 3.20 | % | 3.39 | % | 2.97 | % | 2.99 | % | 3.08 | % | 1.69 | % | 2.43 | % | 3.06 | % | 3.01 | % | ||||||||||||||||||||||
| Operating expenses |
$ | (21,406 | ) | $ | (22,282 | ) | $ | (19,972 | ) | $ | (19,670 | ) | $ | (22,320 | ) | $ | (24,430 | ) | $ | (20,187 | ) | $ | (18,425 | ) | $ | (17,111 | ) | $ | (63,660 | ) | $ | (66,937 | ) | |||||||||||
| Average total assets |
$ | 5,631,421 | $ | 5,140,932 | $ | 4,791,512 | $ | 4,681,988 | $ | 5,010,779 | $ | 5,103,812 | $ | 4,823,321 | $ | 5,090,253 | $ | 5,371,679 | $ | 5,191,031 | $ | 4,979,990 | ||||||||||||||||||||||
| Average total equity |
$ | 1,254,352 | $ | 1,245,346 | $ | 1,243,006 | $ | 1,217,273 | $ | 1,217,418 | $ | 1,204,807 | $ | 1,161,546 | $ | 1,088,565 | $ | 987,692 | $ | 1,247,610 | $ | 1,194,795 | ||||||||||||||||||||||
| Operating expenses / net interest income |
53.51 | % | 60.48 | % | 54.84 | % | 51.81 | % | 62.53 | % | 67.29 | % | 57.31 | % | 89.96 | % | 54.41 | % | 56.21 | % | 62.43 | % | ||||||||||||||||||||||
| Operating expenses / average total assets |
1.52 | % | 1.73 | % | 1.67 | % | 1.68 | % | 1.78 | % | 1.91 | % | 1.67 | % | 1.45 | % | 1.27 | % | 1.64 | % | 1.79 | % | ||||||||||||||||||||||
| Operating expenses / average total equity |
6.83 | % | 7.16 | % | 6.43 | % | 6.46 | % | 7.33 | % | 8.11 | % | 6.95 | % | 6.77 | % | 6.93 | % | 6.80 | % | 7.47 | % | ||||||||||||||||||||||
| GAAP net income |
$ | 45,097 | $ | 16,017 | $ | 12,333 | $ | 25,134 | $ | 21,929 | $ | 65,573 | $ | 60,610 | $ | 42,078 | $ | 39,701 | $ | 73,447 | $ | 148,112 | ||||||||||||||||||||||
| GAAP net income / average total assets |
3.20 | % | 1.25 | % | 1.03 | % | 2.15 | % | 1.75 | % | 5.14 | % | 5.03 | % | 3.31 | % | 2.96 | % | 1.89 | % | 3.97 | % | ||||||||||||||||||||||
| GAAP net income / average equity (GAAP ROE) |
14.38 | % | 5.14 | % | 3.97 | % | 8.26 | % | 7.21 | % | 21.77 | % | 20.87 | % | 15.46 | % | 16.08 | % | 7.85 | % | 16.53 | % | ||||||||||||||||||||||
| (1) | All percentages in this table are shown on an annualized basis. |
| THE REDWOOD REVIEW | 3RD QUARTER 2014 | Table 4: Yields and Profitability Ratios 54 |
|
|
Table 5: Average Balance Sheet ($ in thousands)
|
|||||||||||||||||||||||
|
2014 Q3 |
2014 Q2 |
2014 Q1 |
2013 Q4 |
2013 Q3 |
2013 Q2 |
2013 Q1 |
2012 Q4 |
2012 Q3 |
Nine Months 2014 |
Nine Months 2013 |
||||||||||||||||||||||||||||||||||
| Real estate assets |
||||||||||||||||||||||||||||||||||||||||||||
| Residential loans, held-for-sale, at fair value |
$ | 1,268,231 | $ | 739,934 | $ | 518,054 | $ | 554,467 | $ | 860,923 | $ | 1,060,347 | $ | 818,950 | $ | 418,722 | $ | 466,246 | $ | 844,820 | $ | 913,560 | ||||||||||||||||||||||
| Residential loans, held-for-investment(1) |
1,570,425 | 1,642,410 | 1,711,438 | 1,793,535 | 1,910,814 | 2,043,820 | 2,177,315 | 2,751,130 | 3,128,076 | 1,640,908 | 2,043,007 | |||||||||||||||||||||||||||||||||
| Residential loans, held-for-investment, at fair value |
100,409 | - | - | - | - | - | - | - | - | 33,837 | - | |||||||||||||||||||||||||||||||||
| Commercial loans, held-for-sale |
170,156 | 75,449 | 68,169 | 73,204 | 67,999 | 50,366 | 49,061 | 6,886 | - | 104,965 | 55,877 | |||||||||||||||||||||||||||||||||
| Commercial loans, held-for-investment, at fair value |
71,205 | 69,565 | 20,626 | - | - | - | - | - | - | 53,984 | - | |||||||||||||||||||||||||||||||||
| Commercial loans, held-for-investment, at amortized cost |
349,288 | 343,815 | 343,705 | 346,333 | 347,633 | 332,113 | 319,760 | 296,990 | 267,032 | 345,623 | 333,271 | |||||||||||||||||||||||||||||||||
| Senior residential securities |
||||||||||||||||||||||||||||||||||||||||||||
| Prime |
611,211 | 835,987 | 725,551 | 586,675 | 440,616 | 453,230 | 416,774 | 427,149 | 447,994 | 723,831 | 436,961 | |||||||||||||||||||||||||||||||||
| Non-prime |
169,741 | 171,033 | 174,811 | 178,994 | 187,724 | 227,295 | 235,583 | 243,336 | 236,006 | 171,843 | 216,692 | |||||||||||||||||||||||||||||||||
| Total senior residential securities |
780,952 | 1,007,020 | 900,362 | 765,669 | 628,340 | 680,525 | 652,357 | 670,485 | 684,000 | 895,674 | 653,653 | |||||||||||||||||||||||||||||||||
| Residential Re-REMIC securities |
114,433 | 115,746 | 109,753 | 102,836 | 101,808 | 100,824 | 99,769 | 99,088 | 99,890 | 113,328 | 100,808 | |||||||||||||||||||||||||||||||||
| Subordinate residential securities |
||||||||||||||||||||||||||||||||||||||||||||
| Prime |
532,881 | 530,273 | 509,906 | 492,708 | 440,235 | 320,490 | 218,477 | 153,223 | 118,549 | 524,438 | 327,213 | |||||||||||||||||||||||||||||||||
| Non-prime |
- | - | - | - | 1,286 | 2,051 | 2,064 | 3,783 | 6,669 | - | 1,797 | |||||||||||||||||||||||||||||||||
| Total subordinate residential securities |
532,881 | 530,273 | 509,906 | 492,708 | 441,521 | 322,541 | 220,541 | 157,006 | 125,218 | 524,438 | 329,010 | |||||||||||||||||||||||||||||||||
| Other Securities |
- | - | - | - | - | - | 766 | 2,158 | 4,061 | - | 253 | |||||||||||||||||||||||||||||||||
| Earning assets at Acacia |
- | - | - | - | - | - | - | 171,650 | 270,891 | - | - | |||||||||||||||||||||||||||||||||
| Mortgage servicing rights |
81,968 | 65,705 | 62,943 | 60,822 | 55,622 | 31,318 | 10,299 | 4,867 | 2,122 | 70,275 | 32,579 | |||||||||||||||||||||||||||||||||
| Total real estate assets |
5,039,948 | 4,589,917 | 4,244,956 | 4,189,574 | 4,414,660 | 4,621,854 | 4,348,818 | 4,578,982 | 5,047,536 | 4,627,852 | 4,462,018 | |||||||||||||||||||||||||||||||||
| Cash and cash equivalents |
151,447 | 131,557 | 159,089 | 167,453 | 274,657 | 96,998 | 77,911 | 177,555 | 86,531 | 147,336 | 150,576 | |||||||||||||||||||||||||||||||||
| Earning assets |
5,191,395 | 4,721,474 | 4,404,045 | 4,357,027 | 4,689,317 | 4,718,852 | 4,426,729 | 4,756,537 | 5,134,067 | 4,775,188 | 4,612,594 | |||||||||||||||||||||||||||||||||
| Balance sheet mark-to-market adjustments |
162,695 | 162,081 | 153,975 | 125,953 | 119,498 | 139,843 | 142,392 | 100,001 | 44,846 | 159,616 | 133,827 | |||||||||||||||||||||||||||||||||
| Earning assets-reported value |
5,354,090 | 4,883,555 | 4,558,020 | 4,482,980 | 4,808,815 | 4,858,695 | 4,569,121 | 4,856,538 | 5,178,913 | 4,934,804 | 4,746,421 | |||||||||||||||||||||||||||||||||
| Other assets |
277,331 | 257,377 | 233,492 | 199,008 | 201,964 | 245,117 | 254,200 | 233,715 | 192,766 | 256,227 | 233,569 | |||||||||||||||||||||||||||||||||
| Total assets |
$ | 5,631,421 | $ | 5,140,932 | $ | 4,791,512 | $ | 4,681,988 | $ | 5,010,779 | $ | 5,103,812 | $ | 4,823,321 | $ | 5,090,253 | $ | 5,371,679 | $ | 5,191,031 | $ | 4,979,990 | ||||||||||||||||||||||
| Short-term debt |
$ | 1,873,704 | $ | 1,329,568 | $ | 1,006,349 | $ | 893,481 | $ | 1,150,917 | $ | 1,053,610 | $ | 854,238 | $ | 539,579 | $ | 570,775 | $ | 1,406,384 | $ | 1,020,675 | ||||||||||||||||||||||
| Residential Resecuritization ABS issued |
60,932 | 73,617 | 85,236 | 99,940 | 118,338 | 138,817 | 153,487 | 168,634 | 182,702 | 73,173 | 136,752 | |||||||||||||||||||||||||||||||||
| Commercial Securitization ABS issued |
123,012 | 142,400 | 144,936 | 150,716 | 155,661 | 155,812 | 163,409 | 61,830 | - | 136,702 | 158,265 | |||||||||||||||||||||||||||||||||
| Consolidated Sequoia ABS issued |
1,507,998 | 1,577,888 | 1,644,626 | 1,722,583 | 1,835,401 | 1,965,149 | 2,099,041 | 2,661,564 | 3,039,273 | 1,576,337 | 1,965,565 | |||||||||||||||||||||||||||||||||
| Acacia ABS issued |
- | - | - | - | - | - | - | 154,617 | 235,789 | - | - | |||||||||||||||||||||||||||||||||
| Other liabilities |
243,917 | 240,977 | 186,997 | 131,277 | 82,748 | 151,927 | 167,107 | 274,112 | 217,159 | 224,172 | 133,618 | |||||||||||||||||||||||||||||||||
| Other long-term debt |
567,506 | 531,136 | 480,362 | 466,718 | 450,296 | 433,690 | 224,493 | 141,352 | 138,289 | 526,653 | 370,320 | |||||||||||||||||||||||||||||||||
| Total liabilities |
4,377,069 | 3,895,586 | 3,548,506 | 3,464,715 | 3,793,361 | 3,899,005 | 3,661,775 | 4,001,688 | 4,383,987 | 3,943,421 | 3,785,195 | |||||||||||||||||||||||||||||||||
| Total equity |
1,254,352 | 1,245,346 | 1,243,006 | 1,217,273 | 1,217,418 | 1,204,807 | 1,161,546 | 1,088,565 | 987,692 | 1,247,610 | 1,194,795 | |||||||||||||||||||||||||||||||||
| Total liabilities and equity |
$ | 5,631,421 | $ | 5,140,932 | $ | 4,791,512 | $ | 4,681,988 | $ | 5,010,779 | $ | 5,103,812 | $ | 4,823,321 | $ | 5,090,253 | $ | 5,371,679 | $ | 5,191,031 | $ | 4,979,990 | ||||||||||||||||||||||
| (1) | Residential loans, held-for-investment is comprised of loans held in consolidated Sequoia entities. |
| THE REDWOOD REVIEW | 3RD QUARTER 2014 | Table 5: Average Balance Sheet 55 |
|
|
Table 6: Balances & Yields by Securities Portfolio(1) ($ in thousands)
|
|||||||||||||||||||||||
| 2014 Q3 |
2014 Q2 |
2014 Q1 |
2013 Q4 |
2013 Q3 |
2013 Q2 |
2014 Q3 |
2014 Q2 |
2014 Q1 |
2013 Q4 |
2013 Q3 |
2013 Q2 |
|||||||||||||||||||||||||||||||||||||||||
| Residential Prime Senior |
|
Residential Prime Subordinate | ||||||||||||||||||||||||||||||||||||||||||||||||||
| Principal balance |
$ | 366,122 | $ | 772,127 | $ | 703,977 | $ | 670,051 | $ | 379,598 | $ | 435,536 | Principal balance | $ | 693,770 | $ | 721,267 | $ | 700,081 | $ | 709,629 | $ | 664,597 | $ | 536,235 | |||||||||||||||||||||||||||
| Unamortized discount |
(41,242 | ) | (36,853 | ) | (42,255 | ) | (44,133 | ) | (47,000 | ) | (42,520 | ) | Unamortized discount | (143,184 | ) | (139,890 | ) | (135,877 | ) | (136,643 | ) | (122,631 | ) | (84,645 | ) | |||||||||||||||||||||||||||
| Credit reserve |
(4,082 | ) | (5,476 | ) | (6,815 | ) | (10,144 | ) | (12,964 | ) | (32,068 | ) | Credit reserve | (42,662 | ) | (49,597 | ) | (55,874 | ) | (61,643 | ) | (76,080 | ) | (90,799 | ) | |||||||||||||||||||||||||||
| Unrealized gains, net |
41,307 | 44,329 | 44,879 | 46,532 | 44,188 | 49,211 | Unrealized gains, net | 57,099 | 48,598 | 34,377 | 19,526 | 16,778 | 20,936 | |||||||||||||||||||||||||||||||||||||||
| Interest-only securities |
97,321 | 96,894 | 106,228 | 110,505 | 117,443 | 123,591 | Interest-only securities | 289 | 279 | 194 | 206 | 252 | 258 | |||||||||||||||||||||||||||||||||||||||
| Fair value |
$ | 459,426 | $ | 871,021 | $ | 806,014 | $ | 772,811 | $ | 481,265 | $ | 533,750 | Fair value | $ | 565,312 | $ | 580,657 | $ | 542,901 | $ | 531,075 | $ | 482,916 | $ | 381,985 | |||||||||||||||||||||||||||
| Average amortized cost |
$ | 611,211 | $ | 835,987 | $ | 725,551 | $ | 586,675 | $ | 440,616 | $ | 453,230 | Mezzanine | |||||||||||||||||||||||||||||||||||||||
| Interest income |
$ | 13,229 | $ | 15,080 | $ | 14,640 | $ | 13,230 | $ | 12,639 | $ | 12,341 | Average amortized cost | $ | 421,111 | $ | 415,418 | $ | 399,134 | $ | 382,348 | $ | 336,781 | $ | 239,118 | |||||||||||||||||||||||||||
| Annualized yield |
8.66 | % | 7.22 | % | 8.07 | % | 9.02 | % | 11.47 | % | 10.89 | % | Interest income | $ | 5,308 | $ | 5,325 | $ | 5,127 | $ | 4,810 | $ | 4,153 | $ | 3,010 | |||||||||||||||||||||||||||
| Annualized yield | 5.04 | % | 5.13 | % | 5.14 | % | 5.03 | % | 4.93 | % | 5.04 | % | ||||||||||||||||||||||||||||||||||||||||
| Residential Non-Prime Senior |
|
|||||||||||||||||||||||||||||||||||||||||||||||||||
| Principal balance |
$ | 202,811 | $ | 209,967 | $ | 212,629 | $ | 218,603 | $ | 225,649 | $ | 259,524 | Subordinate | |||||||||||||||||||||||||||||||||||||||
| Unamortized discount |
(33,675 | ) | (36,387 | ) | (36,867 | ) | (36,882 | ) | (40,243 | ) | (39,030 | ) | Average amortized cost | $ | 111,770 | $ | 114,855 | $ | 110,772 | $ | 110,360 | $ | 103,454 | $ | 81,372 | |||||||||||||||||||||||||||
| Credit reserve |
(9,894 | ) | (9,697 | ) | (11,625 | ) | (13,840 | ) | (12,813 | ) | (18,078 | ) | Interest income | $ | 4,101 | $ | 4,082 | $ | 4,140 | $ | 4,535 | $ | 4,370 | $ | 3,938 | |||||||||||||||||||||||||||
| Unrealized gains, net |
26,980 | 28,373 | 28,860 | 25,505 | 22,561 | 22,271 | Annualized yield | 14.68 | % | 14.22 | % | 14.95 | % | 16.44 | % | 16.90 | % | 19.36 | % | |||||||||||||||||||||||||||||||||
| Interest-only securities |
7,758 | 8,380 | 8,729 | 9,070 | 8,864 | 17,525 | ||||||||||||||||||||||||||||||||||||||||||||||
| Fair value |
$ | 193,980 | $ | 200,636 | $ | 201,726 | $ | 202,456 | $ | 204,018 | $ | 242,212 | Residential Non-Prime Subordinate | |||||||||||||||||||||||||||||||||||||||
| Principal balance | $ | 11,891 | $ | 11,925 | $ | 11,991 | $ | 12,021 | $ | 12,054 | $ | 19,294 | ||||||||||||||||||||||||||||||||||||||||
| Average amortized cost |
$ | 169,741 | $ | 171,033 | $ | 174,811 | $ | 178,994 | $ | 187,724 | $ | 227,296 | Unamortized discount | (11,207 | ) | (11,207 | ) | (11,207 | ) | (11,207 | ) | (11,240 | ) | (11,982 | ) | |||||||||||||||||||||||||||
| Interest income |
$ | 4,507 | $ | 4,404 | $ | 4,388 | $ | 4,589 | $ | 4,789 | $ | 5,825 | Credit reserve | (684 | ) | (718 | ) | (784 | ) | (814 | ) | (814 | ) | (5,270 | ) | |||||||||||||||||||||||||||
| Annualized yield |
10.62 | % | 10.30 | % | 10.04 | % | 10.26 | % | 10.20 | % | 10.25 | % | Unrealized gains, net | 150 | 157 | 159 | 143 | 133 | 149 | |||||||||||||||||||||||||||||||||
| Fair value | $ | 150 | $ | 157 | $ | 159 | $ | 143 | $ | 133 | $ | 2,191 | ||||||||||||||||||||||||||||||||||||||||
| Residential Re-REMIC |
|
|||||||||||||||||||||||||||||||||||||||||||||||||||
| Principal balance |
$ | 206,212 | $ | 223,389 | $ | 223,709 | $ | 214,046 | $ | 214,660 | $ | 215,169 | Average amortized cost | $ | - | $ | - | $ | - | $ | - | $ | 1,286 | $ | 2,051 | |||||||||||||||||||||||||||
| Unamortized discount |
(80,986 | ) | (89,089 | ) | (87,910 | ) | (80,188 | ) | (78,789 | ) | (69,590 | ) | Interest income | $ | 34 | $ | 49 | $ | 39 | $ | 40 | $ | 124 | $ | 165 | |||||||||||||||||||||||||||
| Credit reserve |
(16,553 | ) | (17,788 | ) | (20,590 | ) | (30,429 | ) | (33,621 | ) | (44,195 | ) | Annualized yield | N/A | N/A | N/A | N/A | 38.57 | % | 32.18 | % | |||||||||||||||||||||||||||||||
| Unrealized gains, net |
67,444 | 76,084 | 76,999 | 72,947 | 54,096 | 52,783 | ||||||||||||||||||||||||||||||||||||||||||||||
| Fair value |
$ | 176,117 | $ | 192,596 | $ | 192,208 | $ | 176,376 | $ | 156,346 | $ | 154,167 | ||||||||||||||||||||||||||||||||||||||||
| Average amortized cost |
$ | 114,433 | $ | 115,746 | $ | 109,753 | $ | 102,836 | $ | 101,808 | $ | 100,824 | ||||||||||||||||||||||||||||||||||||||||
| Interest income |
$ | 4,278 | $ | 4,231 | $ | 4,096 | $ | 3,883 | $ | 3,574 | $ | 3,835 | ||||||||||||||||||||||||||||||||||||||||
| Annualized yield |
14.95 | % | 14.62 | % | 14.93 | % | 15.10 | % | 14.04 | % | 15.21 | % | ||||||||||||||||||||||||||||||||||||||||
| (1) | Annualized yields for AFS portfolios are based on average amortized cost. Cash flows from many of our subordinate securities can be volatile and in certain cases (e.g., when the fair value of certain securities are close to zero) any interest income earned can result in unusually high reported yields that are not sustainable and not necessarily meaningful. |
| THE REDWOOD REVIEW | 3RD QUARTER 2014 | Table 6: Balances & Yields by Securities Portfolio 56 |
|
|
Table 7: Securities and Loans Portfolio Activity ($ in thousands)
|
|||||||||||||||||||||||
| 2014 Q3 |
2014 Q2 |
2014 Q1 |
2013 Q4 |
2013 Q3 |
2013 Q2 |
2014 Q3 |
2014 Q2 |
2014 Q1 |
2013 Q4 |
2013 Q3 |
2013 Q2 |
|||||||||||||||||||||||||||||||||||||||||
| Residential Prime Senior |
|
Residential Loans at Redwood | ||||||||||||||||||||||||||||||||||||||||||||||||||
| Beginning fair value |
$ | 871,021 | $ | 806,014 | $ | 772,811 | $ | 481,265 | $ | 533,750 | $ | 502,603 | Beginning carrying value | $ | 1,107,877 | $ | 774,936 | $ | 404,267 | $ | 727,879 | $ | 1,221,098 | $ | 831,953 | |||||||||||||||||||||||||||
| Acquisitions |
3,522 | 111,520 | 63,889 | 318,983 | 112,644 | 40,642 | Acquisitions | 3,388,328 | 1,790,909 | 1,092,971 | 658,806 | 1,294,372 | 2,567,426 | |||||||||||||||||||||||||||||||||||||||
| Sales |
(380,112 | ) | (321 | ) | - | (13,036 | ) | (137,807 | ) | (8,677 | ) | Sales | (2,757,955 | ) | (1,466,955 | ) | (722,403 | ) | (979,661 | ) | (1,771,726 | ) | (2,135,166 | ) | ||||||||||||||||||||||||||||
| Effect of principal payments |
(34,879 | ) | (41,144 | ) | (29,307 | ) | (26,055 | ) | (24,159 | ) | (24,019 | ) | Principal repayments | (9,779 | ) | (5,006 | ) | (7,025 | ) | (9,511 | ) | (4,190 | ) | (1,768 | ) | |||||||||||||||||||||||||||
| Change in fair value, net |
(126 | ) | (5,048 | ) | (1,379 | ) | 11,654 | (3,163 | ) | 23,201 | Changes in fair value, net | 12,609 | 13,993 | 7,126 | 6,754 | (11,675 | ) | (41,347 | ) | |||||||||||||||||||||||||||||||||
| Ending fair value |
$ | 459,426 | $ | 871,021 | $ | 806,014 | $ | 772,811 | $ | 481,265 | $ | 533,750 | Ending fair value | $ | 1,741,080 | $ | 1,107,877 | $ | 774,936 | $ | 404,267 | $ | 727,879 | $ | 1,221,098 | |||||||||||||||||||||||||||
| Residential Non-Prime Senior |
|
Residential Loans at Consolidated Sequoia Entities | ||||||||||||||||||||||||||||||||||||||||||||||||||
| Beginning fair value |
$ | 200,636 | $ | 201,726 | $ | 202,456 | $ | 204,018 | $ | 242,212 | $ | 262,006 | Beginning carrying value | $ | 1,616,504 | $ | 1,689,994 | $ | 1,762,167 | $ | 1,864,652 | $ | 1,998,177 | $ | 2,133,254 | |||||||||||||||||||||||||||
| Acquisitions |
(31 | ) | 3,613 | - | - | - | - | Principal repayments | (67,025 | ) | (71,903 | ) | (70,649 | ) | (97,231 | ) | (130,766 | ) | (136,179 | ) | ||||||||||||||||||||||||||||||||
| Sales |
- | - | - | - | (31,725 | ) | - | Charge-Offs | 1,354 | 994 | 484 | 1,163 | 818 | 1,750 | ||||||||||||||||||||||||||||||||||||||
| Effect of principal payments |
(6,495 | ) | (5,593 | ) | (5,294 | ) | (6,145 | ) | (7,969 | ) | (8,397 | ) | Transfers to REO | (3,988 | ) | (2,094 | ) | (267 | ) | (1,692 | ) | (1,052 | ) | (3,046 | ) | |||||||||||||||||||||||||||
| Change in fair value, net |
(130 | ) | 890 | 4,564 | 4,583 | 1,500 | (11,397 | ) | Loan loss (provision) reversal | 708 | 605 | (628 | ) | (3,374 | ) | (883 | ) | 4,163 | ||||||||||||||||||||||||||||||||||
| Ending fair value |
$ | 193,980 | $ | 200,636 | $ | 201,726 | $ | 202,456 | $ | 204,018 | $ | 242,212 | Discount amortization, net | (1,046 | ) | (1,092 | ) | (1,113 | ) | (1,351 | ) | (1,642 | ) | (1,765 | ) | |||||||||||||||||||||||||||
| Ending carrying value | $ | 1,546,507 | $ | 1,616,504 | $ | 1,689,994 | $ | 1,762,167 | $ | 1,864,652 | $ | 1,998,177 | ||||||||||||||||||||||||||||||||||||||||
| Residential Re-REMIC |
|
|||||||||||||||||||||||||||||||||||||||||||||||||||
| Beginning fair value |
$ | 192,596 | $ | 192,208 | $ | 176,376 | $ | 156,346 | $ | 154,167 | $ | 163,437 | Commercial Loans—HFS | |||||||||||||||||||||||||||||||||||||||
| Acquisitions |
- | - | 10,200 | - | - | - | Beginning carrying value | $ | 50,848 | $ | 77,155 | $ | 89,111 | $ | 27,413 | $ | 149,470 | $ | 73,780 | |||||||||||||||||||||||||||||||||
| Sales |
(9,458 | ) | - | - | - | - | - | Originations | 340,200 | 148,915 | 88,415 | 242,345 | 112,991 | 149,815 | ||||||||||||||||||||||||||||||||||||||
| Effect of principal payments |
- | - | - | - | - | - | Sales | (290,561 | ) | (180,652 | ) | (65,336 | ) | (186,443 | ) | (238,102 | ) | (73,780 | ) | |||||||||||||||||||||||||||||||||
| Change in fair value, net |
(7,021 | ) | 388 | 5,632 | 20,030 | 2,179 | (9,270 | ) | Principal repayments | (83 | ) | (83 | ) | (87 | ) | (72 | ) | (109 | ) | - | ||||||||||||||||||||||||||||||||
| Ending fair value |
$ | 176,117 | $ | 192,596 | $ | 192,208 | $ | 176,376 | $ | 156,346 | $ | 154,167 | Transfers to HFI | - | - | (37,631 | ) | - | - | - | ||||||||||||||||||||||||||||||||
| Changes in fair value, net | 4,305 | 5,513 | 2,683 | 5,868 | 3,163 | (345 | ) | |||||||||||||||||||||||||||||||||||||||||||||
| Residential Prime Subordinate |
|
Ending carrying value | $ | 104,709 | $ | 50,848 | $ | 77,155 | $ | 89,111 | $ | 27,413 | $ | 149,470 | ||||||||||||||||||||||||||||||||||||||
| Beginning fair value |
$ | 580,657 | $ | 542,901 | $ | 531,075 | $ | 482,916 | $ | 381,985 | $ | 300,041 | ||||||||||||||||||||||||||||||||||||||||
| Acquisitions |
39,330 | 26,361 | - | 49,437 | 110,213 | 92,368 | Commercial Loans—HFI | |||||||||||||||||||||||||||||||||||||||||||||
| Sales |
(58,273 | ) | - | - | (1,095 | ) | - | - | Beginning carrying value | $ | 417,918 | $ | 414,120 | $ | 343,344 | $ | 352,440 | $ | 345,354 | $ | 327,658 | |||||||||||||||||||||||||||||||
| Effect of principal payments |
(5,075 | ) | (4,587 | ) | (3,351 | ) | (4,409 | ) | (5,481 | ) | (4,549 | ) | Originations | 26,140 | 5,993 | 32,998 | 2,700 | 8,532 | 18,550 | |||||||||||||||||||||||||||||||||
| Change in fair value, net |
8,673 | 15,982 | 15,177 | 4,226 | (3,801 | ) | (5,875 | ) | Sales | - | - | - | - | - | - | |||||||||||||||||||||||||||||||||||||
| Ending fair value |
$ | 565,312 | $ | 580,657 | $ | 542,901 | $ | 531,075 | $ | 482,916 | $ | 381,985 | Principal repayments | (51,422 | ) | (4,017 | ) | (284 | ) | (11,128 | ) | (740 | ) | (100 | ) | |||||||||||||||||||||||||||
| Transfers from HFS | - | 37,631 | ||||||||||||||||||||||||||||||||||||||||||||||||||
| Residential Non-Prime Subordinate |
|
Provision for loan losses | 888 | (289 | ) | (655 | ) | (869 | ) | (844 | ) | (891 | ) | |||||||||||||||||||||||||||||||||||||||
| Beginning fair value |
$ | 157 | $ | 159 | $ | 143 | $ | 133 | $ | 2,191 | $ | 2,441 | Discount/fee amortization | 184 | 152 | 145 | 201 | 138 | 136 | |||||||||||||||||||||||||||||||||
| Acquisitions |
- | - | - | - | - | - | Changes in fair value, net | (420 | ) | 1,959 | 941 | - | - | - | ||||||||||||||||||||||||||||||||||||||
| Sales |
- | - | - | - | (2,185 | ) | - | Ending carrying value | $ | 393,288 | $ | 417,918 | $ | 414,120 | $ | 343,344 | $ | 352,440 | $ | 345,353 | ||||||||||||||||||||||||||||||||
| Effect of principal payments |
(7 | ) | (9 | ) | (5 | ) | (5 | ) | (16 | ) | (14 | ) | ||||||||||||||||||||||||||||||||||||||||
| Change in fair value, net |
- | 7 | 21 | 15 | 143 | (236 | ) | |||||||||||||||||||||||||||||||||||||||||||||
| Ending fair value |
$ | 150 | $ | 157 | $ | 159 | $ | 143 | $ | 133 | $ | 2,191 | ||||||||||||||||||||||||||||||||||||||||
| THE REDWOOD REVIEW | 3RD QUARTER 2014 | Table 7: Securities and Loans Portfolio Activity 57 |
REDWOOD TRUST CORPORATE INFORMATION
For more information about Redwood Trust, visit our website at www.redwoodtrust.com