Attached files
| file | filename |
|---|---|
| EX-99.1 - PRESS RELEASE - PNMAC Holdings, Inc. | pfs_ex9901.htm |
| 8-K - FORM 8-K - PNMAC Holdings, Inc. | pennymacfinancial_8k.htm |
Exhibit 99.2

Third Quarter 2014 Earnings Report
| 1 |
Forward - Looking Statements 2 This presentation contains forward - looking statements within the meaning of Section 21 E of the Securities Exchange Act of 1934 , as amended, regarding management’s beliefs, estimates, projections and assumptions with respect to, among other things, the Company’s financial results, future operations, business plans and investment strategies, as well as industry and market conditions, all of which are subject to change . Words like “believe,” “expect,” “anticipate,” “promise,” “plan,” and other expressions or words of similar meanings, as well as future or conditional verbs such as “will,” “would,” “should,” “could,” or “may” are generally intended to identify forward - looking statements . Actual results and operations for any future period may vary materially from those projected herein, from past results discussed herein, or from illustrative examples provided herein . Factors which could cause actual results to differ materially from historical results or those anticipated include, but are not limited to : changes in federal, state and local laws and regulations applicable to the highly regulated industry in which we operate ; lawsuits or governmental actions if we do not comply with the laws and regulations applicable to our businesses ; the creation of the Consumer Financial Protection Bureau, or CFPB, and enforcement of its rules ; changes in existing U . S . government - sponsored entities, their current roles or their guarantees or guidelines ; changes to government mortgage modification programs ; the licensing and operational requirements of states and other jurisdictions applicable to our businesses, to which our bank competitors are not subject ; foreclosure delays and changes in foreclosure practices ; certain banking regulations that may limit our business activities ; changes in macroeconomic and U . S . residential real estate market conditions ; difficulties in growing loan production volume ; changes in prevailing interest rates ; increases in loan delinquencies and defaults ; our reliance on PennyMac Mortgage Investment Trust as a significant source of financing for, and revenue related to, our correspondent lending business ; availability of required additional capital and liquidity to support business growth ; our obligation to indemnify third - party purchasers or repurchase loans that we originate, acquire or assist in with fulfillment ; our obligation to indemnify advised entities or investment funds to meet certain criteria or characteristics or under other circumstances ; decreases in the historical returns on the assets that we select and manage for our clients, and our resulting management and incentive fees ; regulation applicable to our investment management segment ; conflicts of interest in allocating our services and investment opportunities among ourselves and our advised entities ; the potential damage to our reputation and adverse impact to our business resulting from ongoing negative publicity ; and our rapid growth . You should not place undue reliance on any forward - looking statement and should consider all of the uncertainties and risks described above, as well as those more fully discussed in reports and other documents filed by the Company with the Securities and Exchange Commission from time to time . The Company undertakes no obligation to publicly update or revise any forward - looking statements or any other information contained herein, and the statements made in this presentation are current as of the date of this presentation only .
| 2 |

Third Quarter Highlights 3 Record earnings driven by continued revenue growth, enabled by PFSI’s operational foundation ▪ Pretax income of $62.7 million; diluted earnings per common share of $0.49 – Strong pretax earnings contributions from each of PFSI’s segments: Production: $39.1 million; Servicing: $17.4 million; Investment Management: $6.2 million ▪ Loan production totaled $8.6 billion in UPB, driven by an improved origination market and share gains in consumer d irect originations – Revenue of $71.6 million, up 12% from 2Q14, with a strong and growing contribution from consumer direct – Correspondent production was $8.1 billion, up 15% from 2Q14 ; c onsumer d irect originations were $527 million, up 31% from 2Q14 ▪ Servicing portfolio grew to $100.1 billion in UPB, up 7 % from June 30, 2014 – Revenue of $55.7 million, up 4% from 2Q14 – Continued organic growth resulting from loan production, supplemented by mini - bulk and flow acquisitions of MSRs totaling $1.6 billion in UPB – Expect further economies of scale with the core management and infrastructure in place to grow in today’s market and regulatory environment ▪ Net assets under management declined modestly to $2.02 billion from $2.14 billion at June 30, 2014 – Revenue of $13.3 million, up 4% from 2Q14, driven by higher performance incentive fees and carried interest
| 3 |

$87 $90 $105 $130 $141 $0 $30 $60 $90 $120 $150 3Q13 4Q13 1Q14 2Q14 3Q14 $0.28 $0.32 $0.38 $0.45 $0.49 $0.00 $0.15 $0.30 $0.45 $0.60 3Q13 4Q13 1Q14 2Q14 3Q14 Top - Line Growth Drives Continued Increase in PFSI Earnings ▪ These trends reflect organic growth that is enabled by PFSI’s solid operational platform and is not dependent on large bulk acquisitions that are opportunistic ▪ Diversified sources of revenue include Loan Servicing and Investment Management, which are mostly recurring fees and growing components of PFSI’s business model ▪ Significant and increasing contribution from consumer d irect production Total Net Revenue ($ in millions) 4 Earnings per Share Ŷ Loan production Ŷ Loan servicing Ŷ Investment Management Ŷ Other
| 4 |
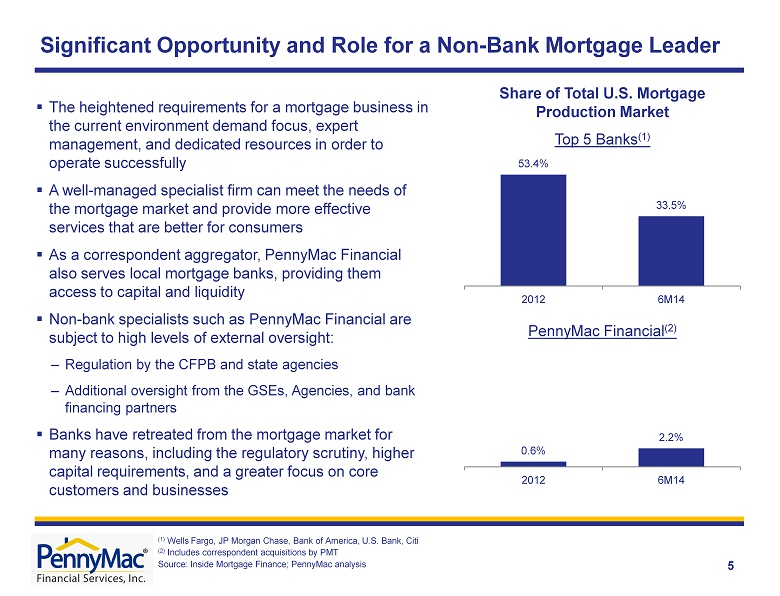
Significant Opportunity and Role for a Non - Bank Mortgage Leader 5 Share of Total U.S. Mortgage Production Market (1) Wells Fargo, JP Morgan Chase, Bank of America, U.S. Bank, Citi (2) Includes correspondent acquisitions by PMT Source: Inside Mortgage Finance; PennyMac analysis Top 5 Banks (1) PennyMac Financial (2) 0.6% 2.2% 2012 6M14 53.4% 33.5% 2012 6M14 ▪ The heightened requirements for a mortgage business in the current environment demand focus, expert management, and dedicated resources in order to operate successfully ▪ A well - managed specialist firm can meet the needs of the mortgage market and provide more effective services that are better for consumers ▪ As a correspondent aggregator, PennyMac Financial also serves local mortgage banks, providing them access to capital and liquidity ▪ Non - bank specialists such as PennyMac Financial are subject to high levels of external oversight: ‒ Regulation by the CFPB and state agencies ‒ Additional oversight from the GSEs, Agencies, and bank financing partners ▪ Banks have retreated from the mortgage market for many reasons, including the regulatory scrutiny, higher capital requirements, and a greater focus on core customers and businesses
| 5 |
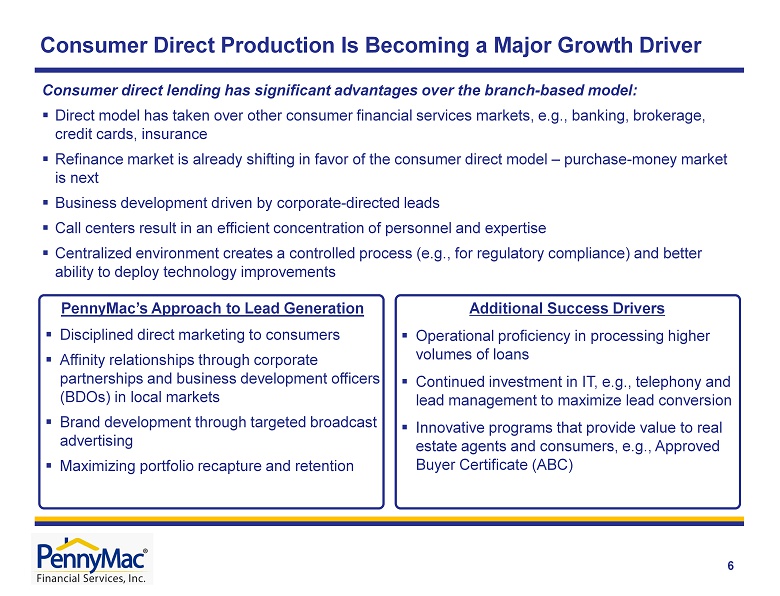
Consumer Direct Production Is Becoming a Major Growth Driver 6 Consumer direct lending has significant advantages over the branch - based model: ▪ Direct model has taken over other consumer financial services markets, e.g., banking, brokerage, credit cards, insurance ▪ Refinance market is already shifting in favor of the consumer direct model – purchase - money market is next ▪ Business development driven by corporate - directed leads ▪ Call centers result in an efficient concentration of personnel and expertise ▪ Centralized environment creates a controlled process (e.g., for regulatory compliance) and better ability to deploy technology improvements PennyMac’s Approach to Lead Generation ▪ Disciplined direct marketing to consumers ▪ Affinity relationships through corporate partnerships and business development officers (BDOs) in local markets ▪ Brand development through targeted broadcast advertising ▪ Maximizing portfolio recapture and retention Additional Success Drivers ▪ Operational proficiency in processing higher volumes of loans ▪ Continued investment in IT, e.g., telephony and lead management to maximize lead conversion ▪ Innovative programs that provide value to real estate agents and consumers, e.g., Approved Buyer Certificate (ABC)
| 6 |
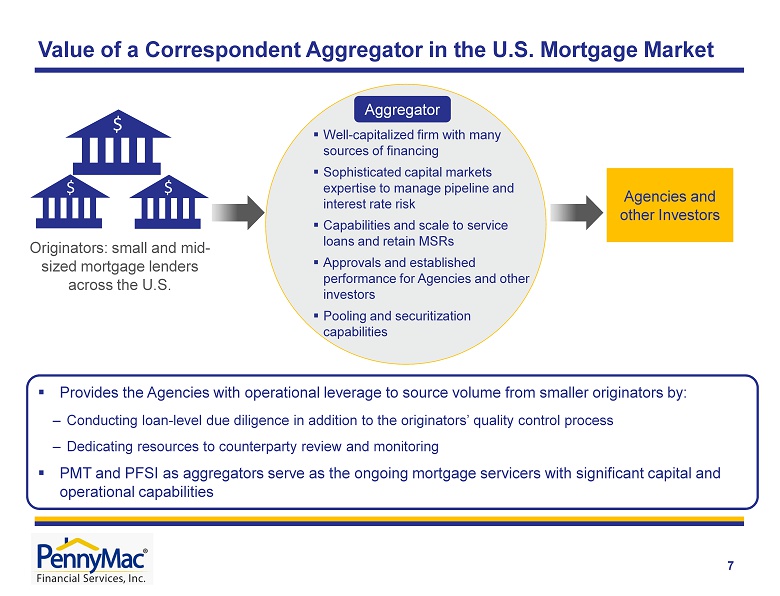
Originators: small and mid - sized mortgage lenders across the U.S. Agencies and other Investors ▪ Provides the Agencies with operational leverage to source volume from smaller originators by: ‒ Conducting loan - level due diligence in addition to the originators’ quality control process ‒ Dedicating resources to counterparty review and monitoring ▪ PMT and PFSI as aggregators serve as the ongoing mortgage servicers with significant capital and operational capabilities 7 Value of a Correspondent Aggregator in the U.S. Mortgage Market ▪ Well - capitalized firm with many sources of financing ▪ Sophisticated capital markets expertise to manage pipeline and interest rate risk ▪ Capabilities and scale to service loans and retain MSRs ▪ Approvals and established performance for Agencies and other investors ▪ Pooling and securitization capabilities Aggregator $ $ $
| 7 |

Current Market Environment and Outlook 8 1.0% 1.5% 2.0% 2.5% 3.0% 3.5% 4.0% 4.5% 5.0% 2000 2001 2002 2003 2004 2005 2006 2007 2008 2009 2010 2011 2012 2013 2014 3.98% 3.0% 3.5% 4.0% 4.5% 5.0% 01/13 04/13 07/13 10/13 01/14 04/14 07/14 10/14 Average 30 - year fixed rate mortgage (1) Home Inventory (2) as a Percentage of Households • Interest rates have remained low, driven by global economic weakness and geopolitical concerns ‒ Mortgage rates remain very low in a historical context ‒ Continue to aid refinance activity • While home price appreciation has moderated, improving values across the U.S. are expected to continue ‒ Supply of available homes remains historically low; new construction has not kept pace with household formation ‒ Improving U.S. economic conditions (employment, wages in key demographic cohorts) will be a positive contributor • The prime jumbo market has begun to improve relative to the first half of 2014 • Increasing emphasis by FHFA (as regulator of Fannie Mae and Freddie Mac) and the FHA on expanding the availability of mortgage credit • Continued scrutiny of nonbank mortgage companies, with concerns that they have adequate capital, capabilities, and governance systems (1) Source: Freddie Mac Primary Mortgage Market Survey. 3.98% as of 10/30/14. (2) Inventory of new and existing homes; Source : Census Bureau, National Association of Realtors, PennyMac analysis
| 8 |
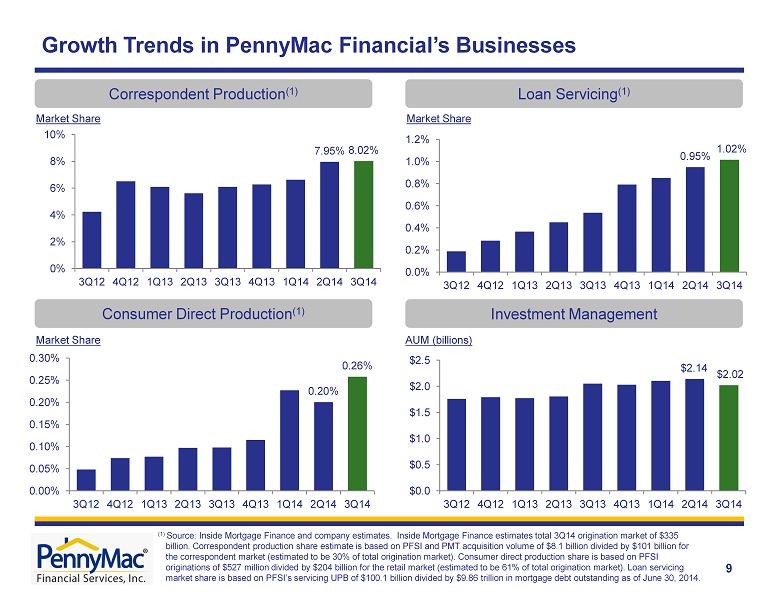
7.95% 8.02% 0% 2% 4% 6% 8% 10% 3Q12 4Q12 1Q13 2Q13 3Q13 4Q13 1Q14 2Q14 3Q14 Growth Trends in PennyMac Financial’s Businesses Correspondent Production (1) Market Share 0.20% 0.26% 0.00% 0.05% 0.10% 0.15% 0.20% 0.25% 0.30% 3Q12 4Q12 1Q13 2Q13 3Q13 4Q13 1Q14 2Q14 3Q14 Market Share Consumer Direct Production (1 ) $2.14 $2.02 $0.0 $0.5 $1.0 $1.5 $2.0 $2.5 3Q12 4Q12 1Q13 2Q13 3Q13 4Q13 1Q14 2Q14 3Q14 0.95% 1.02% 0.0% 0.2% 0.4% 0.6% 0.8% 1.0% 1.2% 3Q12 4Q12 1Q13 2Q13 3Q13 4Q13 1Q14 2Q14 3Q14 Loan Servicing (1) Market Share Investment Management AUM (billions) 9 (1) Source : Inside Mortgage Finance and company estimates. Inside Mortgage Finance estimates total 3Q14 origination market of $335 billion. Correspondent production share estimate is based on PFSI and PMT acquisition volume of $8.1 billion divided by $101 bil lion for the correspondent market (estimated to be 30% of total origination market). Consumer direct production share is based on PFSI originations of $527 million divided by $204 billion for the retail market (estimated to be 61% of total origination market). Lo an servicing market share is based on PFSI’s servicing UPB of $100.1 billion divided by $9.86 trillion in mortgage debt outstanding as of Jun e 30, 2014.
| 9 |
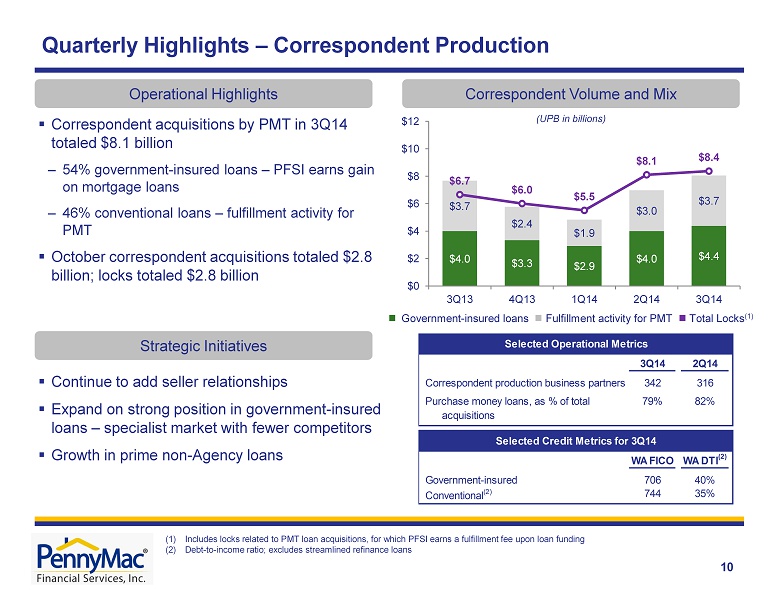
Correspondent production business partners Government-insured Conventional (2) Purchase money loans, as % of total 79% 82% acquisitions 706 40% Selected Credit Metrics for 3Q14 WA FICO WA DTI (2) 744 35% Selected Operational Metrics 3Q14 2Q14 342 316 $4.0 $3.3 $2.9 $4.0 $4.4 $3.7 $2.4 $1.9 $3.0 $3.7 $6.7 $6.0 $5.5 $8.1 $8.4 $0 $2 $4 $6 $8 $10 $12 3Q13 4Q13 1Q14 2Q14 3Q14 10 (UPB in billions) ▪ Correspondent acquisitions by PMT in 3 Q14 totaled $8.1 billion – 54% government - insured loans – PFSI earns gain on mortgage loans – 46% conventional loans – fulfillment activity for PMT ▪ October correspondent acquisitions totaled $2.8 billion; locks totaled $2.8 billion Quarterly Highlights – Correspondent Production (1) Includes locks related to PMT loan acquisitions, for which PFSI earns a fulfillment fee upon loan funding (2) Debt - to - income ratio; excludes streamlined refinance loans Correspondent Volume and Mix Operational Highlights Ŷ Government - insured loans Ŷ Fulfillment activity for PMT Ŷ Total Locks (1) Strategic Initiatives ▪ Continue to add seller relationships ▪ Expand on strong position in government - insured loans – specialist market with fewer competitors ▪ Growth in prime non - Agency loans
| 10 |
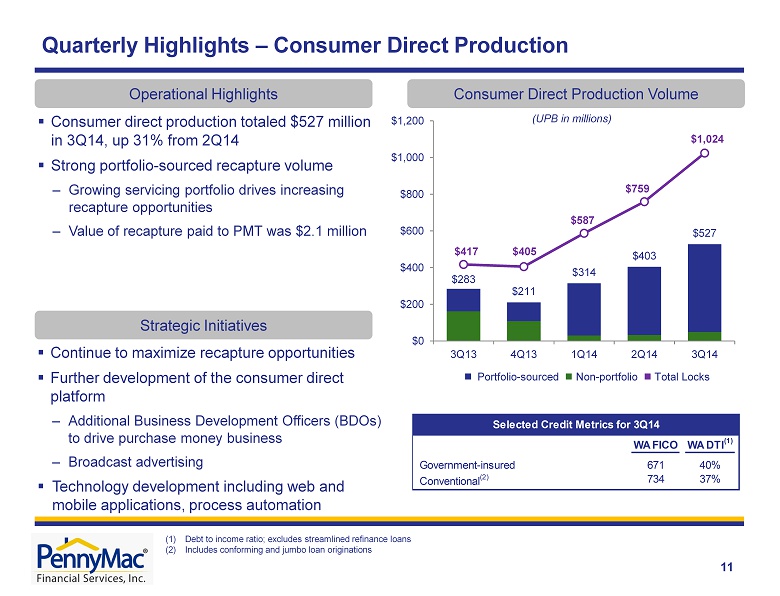
Government-insured Conventional (2) 671 40% Selected Credit Metrics for 3Q14 WA FICO WA DTI (1) 734 37% $283 $211 $314 $ 403 $ 527 $417 $405 $587 $759 $1,024 $0 $200 $400 $600 $800 $1,000 $1,200 3Q13 4Q13 1Q14 2Q14 3Q14 11 (UPB in millions ) ▪ Consumer direct production totaled $527 million in 3Q14 , up 31% from 2Q14 ▪ Strong portfolio - sourced recapture volume – Growing servicing portfolio drives increasing recapture opportunities – Value of recapture paid to PMT was $2.1 million Quarterly Highlights – Consumer Direct Production Consumer Direct Production Volume Operational Highlights Strategic Initiatives ▪ Continue to maximize recapture opportunities ▪ Further development of the consumer direct platform – Additional Business Development Officers (BDOs) to drive purchase money business – Broadcast advertising ▪ Technology development including web and mobile applications, process automation Ŷ Portfolio - sourced Ŷ Non - portfolio Ŷ Total Locks (1) Debt to income ratio; excludes streamlined refinance loans (2) Includes conforming and jumbo loan originations
| 11 |
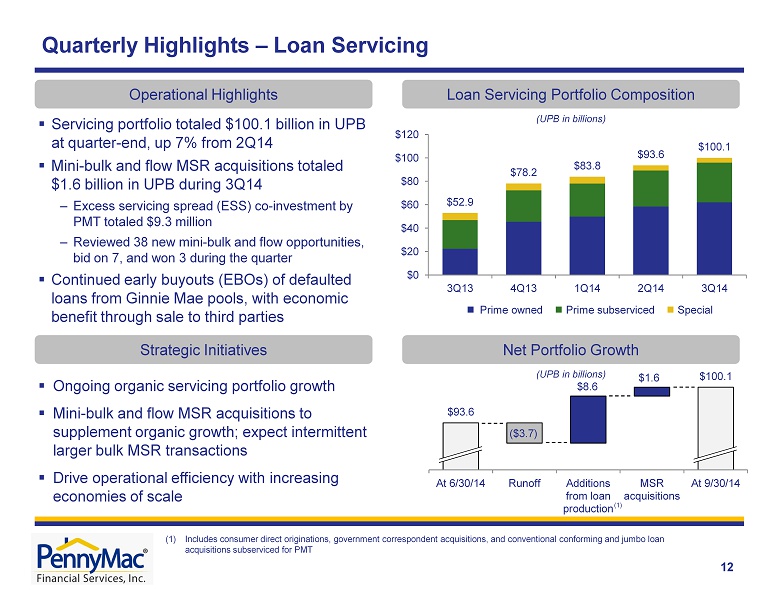
$93.6 $100.1 At 6/30/14 Runoff Additions from loan production MSR acquisitions At 9/30/14 $52.9 $78.2 $83.8 $93.6 $100.1 $0 $20 $40 $60 $80 $100 $120 3Q13 4Q13 1Q14 2Q14 3Q14 12 (UPB in billions ) ▪ Servicing portfolio totaled $100.1 billion in UPB at quarter - end, up 7 % from 2Q14 ▪ Mini - bulk and flow MSR acquisitions totaled $1.6 billion in UPB during 3Q14 – Excess servicing spread (ESS) co - investment by PMT totaled $9.3 million – Reviewed 38 new mini - bulk and flow opportunities, bid on 7, and won 3 during the quarter ▪ Continued early buyouts (EBOs) of defaulted loans from Ginnie Mae pools, with economic benefit through sale to third parties Quarterly Highlights – Loan Servicing Loan Servicing Portfolio Composition Operational Highlights ▪ Ongoing organic servicing portfolio growth ▪ Mini - bulk and flow MSR acquisitions to supplement organic growth; expect intermittent larger bulk MSR transactions ▪ Drive operational efficiency with increasing economies of scale Strategic Initiatives Ŷ Prime owned Ŷ Prime subserviced Ŷ Special Net Portfolio Growth ($3.7) $8.6 $1.6 (UPB in billions ) (1) (1) Includes consumer direct originations, government correspondent acquisitions, and conventional conforming and jumbo loan acquisitions subserviced for PMT
| 12 |
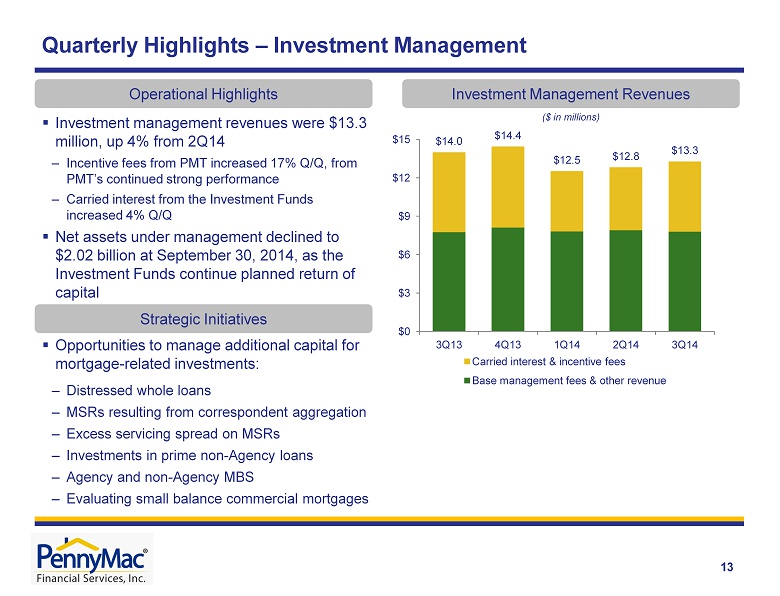
13 ($ in millions) ▪ Investment management revenues were $13.3 million, up 4% from 2Q14 – Incentive fees from PMT increased 17% Q/Q, from PMT’s continued strong performance – Carried interest from the Investment Funds increased 4% Q/Q ▪ Net assets under management declined to $2.02 billion at September 30 , 2014, as the Investment Funds continue planned return of capital Quarterly Highlights – Investment Management Investment Management Revenues Operational Highlights Strategic Initiatives ▪ Opportunities to manage additional capital for mortgage - related investments: – Distressed whole loans – MSRs resulting from correspondent aggregation – Excess servicing spread on MSRs – Investments in prime non - Agency loans – Agency and non - Agency MBS – Evaluating small balance commercial mortgages $14.0 $14.4 $12.5 $12.8 $13.3 $0 $3 $6 $9 $12 $15 3Q13 4Q13 1Q14 2Q14 3Q14 Carried interest & incentive fees Base management fees & other revenue
| 13 |
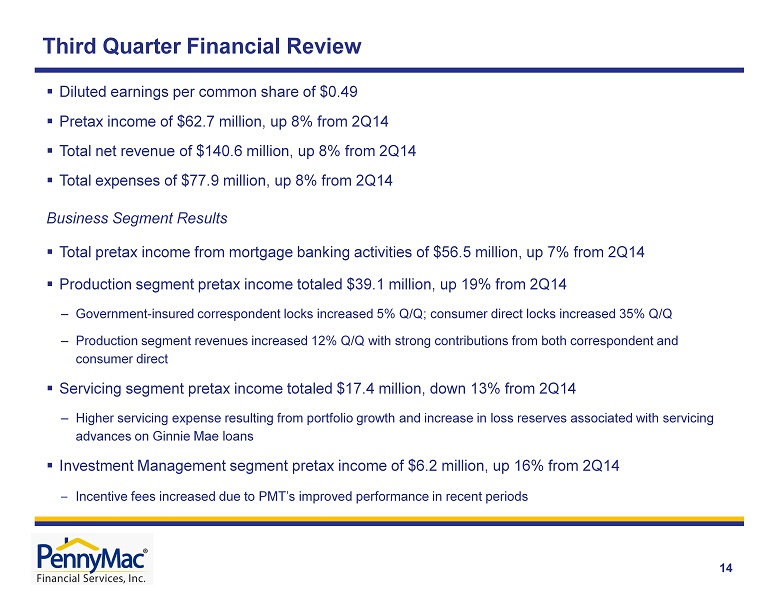
Third Quarter Financial Review 14 ▪ Diluted earnings per common share of $ 0.49 ▪ Pretax income of $62.7 million , up 8 % from 2Q14 ▪ Total net revenue of $140.6 million, up 8 % from 2 Q14 ▪ Total expenses of $77.9 million, up 8 % from 2Q14 Business Segment Results ▪ Total pretax income from mortgage banking activities of $56.5 million, up 7% from 2Q14 ▪ Production segment pretax income totaled $39.1 million, up 19% from 2Q14 – Government - insured correspondent locks increased 5 % Q/Q; consumer direct locks increased 35% Q/Q – Production segment revenues increased 12% Q/Q with strong contributions from both correspondent and consumer direct ▪ Servicing segment pretax income totaled $17.4 million, down 13% from 2Q14 – Higher servicing expense resulting from portfolio growth and increase in loss reserves associated with servicing advances on Ginnie Mae loans ▪ Investment Management segment pretax income of $6.2 million, up 16% from 2Q14 – Incentive fees increased due to PMT’s improved performance in recent periods
| 14 |

Net gains on mortgage loans held for sale at fair value 41,308$ 38,101$ Loan origination fees 11,823 10,345 Fulfillment fees from PennyMac Mortgage Investment Trust 15,497 12,433 Net interest income 2,508 2,625 Other 478 383 71,614 63,887 32,535 31,126 Pretax income 39,079$ 32,761$ Net gains on mortgage loans 41,308$ 38,101$ As % of IRLCs 0.73% 0.74% Loan origination fees 11,823$ 10,345$ As % of PFSI fundings 0.24% 0.24% Fulfillment fees from PMT 15,497$ 12,433$ Average fulfillment fee 42 bps 42 bps Production Segment Metrics Unaudited ($ in thousands) Expenses Production Segment Unaudited ($ in thousands) Revenue Quarter ended September 30 , 2014 Quarter ended June 30, 2014 Quarter ended September 30 , 2014 Quarter ended June 30 , 2014 15 Mortgage Banking – Production Segment Results (1) Fulfillment fees paid by PMT divided by unpaid principal balance of loans fulfilled for PMT during the quarter (2) Adjusted for expected fallout, which is 35% for consumer direct lock commitments (1) ▪ Gain related to consumer direct locks was approximately 305 bps in 3Q14 (2)
| 15 |

Unaudited ($ in thousands) Servicing fees (1) 64,708$ 66,493$ Effect of MSRs: Amortization and realization of cash flows (19,703) (16,729) Change in fair value and reversal of (provision for) impairment of MSRs carried at lower of amortized cost or fair value 261 (12,474) Change in fair value of excess servicing spread financing 9,538 10,062 Hedging gains (losses) (896) 9,617 Total amortization, impairment and change in fair value of MSRs (10,800) (9,524) Net loan servicing fees 53,908$ 56,969$ Net Loan Servicing Fees Quarter ended September 30 , 2014 Quarter ended June 30 , 2014 Revenue Net gains on mortgage loans held for sale at fair value 6,825$ 1,603$ Net servicing fees 53,908 56,969 Net interest expense (5,246) (5,106) Other 230 265 55,717 53,731 Expenses 38,286 33,772 Pretax income 17,431$ 19,959$ Servicing Segment Unaudited ($ in thousands) Quarter ended September 30 , 2014 Quarter ended June 30 , 2014 Mortgage Banking – Servicing Segment Results (1) Includes contractually - specified servicing fees . 16
| 16 |

UPB $30,665 $3,012 $27,189 Weighted average coupon 3.80% 4.71% 4.22% Prepayment speed assumption (CPR) 8.4% 11.1% 10.7% Weighted average servicing fee rate 0.29% 0.30% 0.31% Fair value of MSR $368.3 $31.7 $286.0 As a multiple of servicing fee 4.10 3.47 3.41 Carrying value of MSR $358.3 $31.7 $286.0 Related excess servicing spread liability - - $187.4 September 30, 2014 Unaudited ($ in millions) Lower of amortized cost or fair value Fair value not subject to excess servicing spread Fair value subject to excess servicing spread Mortgage Servicing Rights (MSR) Asset Valuation 17 ▪ PFSI carries most of its originated MSRs at the lower of amortized cost or fair value (LOCOM) – MSRs where the note rate on the underlying loan is equal to or less than 4.5% ▪ The fair value of MSRs carried at LOCOM was $10.0 million in excess of the carrying value at September 30 , 2014 – Fair value of the MSRs in excess of their carrying value increased due to higher mortgage rates at September 30, 2014, compared to the prior quarter end Note: Figures may not sum exactly due to rounding
| 17 |
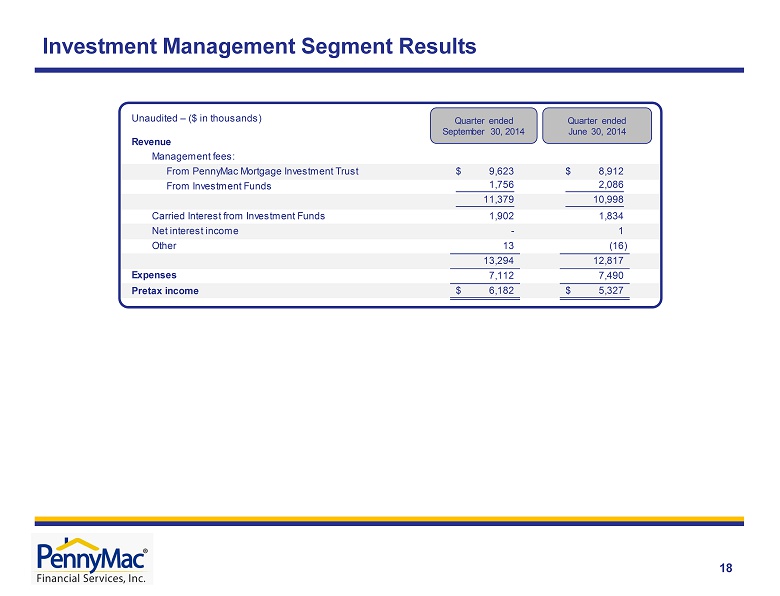
Management fees: From PennyMac Mortgage Investment Trust 9,623$ 8,912$ From Investment Funds 1,756 2,086 11,379 10,998 Carried Interest from Investment Funds 1,902 1,834 Net interest income - 1 Other 13 (16) 13,294 12,817 7,112 7,490 Pretax income 6,182$ 5,327$ Expenses Unaudited – ($ in thousands) Revenue Quarter ended September 30 , 2014 Quarter ended June 30 , 2014 Investment Management Segment Results 18
| 18 |

Appendix
| 19 |
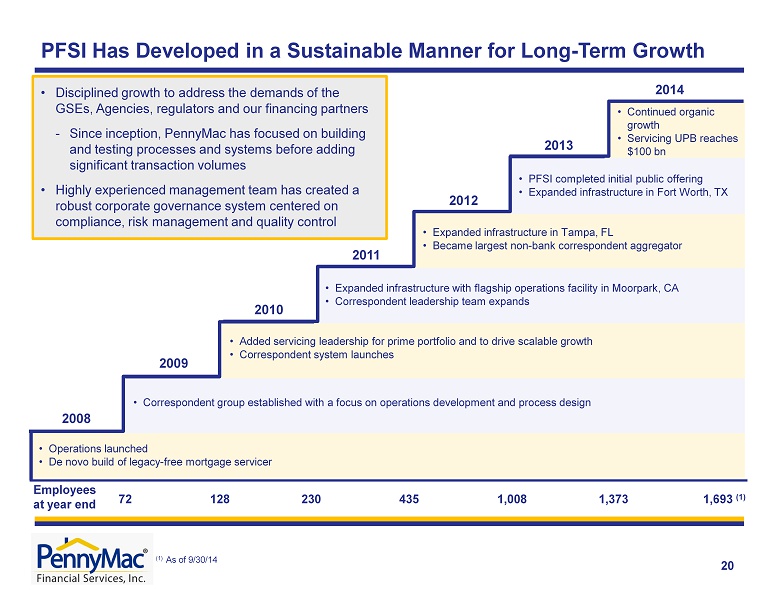
PFSI Has Developed in a Sustainable Manner for Long - Term Growth • Disciplined growth to address the demands of the GSEs, Agencies, regulators and our financing partners - Since inception, PennyMac has focused on building and testing processes and systems before adding significant transaction volumes • Highly experienced management team has created a robust corporate governance system centered on compliance, risk management and quality control 72 128 230 435 1,008 1,373 1,693 (1) • Correspondent group established with a focus on operations development and process design • Operations launched • De novo build of legacy - free mortgage servicer • Added servicing leadership for prime portfolio and to drive scalable growth • Correspondent system launches • Expanded infrastructure with flagship operations facility in Moorpark, CA • Correspondent leadership team expands • PFSI completed initial public offering • Expanded infrastructure in Fort Worth, TX • Expanded infrastructure in Tampa, FL • Became largest non - bank correspondent aggregator 2008 2009 2010 2011 2012 2013 E mployees at year end 2014 • Continued organic growth • Servicing UPB reaches $100 bn (1) As of 9/30/14 20
| 20 |
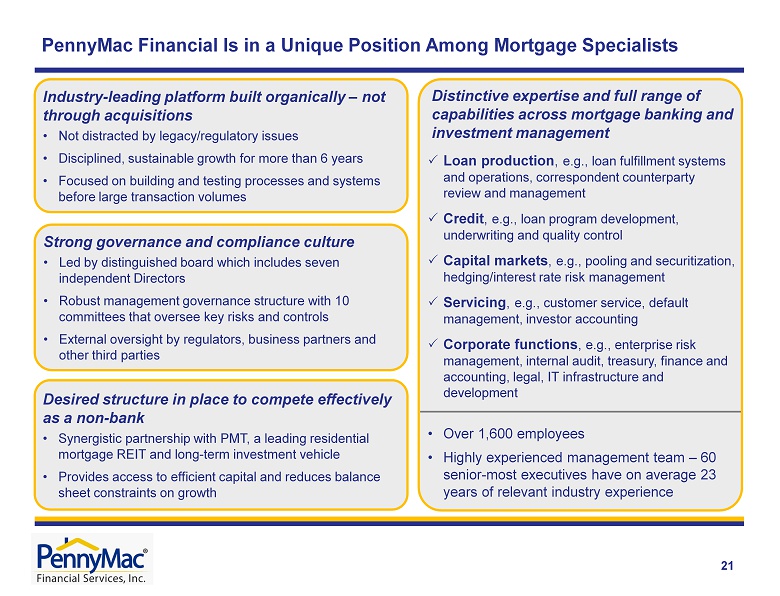
• Over 1,600 employees • Highly experienced management team – 60 senior - most executives have on average 23 years of relevant industry experience Strong governance and compliance culture • Led by distinguished board which includes seven independent Directors • Robust management governance structure with 10 committees that oversee key risks and controls • External oversight by regulators, business partners and other third parties Desired structure in place to compete effectively as a non - bank • Synergistic partnership with PMT, a leading residential mortgage REIT and long - term investment vehicle • Provides access to efficient capital and reduces balance sheet constraints on growth
| 21 |
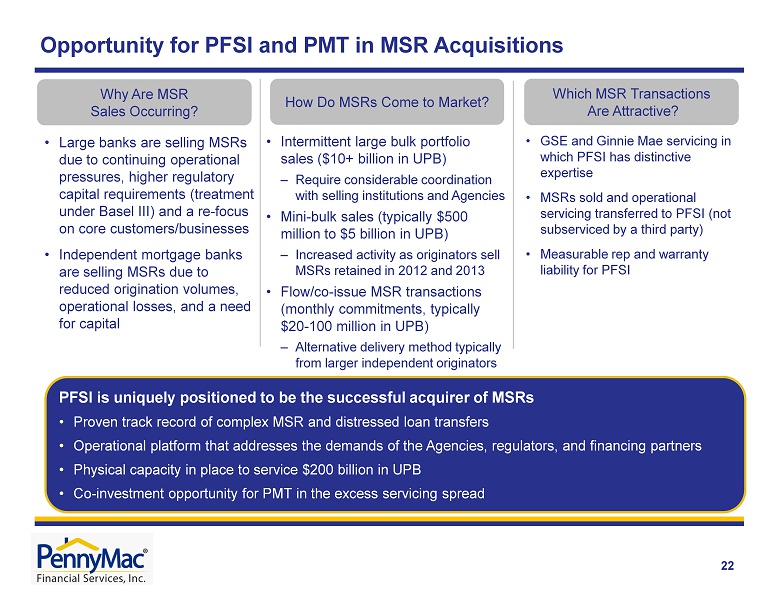
Opportunity for PFSI and PMT in MSR Acquisitions 22 Why Are MSR Sales Occurring? How Do MSRs Come to Market? • Large banks are selling MSRs due to continuing operational pressures, higher regulatory capital requirements (treatment under Basel III) and a re - focus on core customers/businesses • Independent mortgage banks are selling MSRs due to reduced origination volumes, operational losses, and a need for capital • Intermittent large bulk portfolio sales ($10+ billion in UPB) – Require considerable coordination with selling institutions and Agencies • Mini - bulk sales (typically $500 million to $5 billion in UPB) – Increased activity as originators sell MSRs retained in 2012 and 2013 • Flow/co - issue MSR transactions (monthly commitments, typically $20 - 100 million in UPB) – Alternative delivery method typically from larger independent originators Which MSR Transactions Are Attractive? • GSE and Ginnie Mae servicing in which PFSI has distinctive expertise • MSRs sold and operational servicing transferred to PFSI (not subserviced by a third party) • Measurable rep and warranty liability for PFSI PFSI is uniquely positioned to be the successful acquirer of MSRs • Proven track record of complex MSR and distressed loan transfers • Operational platform that addresses the demands of the Agencies, regulators, and financing partners • Physical capacity in place to service $200 billion in UPB • Co - investment opportunity for PMT in the excess servicing spread
| 22 |
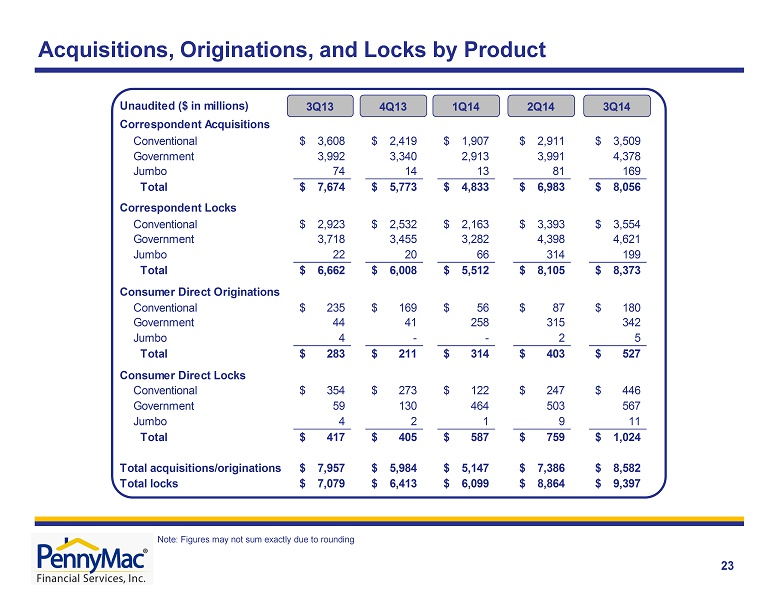
Unaudited ($ in millions) Correspondent Acquisitions Conventional 3,608$ 2,419$ 1,907$ 2,911$ 3,509$ Government 3,992 3,340 2,913 3,991 4,378 Jumbo 74 14 13 81 169 Total 7,674$ 5,773$ 4,833$ 6,983$ 8,056$ Correspondent Locks Conventional 2,923$ 2,532$ 2,163$ 3,393$ 3,554$ Government 3,718 3,455 3,282 4,398 4,621 Jumbo 22 20 66 314 199 Total 6,662$ 6,008$ 5,512$ 8,105$ 8,373$ Consumer Direct Originations Conventional 235$ 169$ 56$ 87$ 180$ Government 44 41 258 315 342 Jumbo 4 - - 2 5 Total 283$ 211$ 314$ 403$ 527$ Consumer Direct Locks Conventional 354$ 273$ 122$ 247$ 446$ Government 59 130 464 503 567 Jumbo 4 2 1 9 11 Total 417$ 405$ 587$ 759$ 1,024$ Total acquisitions/originations 7,957$ 5,984$ 5,147$ 7,386$ 8,582$ Total locks 7,079$ 6,413$ 6,099$ 8,864$ 9,397$ 3Q13 4Q13 1Q14 2Q14 3Q14 Acquisitions, Originations, and Locks by Product 23 Note: Figures may not sum exactly due to rounding
| 23 |