Attached files
| file | filename |
|---|---|
| 8-K - 8-K - Globalstar, Inc. | earningsrelease8-k.htm |
| EX-99.1 - EXHIBIT 99.1 - Globalstar, Inc. | gsat2014092014-ex991.htm |

Earnings Call Presentation Q3 2014 November 6, 2014

Safe Harbor Language This press release contains certain statements that are “forward-looking statements” within the meaning of the Private Securities Litigation Reform Act of 1995. These forward-looking statements are based on current expectations and assumptions that are subject to risks and uncertainties which may cause actual results to differ materially from the forward- looking statements. Forward-looking statements, such as the statements regarding our expectations with respect to actions by the FCC, future increases in our revenue and profitability and other statements contained in this release regarding matters that are not historical facts, involve predictions. Any forward-looking statements made in this press release are accurate as of the date made and are not guarantees of future performance. Actual results or developments may differ materially from the expectations expressed or implied in the forward-looking statements, and we undertake no obligation to update any such statements. Additional information on factors that could influence our financial results is included in our filings with the Securities and Exchange Commission, including our Annual Report on Form 10-K, Quarterly Reports on Form 10-Q and Current Reports on Form 8-K. 1
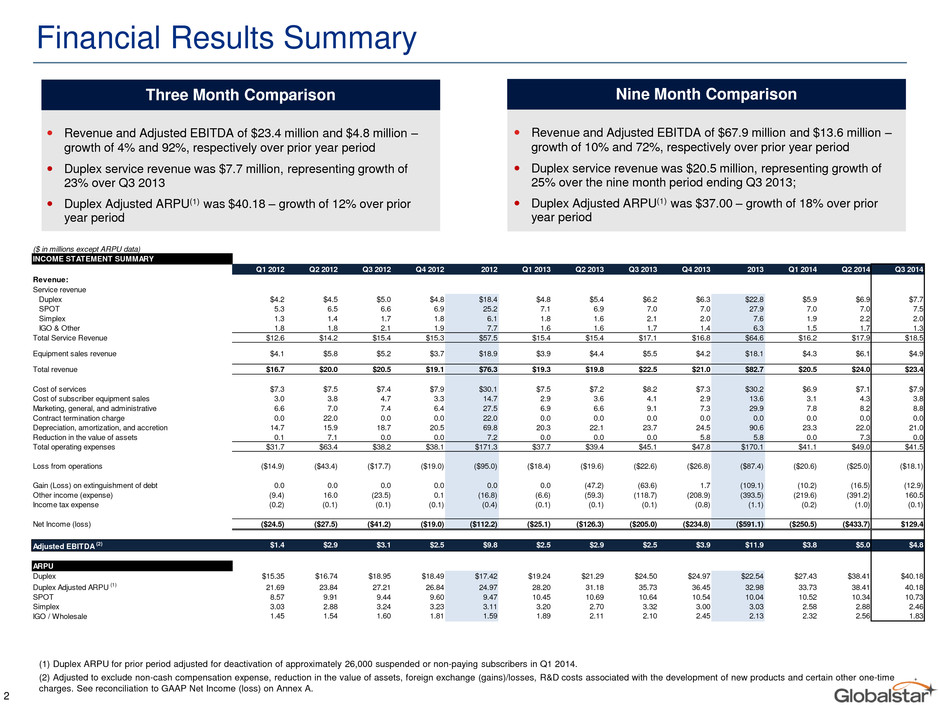
Financial Results Summary (2) Adjusted to exclude non-cash compensation expense, reduction in the value of assets, foreign exchange (gains)/losses, R&D costs associated with the development of new products and certain other one-time charges. See reconciliation to GAAP Net Income (loss) on Annex A. (1) Duplex ARPU for prior period adjusted for deactivation of approximately 26,000 suspended or non-paying subscribers in Q1 2014. 2 Revenue and Adjusted EBITDA of $23.4 million and $4.8 million – growth of 4% and 92%, respectively over prior year period Duplex service revenue was $7.7 million, representing growth of 23% over Q3 2013 Duplex Adjusted ARPU(1) was $40.18 – growth of 12% over prior year period Revenue and Adjusted EBITDA of $67.9 million and $13.6 million – growth of 10% and 72%, respectively over prior year period Duplex service revenue was $20.5 million, representing growth of 25% over the nine month period ending Q3 2013; Duplex Adjusted ARPU(1) was $37.00 – growth of 18% over prior year period Three Month Comparison Nine Month Comparison ($ in millions except ARPU data) INCOME STATEMENT SUMMARY Q1 2012 Q2 2012 Q3 2012 Q4 2012 2012 Q1 2013 Q2 2013 Q3 2013 Q4 2013 2013 Q1 2014 Q2 2014 Q3 2014 Revenue: Service revenue Duplex $4.2 $4.5 $5.0 $4.8 $18.4 $4.8 $5.4 $6.2 $6.3 $22.8 $5.9 $6.9 $7.7 SPOT 5.3 6.5 6.6 6.9 25.2 7.1 6.9 7.0 7.0 27.9 7.0 7.0 7.5 Simplex 1.3 1.4 1.7 1.8 6.1 1.8 1.6 2.1 2.0 7.6 1.9 2.2 2.0 IGO & Other 1.8 1.8 2.1 1.9 7.7 1.6 1.6 1.7 1.4 6.3 1.5 1.7 1.3 Total Service Revenue $12.6 $14.2 $15.4 $15.3 $57.5 $15.4 $15.4 $17.1 $16.8 $64.6 $16.2 $17.9 $18.5 Equipment sales revenue $4.1 $5.8 $5.2 $3.7 $18.9 $3.9 $4.4 $5.5 $4.2 $18.1 $4.3 $6.1 $4.9 Total revenue $16.7 $20.0 $20.5 $19.1 $76.3 $19.3 $19.8 $22.5 $21.0 $82.7 $20.5 $24.0 $23.4 Cost of services $7.3 $7.5 $7.4 $7.9 $30.1 $7.5 $7.2 $8.2 $7.3 $30.2 $6.9 $7.1 $7.9 Cost of subscriber equipment sales 3.0 3.8 4.7 3.3 14.7 2.9 3.6 4.1 2.9 13.6 3.1 4.3 3.8 Marketing, general, and administrative 6.6 7.0 7.4 6.4 27.5 6.9 6.6 9.1 7.3 29.9 7.8 8.2 8.8 Contract termination charge 0.0 22.0 0.0 0.0 22.0 0.0 0.0 0.0 0.0 0.0 0.0 0.0 0.0 Depreciation, amortization, and accretion 14.7 15.9 18.7 20.5 69.8 20.3 22.1 23.7 24.5 90.6 23.3 22.0 21.0 Reduction in the value of assets 0.1 7.1 0.0 0.0 7.2 0.0 0.0 0.0 5.8 5.8 0.0 7.3 0.0 Total operating expenses $31.7 $63.4 $38.2 $38.1 $171.3 $37.7 $39.4 $45.1 $47.8 $170.1 $41.1 $49.0 $41.5 Loss from operations ($14.9) ($43.4) ($17.7) ($19.0) ($95.0) ($18.4) ($19.6) ($22.6) ($26.8) ($87.4) ($20.6) ($25.0) ($18.1) Gain (Loss) on extinguishment of debt 0.0 0.0 0.0 0.0 0.0 0.0 (47.2) (63.6) 1.7 (109.1) (10.2) (16.5) (12.9) Other income (expense) (9.4) 16.0 (23.5) 0.1 (16.8) (6.6) (59.3) (118.7) (208.9) (393.5) (219.6) (391.2) 160.5 Income tax expense (0.2) (0.1) (0.1) (0.1) (0.4) (0.1) (0.1) (0.1) (0.8) (1.1) (0.2) (1.0) (0.1) Net Income (loss) ($24.5) ($27.5) ($41.2) ($19.0) ($112.2) ($25.1) ($126.3) ($205.0) ($234.8) ($591.1) ($250.5) ($433.7) $129.4 Adjusted EBITDA (2) $1.4 $2.9 $3.1 $2.5 $9.8 $2.5 $2.9 $2.5 $3.9 $11.9 $3.8 $5.0 $4.8 A PU Duplex $15.35 $16.74 $18.95 $18.49 $17.42 $19.24 $21.29 $24.50 $24.97 $22.54 $27.43 $38.41 $40.18 Duplex Adjusted ARPU (1) 21.69 23.84 27.21 26.84 24.97 28.20 31.18 35.73 36.45 32.98 33.73 38.41 40.18 SPOT 8.57 9.91 9.44 9.60 9.47 10.45 10.69 10.64 10.54 10.04 10.52 10.34 10.73 Simplex 3.03 2.88 3.24 3.23 3.11 3.20 2.70 3.32 3.00 3.03 2.58 2.88 2.46 IGO / Wholesale 1.45 1.54 1.60 1.81 1.59 1.89 2.11 2.10 2.45 2.13 2.32 2.56 1.83
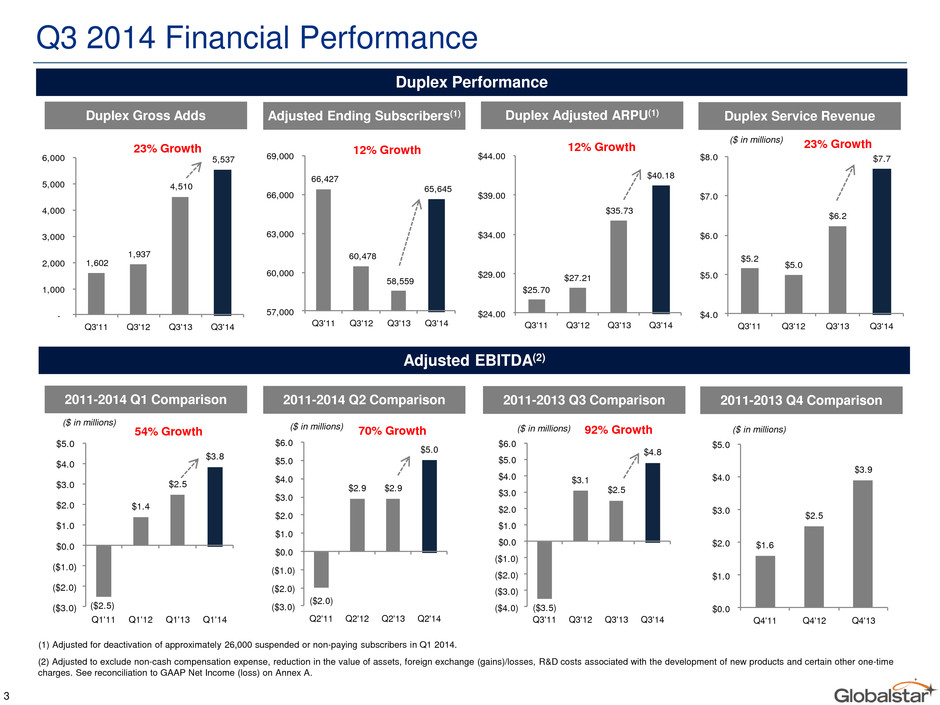
$5.2 $5.0 $6.2 $7.7 $4.0 $5.0 $6.0 $7.0 $8.0 Q3'11 Q3'12 Q3'13 Q3'14 $25.70 $27.21 $35.73 $40.18 $24.00 $29.00 $34.00 $39.00 $44.00 Q3'11 Q3'12 ' 3 ' 4 66,427 60,478 58,559 65,645 57,000 60,000 63,000 66,000 69,000 Q3'11 Q3'12 Q3'13 Q3'14 1,602 1,937 4,510 5,537 - 1,000 2,000 3,000 4,000 5,000 6,000 Q3'11 Q3'12 Q3'13 Q3' 4 Q3 2014 Financial Performance 23% Growth Duplex Performance Duplex Gross Adds Adjusted EBITDA(2) Adjusted Ending Subscribers(1) 12% Growth Duplex Service Revenue 23% Growth Duplex Adjusted ARPU(1) 12% Growth 2011-2014 Q1 Comparison 2011-2014 Q2 Comparison 2011-2013 Q3 Comparison 2011-2013 Q4 Comparison ($2.5) $1.4 $2.5 $3.8 ($3.0) ($2.0) ($1.0) $0.0 $1.0 $2.0 $3.0 $4.0 $5. Q1'11 Q1'12 Q1'13 Q1'14 ($2.0) $2.9 $2.9 $5.0 ($3.0) ($2.0) ($1.0) $0.0 $1.0 $2.0 $3.0 $4.0 $5.0 $6.0 Q2'11 Q2'12 Q2'13 Q2'14 ($3.5) $3.1 $2.5 $4.8 ($4.0) ($3.0) ($2.0) ($1.0) $0.0 $1.0 $2.0 $3.0 $4.0 $5.0 $6.0 Q3'1 Q3'12 Q3'13 Q3'14 $1.6 $2.5 $3.9 $0.0 $1.0 $2.0 $3.0 $4.0 $5.0 Q4'11 Q4'12 Q4'13 54% Growth ($ in millions) ($ in millions) ($ in millions) ($ in millions) ($ in millions) 70% Growth 3 92% Growth (2) Adjusted to exclude non-cash compensation expense, reduction in the value of assets, foreign exchange (gains)/losses, R&D costs associated with the development of new products and certain other one-time charges. See reconciliation to GAAP Net Income (loss) on Annex A. (1) Adjusted for deactivation of approximately 26,000 suspended or non-paying subscribers in Q1 2014.
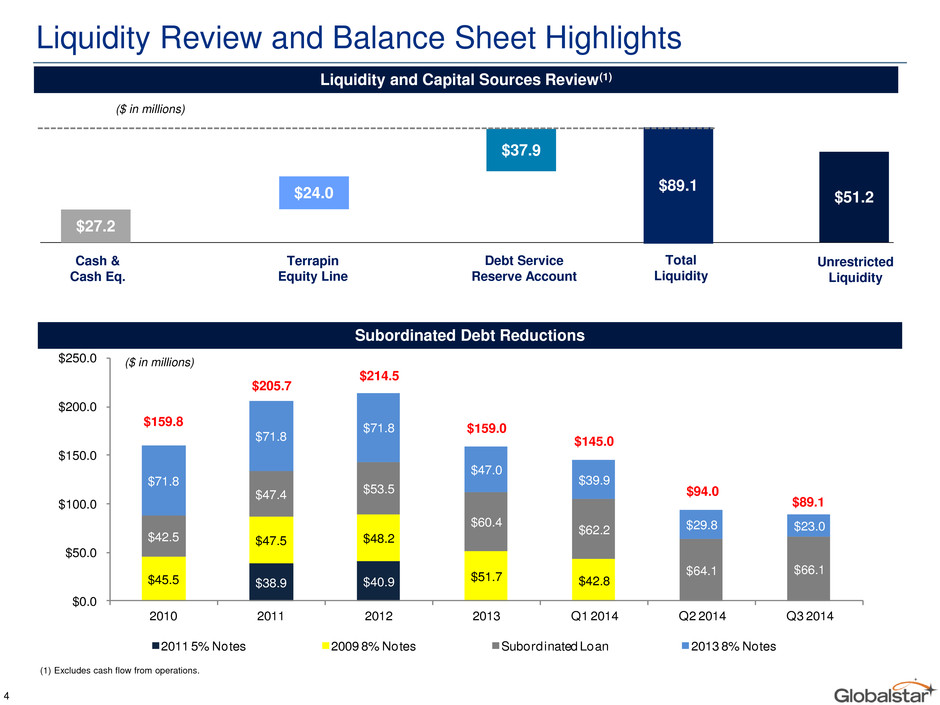
Liquidity Review and Balance Sheet Highlights $38.9 $40.9 $45.5 $47.5 $48.2 $51.7 $42.8 $42.5 $47.4 $53.5 $60.4 $62.2 $64.1 $66.1 $71.8 $71.8 $71.8 $47.0 $39.9 $29.8 $23.0 $0.0 $50.0 $100.0 $150.0 $200.0 $250.0 2010 2011 2012 2013 Q1 2014 Q2 2014 Q3 2014 2011 5% Notes 2009 8% Notes Subordinated Loan 2013 8% Notes Subordinated Debt Reductions Liquidity and Capital Sources Review(1) ($ in millions) $159.8 $205.7 $214.5 $159.0 $145.0 $94.0 Cash & Cash Eq. Terrapin Equity Line Debt Service Reserve Account Total Liquidity Unrestricted Liquidity $27.2 $24.0 $37.9 $89.1 $51.2 ($ in millions) (1) Excludes cash flow from operations. $89.1 4
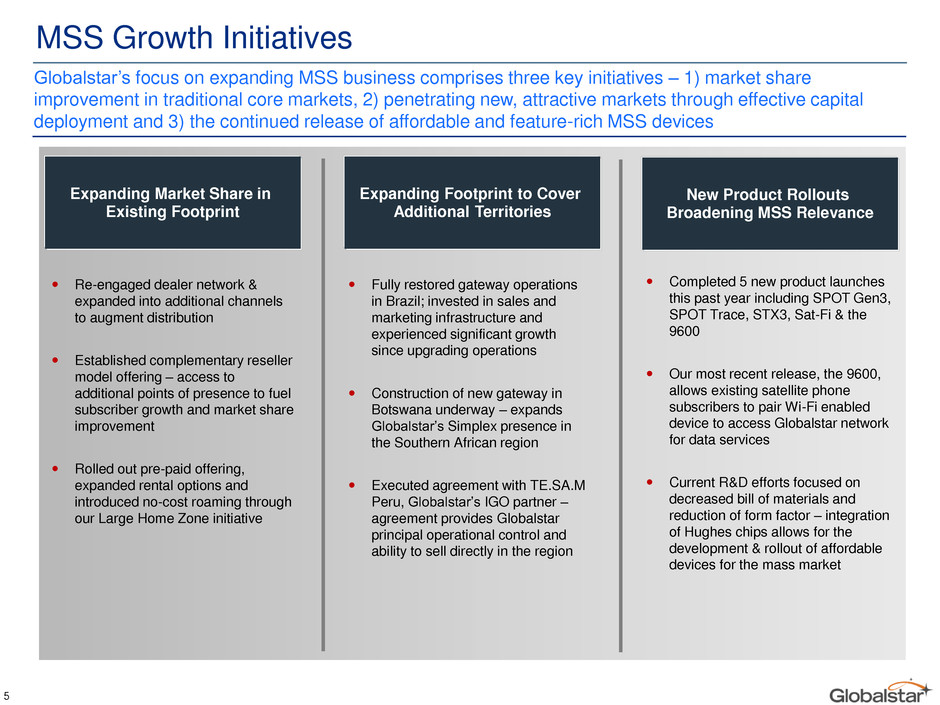
MSS Growth Initiatives Re-engaged dealer network & expanded into additional channels to augment distribution Established complementary reseller model offering – access to additional points of presence to fuel subscriber growth and market share improvement Rolled out pre-paid offering, expanded rental options and introduced no-cost roaming through our Large Home Zone initiative Expanding Market Share in Existing Footprint 5 Expanding Footprint to Cover Additional Territories New Product Rollouts Broadening MSS Relevance Globalstar’s focus on expanding MSS business comprises three key initiatives – 1) market share improvement in traditional core markets, 2) penetrating new, attractive markets through effective capital deployment and 3) the continued release of affordable and feature-rich MSS devices Fully restored gateway operations in Brazil; invested in sales and marketing infrastructure and experienced significant growth since upgrading operations Construction of new gateway in Botswana underway – expands Globalstar’s Simplex presence in the Southern African region Executed agreement with TE.SA.M Peru, Globalstar’s IGO partner – agreement provides Globalstar principal operational control and ability to sell directly in the region Completed 5 new product launches this past year including SPOT Gen3, SPOT Trace, STX3, Sat-Fi & the 9600 Our most recent release, the 9600, allows existing satellite phone subscribers to pair Wi-Fi enabled device to access Globalstar network for data services Current R&D efforts focused on decreased bill of materials and reduction of form factor – integration of Hughes chips allows for the development & rollout of affordable devices for the mass market
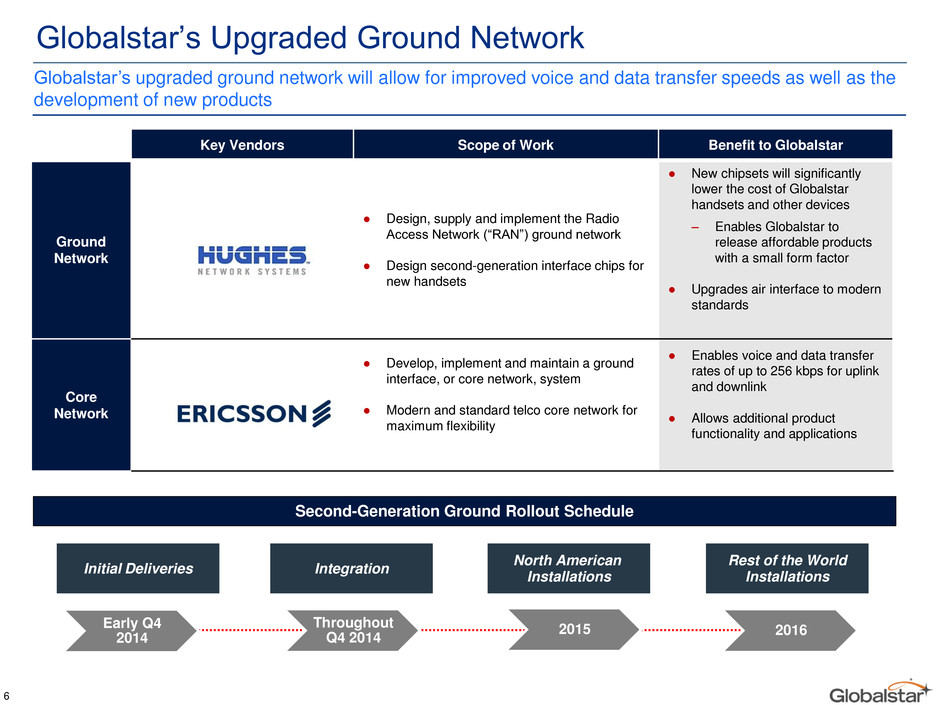
Globalstar’s Upgraded Ground Network 6 Globalstar’s upgraded ground network will allow for improved voice and data transfer speeds as well as the development of new products Key Vendors Scope of Work Benefit to Globalstar Ground Network ● Design, supply and implement the Radio Access Network (“RAN”) ground network ● Design second-generation interface chips for new handsets ● New chipsets will significantly lower the cost of Globalstar handsets and other devices ‒ Enables Globalstar to release affordable products with a small form factor ● Upgrades air interface to modern standards Core Network ● Develop, implement and maintain a ground interface, or core network, system ● Modern and standard telco core network for maximum flexibility ● Enables voice and data transfer rates of up to 256 kbps for uplink and downlink ● Allows additional product functionality and applications Second-Generation Ground Rollout Schedule Initial Deliveries Integration North American Installations Rest of the World Installations Early Q4 2014 Throughout Q4 2014 2015 2016
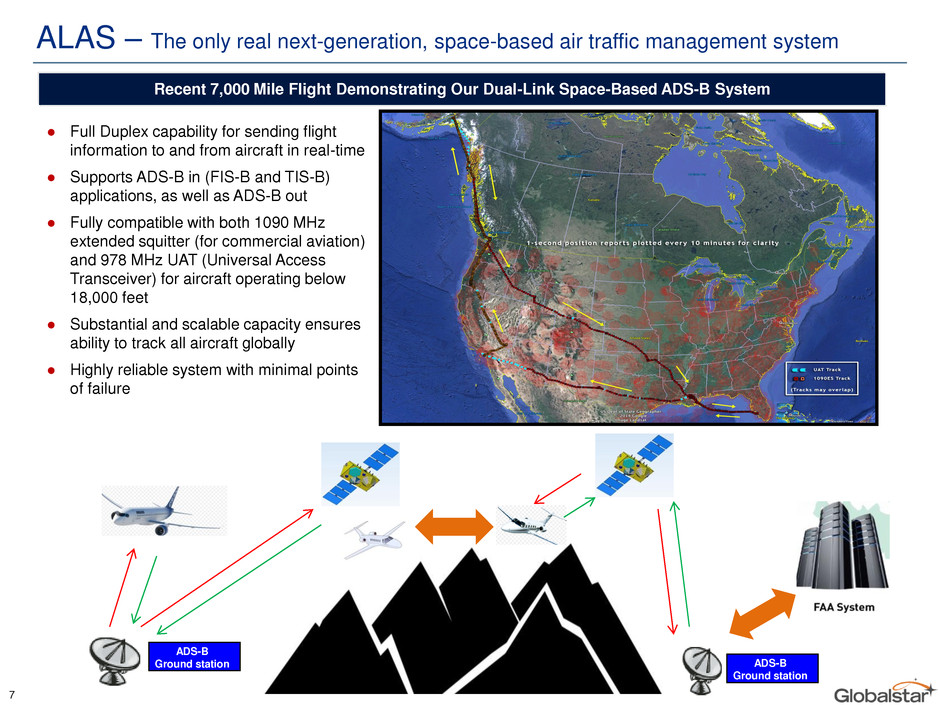
ALAS – The only real next-generation, space-based air traffic management system 7 Recent 7,000 Mile Flight Demonstrating Our Dual-Link Space-Based ADS-B System ● Full Duplex capability for sending flight information to and from aircraft in real-time ● Supports ADS-B in (FIS-B and TIS-B) applications, as well as ADS-B out ● Fully compatible with both 1090 MHz extended squitter (for commercial aviation) and 978 MHz UAT (Universal Access Transceiver) for aircraft operating below 18,000 feet ● Substantial and scalable capacity ensures ability to track all aircraft globally ● Highly reliable system with minimal points of failure ADS-B Ground station ADS-B Ground station
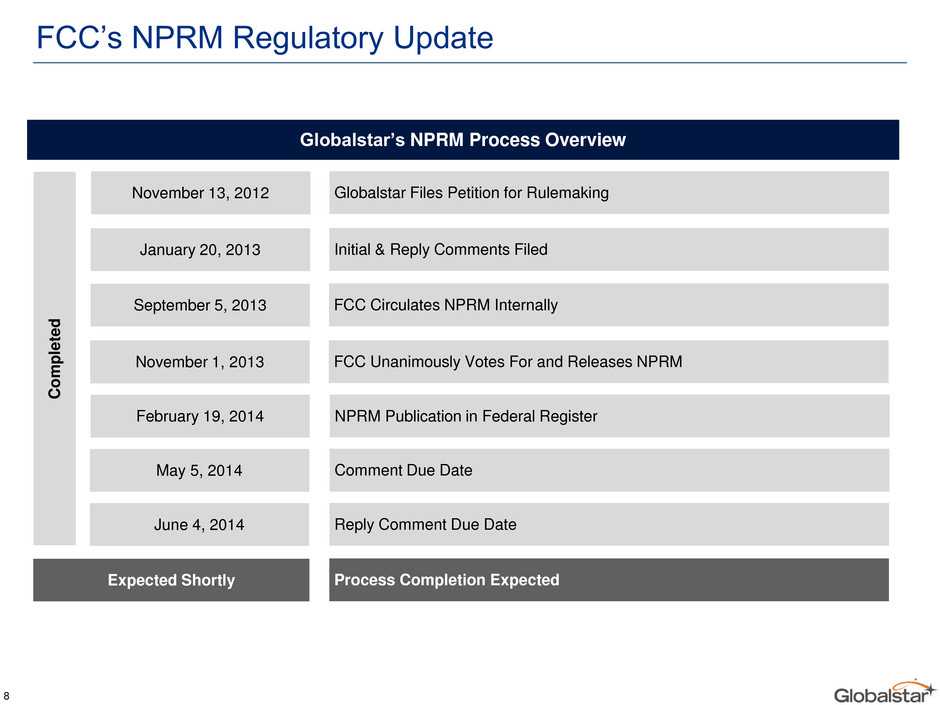
FCC’s NPRM Regulatory Update Globalstar’s NPRM Process Overview November 13, 2012 Globalstar Files Petition for Rulemaking January 20, 2013 Initial & Reply Comments Filed September 5, 2013 FCC Circulates NPRM Internally November 1, 2013 FCC Unanimously Votes For and Releases NPRM February 19, 2014 NPRM Publication in Federal Register May 5, 2014 Comment Due Date June 4, 2014 Reply Comment Due Date Expected Shortly Process Completion Expected Com p le te d 8
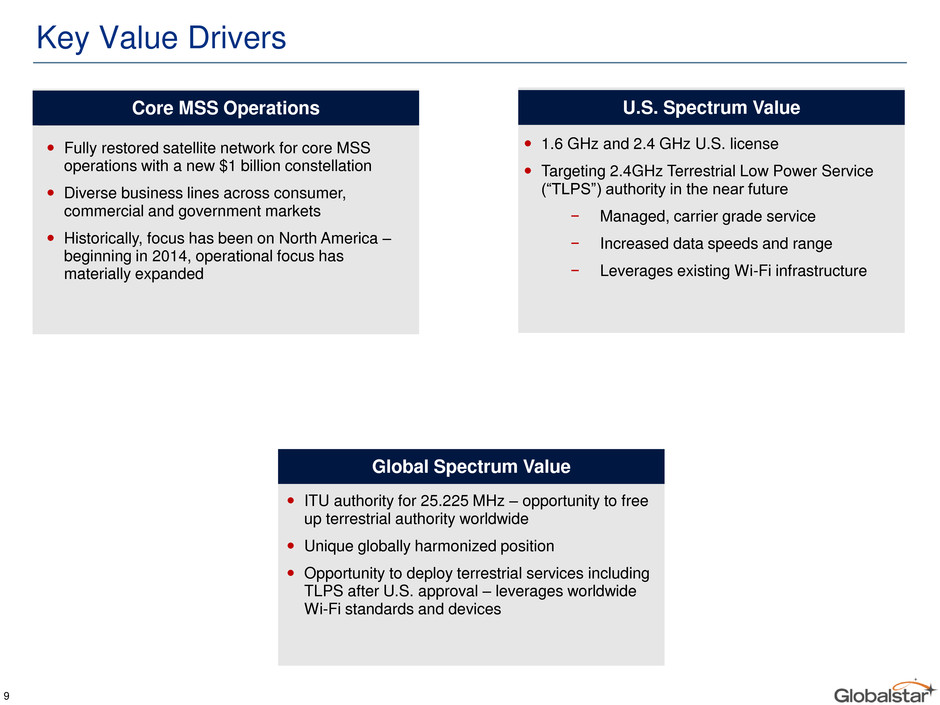
Key Value Drivers Fully restored satellite network for core MSS operations with a new $1 billion constellation Diverse business lines across consumer, commercial and government markets Historically, focus has been on North America – beginning in 2014, operational focus has materially expanded 1.6 GHz and 2.4 GHz U.S. license Targeting 2.4GHz Terrestrial Low Power Service (“TLPS”) authority in the near future − Managed, carrier grade service − Increased data speeds and range − Leverages existing Wi-Fi infrastructure ITU authority for 25.225 MHz – opportunity to free up terrestrial authority worldwide Unique globally harmonized position Opportunity to deploy terrestrial services including TLPS after U.S. approval – leverages worldwide Wi-Fi standards and devices Core MSS Operations U.S. Spectrum Value Global Spectrum Value 9
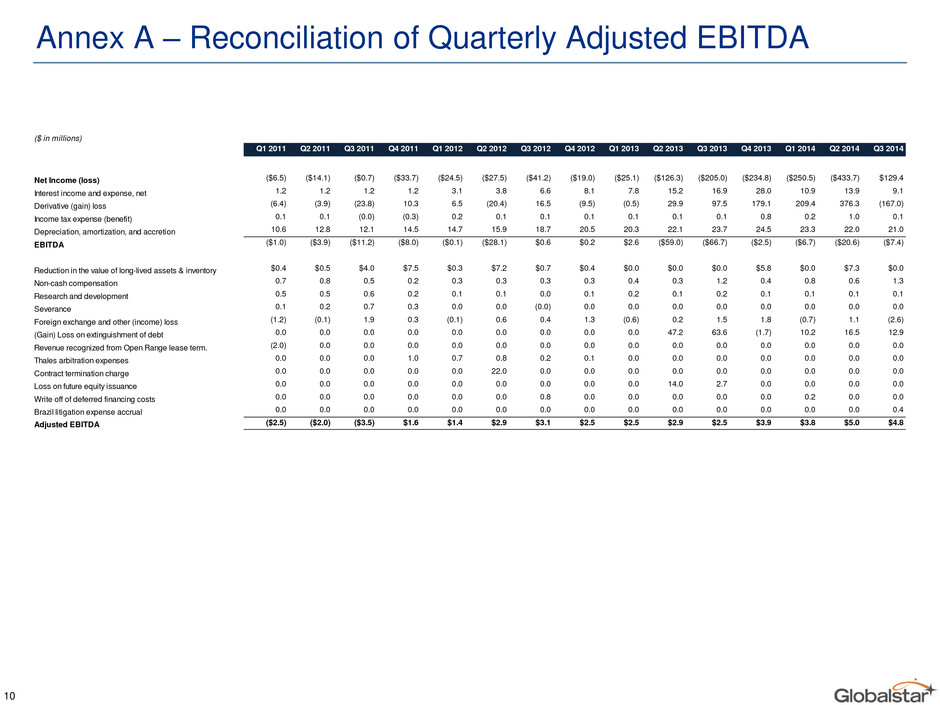
Annex A – Reconciliation of Quarterly Adjusted EBITDA 10 ($ in millions) Q1 2011 Q2 2011 Q3 2011 Q4 2011 Q1 2012 Q2 2012 Q3 2012 Q4 2012 Q1 2013 Q2 2013 Q3 2013 Q4 2013 Q1 2014 Q2 2014 Q3 2014 Net Income (loss) ($6.5) ($14.1) ($0.7) ($33.7) ($24.5) ($27.5) ($41.2) ($19.0) ($25.1) ($126.3) ($205.0) ($234.8) ($250.5) ($433.7) $129.4 Interest income and expense, net 1.2 1.2 1.2 1.2 3.1 3.8 6.6 8.1 7.8 15.2 16.9 28.0 10.9 13.9 9.1 Derivative (gain) loss (6.4) (3.9) (23.8) 10.3 6.5 (20.4) 16.5 (9.5) (0.5) 29.9 97.5 179.1 209.4 376.3 (167.0) Income tax expense (benefit) 0.1 0.1 (0.0) (0.3) 0.2 0.1 0.1 0.1 0.1 0.1 0.1 0.8 0.2 1.0 0.1 Depreciation, amortization, and accretion 10.6 12.8 12.1 14.5 14.7 15.9 18.7 20.5 20.3 22.1 23.7 24.5 23.3 22.0 21.0 EBITDA ($1.0) ($3.9) ($11.2) ($8.0) ($0.1) ($28.1) $0.6 $0.2 $2.6 ($59.0) ($66.7) ($2.5) ($6.7) ($20.6) ($7.4) Reduction in the value of long-lived assets & inventory $0.4 $0.5 $4.0 $7.5 $0.3 $7.2 $0.7 $0.4 $0.0 $0.0 $0.0 $5.8 $0.0 $7.3 $0.0 Non-cash compensation 0.7 0.8 0.5 0.2 0.3 0.3 0.3 0.3 0.4 0.3 1.2 0.4 0.8 0.6 1.3 Research and development 0.5 0.5 0.6 0.2 0.1 0.1 0.0 0.1 0.2 0.1 0.2 0.1 0.1 0.1 0.1 Severance 0.1 0.2 0.7 0.3 0.0 0.0 (0.0) 0.0 0.0 0.0 0.0 0.0 0.0 0.0 0.0 Foreign exchange and other (income) loss (1.2) (0.1) 1.9 0.3 (0.1) 0.6 0.4 1.3 (0.6) 0.2 1.5 1.8 (0.7) 1.1 (2.6) (Gain) Loss on extinguishment of debt 0.0 0.0 0.0 0.0 0.0 0.0 0.0 0.0 0.0 47.2 63.6 (1.7) 10.2 16.5 12.9 Revenue recognized from Open Range lease term. (2.0) 0.0 0.0 0.0 0.0 0.0 0.0 0.0 0.0 0.0 0.0 0.0 0.0 0.0 0.0 Thales arbitration expenses 0.0 0.0 0.0 1.0 0.7 0.8 0.2 0.1 0.0 0.0 0.0 0.0 0.0 0.0 0.0 Contract termination charge 0.0 0.0 0.0 0.0 0.0 22.0 0.0 0.0 0.0 0.0 0.0 0.0 0.0 0.0 0.0 Loss on future equity issuance 0.0 0.0 0.0 0.0 0.0 0.0 0.0 0.0 0.0 14.0 2.7 0.0 0.0 0.0 0.0 Write off of deferred financing costs 0.0 0.0 0.0 0.0 0.0 0.0 0.8 0.0 0.0 0.0 0.0 0.0 0.2 0.0 0.0 Brazil litigation expense accrual 0.0 0.0 0.0 0.0 0.0 0.0 0.0 0.0 0.0 0.0 0.0 0.0 0.0 0.0 0.4 Adjusted EBITDA ($2.5) ($2.0) ($3.5) $1.6 $1.4 $2.9 $3.1 $2.5 $2.5 $2.9 $2.5 $3.9 $3.8 $5.0 $4.8
