Attached files
| file | filename |
|---|---|
| 8-K - FORM 8-K - FIFTH THIRD BANCORP | d815462d8k.htm |
 ©
Fifth Third Bank | All Rights Reserved
BancAnalysts Association of Boston
Conference
Tayfun Tuzun
Executive Vice President & Chief Financial Officer
November 6, 2014
Refer to earnings release dated October 16, 2014 for further information
Exhibit 99.1 |
 2
©
Fifth Third Bank | All Rights Reserved
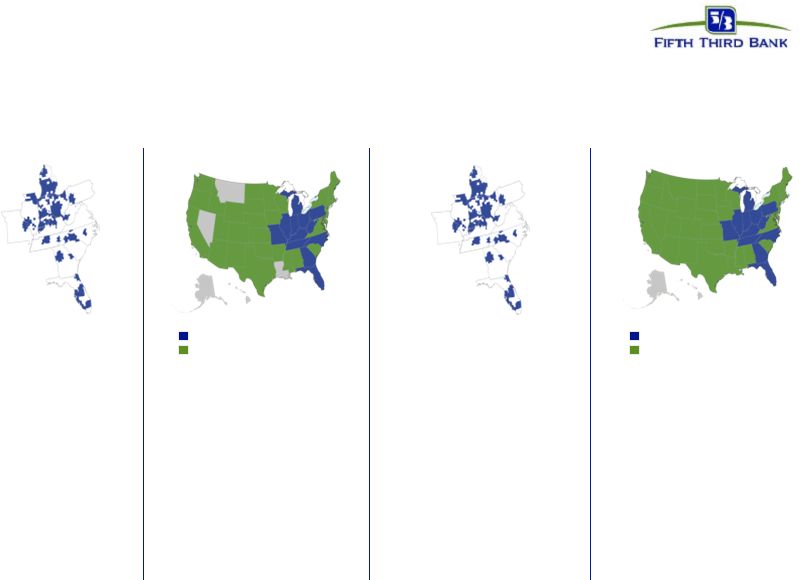
Broad scope of products and services
addressing the needs of wide array of customers
Consumer Lending
Branch Banking
Wealth Management
Wholesale Banking
Retail Bank
Cards
Home Equity
Mortgage
Auto
YTD total revenue of $398MM
YTD average loans of $2.2B
YTD average core deposits of $9.5B
$26B assets under management
$303B assets under care
YTD total revenue of $1.9B
YTD average loans of $51.2B
YTD average core deposits of $34.3B
YTD total revenue of $1.7B
YTD average loans of $16.6B
1,308 banking centers
2,639 ATMs
12 states
YTD total revenue of $470MM
YTD average loans of $20.8B
Private Bank
Retail Brokerage
Institutional Services
Commercial Bank
Footprint
Business
Lines
Highlights
In footprint markets
National consumer lending
In footprint markets
National commercial banking
Diversified financial services company with local orientation and
strong national businesses |
 3
©
Fifth Third Bank | All Rights Reserved
•
Earnings per diluted share of $0.39; included impact of negative
valuation adjustment on
Vantiv warrant ($53 million pre-tax, or $0.04 per share)
•
Solid operating results driven by expense discipline and healthy
balance sheet with strong
growth potential
•
Overall good performance in credit trends; total delinquencies and nonperforming
assets remain at low levels
Third quarter 2014 earnings highlights
1
Non-GAAP measure; see Reg. G reconciliation in appendix. Capital ratios
presented under current U.S. capital regulations. The pro forma Basel III Tier 1 common equity ratio is
management’s estimate based upon its current interpretation of recent
prospective regulatory capital requirements approved in July 2013.
•
Affiliate-based commercial banking franchise leveraging specialized expertise in
national businesses
•
Redesigning retail distribution strategy and prioritizing key segments in consumer
bank •
Growing regional wealth management and brokerage services
•
Payments and Commerce Solutions division specializing in developing
commerce-enabled solutions
•
Top 3 deposit market share in 7 of 15 markets, with focus on further improving share
of wallet
•
Tier 1 common ratio of 9.6% (Basel III pro forma estimate of
~9.4%)¹ •
Tangible book value per share¹
of $13.95; up 1% sequentially and 7% year-over-year
•
Repurchased $375 million of common shares 3Q14 YTD in conjunction with 2014 CCAR
plan
—
$180MM share repurchase agreement announced in October
|
 4
©
Fifth Third Bank | All Rights Reserved
Balance sheet strategy
Achieve appropriate risk-adjusted returns on lending relationships
Manage securities portfolio in a disciplined manner
Position deposit base for a competitive environment
Target long-term efficiency in liquidity management
Proactive balance sheet management based on risk appetite
|
 5
©
Fifth Third Bank | All Rights Reserved
•
Loan-to-core deposit ratio better
positioned for rising rates and
liquidity rules
•
97% in 3Q 2014; 106% in 3Q
2004
•
Future growth needs to be
balanced
•
…and to remain above historical
levels
•
Utilization of short-term
borrowings no longer a prudent
permanent funding strategy
•
Stable and diverse funding base
•
Substantially lower reliance on short-
term borrowings
•
Significant available capacity for
market debt issuances and CD growth
Loans and Core Deposits ($B)
Funding profile
Core Deposits Short-term
Borrowing Long-term Borrowing Funding
Mix |
 6
©
Fifth Third Bank | All Rights Reserved
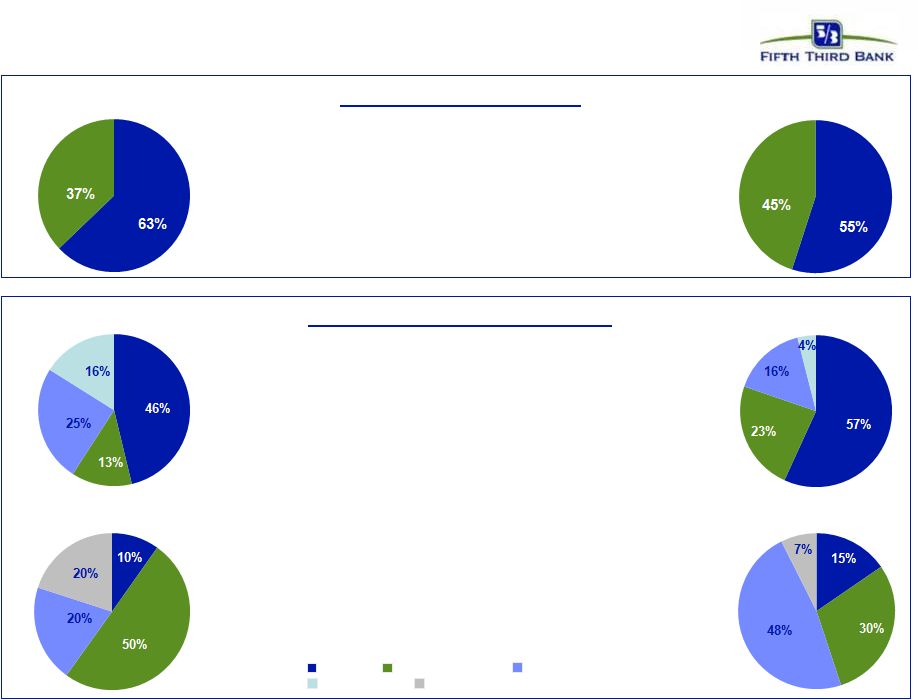
Demand Interest Checking
Savings/MMDA Foreign Office
CDs < $100K (Other time) Core Deposit Growth
•
Over the last 10 years, core deposits have grown
72% from $54B to $93B
3Q04 ($54B)
3Q14 ($93B)
Core Deposit Composition
•
Commercial demand balances have increased and
are supported by low earnings credits rates
•
Growth in commercial core deposits reflects
customer acquisition and impact of additional
treasury management solutions
•
Shift in consumer core deposit balances
consistent with expectations from changes to
product offerings and recent focus on growing
money market balances
•
Contraction in CD portfolio reflects current low
interest rate environment
3Q04 Commercial ($20B)
3Q04 Consumer ($34B)
3Q14 Commercial ($42B)
3Q14 Consumer ($51B)
Commercial
Commercial
Consumer
Consumer
Strengthened deposit profile
–
$17B increase in consumer core deposits
–
$22B increase in commercial core deposits |
 Long-term industry balance sheet trends
Loan-to-deposit ratios improving for the
industry since the financial crisis
–
Deposit growth is consistent with its
long-term trends
–
Loan growth exceeded nominal GDP
growth pre-crisis and has now stabilized
to match GDP growth
Fifth Third trends similar to industry,
although our recent focus on deposits
reflects steeper growth
Source: FDIC
1
All graphs indexed
7
U.S.
banks
and
Nominal
GDP
1
U.S.
Banks
and
Nominal
GDP
1
Fifth
Third
and
Nominal
GDP
1
©
Fifth Third Bank | All Rights Reserved |
 Deposit composition trends
Deposit mix has been impacted by
prolonged low rates
Longer term trend of slowly
declining proportion of non-interest
bearing balances reversed in 2008
—
Future reversion to mean will
be a function of the rate
environment
Fifth Third trends have been similar
to overall industry trends:
—
Strong commercial DDA
growth partly due to growth in
Treasury Management
—
Contraction in the consumer
CD portfolio offset by growth
in non-maturity deposits
Fifth Third’s DDA modeling
assumptions are consistent with the
expectation of migration from non-
interest bearing into interest bearing
accounts
Source: FDIC
1
All graphs indexed
8
Industry Deposit Composition vs. Nominal
FITB Deposit Composition vs. Nominal
©
Fifth Third Bank | All Rights Reserved
GDP
1
GDP
1 |
 Value
of retail deposits Retail deposits are the foundation of
our balance sheet funding strategy:
—
Provide more stable source of
liquidity
—
Relative price advantage
–
40% beta during the last
Fed tightening cycle while
commercial deposits had a
67% beta
—
Favorable regulatory treatment
Expectation of more intense
competition reflected in interest rate
risk modeling
—
Commercial deposit beta
assumption of 85%
—
Consumer deposit beta
assumption of 62%
CDs represent a significant source of
potential liquidity
—
2009 consumer CD balances
~35% of consumer interest-
bearing deposits vs 9% in 3Q14
—
Flexible rate risk management
tool in a rising rate environment
Source: FDIC and Federal Reserve
1
Indexed; Excludes all Maturity deposits. C/D new production assumes a 100% Beta to
the like term on the yield curve. 2
Interest-bearing deposits; Yearly-weighted average balances
Consumer
Deposit
Pricing
Sensitivity
1
9
Consumer
Deposit
Composition
2
©
Fifth Third Bank | All Rights Reserved
5.25% |
 10
©
Fifth Third Bank | All Rights Reserved
Deposit offerings drive value contribution
Cross Sell Ratio
Single Service Households
Accounts Paying a Maintenance Fee
•
Broader and deeper banking relationships with Fifth
Third earn better rates and lower costs
•
Favorable execution trends contributing to stronger
revenue
•
Could see additional benefit from higher average
account balances when rates rise
Note: Retail cross sell service set includes Checking, Savings, CD, Home Equity,
Direct/Indirect Loan, Mortgage (incl EHR), Credit Card, Annuity, Brokerage, Insurance,
Early Access, Debt Protection, ID Alert, Debit Card, Access 360,
Online Bill Pay, Direct Deposit, Mobile Banking and Internet Banking. Households
with Access 360 only are not included. |
 11
©
Fifth Third Bank | All Rights Reserved
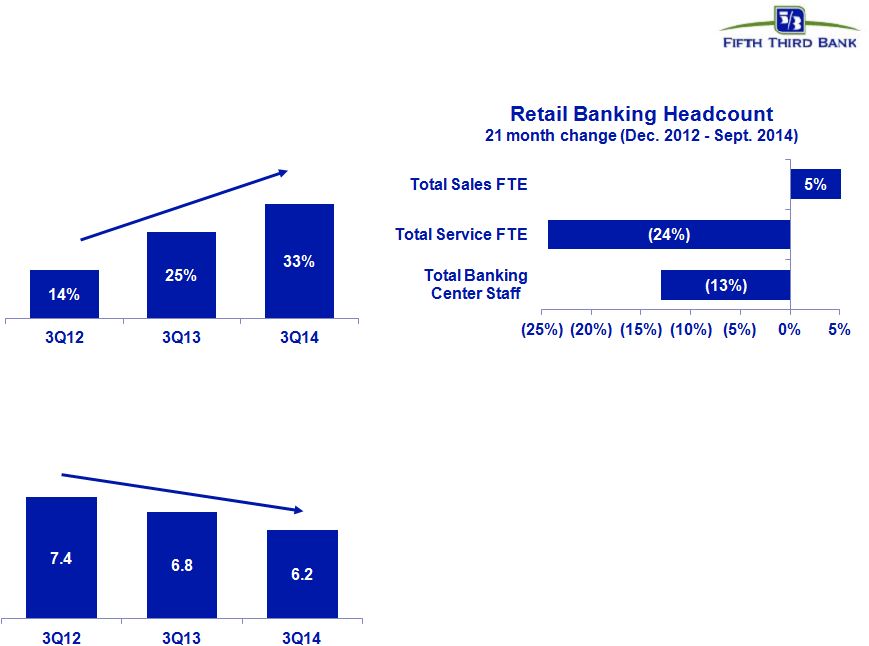
Enhancing retail bank platform
Consumer deposit activity
Transaction volume by ATM and Mobile channels
•
Remote deposit capture launched in 2012
•
All ATMs image-enabled and ~50 Smart ATMs
deployed with additional consumer-friendly
upgrades
–
Touch-screen and dual screen interface
–
Ability to split deposits into two accounts
–
Small denomination withdrawals
•
Testing technology-focused, smaller branch
formats with lower staffing requirements
•
Redefining roles of branch personnel and testing
hybrid roles
Branch transactions
Average monthly teller trans. in millions |
 12
©
Fifth Third Bank | All Rights Reserved
Deposit momentum delivering franchise value
Naples
Source: FDIC, SNL Financial.
Note: Branches included are full service retail / brick and mortar; data excludes
headquarters branches with over $250 million in deposits ($500MM for Chicago CBSA).
Cincinnati affiliate
#1 market share (23% or $11.0B
of FITB footprint deposits) and
Fifth Third’s largest affiliate
market; home of Fifth Third’s
corporate headquarters
Western Michigan and Northwestern Ohio affiliates
#1 market shares (17% and 19% of FITB footprint deposits,
respectively); incl. Grand Rapids, MI and Toledo, OH
Chicago affiliate
Fifth Third’s second largest affiliate market;
6.9% increase in deposits vs. 2013
•
Deposit growth in all 15
affiliates
•
Deposit market share
growth in 13 of 15 affiliates
–
Top 3 deposit share in 7
affiliates
–
Deposit growth
outperforming market in
13 affiliates
Strong market share in mature Midwest markets;
Southeast markets remain key focus area and source of growth.
North Carolina affiliate
#4 market share in Charlotte;
8.0% increase in deposits vs.
2013
Florida region
10.3% increase in deposits vs. 2013;
one of the strongest regional growth
markets |
 13
©
Fifth Third Bank | All Rights Reserved
Conclusion
Actively
managing
balance sheet
based on risk
appetite
Creating
shareholder
value with long-
term focus while
optimizing our
current
opportunities
Continuously
improving
business
platforms in
response to
changing
environment
Managing
expenses with
focus on
improved
efficiency |
 14
©
Fifth Third Bank | All Rights Reserved
Cautionary statement
This report contains statements that we believe are “forward-looking statements” within
the meaning of Section 27A of the Securities Act of 1933, as amended, and Rule 175 promulgated
thereunder, and Section 21E of the Securities Exchange Act of 1934, as amended, and Rule 3b-6
promulgated thereunder. These statements relate to our financial condition, results of operations,
plans, objectives, future performance or business. They usually can be identified by the use of
forward-looking language such as “will likely result,” “may,” “are expected to,” “is
anticipated,” “estimate,” “forecast,” “projected,” “intends
to,” or may include other similar words or phrases such as “believes,” “plans,” “trend,”
“objective,” “continue,” “remain,” or similar expressions, or future or
conditional verbs such as “will,” “would,” “should,” “could,” “might,” “can,” or
similar verbs. You should not place undue reliance on these statements, as they are subject to risks
and uncertainties, including but not limited to the risk factors set forth in our most recent
Annual Report on Form 10-K. When considering these forward-looking statements, you should keep in
mind these risks and uncertainties, as well as any cautionary statements we may make. Moreover, you
should treat these statements as speaking only as of the date they are made and based only on
information then actually known to us. There are a number of important factors that
could cause future results to differ materially from historical performance and these forward-looking
statements. Factors that might cause such a difference include, but are not limited to: (1) general
economic conditions and weakening in the economy, specifically the real estate market, either
nationally or in the states in which Fifth Third, one or more acquired entities and/or the
combined company do business, are less favorable than expected; (2) deteriorating credit quality; (3)
political developments, wars or other hostilities may disrupt or increase volatility in
securities markets or other economic conditions; (4) changes in the interest rate environment reduce
interest margins; (5) prepayment speeds, loan origination and sale volumes, charge-offs and loan
loss provisions; (6) Fifth Third’s ability to maintain required capital levels and
adequate sources of funding and liquidity; (7) maintaining capital requirements may limit Fifth Third’s
operations and potential growth; (8) changes and trends in capital markets; (9) problems encountered
by larger or similar financial institutions may adversely affect the banking industry and/or
Fifth Third; (10) competitive pressures among depository institutions increase significantly; (11) effect
of critical accounting policies and judgments; (12) changes in accounting policies or procedures as
may be required by the Financial Accounting Standards Board (FASB) or other regulatory
agencies; (13) legislative or regulatory changes or actions, or significant litigation, adversely affect
Fifth Third, one or more acquired entities and/or the combined company or the businesses in which
Fifth Third, one or more acquired entities and/or the combined company are engaged, including
the Dodd-Frank Wall Street Reform and Consumer Protection Act; (14) ability to maintain
favorable ratings from rating agencies; (15) fluctuation of Fifth Third’s stock price; (16)
ability to attract and retain key personnel; (17) ability to receive dividends from its
subsidiaries; (18) potentially dilutive effect of future acquisitions on current shareholders’ ownership of Fifth Third; (19)
effects of accounting or financial results of one or more acquired entities; (20) difficulties from
Fifth Third’s investment in, relationship with, and nature of the operations of Vantiv,
LLC; (21) loss of income from any sale or potential sale of businesses that could have an adverse effect on Fifth
Third’s earnings and future growth; (22) ability to secure confidential information and deliver
products and services through the use of computer systems and telecommunications networks; and
(23) the impact of reputational risk created by these developments on such matters as business
generation and retention, funding and liquidity.
You should refer to our periodic and current reports filed with the Securities and Exchange
Commission, or “SEC,” for further information on other factors, which could cause
actual results to be significantly different from those expressed or implied by these forward-looking statements.
|
 15
©
Fifth Third Bank | All Rights Reserved
Appendix |
 16
©
Fifth Third Bank | All Rights Reserved
Interest rate risk management
1
Repricing
percentage
or
“beta”
is
the
estimated
change
in
yield
over
12
months
as
a
result
of
a
shock
or
ramp
100
bps
parallel
shift
in
the
yield
curve.
2
Actual results may vary from these simulated results due to timing, magnitude, and
frequency of interest rate changes, as well as changes in market conditions and management strategies.
Strategically
positioned
balance
sheet
to
limit
risk
to
downside
rate
scenarios
•
Balance sheet is well positioned for a rising rate environment
—
62% of total loans are floating rate (80% of commercial and 35% of consumer)
—
Investment portfolio duration of approximately 5 years
—
Short-term wholesale funding represents only 4% of total funding
—
$14.1B in funding will reprice beyond 1 year
•
Interest rate sensitivities are based on conservative deposit assumptions
—
Weighted-average deposit beta of 70% (2004 –
2006 cycle betas ~50%)
1
—
No modeled lag in deposit repricing
—
Modeled DDA runoff of approximately $2.5B (approximately 8%) for
each 100 bps increase in rates
—
For every $1B of incremental DDA runoff beyond what is modeled, asset sensitivity
decreases: -
15 bps in year 1 and 28 bps in year 2 in a 100 bps ramp
-
35 bps in both year 1 and year 2 in a 100 bps shock
•
Forecasted balances represent our current
expectations regarding balance sheet trends
•
Static balances assume current composition of
balance sheet remains constant
•
In ramp scenarios, rate changes occur evenly over
the first four quarters
•
In shock scenarios, rate changes are instantaneous
+100 bps
+200 bps
(2.0%)
(4.4%)
EVE at Risk
+100 bps
+200 bps
+100 bps
+200 bps
NII-Asset Sensitivity
Forecast Balances
Static Balances
Year 1
0.9%
1.7%
0.9%
1.7%
Year 2
4.0%
6.7%
4.5%
7.6%
Year 1
2.1%
4.0%
2.1%
3.8%
Year 2
4.9%
8.4%
5.5%
9.3%
2 |
 17
©
Fifth Third Bank | All Rights Reserved
Regulation G Non-GAAP reconciliation
Fifth Third Bancorp and Subsidiaries
Regulation G Non-GAAP Reconcilation
$ and shares in millions
(unaudited)
September
June
March
December
September
2014
2014
2014
2013
2013
Income before income taxes (U.S. GAAP)
464
606
438
561
604
Add:
Provision expense (U.S. GAAP)
71
76
69
53
51
Pre-provision net revenue
535
682
507
614
655
Net income available to common shareholders (U.S. GAAP)
328
416
309
383
421
Add:
Intangible amortization, net of tax
1
1
1
1
1
Tangible net income available to common shareholders
329
417
310
384
422
Tangible net income available to common shareholders (annualized) (a)
1,305
1,673
1,257
1,523
1,674
Average Bancorp shareholders' equity (U.S. GAAP)
15,486
15,157
14,862
14,757
14,440
Less:
Average preferred stock
(1,331)
(1,119)
(1,034)
(703)
(593)
Average goodwill
(2,416)
(2,416)
(2,416)
(2,416)
(2,416)
Average intangible assets
(16)
(17)
(19)
(20)
(22)
Average tangible common equity
(b) 11,723
11,605
11,393
11,618
11,409
Total Bancorp shareholders' equity (U.S. GAAP)
15,404
15,469
14,826
14,589
14,641
Less:
Preferred stock
(1,331)
(1,331)
(1,034)
(1,034)
(593)
Goodwill
(2,416)
(2,416)
(2,416)
(2,416)
(2,416)
Intangible assets
(16)
(17)
(18)
(19)
(21)
Tangible common equity, including
unrealized gains / losses (c) 11,641
11,705
11,358
11,120
11,611
Less: Accumulated other comprehensive income
(301)
(382)
(196)
(82)
(218)
Tangible common equity, excluding unrealized gains /
losses (d) 11,340
11,323
11,162
11,038
11,393
Total assets (U.S. GAAP)
134,188
132,562
129,654
130,443
125,673
Less:
Goodwill
(2,416)
(2,416)
(2,416)
(2,416)
(2,416)
Intangible assets
(16)
(17)
(18)
(19)
(21)
Tangible assets, including
unrealized gains / losses (e) 131,756
130,129
127,220
128,008
123,236
Less: Accumulated other comprehensive income / loss, before tax
(463)
(588)
(302)
(126)
(335)
Tangible assets, excluding unrealized gains / losses
(f) 131,293
129,541
126,918
127,882
122,901
Common shares outstanding (g)
834
844
848
855
887
Ratios:
Return on average tangible common equity (a) / (b)
11.1%
14.4%
11.0%
13.1%
14.7%
Tangible common equity (excluding unrealized gains/losses) (d) / (f)
8.64%
8.74%
8.79%
8.63%
9.27%
Tangible common equity (including unrealized gains/losses) (c) / (e)
8.84%
9.00%
8.93%
8.69%
9.42%
Tangible book value per share (c) / (g)
$13.95
$13.86
$13.40
$13.00
$13.09
For the Three Months Ended |
 18
©
Fifth Third Bank | All Rights Reserved
Regulation G Non-GAAP reconciliation
Fifth Third Bancorp and Subsidiaries
Regulation G Non-GAAP Reconcilation
$ and shares in millions
(unaudited)
September
June
March
December
September
2014
2014
2014
2013
2013
Total Bancorp shareholders' equity (U.S. GAAP)
15,404
15,469
14,826
14,589
14,641
Goodwill and certain other intangibles
(2,484)
(2,484)
(2,490)
(2,492)
(2,492)
Unrealized gains
(301)
(382)
(196)
(82)
(218)
Qualifying trust preferred securities
60
60
60
60
810
Other
(18)
(19)
(18)
19
21
Tier I capital
12,661
12,644
12,182
12,094
12,762
Less:
Preferred stock
(1,331)
(1,331)
(1,034)
(1,034)
(593)
Qualifying trust preferred securities
(60)
(60)
(60)
(60)
(810)
Qualifying noncontrolling interest in consolidated
subsidiaries (1)
(1)
(1)
(37)
(39)
Tier I common equity (a)
11,269
11,252
11,087
10,963
11,320
Risk-weighted assets, determined in accordance with
prescribed regulatory requirements (b)
116,920
117,117
116,622
115,969
113,801
Ratio:
Tier I common equity (a) / (b)
9.64%
9.61%
9.51%
9.45%
9.95%
Basel III - Estimated Tier 1 common equity ratio
September
June
March
December
September
2014
2014
2014
2013
2013
Tier 1 common equity (Basel I)
11,269
11,252
11,087
10,963
11,320
Add:
Adjustment related to capital components
99
96
99
82
88
Estimated Tier 1 common equity under final Basel III rules without AOCI (opt out)(c)
11,368
11,348
11,186
11,045
11,408
Add:
Adjustment related to AOCI
301
382
196
82
218
Estimated Tier 1 common equity under final Basel III rules with AOCI (non opt out)(d)
11,669
11,730
11,382
11,127
11,626
Estimated risk-weighted assets under final Basel III rules (e)
121,068
122,465
122,659
122,074
120,447
Estimated Tier 1 common equity ratio under final Basel III rules (opt out) (c) / (e)
9.39%
9.27%
9.12%
9.05%
9.47%
Estimated Tier 1 common equity ratio under final Basel III rules (non opt out) (d) / (e)
9.64%
9.58%
9.28%
9.12%
9.65%
(c), (d)
(e)
Under the final Basel III rules, non-advanced approach banks are permitted to make a one-time
election to opt out of the requirement to include AOCI in Tier 1 common equity. Other adjustments
include mortgage servicing rights and deferred tax assets subject to threshold limitations and
deferred tax liabilities related to intangible assets. Key differences under Basel III in the
calculation of risk-weighted assets compared to Basel I include: (1) Risk weighting for commitments under 1 year; (2) Higher risk weighting for exposures to
securitizations, past due loans, foreign banks and certain commercial real estate; (3) Higher risk
weighting for mortgage servicing rights and deferred tax assets that are under certain thresholds as
a percent of Tier 1 capital; and (4) Derivatives are differentiated between exchange clearing and
over-the-counter and the 50% risk-weight cap is removed. For the Three Months
Ended |