Attached files
| file | filename |
|---|---|
| 8-K - 8-K - Dealertrack Technologies, Inc | v393368_8k.htm |
| EX-99.1 - EXHIBIT 99.1 - Dealertrack Technologies, Inc | v393368_ex99-1.htm |
Exhibit 99.2
1 November 5, 2014 Investor Presentation
2 ■ Statements in this press release regarding Dealertrack’s expected 2014 performance based on both GAAP and non - GAAP measures, the long - term outlook for its business, and all other statements in this release other than the recitation of historical facts are forward - looking statements (as defined in the Private Securities Litigation Reform Act of 1995 ) . These statements involve a number of risks, uncertainties and other factors that could cause actual results, performance or achievements of Dealertrack to be materially different from any future results, performance or achievements expressed or implied by these forward - looking statements . ■ Factors that that could materially affect such forward - looking statements include : economic trends that affect the automotive retail industry or the indirect automotive financing industry including the number of new and used cars sold ; credit availability ; reductions in automotive dealerships ; increased competitive pressure from other industry participants, including AutoTrader , CDK Global (formally ADP), Open Dealer Exchange, Reynolds and Reynolds and RouteOne ; the impact of some vendors of software products for automotive dealers making it more difficult for Dealertrack’s customers to use Dealertrack’s solutions and services ; security breaches, interruptions, failures and/or other errors involving Dealertrack’s systems or networks ; the failure or inability to execute any element of Dealertrack’s business strategy, including selling additional products and services to existing and new customers ; Dealertrack’s success in implementing an ERP system ; the volatility of Dealertrack’s stock price ; new regulations or changes to existing regulations ; the integration of recent acquisitions and the expected benefits, as well as the integration and expected benefits of any future acquisitions that Dealertrack may pursue ; Dealertrack’s success in expanding its customer base and product and service offerings, the impact of recent economic trends, and difficulties and increased costs associated with raising additional capital ; the impairment of intangible assets, such as trademarks and goodwill ; the possibility that the expected benefits of our acquisitions, including Dealer . com may not materialize as expected ; failure to successfully integrate the business, infrastructure and employees of acquisitions, including Dealer . com ; and other risks listed in Dealertrack’s reports filed with the Securities and Exchange Commission (SEC), including its most recent Annual Report on Form 10 - K . These filings can be found on Dealertrack’s website at www . dealertrack . com and the SEC’s website at www . sec . gov . Forward - looking statements included herein speak only as of November 5 , 2014 and Dealertrack disclaims any obligation to revise or update such statements to reflect events or circumstances after the date hereof or to reflect the occurrence of unanticipated events or circumstances, except as required by law . Safe Harbor for Forward - Looking Statements

3 ▪ Founded in 2001, IPO in 2005 ▪ Headquartered in Lake Success, New York ▪ ~3,700 employees ▪ 2014 Estimated Revenue: $845 million (mid - point of guidance) ▪ 2014 Estimated Adjusted EBITDA: $191 million (mid - point of guidance) Business Description: ■ Dealertrack’s web - based software solutions and services enhance efficiency and profitability for all major segments of the automotive retail industry, including dealers, lenders, OEMs, third - party retailers, aftermarket providers and other service procedures ■ Operates the largest online credit application networks in the United States and Canada Dealertrack Overview
4 ▪ Leading provider of web - based software solutions and services that enhance the efficiency and profitability for all major segments of the automotive retail industry ▪ Ability to integrate and leverage Dealer.com’s innovative digital marketing solutions with Dealertrack’s in - store solutions ▪ Most comprehensive suite of solutions in industry ▪ Attractive ~ $7 billion SaaS and transaction market size provides opportunity for long - term growth ▪ ~$10 billion digital market opportunity anticipated to double by end of 2018 ▪ Consistent track record of growth and profitability ▪ Double - digit revenue growth driven through both organic growth and acquisitions ▪ Predictable business model with highly visible recurring revenue ▪ Seasoned management team with extensive industry experience Investment Highlights
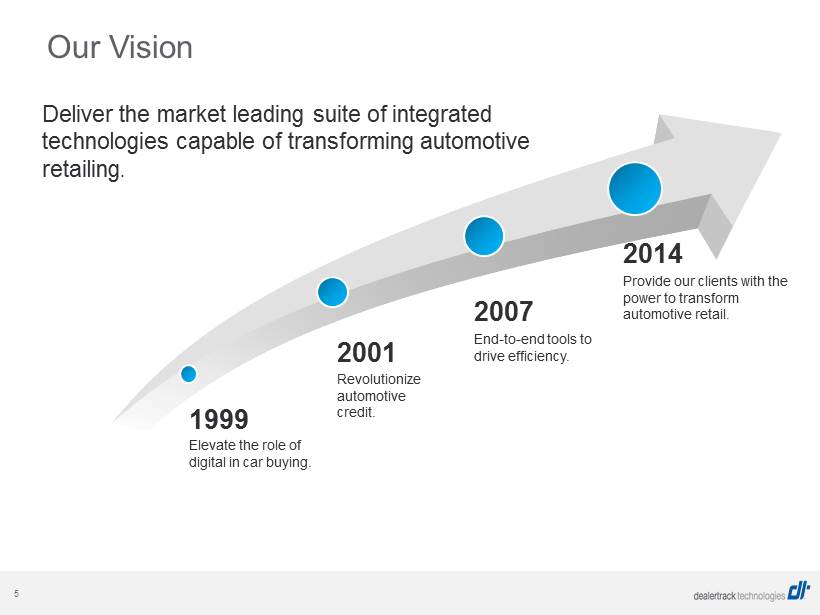
5 Our Vision Deliver the market leading suite of integrated technologies capable of transforming automotive retailing . 2001 2007 2014 Revolutionize automotive credit. End - to - end tools to drive efficiency. Provide our clients with the power to transform automotive retail. 1999 Elevate the role of digital in car buying.

6 Dealertrack’s Network Aftermarket providers, accessory providers, OEMs and OpenTrack partners Third Party Integrations Other Information and Service Providers Lenders 1,500+ U.S. lenders connected to credit application network Credit bureaus, used car value guides, identity verification services Dealers 20,300+ active U.S. auto dealers on Dealertrack’s network 24,000+ dealers with Dealertrack subscriptions (U.S. & Canada) Reflects business as of September 30, 2014.

7 Facilitating Workflow in the Dealership
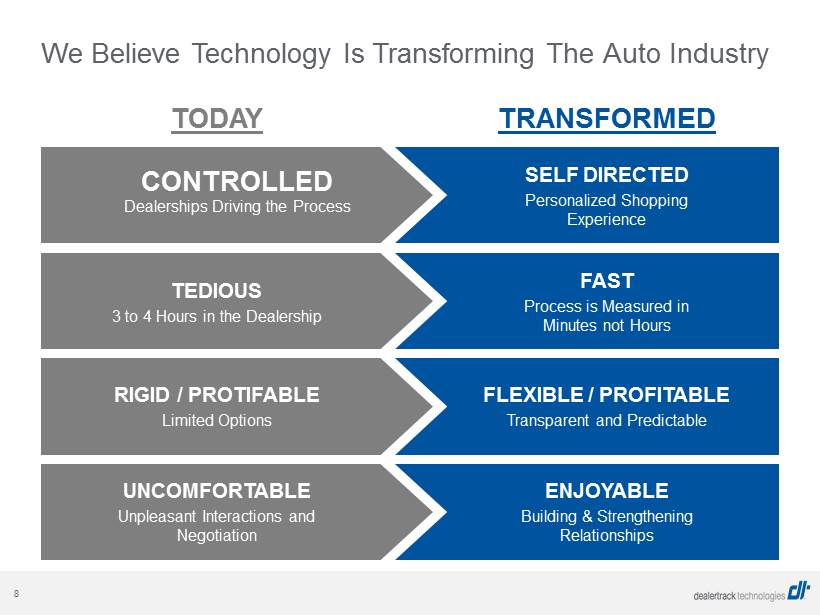
8 We Believe Technology Is Transforming The Auto Industry SELF DIRECTED Personalized Shopping Experience TEDIOUS 3 to 4 Hours in the Dealership FAST Process is Measured in Minutes not Hours RIGID / PROTIFABLE Limited Options FLEXIBLE / PROFITABLE Transparent and Predictable UNCOMFORTABLE Unpleasant Interactions and Negotiation ENJOYABLE Building & Strengthening Relationships TODAY TRANSFORMED CONTROLLED Dealerships Driving the Process
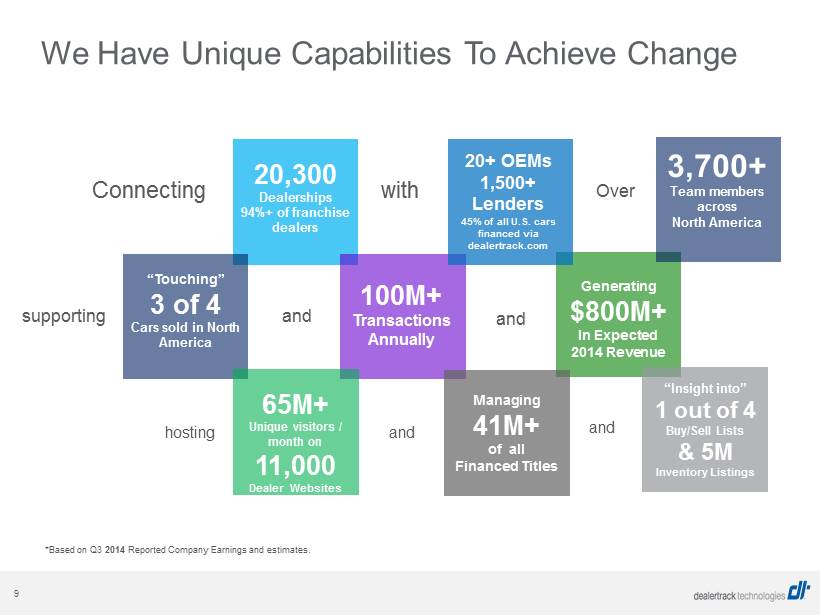
9 *Based on Q3 2014 Reported Company Earnings and estimates. 3,700+ Team members across North America 20,300 Dealerships 94%+ of franchise dealers 20+ OEMs 1,500+ Lenders 45% of all U.S. cars financed via dealertrack.com 100M+ Transactions Annually Generating $800M+ In Expected 2014 Revenue Connecting with supporting and Over 65M + Unique visitors / month on 11,000 Dealer Websites “Touching” 3 of 4 Cars sold in North America and hosting “Insight into” 1 out of 4 Buy/Sell Lists & 5M Inventory Listings and and Managing 41M+ of all Financed Titles We Have Unique Capabilities To Achieve Change
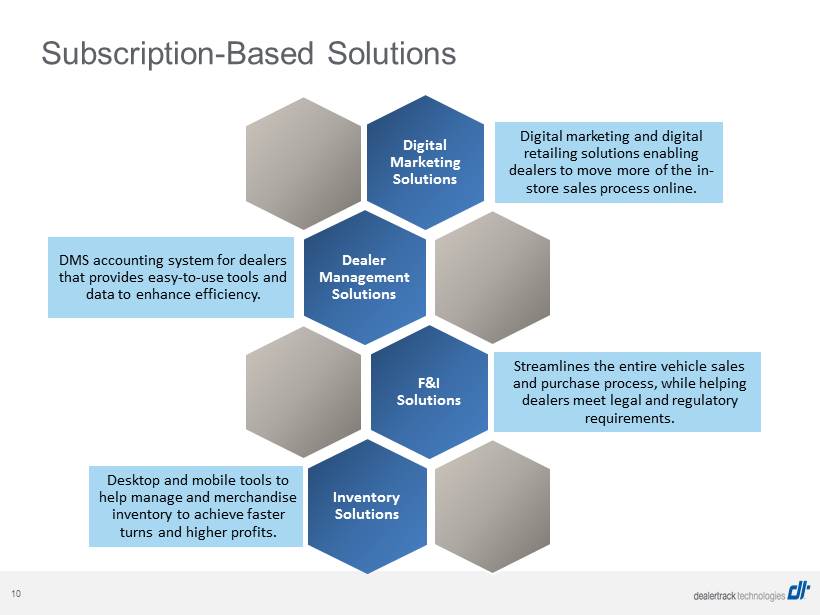
10 Subscription - Based Solutions Dealer Management Solutions DMS accounting system for dealers that provides easy - to - use tools and data to enhance efficiency. Digital Marketing Solutions Digital marketing and digital retailing solutions enabling dealers to move more of the in - store sales process online. F&I Solutions Streamlines the entire vehicle sales and purchase process, while helping dealers meet legal and regulatory requirements. Inventory Solutions Desktop and mobile tools to help manage and merchandise inventory to achieve faster turns and higher profits.
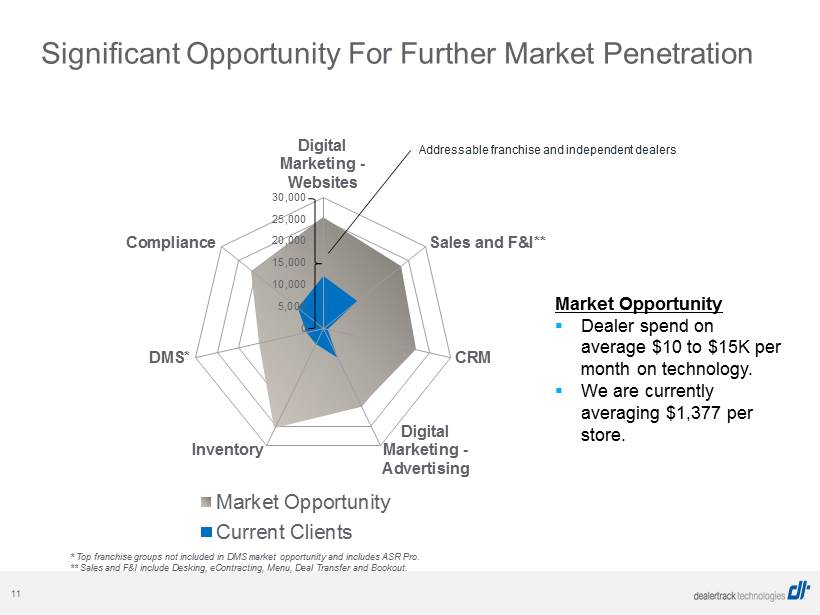
11 0 5,000 10,000 15,000 20,000 25,000 30,000 Digital Marketing - Websites Sales and F&I** CRM Digital Marketing - Advertising Inventory DMS* Compliance Market Opportunity Current Clients Significant Opportunity For Further Market Penetration * Top franchise groups not included in DMS market opportunity and includes ASR Pro. ** Sales and F&I include Desking, eContracting, Menu, Deal Transfer and Bookout. Addressable franchise and independent dealers Market Opportunity ▪ Dealer spend on average $10 to $15K per month on technology. ▪ We are currently averaging $ 1,377 per store .
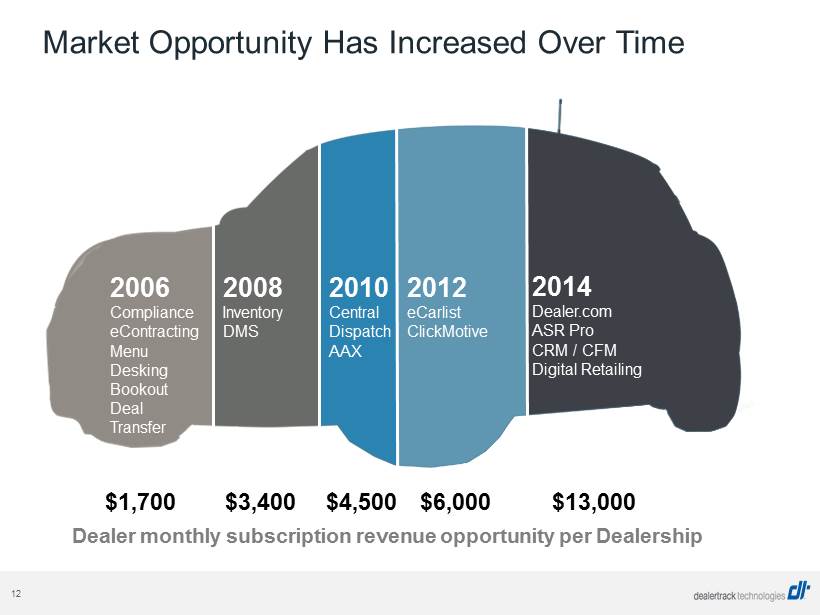
12 Market Opportunity Has Increased Over Time 2006 Compliance eContracting Menu Desking Bookout Deal Transfer 2008 Inventory DMS 2014 Dealer.com ASR Pro CRM / CFM Digital Retailing 2010 Central Dispatch AAX 2012 eCarlist ClickMotive $1,700 $3,400 $ 4,500 $6,000 $13,000 Dealer monthly subscription revenue opportunity per Dealership

13 Growing Number of Transactions in Car Buying Process Processing an increasing number of transactions on a single car sale through Dealertrack’s network * Verification services can either be transaction or subscription revenue. ** Additional contract related transactions can occur based on lenders’ participation in digital document services. Note: Not all cars sold are processed through the Dealertrack’s network. Dollar amounts are illustrative of US pricing and may not reflect actual pricing. Dealer Dealer Lender Lender Lender Verify ID* and pull credit bureau Submit credit application Process contract** Vehicle registration Title and lien administration ~1 to 2 transactions ~2 to 4 transactions ~1 to 2 transactions ~1 transaction ~1 to 2 transactions $0.05 to $1.00 $1.50 to $5.00 $2.50 to $5.00 $2.00 to $25.00 $1.50 to $5.00 $29.00 Revenue Potential per Car Sold
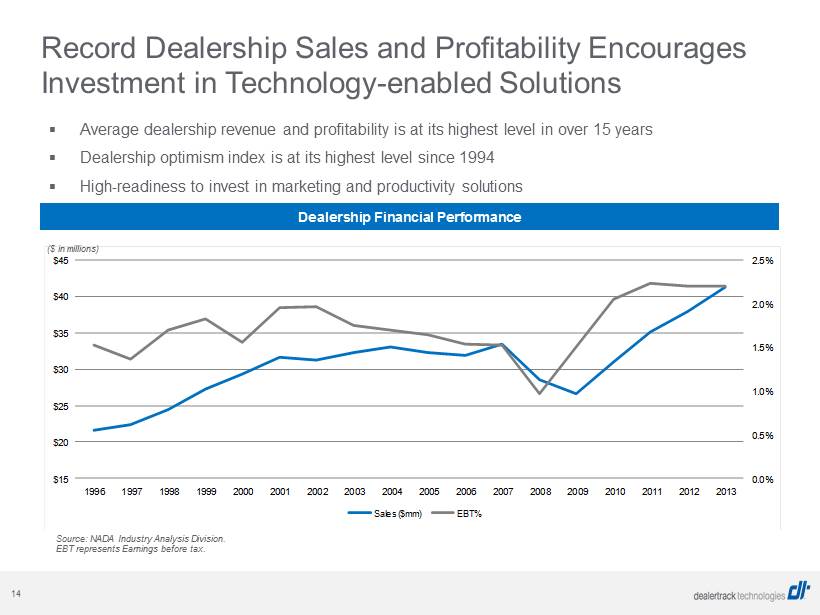
14 ▪ Average dealership revenue and profitability is at its highest level in over 15 years ▪ Dealership optimism index is at its highest level since 1994 ▪ High - readiness to invest in marketing and productivity solutions Source: NADA Industry Analysis Division. EBT represents Earnings before tax. Record Dealership Sales and Profitability Encourages Investment in Technology - enabled Solutions Dealership Financial Performance 0.0% 0.5% 1.0% 1.5% 2.0% 2.5% $15 $20 $25 $30 $35 $40 $45 1996 1997 1998 1999 2000 2001 2002 2003 2004 2005 2006 2007 2008 2009 2010 2011 2012 2013 Sales ($mm) EBT% ( $ in millions)
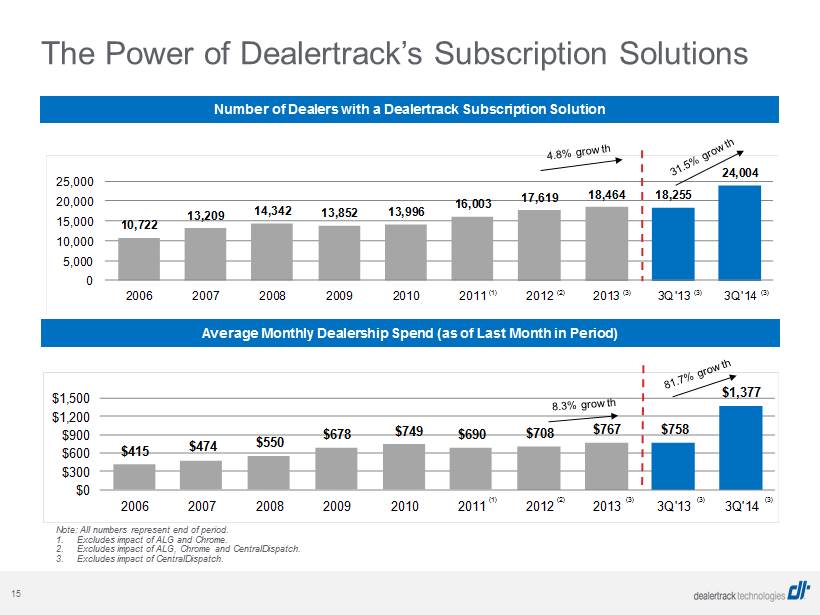
15 $415 $474 $550 $678 $749 $690 $708 $767 $758 $1,377 $0 $300 $600 $900 $1,200 $1,500 2006 2007 2008 2009 2010 2011 2012 2013 3Q'13 3Q'14 10,722 13,209 14,342 13,852 13,996 16,003 17,619 18,464 18,255 24,004 0 5,000 10,000 15,000 20,000 25,000 2006 2007 2008 2009 2010 2011 2012 2013 3Q'13 3Q'14 The Power of Dealertrack’s Subscription Solutions Note: All numbers represent end of period. 1. Excludes impact of ALG and Chrome. 2. Excludes impact of ALG, Chrome and CentralDispatch. 3. Excludes impact of CentralDispatch. Number of Dealers with a Dealertrack Subscription Solution Average Monthly Dealership Spend (as of Last Month in Period) (1) (2) (3) (3) (3) (1) (2) (3) (3) (3)

16 Transaction - Based Solutions F&I Solutions Largest online credit application processing networks in the U.S. and Canada Processing Solutions Electronic motor vehicle registration, lien and titling, and digital document services

17 How Transaction Revenue Grows Faster Than Car Sales 7.8% 3.1% 3.9% 2.0% 5.1% Q2 2013 vs. Q2 2014 5.5% 2.4% 0.3% 2.8% 7.6% Q3 2013 vs. Q3 2014 Acquired Revenue Car Sales Higher % of Vehicles Financed Improving Credit Increased Market Share Drivers of Market Share: ▪ Adding new lenders and dealers to the network ▪ Driving higher utilization of products from existing participants ▪ Expanding RTS opportunities by adding additional states

18 0.60 0.65 0.70 0.75 0.80 0.85 0.90 0.95 1.00 Jan-08 Apr-08 Jul-08 Oct-08 Jan-09 Apr-09 Jul-09 Oct-09 Jan-10 Apr-10 Jul-10 Oct-10 Jan-11 Apr-11 Jul-11 Sep-11 Dec-11 Mar-12 Jun-12 Sep-12 Dec-12 Mar-13 Jun-13 Sep-13 Dec-13 Mar-14 Jun-14 Sep-14 Submissions per unique applicant have been rising back to 2008 levels. Source: New car sales – Automotive News. Used car sales – CNW Research. Today: 0.89 Trough, July 2009: 0.67 Transaction Revenue Drivers Increasing Application Submissions Monthly Submissions per Applicant for New and Used Cars
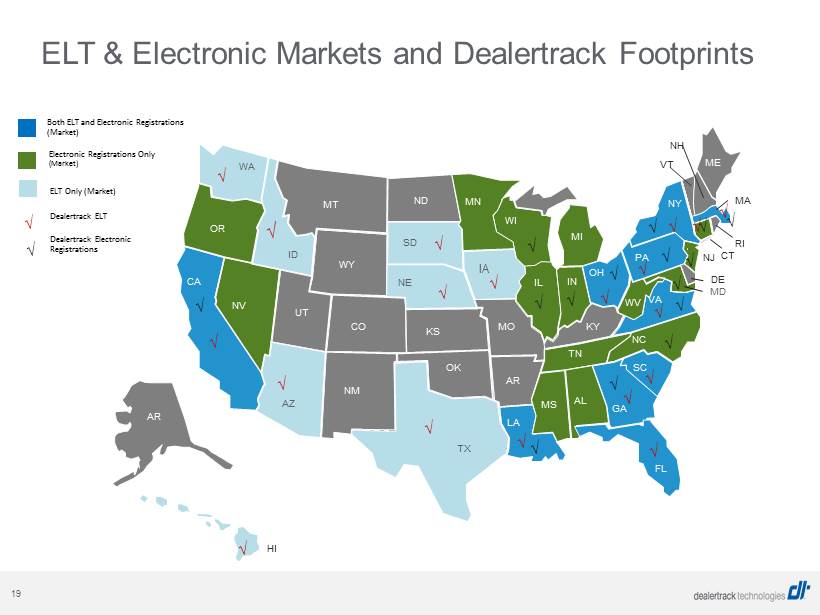
19 ELT & Electronic Markets and Dealertrack Footprints Dealertrack ELT Dealertrack Electronic Registrations Both ELT and Electronic Registrations (Market) Electronic Registrations Only (Market) ELT Only (Market) NM CO UT NV OR MT ND WY KS OK AR MO LA MS AL TN KY MN WI MI IL IN OH CA AR AZ TX WA ID SD NE IA FL GA SC NC VA WV PA NY ME NH VT HI MD DE NJ CT RI MA √ √ √ √ √ √ √ √ √ √ √ √ √ √ √ √ √ √ √ √ √ √ √ √ √ √ √ √ √ √ √ √ √ √ √ √

20 Transaction Revenue Drivers: Car Sales Continue to Improve New Car Sales by Franchised Dealers Used Car Sales by Franchised Dealers (units in millions) TRAK Guidance (units in millions) Two primary drivers of Dealertrack’s transaction revenue are car sales and consumer credit availability. TRAK Guidance Source: New car sales – Automotive News. Used car sales – CNW Research. 16.9 17.0 16.5 16.2 13.2 10.4 11.6 12.8 14.5 15.6 16.2 0.0 2.0 4.0 6.0 8.0 10.0 12.0 14.0 16.0 18.0 2004 2005 2006 2007 2008 2009 2010 2011 2012 2013 2014E 16.0 16.5 14.3 14.3 13.2 12.8 12.8 13.8 14.9 15.7 15.9 0.0 2.0 4.0 6.0 8.0 10.0 12.0 14.0 16.0 18.0 2004 2005 2006 2007 2008 2009 2010 2011 2012 2013 2014E 2014 car sales (new + used) from franchise dealers are trending to 32.1 million units based on historical seasonality and YTD sales as of 9/30/14
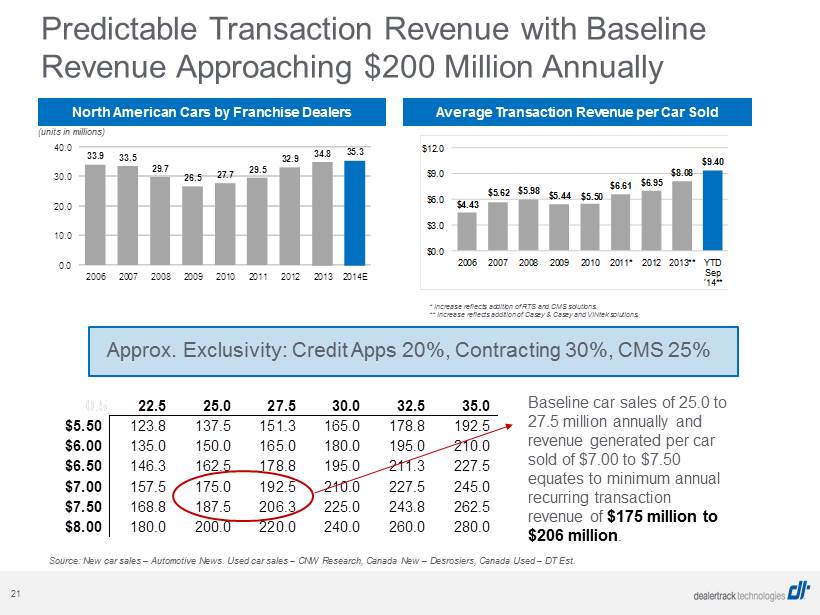
21 0.5 22.5 25.0 27.5 30.0 32.5 35.0 $5.50 123.8 137.5 151.3 165.0 178.8 192.5 $6.00 135.0 150.0 165.0 180.0 195.0 210.0 $6.50 146.3 162.5 178.8 195.0 211.3 227.5 $7.00 157.5 175.0 192.5 210.0 227.5 245.0 $7.50 168.8 187.5 206.3 225.0 243.8 262.5 $8.00 180.0 200.0 220.0 240.0 260.0 280.0 Predictable Transaction Revenue with Baseline Revenue Approaching $200 Million Annually North American Cars by Franchise Dealers (units in millions) Source: New car sales – Automotive News. Used car sales – CNW Research, Canada New – Desrosiers, Canada Used – DT Est. Average Transaction Revenue per Car Sold Approx. Exclusivity: Credit Apps 20%, Contracting 30%, CMS 25% Baseline car sales of 25.0 to 27.5 million annually and revenue generated per car sold of $7.00 to $7.50 equates to minimum annual recurring transaction revenue of $175 million to $206 million . * Increase reflects addition of RTS and CMS solutions. ** Increase reflects addition of Casey & Casey and VINtek solutions. 33.9 33.5 29.7 26.5 27.7 29.5 32.9 34.8 35.3 0.0 10.0 20.0 30.0 40.0 2006 2007 2008 2009 2010 2011 2012 2013 2014E $4.43 $5.62 $5.98 $5.44 $5.50 $6.61 $6.95 $8.08 $9.40 $0.0 $3.0 $6.0 $9.0 $12.0 2006 2007 2008 2009 2010 2011* 2012 2013** YTD Sep '14**
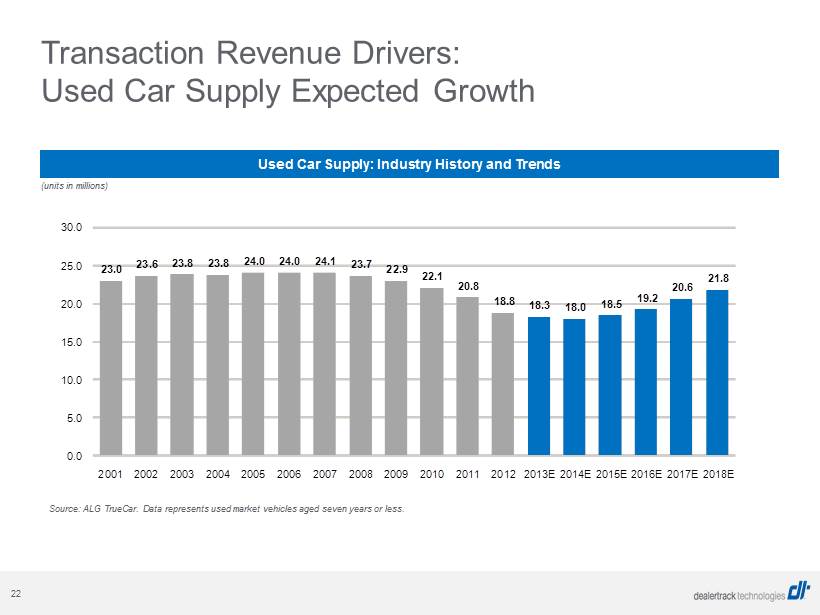
22 Transaction Revenue Drivers: Used Car Supply Expected Growth Used Car Supply: Industry History and Trends 23.0 23.6 23.8 23.8 24.0 24.0 24.1 23.7 22.9 22.1 20.8 18.8 18.3 18.0 18.5 19.2 20.6 21.8 0.0 5.0 10.0 15.0 20.0 25.0 30.0 2001 2002 2003 2004 2005 2006 2007 2008 2009 2010 2011 2012 2013E 2014E 2015E 2016E 2017E 2018E (units in millions) Source: ALG TrueCar. Data represents used market vehicles aged seven years or less.

23 Digital Marketing Solutions Websites An optimal experience from every device - desktop, mobile or tablet Digital Retailing Flexible workflow solutions for easier pricing and purchasing Advertising Retargeting, paid search, display, and social media to reach the most relevant audience everywhere

24 Source: *Polk ”How the Internet is changing the vehicle shopping process.” August 2013. **Statista “Breakdown of U.S. car dealers’ advertising spending from 2002 to 2013 by medium.” Current Car Shopping Data
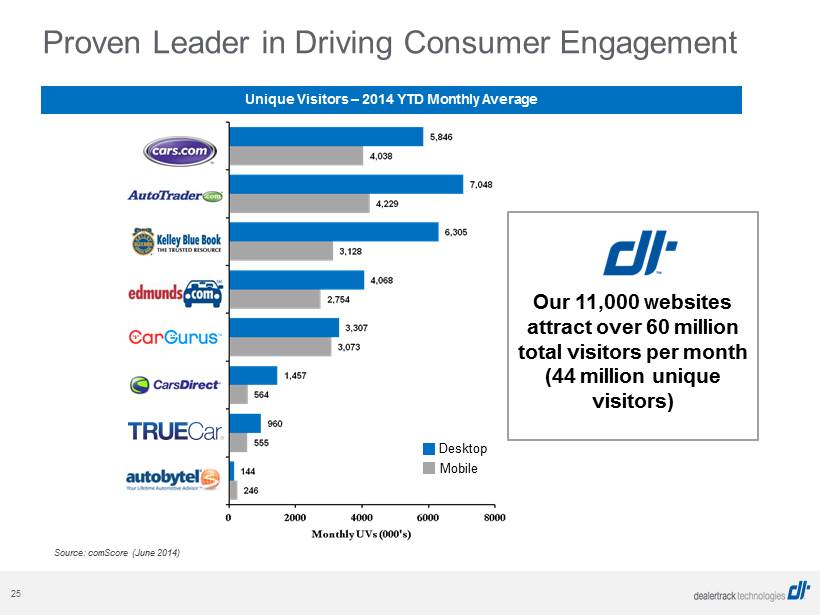
25 Source: comScore (June 2014) Proven Leader in Driving Consumer Engagement Unique Visitors – 2014 YTD Monthly Average Desktop Mobile Our 11,000 websites attract over 60 million total visitors per month (44 million unique visitors)
26
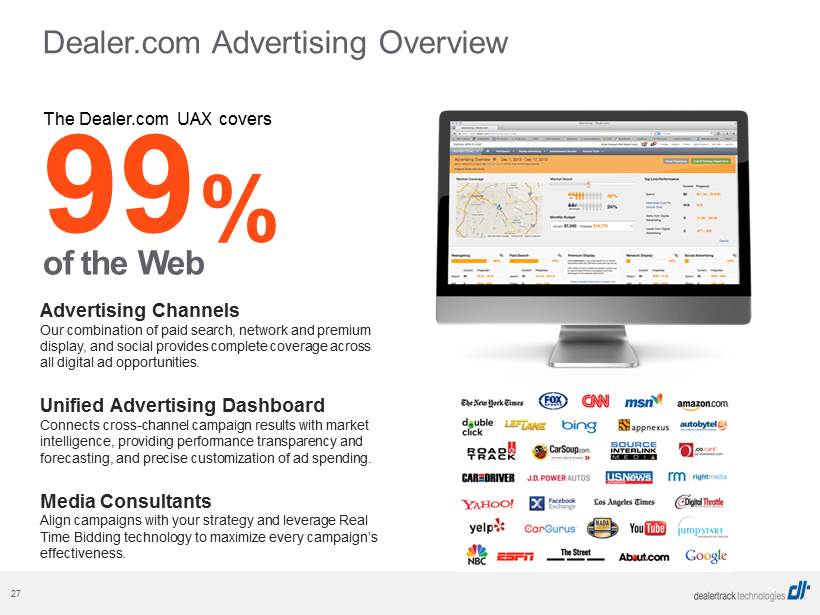
27 Advertising Channels Our combination of paid search, network and premium display, and social provides complete coverage across all digital ad opportunities. Unified Advertising Dashboard Connects cross - channel campaign results with market intelligence, providing performance transparency and forecasting, and precise customization of ad spending. Media Consultants Align campaigns with your strategy and leverage Real Time Bidding technology to maximize every campaign’s effectiveness. 99 The Dealer.com UAX covers of the Web % Dealer.com Advertising Overview
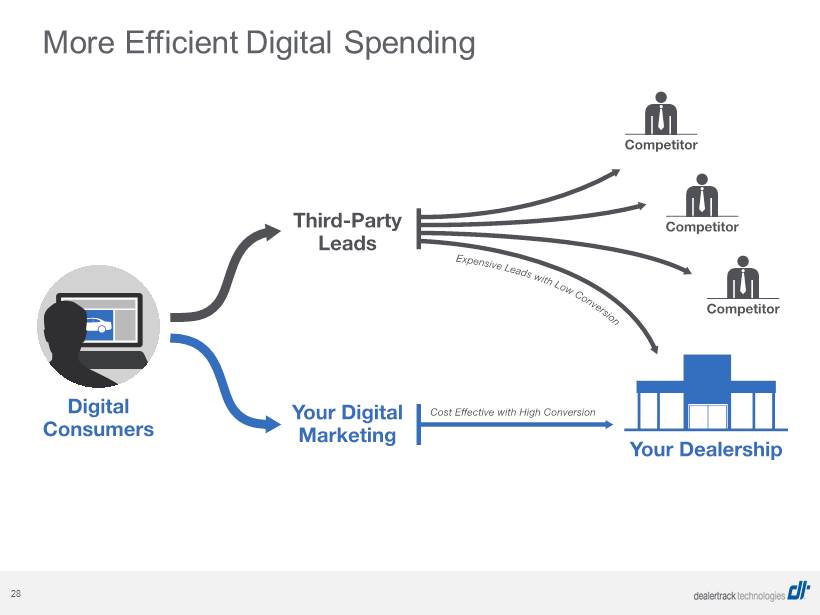
28 More Efficient Digital Spending
29 Growth Strategy & Financial Results

30 Dealertrack’s Core Growth Strategy • New lender relationships • New subscribing dealer relationships Additional Market Share Gains • Providing a comprehensive suite of solutions makes marketing and cross - selling easier • Increases stickiness of customer relationships • Better facilitates end - to - end workflow solutions Greater Wallet Share of Existing Customers • Innovate new features, functions and integration for products • Add value to subscription products to improve dealership efficiency and profitability • Enhance core credit application functionality New Products and Services • Acquire complementary technologies and services to increase operating leverage • Leverage our networks for distribution of new products and services Strategic Acquisitions

31 M&A Complements Organic Growth 2013 2014 - Credit App 1.0 - Desking - PaymentTrack - eContracting - NADA BookOut - Website Plus - WebAlg - CreditConnection - dealerAccess - LeaseLink - IPO - Launch eMenu - DealWatch - Desking - SalesMaker - InventoryPro - GoBig Menu - ALG (sold 10/1/11) - Chrome (JV 1/1/12) - DealerWire - DealerWare - GlobalFax - OpenTrack - Inventory 3.0 - iOS - Price Driver - Canada DMS - SmartFind - PaymentDriver - FinanceDriver - eMenu for iPad - Inventory+ - DMS 2.0 - DT 2.0 (Honda) - TradeDriver - Arkona - Curomax - ASM - AAX - TradeTracker - Polk AIC - triVIN - CentralDispatch - ClickMotive - iCONNECT - eCarlist - Casey & Casey - CFM - VINtek - Nexteppe Vision: Deliver the market leading suite of integrated technologies capable of transforming auto retailing - Dealer.com - ASR Pro
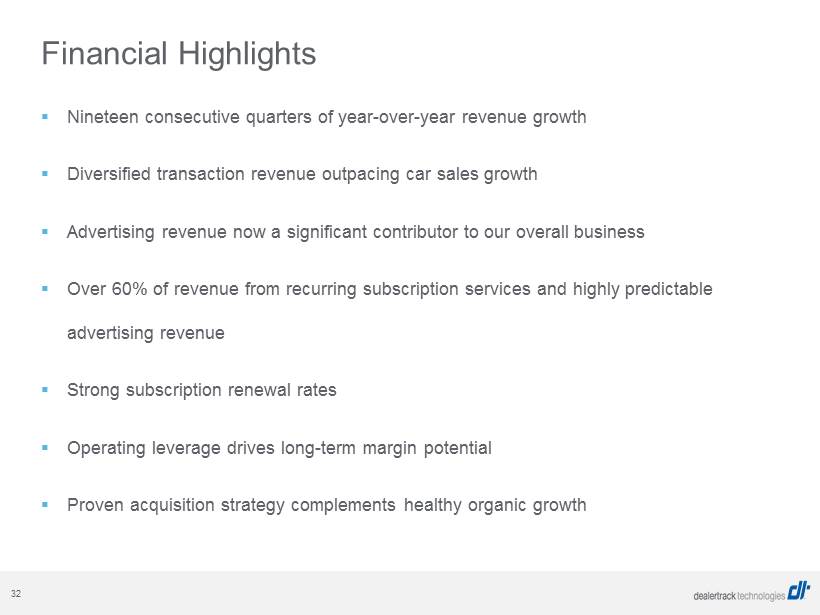
32 ▪ Nineteen consecutive quarters of year - over - year revenue growth ▪ Diversified transaction revenue outpacing car sales growth ▪ Advertising revenue now a significant contributor to our overall business ▪ Over 60% of revenue from recurring subscription services and highly predictable advertising revenue ▪ Strong subscription renewal rates ▪ Operating leverage drives long - term margin potential ▪ Proven acquisition strategy complements healthy organic growth Financial Highlights
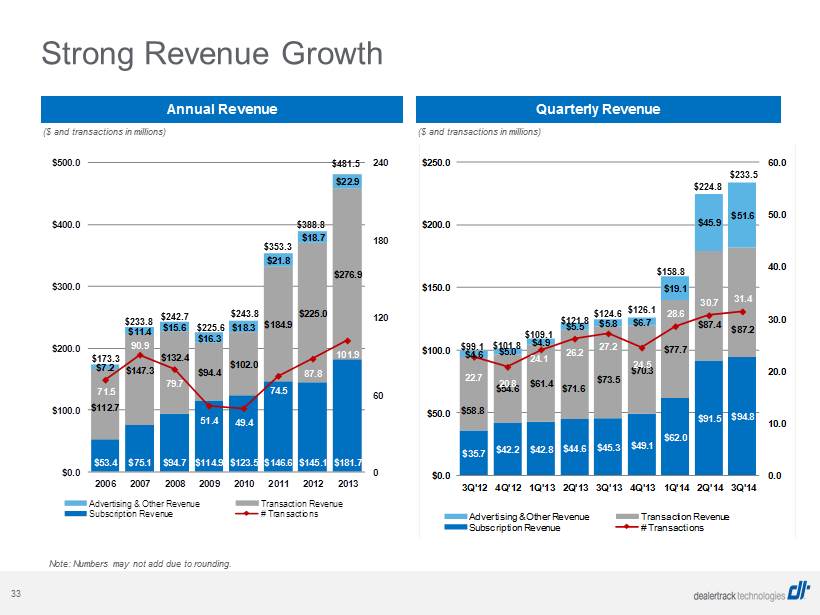
33 Strong Revenue Growth Annual Revenue Quarterly Revenue $53.4 $75.1 $94.7 $114.9 $123.5 $146.6 $145.1 $181.7 $112.7 $147.3 $132.4 $94.4 $102.0 $184.9 $225.0 $276.9 $7.2 $11.4 $15.6 $16.3 $18.3 $21.8 $18.7 $22.9 71.5 90.9 79.7 51.4 49.4 74.5 87.8 101.9 0 60 120 180 240 $0.0 $100.0 $200.0 $300.0 $400.0 $500.0 2006 2007 2008 2009 2010 2011 2012 2013 Advertising & Other Revenue Transaction Revenue Subscription Revenue # Transactions $173.3 $233.8 $242.7 $225.6 $243.8 $353.3 $388.8 $35.7 $42.2 $42.8 $44.6 $45.3 $49.1 $62.0 $91.5 $94.8 $58.8 $54.6 $61.4 $71.6 $73.5 $70.3 $77.7 $87.4 $87.2 $4.6 $5.0 $4.9 $5.5 $5.8 $6.7 $19.1 $45.9 $51.6 22.7 20.8 24.1 26.2 27.2 24.5 28.6 30.7 31.4 0.0 10.0 20.0 30.0 40.0 50.0 60.0 $0.0 $50.0 $100.0 $150.0 $200.0 $250.0 3Q'12 4Q'12 1Q'13 2Q'13 3Q'13 4Q'13 1Q'14 2Q'14 3Q'14 Advertising & Other Revenue Transaction Revenue Subscription Revenue # Transactions $101.8 $109.1 $99.1 $121.8 ($ and transactions in millions) ($ and transactions in millions) Note: Numbers may not add due to rounding. $124.6 $481.5 $126.1 $158.8 $224.8 $233.5
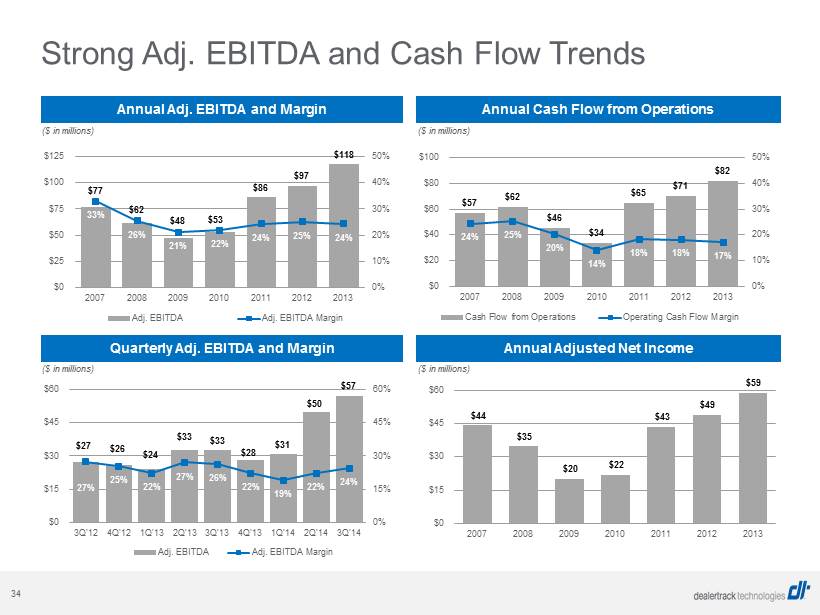
34 $77 $62 $48 $53 $86 $97 $118 33% 26% 21% 22% 24% 25% 24% 0% 10% 20% 30% 40% 50% $0 $25 $50 $75 $100 $125 2007 2008 2009 2010 2011 2012 2013 Adj. EBITDA Adj. EBITDA Margin $27 $26 $24 $33 $33 $28 $31 $50 $57 27% 25% 22% 27% 26% 22% 19% 22% 24% 0% 15% 30% 45% 60% $0 $15 $30 $45 $60 3Q'12 4Q'12 1Q'13 2Q'13 3Q'13 4Q'13 1Q'14 2Q'14 3Q'14 Adj. EBITDA Adj. EBITDA Margin $57 $62 $46 $34 $65 $71 $82 24% 25% 20% 14% 18% 18% 17% 0% 10% 20% 30% 40% 50% $0 $20 $40 $60 $80 $100 2007 2008 2009 2010 2011 2012 2013 Cash Flow from Operations Operating Cash Flow Margin $44 $35 $20 $22 $43 $49 $59 $0 $15 $30 $45 $60 2007 2008 2009 2010 2011 2012 2013 ($ in millions) ($ in millions) Annual Adj. EBITDA and Margin Annual Cash Flow from Operations Quarterly Adj. EBITDA and Margin Annual Adjusted Net Income ($ in millions) ($ in millions) Strong Adj. EBITDA and Cash Flow Trends

35 Appendix

36 Other niche players (Compliance / Menu / Desking) Other niche players Note: Selected list may not include all competitors. DMS / Sales Subscription Products Credit Application Network Vehicle Registration / Title Management Inventory Management Solutions Digital Marketing Solutions (Websites & Advertising) Selected Competitive Landscape
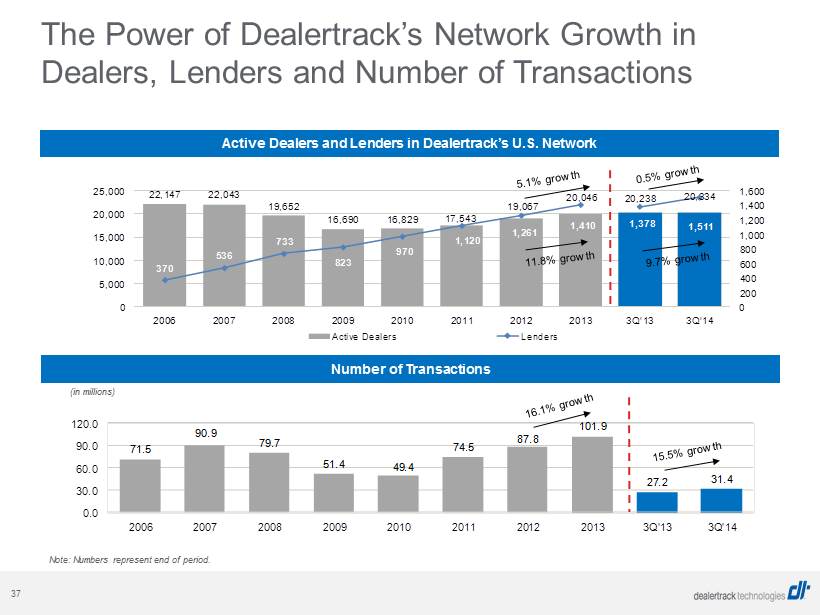
37 22,147 22,043 19,652 16,690 16,829 17,543 19,067 20,046 20,238 20,334 370 536 733 823 970 1,120 1,261 1,410 1,378 1,511 0 200 400 600 800 1,000 1,200 1,400 1,600 0 5,000 10,000 15,000 20,000 25,000 2006 2007 2008 2009 2010 2011 2012 2013 3Q'13 3Q'14 Active Dealers Lenders Active Dealers and Lenders in Dealertrack’s U.S. Network Note: Numbers represent end of period. Number of Transactions (in millions) 71.5 90.9 79.7 51.4 49.4 74.5 87.8 101.9 27.2 31.4 0.0 30.0 60.0 90.0 120.0 2006 2007 2008 2009 2010 2011 2012 2013 3Q'13 3Q'14 The Power of Dealertrack’s Network Growth in Dealers, Lenders and Number of Transactions
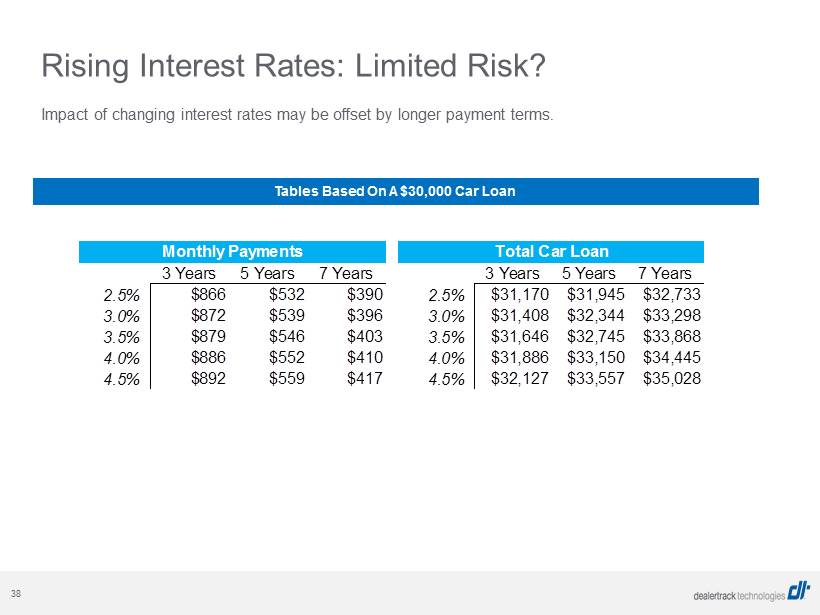
38 Rising Interest Rates: Limited Risk? Impact of changing interest rates may be offset by longer payment terms. Tables Based On A $30,000 Car Loan Monthly Payments Total Car Loan 3 Years 5 Years 7 Years 3 Years 5 Years 7 Years 2.5% $866 $532 $390 2.5% $31,170 $31,945 $32,733 3.0% $872 $539 $396 3.0% $31,408 $32,344 $33,298 3.5% $879 $546 $403 3.5% $31,646 $32,745 $33,868 4.0% $886 $552 $410 4.0% $31,886 $33,150 $34,445 4.5% $892 $559 $417 4.5% $32,127 $33,557 $35,028
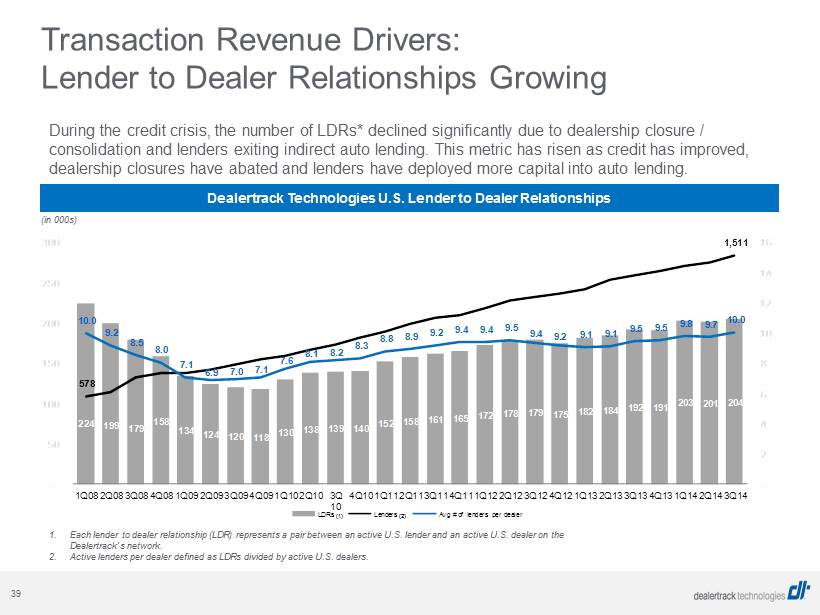
39 During the credit crisis, the number of LDRs* declined significantly due to dealership closure / consolidation and lenders exiting indirect auto lending. This metric has risen as credit has improved, dealership closures have abated and lenders have deployed more capital into auto lending. 1. Each lender to dealer relationship (LDR) represents a pair between an active U.S. lender and an active U.S. dealer on the Dealertrack’s network. 2. Active lenders per dealer defined as LDRs divided by active U.S. dealers. Transaction Revenue Drivers: Lender to Dealer Relationships Growing Dealertrack Technologies U.S. Lender to Dealer Relationships (in 000s) (1) (2) 224 199 179 158 134 124 120 118 130 138 139 140 152 158 161 165 172 178 179 175 182 184 192 191 203 201 204 578 1,511 10.0 9.2 8.5 8.0 7.1 6.9 7.0 7.1 7.6 8.1 8.2 8.3 8.8 8.9 9.2 9.4 9.4 9.5 9.4 9.2 9.1 9.1 9.5 9.5 9.8 9.7 10.0 - 2 4 6 8 10 12 14 16 - 50 100 150 200 250 300 1Q08 2Q08 3Q08 4Q08 1Q09 2Q09 3Q09 4Q09 1Q10 2Q10 3Q 10 4Q10 1Q11 2Q11 3Q11 4Q11 1Q12 2Q12 3Q12 4Q12 1Q13 2Q13 3Q13 4Q13 1Q14 2Q14 3Q14 LDRs Lenders Avg # of lenders per dealer
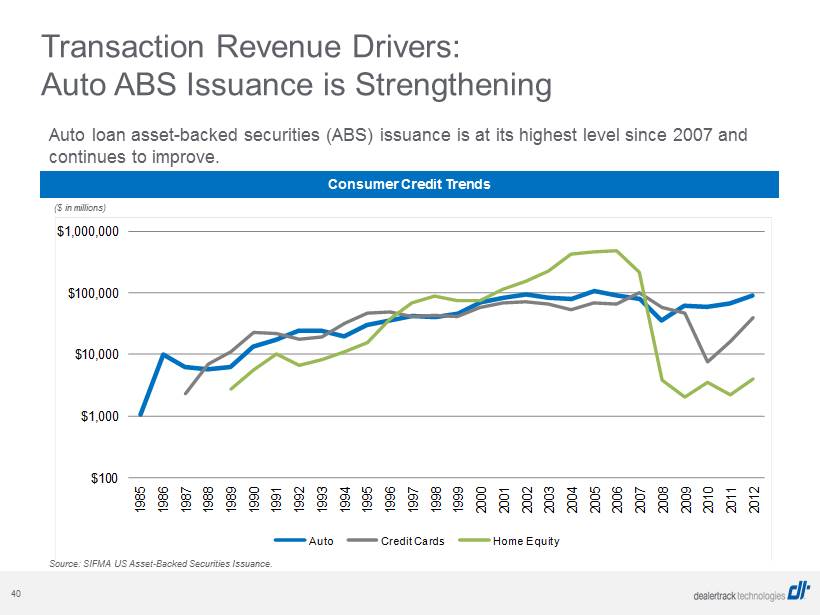
40 $100 $1,000 $10,000 $100,000 $1,000,000 1985 1986 1987 1988 1989 1990 1991 1992 1993 1994 1995 1996 1997 1998 1999 2000 2001 2002 2003 2004 2005 2006 2007 2008 2009 2010 2011 2012 Auto Credit Cards Home Equity ($ in millions) Auto loan asset - backed securities (ABS) issuance is at its highest level since 2007 and continues to improve. Source: SIFMA US Asset - Backed Securities Issuance. Transaction Revenue Drivers: Auto ABS Issuance is Strengthening Consumer Credit Trends

41 ($ in millions) Wage Growth Is Correlated To Financed Used Car Sales Wages and % of Used Units Financed 0.0% 12.0% 24.0% 36.0% 48.0% 60.0% $0.0 $2.0 $4.0 $6.0 $8.0 $10.0 1997 1998 1999 2000 2001 2002 2003 2004 2005 2006 2007 2008 2009 2010 2011 2012 Aggregate Wages Used Units Financed as % of Totals Used Sales Source: Social Security Administration. 2013 data not available.
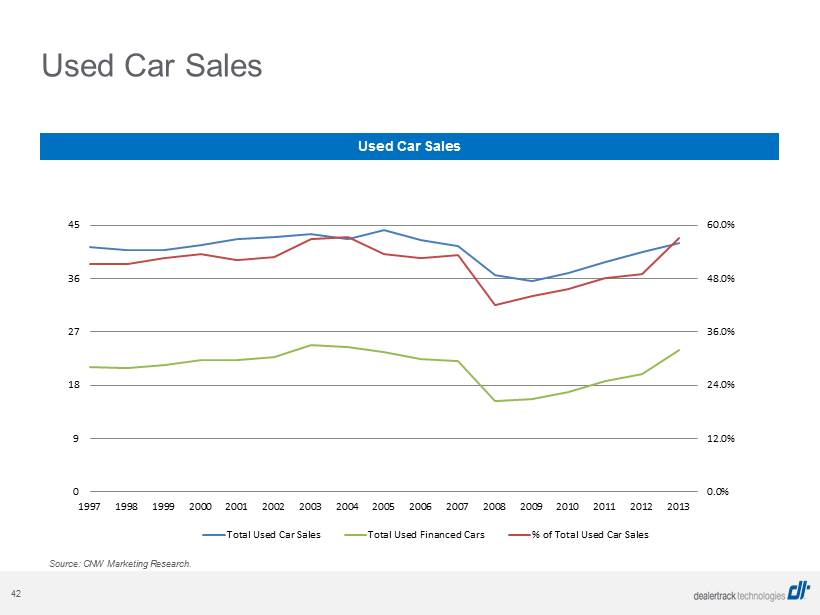
42 Used Car Sales Used Car Sales Source: CNW Marketing Research. 0.0% 12.0% 24.0% 36.0% 48.0% 60.0% 0 9 18 27 36 45 1997 1998 1999 2000 2001 2002 2003 2004 2005 2006 2007 2008 2009 2010 2011 2012 2013 Total Used Car Sales Total Used Financed Cars % of Total Used Car Sales

43 New and Used Car Sales 2014 Growth 3Q13 4Q13 1Q14 2Q14 Jul-14 Aug-14 Sep-14 3Q14 Y/Y Q/Q SAAR 1 15,710 15,710 15,650 16,572 16,500 17,530 16,440 16,823 7.1% 1.5% Actual Units 1 3,952 3,809 3,741 4,423 1,436 1,586 1,246 4,268 8.0% (3.5%) Fleet 2 557 601 783 878 208 208 234 650 16.7% (25.9%) Retail 3,396 3,208 2,958 3,545 1,228 1,379 1,012 3,618 6.6% 2.1% Financed 3 2,920 2,714 2,446 3,060 1,061 1,211 855 3,127 7.1% 2.2% Cash 4 475 493 513 486 167 167 157 491 3.3% 1.1% Actual Units 5 4,733 3,682 2,677 4,662 1,664 1,460 1,504 4,628 (2.2%) (0.7%) USED Financed 5 3,352 2,677 1,904 3,339 1,200 1,043 1,071 3,314 (1.1%) (0.7%) Cash 5 1,381 1,006 773 1,323 465 417 433 1,314 (4.8%) (0.7%) Actual Units 8,686 7,491 6,418 9,085 3,100 3,046 2,750 8,896 2.4% (2.1%) Retail Units 8,129 6,890 5,635 8,207 2,892 2,838 2,516 8,246 1.4% 0.5% TOTAL Fleet 557 601 783 878 208 208 234 650 16.7% (25.9%) Financed 6,273 5,391 4,350 6,398 2,261 2,254 1,926 6,441 2.7% 0.7% Cash 1,856 1,499 1,286 1,809 631 584 590 1,805 (2.7%) (0.2%) NEW (1) Source: Automotive News. (2) Source: JD Power. (3) Estimated. (4) Source: AutoCount. (5) Source: CNW Marketing Research. U.S. - New and Used Car Sales (in 000s) Note: Numbers may not add due to rounding.
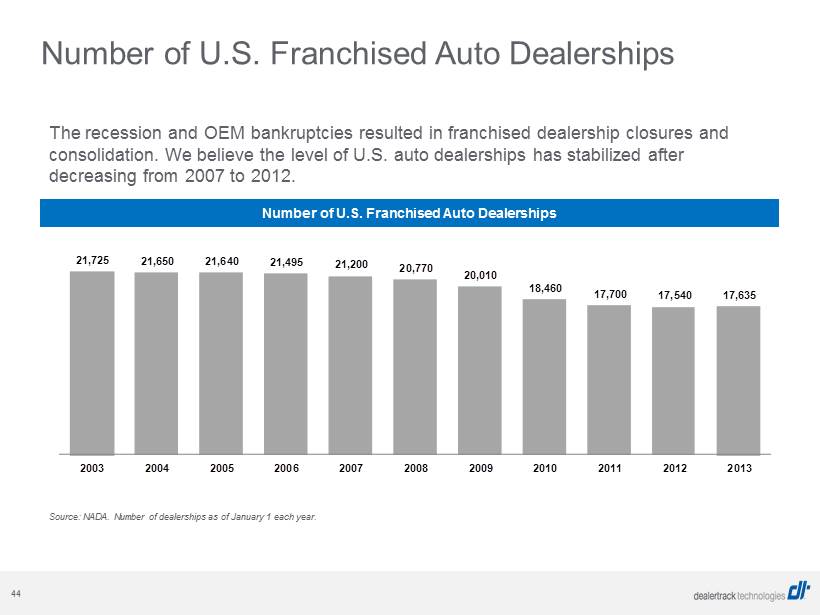
44 The recession and OEM bankruptcies resulted in franchised dealership closures and consolidation. We believe the level of U.S. auto dealerships has stabilized after decreasing from 2007 to 2012. 21,725 21,650 21,640 21,495 21,200 20,770 20,010 18,460 17,700 17,540 17,635 2003 2004 2005 2006 2007 2008 2009 2010 2011 2012 2013 Source: NADA. Number of dealerships as of January 1 each year. Number of U.S. Franchised Auto Dealerships Number of U.S. Franchised Auto Dealerships

45 Reconciliation of GAAP Net Income to Non - GAAP Financial Measures by Income Statement Category GAAP Non-GAAP As Reported Adjusted 2014 Ref 2013 Three Months Ended September 30, 2014 Net Loss Ref Adjustments Net Income Ref GAAP net income (loss) 2,108$ 5,795$ Net revenue 233,520$ A 1,375 234,895$ Adjustments: Cost of revenue 125,245 B (21,151) 104,094 Interest expense - non-cash (not tax-impacted) 3,100 E 2,377 Research and development 26,451 C (1,308) 25,143 Amortization of acquired identifiable intangibles 20,828 1 7,761 Selling, general and administrative 72,689 D (8,169) 64,520 Stock-based compensation 4,333 2 3,603 Total operating expenses 224,385 (30,628) 193,757 Contra-revenue 1,375 A 1,069 Income from operations 9,135 32,003 41,138 Acquisition-related and other professional fees 315 D 1,365 Interest expense, net (8,965) E 3,195 (5,770) J Acquisition-related contingent consideration changes and compensation expense, net 1,654 3 57 Other income, net 123 - 123 Integration and other related costs 3,593 4 1,023 Earnings from equity method investment, net 2,079 F 547 2,626 Rebranding expense - D 155 Loss before benefit from income taxes, net 2,372 35,745 38,117 Amortization of equity method investment basis difference 547 F 706 Benefit from income taxes, net (264) G (12,537) (12,801) K Realized gain on sale of previously impaired securities - (356) Net loss 2,108$ 23,208$ 25,316$ Amended state tax returns impact (non-taxable) - (75) Tax impact of adjustments (12,537) G (5,834) EBITDA Adjustments: Adjusted net income (non-GAAP) 25,316$ 17,646$ Depreciation and amortization 13,380$ H Interest expense, net 5,770 J Additional classification details: Provision for income taxes, net 12,801 K Amortization of acquired identifiable intangibles 20,828$ 1 7,761$ Adjusted EBITDA 57,267$ Revenue - A 13 Cost of revenue 20,828 B 7,748 GAAP Non-GAAP Stock-based compensation 4,333$ 2 3,603$ As Reported Adjusted Cost of revenue 274 B 244 Three Months Ended September 30, 2013 Net Loss Ref Adjustments Net Income Ref Research and development 793 C 599 Selling, general and administrative 3,266 D 2,760 Net revenue 124,582$ A 1,082 125,664$ Cost of revenue 53,858 B (8,792) 45,066 Acquisition-related contingent consideration changes and compensation expense, net 1,654$ 3 57$ Research and development 18,447 C (608) 17,839 Cost of revenue - B 37 Selling, general and administrative 45,365 D (4,551) 40,814 Research and development 36 C 9 Total operating expenses 117,670 (13,951) 103,719 Selling, general and administrative 1,618 D 11 Income from operations 6,912 15,033 21,945 Interest expense, net (3,058) E 2,377 (681) J Integration and other related costs 3,593$ 4 1,023$ Other income, net 419 (356) 63 Cost of revenue 49 B 763 Earnings from equity method investment, net 1,544 F 706 2,250 Research and development 479 C - Income before provision for income taxes, net 5,817 17,760 23,577 Selling, general and administrative 2,970 D 260 Provision for income taxes, net (22) G (5,909) (5,931) K Interest Expense 95 E Net income 5,795$ 11,851$ 17,646$ Depreciation and amortization 13,380$ H 8,331$ Cost of revenue 9,401 6,646 EBITDA Adjustments: Research and development 1,182 137 Depreciation and amortization 8,331$ H Selling, general and administrative 2,884 1,548 Interest expense, net 681 J Fixed asset accelerated amortization / depreciation (87) - Provision for income taxes, net 5,931 K Adjusted EBITDA 32,589$ (Unaudited) (Unaudited) Three Months Ended September 30, DEALERTRACK TECHNOLOGIES, INC. DEALERTRACK TECHNOLOGIES, INC. Reconciliation of GAAP Net (Loss) Income to Non-GAAP Adjusted Net Income Proforma Reconciliation of GAAP Net (Loss) Income to Non-GAAP Measures (Dollars in thousands) (Dollars in thousands)
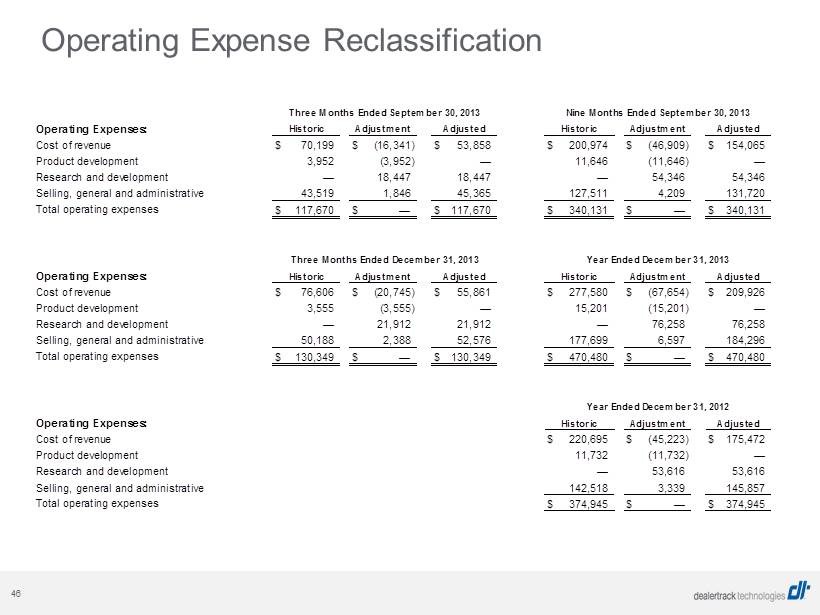
46 Operating Expense Reclassification Operating Expenses: Cost of revenue $ 70,199 $ (16,341) $ 53,858 $ 200,974 $ (46,909) $ 154,065 Product development 3,952 (3,952) — 11,646 (11,646) — Research and development — 18,447 18,447 — 54,346 54,346 Selling, general and administrative 43,519 1,846 45,365 127,511 4,209 131,720 Total operating expenses $ 117,670 $ — $ 117,670 $ 340,131 $ — $ 340,131 Operating Expenses: Cost of revenue $ 76,606 $ (20,745) $ 55,861 $ 277,580 $ (67,654) $ 209,926 Product development 3,555 (3,555) — 15,201 (15,201) — Research and development — 21,912 21,912 — 76,258 76,258 Selling, general and administrative 50,188 2,388 52,576 177,699 6,597 184,296 Total operating expenses $ 130,349 $ — $ 130,349 $ 470,480 $ — $ 470,480 Operating Expenses: Cost of revenue $ 220,695 $ (45,223) $ 175,472 Product development 11,732 (11,732) — Research and development — 53,616 53,616 Selling, general and administrative 142,518 3,339 145,857 Total operating expenses $ 374,945 $ — $ 374,945 Three Months Ended September 30, 2013 Nine Months Ended September 30, 2013 Historic Adjustment Adjusted Historic Adjustment Adjusted Year Ended December 31, 2012 Historic Adjustment Adjusted Three Months Ended December 31, 2013 Year Ended December 31, 2013 Historic Adjustment Adjusted Historic Adjustment Adjusted
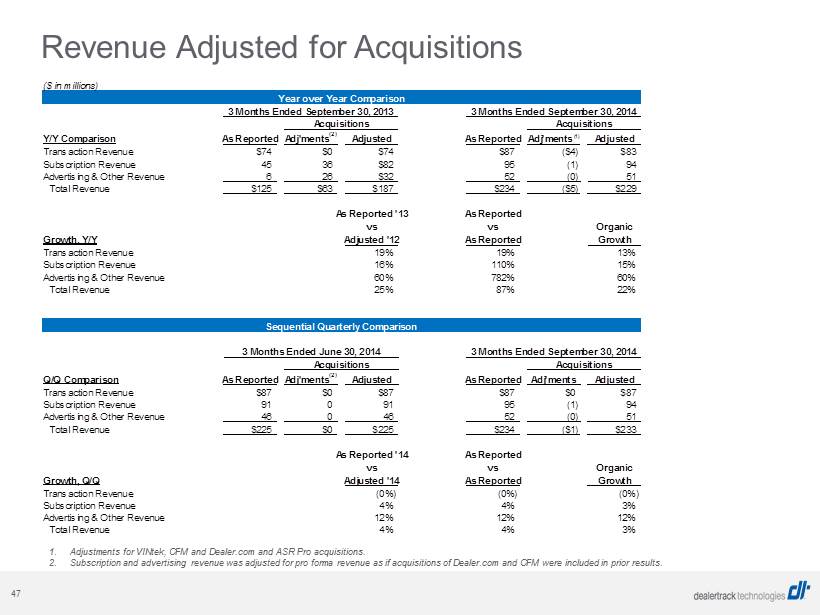
47 Revenue Adjusted for Acquisitions 1. Adjustments for VINtek, CFM and Dealer.com and ASR Pro acquisitions. 2. Subscription and advertising revenue was adjusted for pro forma revenue as if acquisitions of Dealer.com and CFM were includ ed in prior results. ($ in millions) Year over Year Comparison Acquisitions Acquisitions Acquisitions Y/Y Comparison As Reported Adj'ments (2) Adjusted As Reported Adj'ments (1) Adjusted Transaction Revenue $74 $0 $74 $87 ($4) $83 Subscription Revenue 45 36 $82 95 (1) 94 Advertising & Other Revenue 6 26 $32 52 (0) 51 Total Revenue $125 $63 $187 $234 ($5) $229 As Reported '13 As Reported vs vs Organic Growth, Y/Y Adjusted '12 As Reported Growth Transaction Revenue 19% 19% 13% Subscription Revenue 16% 110% 15% Advertising & Other Revenue 60% 782% 60% Total Revenue 25% 87% 22% Sequential Quarterly Comparison Acquisitions Acquisitions AcquiSitionS Q/Q Comparison As Reported Adj'ments (2) Adjusted As Reported Adj'ments Adjusted Transaction Revenue $87 $0 $87 $87 $0 $87 Subscription Revenue 91 0 91 95 (1) 94 Advertising & Other Revenue 46 0 46 52 (0) 51 Total Revenue $225 $0 $225 $234 ($1) $233 As Reported '14 As Reported vs vs Organic Growth, Q/Q Adjusted '14 As Reported Growth Transaction Revenue (0%) (0%) (0%) Subscription Revenue 4% 4% 3% Advertising & Other Revenue 12% 12% 12% Total Revenue 4% 4% 3% 3 Months Ended September 30, 2013 3 Months Ended June 30, 2014 3 Months Ended September 30, 2014 3 Months Ended September 30, 2014
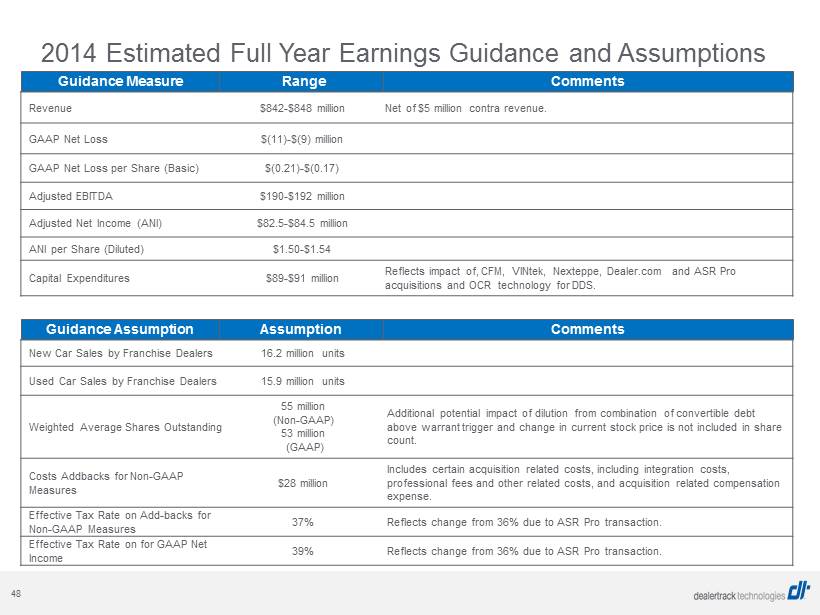
48 2014 Estimated Full Year Earnings Guidance and Assumptions New Car Sales by Franchise Dealers 16.2 million units Used Car Sales by Franchise Dealers 15.9 million units Weighted Average Shares Outstanding 55 million (Non - GAAP) 53 million (GAAP) Additional potential impact of dilution from combination of convertible debt above warrant trigger and change in current stock price is not included in share count. Costs Addbacks for Non - GAAP Measures $28 million Includes certain acquisition related costs, including integration costs, professional fees and other related costs, and acquisition related compensation expense. Effective Tax Rate on Add - backs for Non - GAAP Measures 37% Reflects change from 36% due to ASR Pro transaction. Effective Tax Rate on for GAAP Net Income 39% Reflects change from 36% due to ASR Pro transaction. Revenue $842 - $848 million Net of $5 million contra revenue. GAAP Net Loss $(11) - $(9) million GAAP Net Loss per Share (Basic) $(0.21) - $(0.17) Adjusted EBITDA $190 - $192 million Adjusted Net Income (ANI) $82.5 - $84.5 million ANI per Share (Diluted) $1.50 - $1.54 Capital Expenditures $89 - $91 million Reflects impact of, CFM, VINtek, Nexteppe, Dealer.com and ASR Pro acquisitions and OCR technology for DDS. Guidance Measure Range Comments Guidance Assumption Assumption Comments