Attached files
| file | filename |
|---|---|
| 8-K - 8-K - Bluerock Residential Growth REIT, Inc. | v393271_8k.htm |
Exhibit 99.1

REITWorld 2014

Forward - Looking Statements 2 The information in this presentation has been prepared solely for informational purposes by Bluerock Residential Growth REIT, Inc . (“BRG”) and does not constitute an offer to sell or the solicitation of an offer to purchase any securities . Neither the U . S . Securities and Exchange Commission (“Commission”) nor any other regulatory body has approved or disapproved or passed upon the accuracy or adequacy of this presentation . Any representation to the contrary is a criminal offense . This presentation is not, and should not be assumed to be, complete . This presentation has been prepared to assist interested parties in making their own evaluation of BRG and does not purport to contain all of the information that may be relevant . In all cases, interested parties should conduct their own investigation and analysis of BRG and the data set forth in this presentation and other information provided by or on behalf of BRG . In addition, certain of the information contained herein may be derived from information provided by industry sources . BRG believes that such information is accurate and that the sources from which it has been obtained are reliable . BRG cannot guarantee the accuracy of such information, however, and has not independently verified such information . Statements in this presentation are made as of the date of this presentation unless stated otherwise . This presentation also contains statements that, to the extent they are not recitations of historical fact, constitute “forward - looking statements . ” Forward - looking statements are typically identified by the use of terms such as “may,” “should,” “expect,” “could,” “intend,” “plan,” “anticipate,” “estimate,” “believe,” “continue,” “predict,” “potential” or the negative of such terms and other comparable terminology . The forward - looking statements included herein are based upon BRG’s current expectations, plans, estimates, assumptions and beliefs that involve numerous risks and uncertainties . Assumptions relating to the foregoing involve judgments with respect to, among other things, future economic, competitive and market conditions and future business decisions, all of which are difficult or impossible to predict accurately and many of which are beyond BRG’s control . Although BRG believes that the expectations reflected in such forward - looking statements are based on reasonable assumptions, BRG’s actual results and performance and the value of its securities could differ materially from those set forth in the forward - looking statements due to the impact of many factors including, but not limited to, the uncertainties of real estate development, acquisition and disposition activity, the ability of our joint venture partners to satisfy their obligations, the costs and availability of financing, the effects of local economic and market conditions, the effects of acquisitions and dispositions, the impact of newly adopted accounting principles on BRG’s accounting policies and on period - to - period comparisons of financial results, regulatory changes and other risks and uncertainties detailed in the “Risk Factors” section of the prospectus dated October 2 , 2014 and filed by BRG with the Commission on October 3 , 2014 , and other discussions of risk factors as detailed in subsequent filings by BRG with the Commission, including periodic reports . BRG claims the safe harbor protection for forward looking statements contained in the Private Securities Litigation Reform Act of 1995 . BRG undertakes no obligation to update or revise any such information for any reason after the date of this presentation, unless required by law .
Core Elements of BRG Strategy Deep, Experienced Management Acquire Institutional Quality Assets Invest in Growth Markets Execute with Local Partners Create Value at Asset Level - 3 -

Experienced Management Team ▪ Co - Founder of Bluerock Real Estate – 2002 ▪ Overseen acquisition of 9,000 apartment units and 2.5 million square feet of office space ▪ 25 years in real estate, private equity, investment banking ▪ Previously, Lehman Brothers ▪ 33 years experience in real estate, former Chairman – NMHC ▪ Previously, RREEF / Deutsche Bank – Head of National Acquisitions and Multifamily Value - Add & Development Groups; Member of Investment and Policy Committees ▪ Previously, Lincoln Property Company – Partner; developed 3,000+ units ▪ 25 years experience in real estate ▪ Starwood Capital – Founding Member; Co - Managed Starwood Multifamily and Office effort for 12 years ▪ Involved in creation of Equity Residential; Starwood Hotels; iStar Financial ▪ Co - Founder of Bluerock Real Estate – 2002 ▪ 25 years experience in real estate, capital markets ▪ Previously, Bank of America, JP Morgan Chase, Smith Barney * “BRGM” refers to BRG Manager, LLC - 4 - Ramin Kamfar Chairman, CEO & President of BRG Gary Kachadurian Vice Chairman of BRGM Director – Chair of Investment Committee James G. Babb, III Chief Investment Officer of BRGM Jordan Ruddy President of BRGM

- 5 - ▪ Targeting Class A assets generally built post - 2000 » Modern and efficient structures and layouts » Highly amenitized environment » Lifestyle product – a place to live, interact, socialize » One of youngest portfolios with highest average rents in our markets 0.0 0.5 1.0 1.5 2.0 2.5 3.0 3.5 4.0 Tampa Charlotte Dallas - Fort Worth Houston Austin Orlando Nashville Atlanta Denver National Average Percentage Growth (%) Source: HFF Research Statistics for the Year Ended October 2013 ▪ Targeting markets with long t erm e mployment g rowth d rivers » Target industries include healthcare , education, technology, finance, trade, entertainment, energy » Younger / more educated demographic with higher disposable income » High quality of life markets drive demand and retention Top MSAs – Employment Growth Alexan CityCentre – Houston, TX Current Property Target Market Appealing to renters by choice in growth markets Building a Class A Portfolio in Growth Markets Conceptual Rendering

Strategic Partner Network Efficient sourcing and execution across multiple markets - 6 - ▪ Active, established and well - known Partner Network » Leading regional owner / operators ▪ Partner Network unique to BRG » Longstanding relationships » BRG delivers value - add asset management / deal sourcing / lack of property management conflict ▪ SP Network provides significant, often off - market, deal flow » 2013 Strategic P artner transaction activity of $3 billion / 30,000 units ▪ BRG leverages SP Network’s deep intellectual capital and execution capabilities » ‘ Local sharpshooter’ ability Extensive Experience – 200,000+ Total Units Under Management

BRG Creates Value ▪ Acquire properties primarily through off - market / relationship transactions » Avoid fully priced, stabilized assets being sold in competitive auction process » Focus on negotiated off - market / relationship acquisitions to capture discount to inherent value ▪ Acquire properties with significant value growth potential » Discount purchase of complex assets such as fractured condos or ‘broken capital structure’ as opportunity to create value » Target assets with high NOI growth potential through repositioning, renovation or redevelopment ▪ Selectively invest in development deals with significant value creation » Structured as Convertible Preferred Equity to generate income during development; convertible into ownership at BRG option upon stabilization » Strategic Partner structure enables BRG to minimize development risks and guarantees - 7 - Focus on off - market purchase of assets with value growth potential

Significant Progress Since IPO - 8 - ▪ Raised $86.0M in Initial Public Offering / Follow - On ▪ Started to build institutional base ▪ 47% institutional placement in follow - on offering ▪ Expanded underwriting sponsorship ▪ Addition of Compass Point, DA Davidson; Janney Montgomery Scott as Co - Managers of Follow On ▪ Expanded Research ▪ Wunderlich / Compass Point / National Securities

Significant Progress Since IPO - 9 - ▪ Investing proceeds into accretive transactions ▪ Demonstrating strength in operational results Cap Market Asset Market Units Rate Cap Rate (1) Notes Lansbrook Tampa, FL 581 8.00% 5.75% Fractured Condo Alexan CityCentre Houston, TX 340 7.00% 4.25 - 4.75% Land Assemblage; Development UCF Publix Orlando, FL 296 7.50% 5.25 - 5.50% Land Rezoning; Development Enders Place Orlando, FL 220 6.25% 5.25 - 5.50% Fractured Condo; Recapitalization ARIUM Grande Lakes Orlando, FL 306 6.00% 5.25 - 5.50% Core Plus; Off-Market Total 1,743 (1) Based on management estimates 1Q14 2Q14 3Q14 Revenues (in millions) $3.3 $7.8 $9.6 Average Occupancy 91.6% 93.4% 95.3% Same Store NOI Growth (9.4%) 7.6% 5.7% G&A / Revenues 19.6% 7.7% 6.9% AFFO per Share ($0.45) $0.13 $0.22

Current Portfolio (1) - 10 - MDA CITY APARTMENTS (1) Based on information as of September 30, 2014 (2) MDA was built in 1929 as an office building and underwent a gut rehabilitation in 2006 (3) Alexan City Centre is currently under development. Leasing is expected to begin December 2016; rent is projected (4) Berry Hill development began delivering units in November 2013 (5) UCF Orlando is currently under development. Leasing is expected to begin May 2015; rent is projected (6) Pro Forma includes Alexan CityCentre and UCF Orlando projected units and rents * North Park and Estates are "Held for Sale" as of November 4, 2014 Property Name Location Units Year Built / Renovated Avg. Monthly Effective Rent per Occupied Unit Occupancy Sourcing Alexan CityCentre (3) Houston, TX 340 2016 $2,144 - off-market MDA Apartments Chicago, IL 190 2006 (2) 2,065 95.8% off-market Enders Place at Baldwin Park Orlando, FL 220 2003 1,445 93.6% relationship 23 Hundred@Berry Hill (4) Nashville, TN 266 2014 1,447 98.1% relationship UCF Orlando (5) Orlando, FL 296 2015 1,211 - off-market Lansbrook Village Tampa, FL 581 1998-2004 1,101 94.5% auction/relat. Village Green Ann Arbor, MI 520 1989-1992 1,088 98.5% off-market North Park Towers* Southfield, MI 313 1967/2000 1,031 95.2% relationship Grove at Waterford Hendersonville, TN 252 2010 1,004 96.8% off-market The Estates at Perimeter* Augusta, GA 240 2007 986 96.7% auction Villas at Oak Crest Chattanooga, TN 209 1985, 1999 814 97.1% relationship Springhouse at Newport News Newport News, VA 432 1985 799 93.1% off-market Total/Average (Current) 3,223 $1,126 95.8% Total/Average (Pro Forma) (6) 3,859 $1,222 95.8%

Portfolio Comparison Average Asset Age (years) Same Store NOI Growth – 3Q 2014 Average Monthly Rent Per Unit – 3Q 2014 Portfolio Occupancy – 3Q 2014 - 11 - *BRG average a sset a ge uses major renovation dates at North Park Towers and MDA Apartments Source: SNL & Company Filings 10 12 12 17 24 0 10 20 30 APTS TSRE BRG* AEC IRT 96.1% 95.5% 94.7% 94.6% 92.6% 89.0% 91.0% 93.0% 95.0% 97.0% TSRE BRG APTS AEC IRT $1,213 $1,126 $1,045 $903 $791 $600 $800 $1,000 $1,200 AEC BRG APTS TSRE IRT 3.7% 3.6% 2.7% 2.2% N/A 0.0% 2.0% 4.0% BRG APTS AEC TSRE IRT

23Hundred@Berry Hill – Nashville, TN Investment Summary Year Built 2014 Construction Start October 2012 Units 266 Partner Stonehenge – 17.5% Sourcing Strategy Off - Market - 12 - » Class A urban infill apartment development in emerging south Nashville Melrose neighborhood » Community features include a top floor songwriter’s lounge with panoramic views, an entertainment stage, a Fusion Fit Club, an oversized pool and a cyber café among other lifestyle amenities » Underwriting : Projected $1,215 average monthly rent and return on cost of 7.6% » Execution: 98% occupied at average rents of $ 1,406 per month / return on cost of 8.5%; vs. cap rates for Class A stabilized product in Nashville at 5.00 – 5.25% » Development cost of $127,000 per unit versus comparable sale in March 2014 at $220,000 per unit
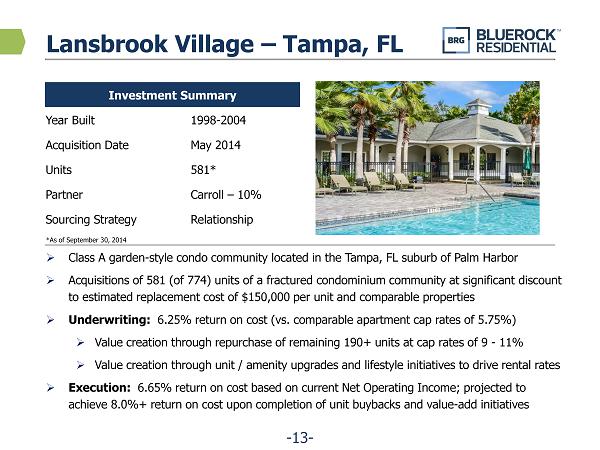
Lansbrook Village – Tampa, FL Investment Summary Year Built 1998 - 2004 Acquisition Date May 2014 Units 581* Partner Carroll – 10% Sourcing Strategy Relationship - 13 - » Class A garden - style condo community located in the Tampa, FL suburb of Palm Harbor » Acquisitions of 581 (of 774) units of a fractured condominium community at significant discount to estimated replacement cost of $150,000 per unit and comparable properties » Underwriting : 6.25% return on cost (vs. comparable apartment cap rates of 5.75 %) » Value creation through repurchase of remaining 190+ units at cap rates of 9 - 11 % » Value creation through unit / amenity upgrades and lifestyle initiatives to drive rental rates » Execution: 6.65% return on cost based on current Net Operating Income; projected to achieve 8.0%+ return on cost upon completion of unit buybacks and value - add initiatives *As of September 30, 2014

ARIUM Grande Lakes – Orlando, FL ▪ Class A, Core - Plus Institutional Quality Property » Newer build asset with nine - foot ceilings, black appliances and upgraded interior finishes » Abundance of high quality amenities: resort - style pool, fitness center, business and media centers » Identified modest value - add program and expense saving ▪ Off - Market Sourcing » Purchase price of $ 43 million ($141,500/ unit) was negotiated off - market with the seller » Discount to sale of the asset in 2006 for $ 49 million ($161,000/unit ) - 14 - ARIUM Grande Lakes Apartments Location Orlando, FL Year Built 2005 Units 306 Partner Carroll – 5 % Sourcing Strategy Off - Market Purchase Price $ 43 million
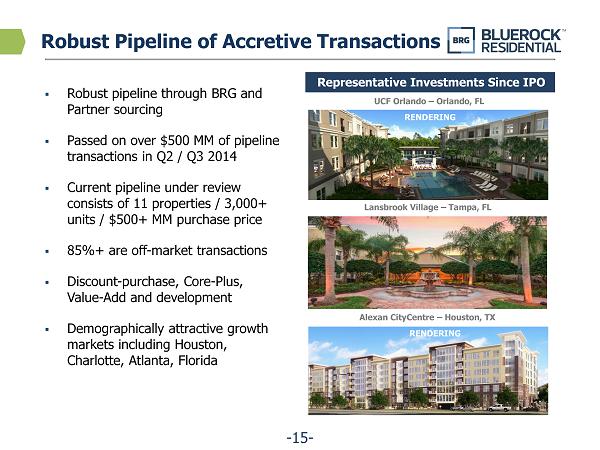
Robust Pipeline of Accretive Transactions ▪ Robust pipeline through BRG and Partner sourcing ▪ Passed on over $500 MM of pipeline transactions in Q2 / Q3 2014 ▪ Current pipeline under review consists of 11 properties / 3,000+ units / $500+ MM purchase price ▪ 85%+ are off - market transactions ▪ Discount - purchase, Core - Plus , Value - Add and development ▪ Demographically attractive growth markets including Houston , Charlotte, Atlanta, Florida Representative Investments Since IPO UCF Orlando – Orlando, FL Lansbrook Village – Tampa, FL Alexan CityCentre – Houston, TX - 15 - RENDERING RENDERING

Why Invest in BRG Now? ▪ Portfolio positioned for internal growth » BRG’s strategy is continuing to produce outsized returns: newer, class A assets, growth markets, renters by choice » Value embedded in existing portfolio: fractured condo deal, value - add programs and development projects ▪ Robust pipeline of accretive transactions » Active pipeline exceeds 5,200 units / $700 million » Desire to grow market capitalization through transactions accretive to FFO and NAV ▪ Premium dividend supported by portfolio » Dividend yield of 9.5% versus peer average of 6.1% » Growth potential – value creation in current portfolio and execution on healthy pipeline - 16 - Premium Dividend – As of 10/31/14 Same Store NOI Growth – 3Q 2014 9.5% 7.5% 7.3% 4.1% 3.0% 5.0% 7.0% 9.0% BRG APTS IRT TSRE AEC AVG 5.5% 3.7% 3.6% 2.7% 2.2% N/A 0.0% 2.0% 4.0% BRG APTS AEC TSRE IRT

Attractive Metrics Relative to Peers Source: SNL Financial; stock price as of 10/31/14, TSRE & BRG as of 11/3/14. NAV and AFFO metrics based solely on third part y e stimates. Company management expresses no opinion on the accuracy of such estimates and is not providing valuation or earnings guidance . Ticker Price Mkt Cap Avg. Age (years) Yield Price / NAV Price/ 2015 AFFOx AEC $ 19.75 $ 1,139 17 4.1% 91.4% 16.3 TSRE $ 7.53 $ 277 12 5.1% 87.4% 15.8 IRT $ 9.58 $ 247 24 7.3% 86.8% 12.2 APTS $ 8.61 $ 148 10 7.5% 79.1% 9.5 Average $ 452 16 6.0% 86.2% 13.5 BRG $ 12.40 $ 107 12 9.4% 71.2% 10.6 BRG Price at Average Metrics $19.28 $15.01 $15.73 - 17 -
