Attached files
| file | filename |
|---|---|
| 8-K - 8-K - SUN COMMUNITIES INC | form8-knareitconferencenov.htm |

1 November 2014

2 This presentation has been prepared for informational purposes only from information supplied by Sun Communities, Inc. (the "Company") and from third-party sources indicated herein. Such third-party information has not been independently verified. The Company makes no representation or warranty, expressed or implied, as to the accuracy or completeness of such information. This presentation contains various “forward-looking statements” within the meaning of the United States Securities Act of 1933, as amended, and the United States Securities Exchange Act of 1934, as amended, and we intend that such forward-looking statements will be subject to the safe harbors created thereby. For this purpose, any statements contained in this presentation that relate to expectations, beliefs, projections, future plans and strategies, trends or prospective events or developments and similar expressions concerning matters that are not historical facts are deemed to be forward-looking statements. Words such as “forecasts,” “intends,” “intend,” “intended,” “goal,” “estimate,” “estimates,” “expects,” “expect,” “expected,” “project,” “projected,” “projections,” “plans,” “predicts,” “potential,” “seeks,” “anticipates,” “anticipated,” “should,” “could,” “may,” “will,” “designed to,” “foreseeable future,” “believe,” “believes,” “scheduled,” “guidance” and similar expressions are intended to identify forward-looking statements, although not all forward looking statements contain these words. These forward-looking statements reflect our current views with respect to future events and financial performance, but involve known and unknown risks and uncertainties, both general and specific to the matters discussed in this presentation. These risks and uncertainties may cause our actual results to be materially different from any future results expressed or implied by such forward-looking statements. In addition to the risks disclosed under “Risk Factors” contained in our Annual Report on Form 10-K for the year ended December 31, 2013, and our other filings with the Securities and Exchange Commission from time to time, such risks and uncertainties include: changes in general economic conditions, the real estate industry and the markets in which we operate; difficulties in our ability to evaluate, finance, complete and integrate acquisitions, including the acquisition of the ALL portfolio described herein,developments and expansions successfully; our liquidity and refinancing demands; our ability to obtain or refinance maturing debt; our ability to maintain compliance with covenants contained in our debt facilities; availability of capital; our failure to maintain effective internal control over financial reporting and disclosure controls and procedures; increases in interest rates and operating costs, including insurance premiums and real property taxes; risks related to natural disasters; general volatility of the capital markets and the market price of shares of our capital stock; our failure to maintain our status as a REIT; changes in real estate and zoning laws and regulations; legislative or regulatory changes, including changes to laws governing the taxation of REITs; litigation, judgments or settlements; our ability to maintain rental rates and occupancy levels; competitive market forces; and the ability of manufactured home buyers to obtain financing and the level of repossessions by manufactured home lenders. Readers are cautioned not to place undue reliance on these forward-looking statements, which speak only as of the date the statement was made. We undertake no obligation to publicly update or revise any forward-looking statements included in this presentation, whether as a result of new information, future events, changes in our expectations or otherwise, except as required by law. Although we believe that the expectations reflected in the forward-looking statements are reasonable, we cannot guarantee future results, levels of activity, performance or achievements. All written and oral forward-looking statements attributable to us or persons acting on our behalf are qualified in their entirety by these cautionary statements. FORWARD LOOKING STATEMENTS

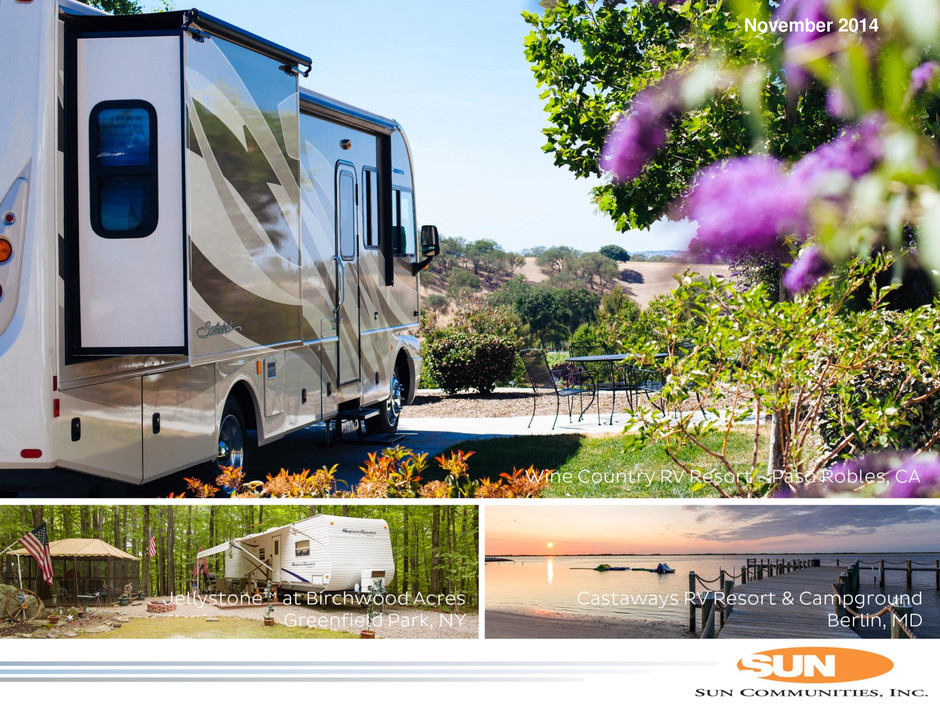
3 SUN COMMUNITIES, INC. (NYSE:SUI) Leading owner, developer and manager of manufactured housing (“MH”) and recreational vehicle (“RV”) sites Sun Communities’ current portfolio includes 184* communities consisting of approximately 69,600* sites across 27* states □ 151* MH communities and 33* RV resorts □ 51,500* manufactured home sites □ 18,100* RV sites □ Annuals/Seasonals – 9,100* □ Transient – 9,000* Sell and lease new and pre-owned manufactured homes as an adjunct to our core business * These numbers do not include the ALL portfolio. ** Properties included in the ALL portfolio, which Sun has agreed to acquire, as described herein. There can be no assurances that the acquisition of the ALL portfolio will occur.

4 Comparing Sun manufactured homes to the multifamily average, a manufactured home provides approximately 35% more space at approximately 40% less cost per square foot. AFFORDABILITY DRIVES MANUFACTURED HOUSING Sun – Manufactured Homes Apartments • Average rent ≈ $800/month or $0.62/square foot • Average square footage ≈ 1,300 square feet • Average rent ≈ $1,000/month or $1.00/square foot* • Average square footage ≈ 900-1,000 square feet Source: Rent.com data *Represents average rent for a 2 bedroom apartment in market areas Sun operates in. Manufactured Housing vs. Multi Family:

5 AFFORDABILITY DRIVES MANUFACTURED HOUSING Manufactured Housing vs. Single Family: • Average cost of Manufactured Housing ≈ $64,000 or roughly 1 years income • Average cost of Single Family ≈ $324,500 or roughly 5 years income The median income in the 27 states in which Sun operates is $65.3K. The average single family home costs over 5x the price of a MH unit. *2012 Average household income - 27 states in which SUI operates per US Census data. Housing data from 2014 MHI Quick Facts

6 STABILITY OF REVENUE Stable and growing revenue due to: Low turnover of owner occupied sites due to high cost to move a home ($4,000-$10,000) Average tenure of our residents in our communities is 13 years Average term of home in our communities is approximately 40 years Move Outs and Re-Sales No loss in revenue as home stays in the community.

7 CAPITAL EXPENDITURES Manufactured housing is a low capex business relative to its peers as it is largely a land ownership business. Source: Company filings Data as of 12/31/2013 Capex as a % of Revenues

8 RECESSION RESISTANT Low annual resident turnover results in stability of income and occupancy Strong and consistent rental growth creating a stable revenue stream Occupancy gains are a function of Sun’s integrated platform, including leasing, sales, and financing $ in M ill io n s Same Site NOI Growth O c c u p a n c y of M a n u fac tu re d H o m e s a n d P e rm a n e n t R V Same Site Occupancy Same Site Rent Growth *Projection based on midpoint of 2014 guidance A v e rag e M o n th ly R e n t of M a n u fac tu re d H o m e s

9 SAME SITE NOI Sun’s average same site NOI growth has exceeded the industry and apartment average by 1.4% over a 15 year period. -9.0% -8.0% -7.0% -6.0% -5.0% -4.0% -3.0% -2.0% -1.0% 0.0% 1.0% 2.0% 3.0% 4.0% 5.0% 6.0% 7.0% 8.0% 9.0% 10.0% 11.0% 1Q 9 9 2Q 9 9 3Q 9 9 4Q 9 9 1Q 0 0 2Q 0 0 3Q 0 0 4Q 0 0 1Q 0 1 2Q 0 1 3Q 0 1 4Q 0 1 1Q 0 2 2Q 0 2 3Q 0 2 4Q 0 2 1Q 0 3 2Q 0 3 3Q 0 3 4Q 0 3 1Q 0 4 2Q 0 4 3Q 0 4 4Q 0 4 1Q 0 5 2Q 0 5 3Q 0 5 4Q 0 5 1Q 0 6 2Q 0 6 3Q 0 6 4Q 0 6 1Q 0 7 2Q 0 7 3Q 0 7 4Q 0 7 1Q 0 8 2Q 0 8 3Q 0 8 4Q 0 8 1Q 0 9 2Q 0 9 3Q 0 9 4Q 0 9 1Q 1 0 2Q 1 0 3Q 1 0 4Q 1 0 1Q 1 1 2Q 1 1 3Q 1 1 4Q 1 1 1Q 1 2 2Q 1 2 3Q 1 2 4Q 1 2 1Q 1 3 2Q 1 3 3Q 1 3 4Q 1 3 1Q 1 4 2Q 1 4 SUI Apartments SUI Average (4.1%) Apartments Average (2.7%) Industry Average (2.7%) Source: Citi Investment research, August 2014. “REITs”- includes an index of REITs across a variety of asset classes including self storage, mixed office, regional malls, shopping centers, multifamily, student housing, manufactured homes and specialty

10 Source: SNL SAME SITE INDEXED NOI GROWTH MH is the most recession resistant sector of the housing and commercial real estate sectors and has consistently outperformed multifamily in same site NOI growth since 2000.

11 2012 Acquisitions (11 Communities) 2011 Acquisitions (26 Communities) 10 15 20 25 30 35 Year 1 Year 2 Year 3 $$ M ill io n s Revenues NOI 15 20 25 30 35 40 Year 1 Year 2 $$ M ill io n s Revenues NOI GROWTH THROUGH ACCRETIVE ACQUISITIONS Since June 2011, Sun has completed over $813 million of acquisitions, increasing its number of sites and communities by 49% and 43%, respectively, diversifying from both a business segment and geographic perspective.

ACQUISITION OF THE AMERICAN LAND LEASE PORTFOLIO FROM GREEN COURTE PARTNERS 12

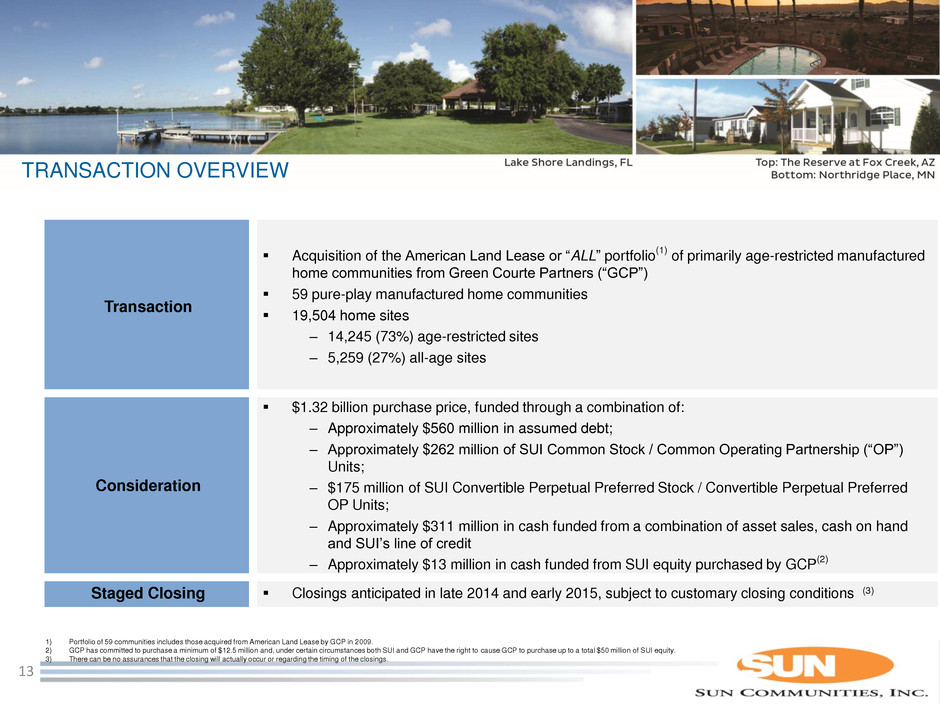
TRANSACTION OVERVIEW Transaction Acquisition of the American Land Lease or “ALL” portfolio(1) of primarily age-restricted manufactured home communities from Green Courte Partners (“GCP”) 59 pure-play manufactured home communities 19,504 home sites ‒ 14,245 (73%) age-restricted sites ‒ 5,259 (27%) all-age sites Consideration $1.32 billion purchase price, funded through a combination of: ‒ Approximately $560 million in assumed debt; ‒ Approximately $262 million of SUI Common Stock / Common Operating Partnership (“OP”) Units; ‒ $175 million of SUI Convertible Perpetual Preferred Stock / Convertible Perpetual Preferred OP Units; ‒ Approximately $311 million in cash funded from a combination of asset sales, cash on hand and SUI’s line of credit ‒ Approximately $13 million in cash funded from SUI equity purchased by GCP (2) Staged Closing Closings anticipated in late 2014 and early 2015, subject to customary closing conditions (3) 1) Portfolio of 59 communities includes those acquired from American Land Lease by GCP in 2009. 2) GCP has committed to purchase a minimum of $12.5 million and, under certain circumstances both SUI and GCP have the right to cause GCP to purchase up to a total $50 million of SUI equity. 3) There can be no assurances that the closing will actually occur or regarding the timing of the closings. 13

Age- Restricted 73% All-Age 27% IRREPLACEABLE PORTFOLIO WITH HIGH-QUALITY ASSETS Source: Company as of 7/23/2014. 1) Excludes one additional property comprising 198 sites, which SUI has a contract to purchase for $15.8 million. Age-Restricted Properties 41 communities 14,245 sites All-Age Properties 18 communities 5,259 sites Aggregate Portfolio (1) 59 communities 19,504 sites Expansion Sites Potential to add 558 additional sites Avg. Monthly Rent per Site $454 Occupancy 90% Number of States 11 SUMMARY STATISTICS GEOGRAPHIC EXPOSURE (BY SITES) AGE-RESTRICTED CONCENTRATION Avg. Monthly Rent per Site $471 Occupancy 91% Number of FL Sites 10,409 Expansion Sites 325 FL 56% AZ 11% MI 8% IL 7% NY 6% Other 12% 14

ACQUISITION INCREASE’S SUI’s SCALE AND DIVERSIFICATION Total Enterprise Value (1) $3.8 billion $1.3 billion $5.1 billion Number of Communities 184 59 (2) 243 Occupancy 92% 90% (2) 91% Number of Sites 69,677 19,504 (2) 89,181 Avg. Monthly Rent / Site $453 $454 (2) $453 Geographic Diversification ALL Portfolio from POST-ACQUISITION Source: Company filings as of 9/30/2014. 1) As of 9/30/2014, based on $50.50 SUI stock price ; calculated based on fully diluted shares outstanding. 2) As of 7/23/2014. 15 MI FL TX IN AZ Other (28%) (27%) (7%) (7%) (5%) (26%) FL AZ MI IL NY Other (56%) (11%) (8%) (7%) (6%) (12%) MI FL TX IN AZ Other (33%) (19%) (9%) (9%) (3%) (27%)

GROWTH THROUGH EXPANSION OPPORTUNITIES Inventory of over 6,300 zoned and entitled sites available for expansion at 34 communities Expanding in communities with strong demand evidenced by occupancy of ~95% Expansion lease-up is driven by sales, rental and relocation programs 400 sites expected to be completed at 2 communities in Texas,1 community in Colorado, and 1 community in Ohio in 2014 Over 2,900 sites planned for development in the next 4 years. 16

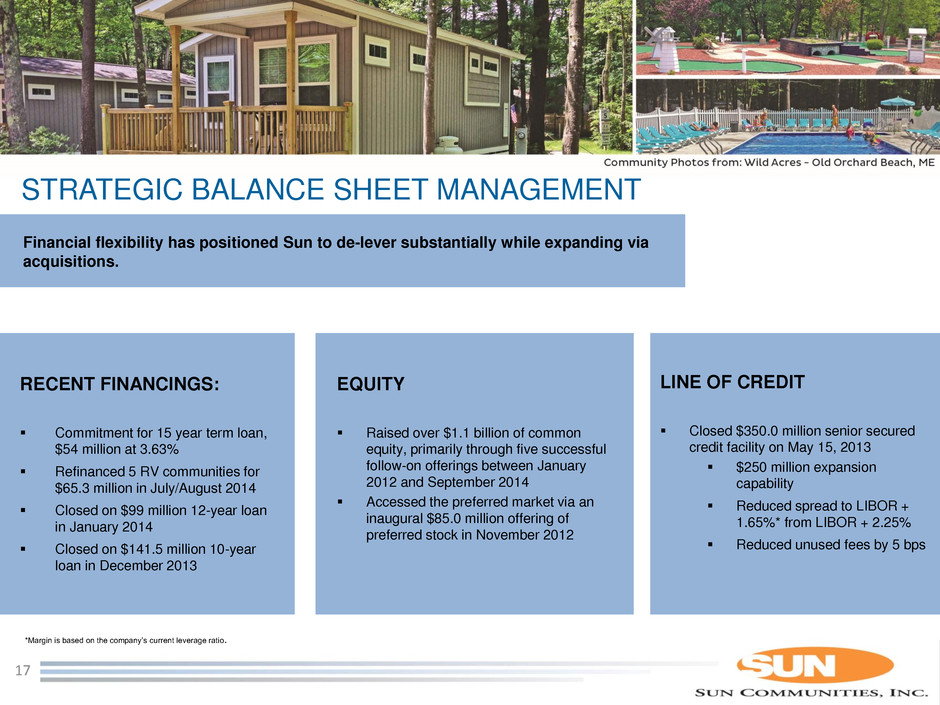
17 STRATEGIC BALANCE SHEET MANAGEMENT Financial flexibility has positioned Sun to de-lever substantially while expanding via acquisitions. EQUITY Raised over $1.1 billion of common equity, primarily through five successful follow-on offerings between January 2012 and September 2014 Accessed the preferred market via an inaugural $85.0 million offering of preferred stock in November 2012 LINE OF CREDIT Closed $350.0 million senior secured credit facility on May 15, 2013 $250 million expansion capability Reduced spread to LIBOR + 1.65%* from LIBOR + 2.25% Reduced unused fees by 5 bps *Margin is based on the company’s current leverage ratio. RECENT FINANCINGS: Commitment for 15 year term loan, $54 million at 3.63% Refinanced 5 RV communities for $65.3 million in July/August 2014 Closed on $99 million 12-year loan in January 2014 Closed on $141.5 million 10-year loan in December 2013

18 CONSERVATIVE BALANCE SHEET Net Debt1 / Enterprise Value EBITDA / Interest Net Debt + Preferred Equity / EBITDA* (1) Including preferred OP units *Calculated based on trailing 12 months ended September 30, 2014 Fixed Debt (%)

19 EXPERIENCED AND PROVEN LEADERSHIP TEAM Key executives have a combined 80 years experience in the industry and over 65 years at the company. Senior Management team has combined experience of over 70 years at the company. Gary A. Shiffman - Chairman and Chief Executive Officer Karen J. Dearing - Chief Financial Officer John B. McLaren – President and Chief Operating Officer Jonathan M. Colman - Executive Vice President of Acquisitions • Vision and leadership to generate consistent profitability through all cycles • Superior total return performance • Strong portfolio management as reflected by continuously improving operating metrics • Sound balance sheet management and improving credit metrics • Solid external growth strategy in highly-fragmented sector • Wide access to various capital sources

20 APPENDICES

340% 247% 216% 212% 210% 207% 195% 0% 100% 200% 300% 400% SUI SNL US REIT Manufactured Homes SNL US REIT Equity S&P Small-Cap MSCI US REIT (RMS) S&P 500 Russell 2000 PERFORMANCE VS. INDICES SUI has outperformed all major REIT sector indices and many major market indices over the last five years. Source: SNL 21 5-year Total Returns by Index as of 9-30-2014 340% 290% 287% 251% 247% 235% 211% 203% 200% 194% 178% 0% 100% 200% 300% 400% SUI Self-Storage Shopping Malls Retail Manufactured Housing Multifamily Hotel Strip Malls Healthcare Industrial Office 5-year Total Returns by REIT Sector as of 9-30-2014
