Attached files
| file | filename |
|---|---|
| 8-K - CURRENT REPORT OF MATERIAL EVENTS OR CORPORATE CHANGES - Hilltop Holdings Inc. | a14-23640_28k.htm |
Exhibit 99.1
|
|
Hilltop Holdings Inc. Q3 2014 Earnings Presentation Investor Presentation | November 4, 2014 |

|
|
Preface 2 200 Crescent Court, Suite 1330 Dallas, TX 75201 Phone: (214) 855-2177 Fax: (817) 887-1687 www.hilltop-holdings.com Please contact: Isabell Novakov Phone: (214) 252-4029 Email: inovakov@plainscapital.com Corporate Headquarters Additional Information FORWARD-LOOKING STATEMENTS This presentation and statements made by representatives of Hilltop Holdings Inc. (“Hilltop” or the “Company”) during the course of this presentation include “forward-looking statements” within the meaning of the Private Securities Litigation Reform Act of 1995. These forward-looking statements involve known and unknown risks, uncertainties and other factors that may cause the Company’s actual results, performance or achievements to bematerially different from any future results, performance or achievements anticipated in such statements. Forward-looking statements speak only as of the datethey are made and, except as required by law, the Company does not assume any duty to update forward-looking statements. Such forward-looking statements include, but are not limited to, statements concerning acquisitions, including our pending acquisition of SWS Group, Inc. (“SWS”), integration of the assets and operations acquired in the First National Bank (“FNB”) transaction, mortgage loan origination volume, market trends, organic growth, commitment utilization, exposure management in our insurance operations, loan performance, the Company’s other plans, objectives, strategies, expectations and intentions and other statements that are not statements of historical fact, and may be identified by words such as “anticipates,” “believes,” “could,” “estimates,” “expects,” “forecasts,” “goal,” “intends,” “may,” “might,” “probable,” “projects,” “seeks,” “should,” “view,” or “would” or the negative of these words and phrases or similar words or phrases. The following factors, among others, could cause actual results to differ from those set forth in the forward-looking statements: (i) risks related to our pending acquisition of SWS, including our ability to achieve the synergies and value creation contemplated by the pending acquisition and the diversionof management time on acquisition-related issues; (ii) risks associated with merger and acquisition integration, including our ability to promptly andeffectively integrate our businesses with those of FNB and SWS; (iii) the Company’s ability to estimate loan losses; (iv) changes in the default rate of the Company’s loans; (v) risks associated with concentration in real estate related loans; (vi) the Company’s ability to obtain reimbursements for losses on acquired loans under loss-share agreements with the FDIC; (vii) changes in general economic, market and business conditions in areas or markets where the Company competes; (viii) severe catastrophic events in the Company’s geographic area; (ix) changes in the interest rate environment; (x) cost and availability of capital; (xi) changesin state and federal laws, regulations or policies affecting one or more of Hilltop’s business segments, including changes in regulatory fees, deposit insurance premiums, capital requirements and the Dodd-Frank Wall Street Reform and Consumer Protection Act; (xii) the Company’s ability to use net operatingloss carry forwards to reduce future tax payments; (xiii) approval of new, or changes in, accounting policies and practices; (xiv) changes in key management; (xv) competition in the Company’s banking, mortgage origination, financial advisory and insurance segments from other banks and financial institutions, as well as insurance companies, mortgage bankers, investment banking and financial advisory firms, asset-based non-bank lenders and government agencies; (xvi) failure of the Company’s insurance segment reinsurers to pay obligations under reinsurance contracts; (xvii) the Company’s ability to use excess cash in an effective manner, including the execution of successful acquisitions; and (xviii) the Company’s participation in governmental programs, including the Small Business Lending Fund. For further discussion of such factors, see the risk factors described in the Hilltop Annual Report on Form 10-K for the year ended December 31, 2013, Quarterly Report on Form 10-Q for the three and nine months ended September 30, 2014, and other reports filed with the Securities and Exchange Commission. All forward-looking statements are qualified in their entirety by this cautionary statement. |
|
|
3 Hilltop Holdings Q3 2014 Highlights For the third quarter of 2014, net income to common stockholders for Hilltop was $23.4 million, or $0.26 earnings per diluted share Quarter results were favorable with the exception of write-downs on FNB covered OREO that decreased Hilltop’s earnings by approximately $9.6 million Q3 2013 included a $12.6 million pre-tax bargain purchase gain from the FNB acquisition PlainsCapital Corp. subsidiaries reported pre-tax income of $37.0 million for the quarter PlainsCapital Bank contributed $24.6 million, as the Bank continues to profitably work through acquired FNB loans and has undertaken plans to divest of certain FNB legacy branches PrimeLending contributed $11.1 million with year over year growth in mortgage volume First Southwest contributed $1.2 million National Lloyds Corporation reported pre-tax income of $8.2 million for the quarter, resulting from an 84.8% combined ratio Total stockholders equity increased by $26.6 million in the quarter to $1.42 billion at September 30, 2014 Hilltop remains well-capitalized with a 13.63% Tier 1 Leverage Ratio1 and a 19.28% Total Risk Based Capital Ratio Hilltop retains approximately $153 million of freely usable cash, as well as excess capital at its subsidiaries On October 2, 2014, Hilltop exercised 100% of its warrant and now owns 21% of SWS SWS shareholder meeting to vote on the pending merger will be held on November 21, 2014 Note: (1) Based on the end of period Tier 1 capital divided by total average assets during the third quarter of 2014, excluding goodwill and intangible assets |
|
|
4 Hilltop Holdings Financial Summary Financial Highlights Q3 2013 Q2 2014 Q3 2014 Income to Common ($000) 38,174 27,085 23,386 EPS - Diluted ($) 0.43 0.30 0.26 Book Value Per Share ($) 13.00 14.22 14.51 NIM (taxable equivalent) 4.46% 5.18% 4.38% Assets ($000) 9,093,592 9,396,448 9,180,402 Loans, Gross ($000) 4,406,814 4,559,850 4,520,118 Deposits ($000) 6,936,162 6,155,310 6,236,282 Hilltop Stockholders’ Equity ($000) 1,205,475 1,396,442 1,422,975 NPLs/Total Loans 1 0.50% 0.43% 0.48% NPAs/Total Assets1 0.34% 0.30% 0.29% Tier 1 Leverage Ratio2 13.96% 13.51% 13.63% Total Risk Based Capital Ratio 17.14% 18.79% 19.28% Note: (1) NPLs, NPAs and Total Loans exclude covered loans and covered OREO (2) Based on the end of period Tier 1 capital divided by total average assets during the quarter, excluding goodwill and intangible assets |

|
|
5 Hilltop Holdings Net Interest Income & Margin NIM contracted by 8 bps to 4.38% in Q3 2014 compared to Q3 2013 Yield on earning assets of 4.74% driven by gross loans, as average balance increased and average yield declined by 20 bps Decrease in cost of interest bearing liabilities driven by decrease in both cost of interest bearing deposits and cost of notes payable and borrowings Lower NIM in Q3 2014 relative to Q2 2014 due to lower yield on gross loans and higher cost of interest bearing deposits For Q3 2014, the tax equivalent NIM for Hilltop was 87 bps greater due to purchase accounting Accretion of discount on loans of $15.6 million Amortization of premium on acquired securities of $0.9 million Amortization of premium on acquired time deposits of $1.1 million Annual Yields and Rates (%) Q3 2013 Q2 2014 Q3 2014 Interest Earning Assets Loans, Gross 6.07 6.63 5.65 Investment Securities, Taxable 2.93 2.66 2.63 Investment Securities, Non-Taxable 3.82 3.82 3.74 Fed Funds Sold and Securities to Resell 0.38 0.28 0.29 Interest Earning Deposits 0.26 0.22 0.21 Other 6.07 5.62 5.13 Total Interest Earning Assets 4.94 5.44 4.74 Interest Bearing Liabilities Interest Bearing Deposits 0.40 0.27 0.38 Notes Payable and Borrowings 2.02 1.18 1.12 Total Interest Bearing Liabilities 0.69 0.43 0.54 Net Interest Spread 4.25 5.01 4.20 Net Interest Margin 4.46 5.18 4.38 |
|
|
6 Hilltop Holdings Noninterest Income Noninterest income was $212.1 million in Q3 2014, down 1.4% from Q3 2013 Bargain purchase gain of $12.6 million in Q3 2013 related to the FNB Transaction Net gains from the sale of loans, other mortgage production income and mortgage loan origination fees declined $1.2 million from Q3 2013 to $126.2 million in Q3 2014, representing 59% of total noninterest income for the quarter Net insurance premiums earned increased $1.8 million from Q3 2013 to $41.8 million in Q3 2014, representing 20% of total noninterest income for the quarter Financial advisory fees and commissions increased $1.7 million from Q3 2013 to $24.1 million in Q3 2014, representing 11% of total noninterest income for the quarter Noninterest Income Mix 3Q13 Noninterest Income Mix 3Q14 Total Noninterest Income: $215.1 million Total Noninterest Income: $212.1 million Gains on Sale And Other Mortgage Income 49% Mortgage Origination Fees 10% Net Insurance Premium Earned 19% Investment Advisory Fees & Commissions 10% Bargain Purchase Gain 6% Other 5% Securities Gains 1% Gains on Sale And Other Mortgage Income 51% Mortgage Origination Fees 8% Net Insurance Premium Earned 20% Investment Advisory Fees & Commissions 11% Other 9% |

|
|
7 Hilltop Holdings Noninterest Expense Total Noninterest Expense: $216.6 million Total Noninterest Expense: $254.7 million Noninterest Expense Mix 3Q13 Noninterest Expense Mix 3Q14 Comp. and Benefits 55% Loss and LAE 11% Policy Acquisition and Other Underwriting Expense 5% Occupancy and Equipment, net 10% Other 19% Comp. and Benefits 50% Loss and LAE 9% Policy Acquisition and Other Underwriting Expense 5% Occupancy and Equipment, net 10% Other 27% Noninterest expense was $254.7 million in Q3 2014, up 17.6% from Q3 2013 Compensation increased $7.2 million, or 6.1%, from Q3 2013 to $126.4 million in Q3 2014 primarily resulting from the FNB Transaction Loss and LAE declined to $22.6 million in Q3 2014 from $24.6 million in Q3 2013 Occupancy and equipment increased to $25.3 million in Q3 2014 from $21.0 million in Q3 2013, primarily resulting from the FNB Transaction Amortization of identifiable intangibles from purchase accounting was $2.6 million in Q3 2014 OREO write-down of $14.4 million pre-tax in Q3 2014 on certain covered OREO assets acquired in the FNB transaction. The downward valuation adjustments reflect changes to assumptions regarding the fair value of the OREO, including in some cases the intended use of the OREO, due to the availability of more information as well as the passage of time |
|
|
Hilltop Holdings Balance Sheet Loans held for sale declined $138.1 million from Q2 2014 to Q3 2014, primarily due to changes in seasonal volume Gross non-covered loans HFI increased 1.5% from Q2 2014 Gross covered loans declined by 11.1% as we continue to work through acquired FNB loans Covered OREO declined by $15.4 million primarily due to writedowns resulting from new appraisals Gross loans HFI (covered and non-covered) to deposits ratio declined to 72.5% in Q3 2014, down from 74.1% in Q2 2014, however up from 67.2% in Q4 2013 Total deposits increased $81.0 million in Q3 2014, as the increase of non-interest bearing deposits (up $159.0 million in Q3 2014) outpaced the run off of interest bearing deposits (down $78.0 million in Q3 2014) due to the continued planned run-off of FNB’s higher cost deposits Common equity increased $26.5 million due to earnings and improvement in AOCI 8 ($000s) 12/31/2013 6/30/2014 9/30/2014 Assets Cash & Federal Funds 746,023 688,785 647,588 Securities 1,261,989 1,328,716 1,332,342 Loans Held for Sale 1,089,039 1,410,873 1,272,813 Non-Covered Loans HFI, Gross 3,514,646 3,714,837 3,768,843 Allowance for Non-Covered Loan Losses (33,241) (36,431) (39,027) Non-Covered Loans HFI, Net 3,481,405 3,678,406 3,729,816 Covered Loans, Net of Allowance 1,005,308 840,898 747,514 Covered OREO 142,833 142,174 126,798 FDIC Indemnification Asset 188,291 175,114 149,788 Goodwill & Other Intangibles 322,729 317,113 314,317 Other Assets 666,505 814,369 859,426 Total Assets 8,904,122 9,396,448 9,180,402 Liabilities and Stockholders Equity Non-Int. Bearing Deposits 1,773,749 1,829,072 1,988,066 Int. Bearing Deposits 4,949,169 4,326,238 4,248,216 Total Deposits 6,722,918 6,155,310 6,236,282 Short Term Borrowings 342,087 1,187,193 845,984 Notes Payable 56,327 55,584 55,684 Junior Subordinated Debentures 67,012 67,012 67,012 Other Liabilities 403,856 534,187 551,696 Total Liabilities 7,592,200 7,999,286 7,756,658 SBLF Preferred Stock 114,068 114,068 114,068 Common Equity 1,197,073 1,282,374 1,308,907 Total Hilltop Equity 1,311,141 1,396,442 1,422,975 Minority Interest 781 720 769 Total Liabilities & Equity 8,904,122 9,396,448 9,180,402 |
|
|
9 PlainsCapital Corporation Update With one full year since the purchase and assumption of FNB by PlainsCapital Bank, management is focused on the performance of both new and existing markets To address expense platform PlainsCapital Bank is in the process of divesting 11 branches in the Rio Grande Valley, which accounted for $1.4 million of noninterest expense in Q3 2014 Improving leadership, with Robert C. Norman installed as the Rio Grande Valley Regional Chairman in October Allowing higher cost FNB deposits to run-off and replacing with cheaper funding Continue to focus on profitable, organic growth from robust loan pipeline ($1.4 billion in unfunded commitments) and adding branches in desirable markets (Aledo/Willow Park opened in September) Credit quality for the overall bank remains strong, with non-covered NPAs to total consolidated assets declining to 0.29% in Q3 2014 PrimeLending continues to focus on growing market share while controlling its expense base estimated industry market share in Q3 2014 of 0.98% Year over year growth in home purchase volume, represented 82% of Q3 2014 funding mix Job growth and historically low mortgage rates expected to result in increased home sales and purchase originations Due to recent declines in mortgage interest rates, we anticipate refinancing to increase Cost initiatives put in place in 2013 have helped mitigate margin compression from pricing competition First Southwest had positive revenue and net income growth for the quarter compared to Q3 2013 due in part to an increase in public finance revenue, however ongoing industry pressures continue to mute results |
|
|
10 PlainsCapital Bank Q3 2014 Highlights Bank’s income before taxes of $24.6 million in Q3 2014 Net interest income increased 10.9% from Q3 2013 to Q3 2014 Approximately 91% of noninterest expense increase from Q3 2013 to Q3 2014 due to FNB Transaction of which approximately 52% attributable to OREO write-down and FNB branches slated to close PrimeLending funds originations through a $1.5 billion warehouse line from the bank; $1.2 billion was drawn at September 30, 2014 Tier 1 Leverage Ratio of 9.95% and Total Risk Based Capital Ratio of 14.21% Summary Results ($000) Q3 2013 Q3 2014 Net Interest Income 70,594 78,285 Provision for Loan Losses 10,661 4,049 Noninterest Income 26,614 17,638 Noninterest Expense 34,136 67,236 Income Before Taxes 52,411 24,638 Loans HFI Mix 3Q14 Total Loans1: $4.5 billion Deposit Mix 3Q14 Total Deposits1: $6.2 billion Note: (1) Loans HFI and deposit mix represent consolidated balances at Hilltop and, therefore, eliminate intercompany loans and deposits Segment financials based on updated segment reporting breakdown change that occurred in Q4 2013 ROAA (%) 2.23% 0.77% NIM (%) 5.09% 4.62% Assets 8,143,611 8,000,666 Tier 1 Leverage Ratio (%) 11.05% 9.95% C&I 38% Real Estate 50% C&D 11% Consumer 1% Non Int. Bearing Demand 32% NOW 18% Money Market 15% Demand 2% Savings 6% Time 28% |

|
|
PlainsCapital Bank Loan Portfolio by Classification 11 Covered PCI Loans Q3 2014 Total: $527.7 million Covered Non-PCI Loans Q3 2014 Total: $223.5 million Non-Covered PCI Loans Q3 2014 Total: $53.4 million Non-Covered Non-PCI Loans Q3 2014 Total: $3,715.5 million Note: PCI stands for Purchased Credit Impaired loans. Loan classification mix represents consolidated balances at Hilltop and, therefore, eliminate intercompany loans. Amounts above equal carrying value, after deductions for discount. C&I 4% Real Estate 83% C&D 12% C&I 4% Real Estate 89% C&D 7% C&I 31% Real Estate 46% C&D 18% Consumer 5% C&I 45% Real Estate 43% C&D 11% Consumer 1% |

|
|
PCI Loans at September 30, 2014 12 Purchased Credit Impaired (“PCI”) loans are loans with evidence of credit quality deterioration, for which it is probable that not all contractually required payments will be collected PCI loans include covered and non-covered loans PCI loans had a total discount of $290.5 million $270.1 million of the discount was related to covered loans Increase in expected cash flows in Q3 2014 of $25.0 million for covered PCI loans and $4.3 million for non-covered PCI loans Weighted average expected loss on PCI loans associated with each of the PlainsCapital Merger and FNB Transaction was 24% ($000) Covered PCI Non-Covered PCI Total PCI Outstanding Balance 797,799 73,787 871,586 (Discount) (270,051) (20,404) (290,455) Carrying Amount 527,748 53,383 581,131 Allowance for Loan Loss 3,672 5,288 8,960 Total PCI Loans, Net of Allowance 524,076 48,095 572,171 Carrying Amount (Net of Allowance) / Outstanding Balance 65.7% 65.2% 65.6% Note: Outstanding balance represents unpaid principal balance net of charge-offs and interest applied to principal |

|
|
Non-PCI Loans at September 30, 2014 13 ($000) Covered Non-PCI Non-Covered Non-PCI Total Non-PCI Outstanding Balance 239,521 3,742,721 3,982,242 (Discount) (15,994) (27,261) (43,255) Carrying Amount 223,527 3,715,460 3,938,987 Allowance for Loan Loss 89 33,739 33,828 Total Non-PCI Loans, Net of Allowance 223,438 3,681,721 3,905,159 Carrying Amount (Net of Allowance) / Outstanding Balance 93.3% 98.4% 98.1% Non-PCI loans include newly originated loans, acquired loans without credit impairment at acquisition, and acquired non-PCI loans that have renewed Non-PCI loans include covered loans and non-covered loans Portfolio on balance sheet at 98.1% unpaid principal balance with a total discount of $43.3 million $27.3 million discount was related to non-covered loans, while covered loans had a $16.0 million discount Note: Outstanding balance represents unpaid principal balance net of charge-offs and interest applied to principal |

|
|
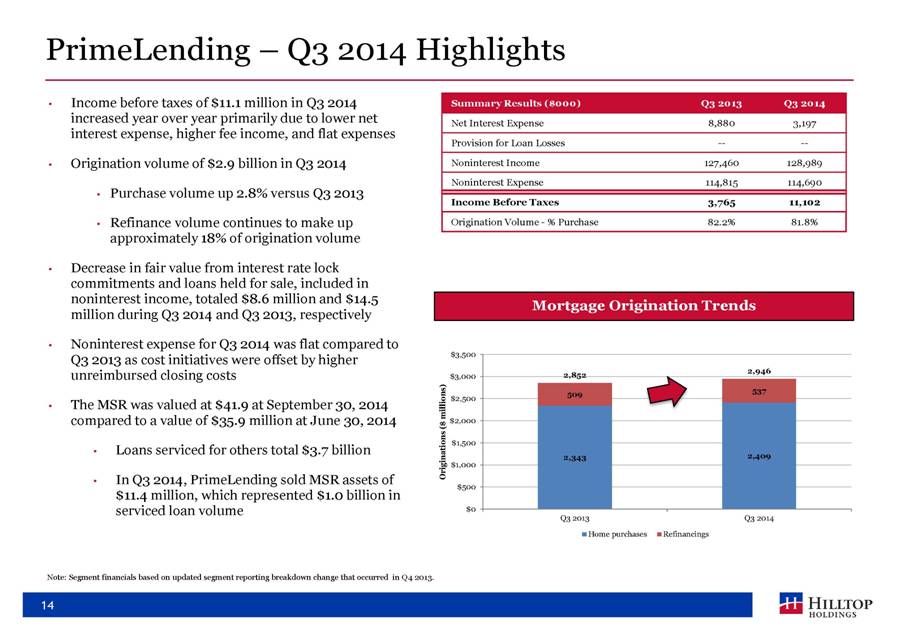
PrimeLending Q3 2014 Highlights Income before taxes of $11.1 million in Q3 2014 Summary Results ($000) Q3 2013 Q3 2014 increased year over year primarily due to lower net Net Interest Expense 8,880 3,197 interest expense, higher fee income, and flat expenses Provision for Loan Losses -- -- Origination volume of $2.9 billion in Q3 2014 Noninterest Income 127,460 128,989 Noninterest Expense 114,815 114,690 Purchase volume up 2.8% versus Q3 2013 Income Before Taxes 3,765 11,102 Refinance volume continues to make up Origination Volume - % Purchase 82.2% 81.8% approximately 18% of origination volume Decrease in fair value from interest rate lock commitments and loans held for sale, included in noninterest income, totaled $8.6 million and $14.5 Mortgage Origination Trends million during Q3 2014 and Q3 2013, respectively Noninterest expense for Q3 2014 was flat compared to Q3 2013 as cost initiatives were offset by higher $3,500 2,946 unreimbursed closing costs $3,000 2,852 537 509 $2,500 The MSR was valued at $41.9 at September 30, 2014 compared to a value of $35.9 million at June 30, 2014 $2,000 $1,500 Loans serviced for others total $3.7 billion 2,343 2,409 Originations ($ millions) $1,000 In Q3 2014, PrimeLending sold MSR assets of $500 $11.4 million, which represented $1.0 billion in serviced loan volume $0 Q3 2013 Q3 2014 Home purchases Refinancings Note: Segment financials based on updated segment reporting breakdown change that occurred in Q4 2013. 14 |
|
|
15 First Southwest Q3 2014 Highlights Pre-tax income of $1.2 million in Q3 2014 versus $176 thousand pre-tax income in Q3 2013 Noninterest income increase of $4.0 million due largely to growth in TBA business and modest improvement in public finance Noninterest expense increase of $3.6 million, mainly driven by increases in professional fees, as well as compensation that varies with revenue Substantial amount of noninterest income is driven by public finance, capital markets and clearing The TBA business, which provides interest rate protection for housing authorities, had fair value changes on derivatives that provided net gains of $5.3 million for the quarter Summary Results ($000) Q3 2013 Q3 2014 Net Interest Income 2,690 3,269 Provision for Loan Losses (3) (16) Noninterest Income 25,710 29,726 Noninterest Expense 28,227 31,782 Income Before Taxes 176 1,229 Note: Segment financials based on updated segment reporting breakdown change that occurred in Q4 2013. |

|
|
16 National Lloyds Corporation Q3 2014 Highlights Pre-tax income of $8.2 million for Q3 2014, up $3.8 million compared to Q3 2013 Positive results primarily due to growth in earned premium and improved claims loss experience associated with the significant decline in severity of severe weather-related events during 2014 In 2013, we initiated rate filings and performed a review of business concentrations, which resulted in cancellation of agents, non-renewal of policies and cessation of new business writing on certain products in problematic geographic areas Reduced the rate of written premium growth during the year Will continue to manage and diversify business concentrations and products to minimize the effects of future weather-related events Q3 2014 Direct Premiums Written Combined Ratio Improvement Total: $42.6 million Summary Results ($000) Q3 2013 Q3 2014 Net Interest Income 911 808 Provision for Loan Losses -- -- Noninterest Income 42,163 44,014 Noninterest Expense 38,689 36,636 Income Before Taxes 4,385 8,186 Note: Segment financials based on updated segment reporting breakdown change that occurred in Q4 2013. Homeowners 46% Fire 31% Mobile Home 20% Commercial 2% 61.6% 54.1% 32.4% 30.7% 94.0% 84.8% 0.0% 20.0% 40.0% 60.0% 80.0% 100.0% 120.0% Q3 2013 Q3 2014 Loss & LAE Ratio Underwriting Expense Ratio |

|
|
17 SWS Transaction Pro Forma Balance Sheet Highlights (6/30/14) $bn HTH SWS Pro Forma Loans HFI $4.5 $0.9 $5.4 Assets $9.4 $4.1 $13.3 Deposits $6.2 $1.4 $7.5 Equity $1.4 $0.3 $1.6 Combination Opportunity Transaction creates the largest full service brokerage firm headquartered in the Southwestern US based on number of financial advisors Fortifies strong presence in Texas, while adding complementary offices throughout the United States Significant opportunity to bolster market share and scale of complementary broker / dealer businesses Larger, diversified organization will benefit from synergies and more efficient operating platform Combined bank will have a larger, more scalable deposit base given ability to source additional deposits from broker / dealer customers through the sweep program Following the acquisition, Hilltop will be well capitalized with excess cash to deploy on future transactions Continues to build on Hilltop’s goal of building the premier Texas financial holding company franchise with a dominant Texas broker / dealer Complementary Businesses SWS FSW Taxable Fixed Income, Retail Public Finance, Capital Markets, Clearing, Stock Loan, Bank Housing, Asset Management Source: SWS/Hilltop Proxy Statement/Prospectus |

|
|
18 Questions? |
