Attached files
| file | filename |
|---|---|
| EXCEL - IDEA: XBRL DOCUMENT - FAMILY DOLLAR STORES INC | Financial_Report.xls |
| EX-10.1 - EXHIBIT 10.1 - FAMILY DOLLAR STORES INC | fdoex-101x20140830.htm |
| EX-10.2 - EXHIBIT 10.2 - FAMILY DOLLAR STORES INC | fdoex-102x20140830.htm |
| EX-31.1 - EXHIBIT 31.1 - FAMILY DOLLAR STORES INC | fdoex-311x20140830.htm |
| EX-32 - EXHIBIT 32 - FAMILY DOLLAR STORES INC | fdoex-32x20140830.htm |
| EX-31.2 - EXHIBIT 31.2 - FAMILY DOLLAR STORES INC | fdoex-312x20140830.htm |
| EX-21 - EXHIBIT 21 - FAMILY DOLLAR STORES INC | fdoex-21x2014830.htm |
| EX-23 - EXHIBIT 23 - FAMILY DOLLAR STORES INC | fdoex-23x2014830.htm |
UNITED STATES
SECURITIES AND EXCHANGE COMMISSION
Washington, D.C. 20549
FORM 10-K
x | Annual Report Pursuant to Section 13 or 15(d) of the Securities Exchange Act of 1934 |
For the fiscal year ended August 30, 2014
Or
¨ | Transition Report Pursuant to Section 13 or 15(d) of the Securities Exchange Act of 1934 |
Commission file number 1-6807
FAMILY DOLLAR STORES, INC.
(Exact name of registrant as specified in its charter)
Delaware | 56-0942963 |
(State or other jurisdiction of incorporation or organization) | (I.R.S. Employer Identification No.) |
10401 Monroe Road, Matthews, North Carolina | 28105 |
(Address of principal executive offices) | (Zip Code) |
P.O. Box 1017, Charlotte, North Carolina 28201-1017
(Mailing address)
Registrant's telephone number, including area code: (704) 847-6961
Securities registered pursuant to Section 12(b) of the Act:
Title of each class | Name of each exchange on which registered | |||
Common Stock, $.10 Par Value | New York Stock Exchange | |||
Securities registered pursuant to Section 12(g) of the Act: None
Indicate by check mark if the registrant is a well-known seasoned issuer, as defined in Rule 405 of the Securities Act. Yes x No ¨
Indicate by check mark if the registrant is not required to file reports pursuant to Section 13 or Section 15(d) of the Act. Yes ¨ No x
Indicate by check mark whether the registrant (1) has filed all reports required to be filed by Section 13 or 15(d) of the Securities Exchange Act of 1934 during the preceding 12 months (or for such shorter period that the registrant was required to file such reports), and (2) has been subject to such filing requirements for the past 90 days. Yes x No ¨
Indicate by check mark whether the registrant has submitted electronically and posted on its corporate Web site, if any, every Interactive Data File required to be submitted and posted pursuant to Rule 405 of Regulation S-T during the preceding 12 months (or for such shorter period that the registrant was required to submit and post such files). Yes x No ¨
Indicate by check mark if disclosure of delinquent filers pursuant to Item 405 of Regulation S-K is not contained herein, and will not be contained, to the best of registrant's knowledge, in definitive proxy or information statements incorporated by reference in Part III of this Form 10-K or any amendment to this Form 10-K. ¨
Indicate by check mark whether the registrant is a large accelerated filer, an accelerated filer, a non-accelerated filer, or a smaller reporting company. See the definitions of "large accelerated filer," "accelerated filer" and "smaller reporting company" in Rule 12b-2 of the Exchange Act.
Large accelerated filer x | Accelerated filer ¨ |
Non-accelerated filer ¨ (Do not check if a smaller reporting company) | Smaller reporting company ¨ |
Indicate by check mark whether the registrant is a shell company (as defined in Rule 12b-2 of the Act). Yes ¨ No x
The aggregate market value of voting and non-voting common equity held by non-affiliates computed by reference to the price at which the common equity was last sold, as of the last day of the registrant's most recently completed second fiscal quarter, on March 1, 2014, was approximately $6.3 billion. For purposes of this computation only, the assumption is that all of the registrant's directors, executive officers and beneficial owners of 10% or more of the registrant's common stock are affiliates.
The number of shares of the registrant's Common Stock outstanding as of October 4, 2014, was 113,987,605.
DOCUMENTS INCORPORATED BY REFERENCE
None noted.
TABLE OF CONTENTS
Page No. | ||
Part I | ||
General Information and Cautionary Statement Regarding Forward-Looking Statements | ||
Item 1. | ||
Item 1A. | ||
Item 1B. | ||
Item 2. | ||
Item 3. | ||
Item 4. | ||
Part II | ||
Item 5. | ||
Item 6. | ||
Item 7. | ||
Item 7A. | ||
Item 8. | ||
Item 9. | ||
Item 9A. | ||
Item 9B. | ||
Part III | ||
Item 10. | ||
Item 11. | ||
Item 12. | ||
Item 13. | ||
Item 14. | ||
Part IV | ||
Item 15. | ||
1
GENERAL INFORMATION
We have provided information in this Annual Report on Form 10-K (this "Report") regarding the operations of Family Dollar Stores, Inc., and its subsidiaries ("we," "Family Dollar" or the "Company") related to the fiscal years ended on August 30, 2014 ("fiscal 2014"); August 31, 2013 ("fiscal 2013"); August 25, 2012 ("fiscal 2012"); August 27, 2011 ("fiscal 2011"); August 28, 2010 ("fiscal 2010"); and anticipated operations for the fiscal year ending on August 29, 2015 ("fiscal 2015"). You should review the discussion and analysis provided in this Report in conjunction with our Consolidated Financial Statements and the Notes to Consolidated Financial Statements, which are included in this Report.
CAUTIONARY STATEMENT REGARDING FORWARD-LOOKING STATEMENTS
Certain statements contained in this Report, or in other public filings, press releases, or other written or oral communications made by Family Dollar or our representatives, which are not historical facts, are forward-looking statements subject to the safe harbor provisions of the Private Securities Litigation Reform Act of 1995. These forward-looking statements address, among other things, our plans, activities or events which we expect will or may occur in the future and may include express or implied projections of revenue or expenditures; statements of plans and objectives for future operations, growth or initiatives; statements of future economic performance, including, but not limited to, the state of the economy, our capital investment and financing plans, net sales, comparable store sales, store openings and closings, cost of sales, selling, general and administrative ("SG&A") expenses, gross margin, income tax rates, earnings per diluted share, dividends and share repurchases; or statements regarding the outcome or impact of pending or threatened litigation.
The forward-looking statements also include assumptions about the business combination transaction involving Dollar Tree and Family Dollar, the unsolicited tender offer and proposals from Dollar General and any other alternative business combination transactions, the financing of the pending merger, the benefits, results, effects, timing and certainty of the pending transactions, future financial and operating results, expectations concerning the antitrust review process for the pending transactions and the combined company's plans, objectives, expectations (financial or otherwise) and intentions.
Risks and uncertainties related to the pending merger include, among others: the risk that Family Dollar's stockholders do not approve the pending merger; the risk that the Dollar Tree merger agreement (defined below) is terminated as a result of a competing proposal; the risk that regulatory approvals required for the pending merger are not obtained on the terms and schedule contained in the Dollar Tree merger agreement or are obtained subject to conditions that are not anticipated; the risk that the other conditions to the closing of the pending merger are not satisfied; the risk that the financing required to fund the pending transaction is not obtained; potential adverse reactions or changes to business or employee relationships, including those resulting from the announcement or completion of the pending merger; uncertainties as to the timing of the pending merger; competitive responses to the merger; response by activist stockholders to the pending merger; costs and difficulties related to the integration of Family Dollar's business and operations with Dollar Tree's or other potential business combination transaction counterparties' business and operations; the inability to obtain, or delays in obtaining, the cost savings and synergies contemplated by the pending merger; uncertainty of the expected financial performance of the combined company following completion of the pending merger; the calculations of, and factors that may impact the calculations of, the acquisition price in connection with the pending transaction and the allocation of such acquisition price to the net assets acquired in accordance with applicable accounting rules and methodologies; unexpected costs, charges or expenses resulting from the pending merger; litigation relating to the pending merger; the outcome of pending or potential litigation or governmental investigations; the inability to retain key personnel; and any changes in general economic and/or industry specific conditions.
These forward-looking statements may be identified by the use of the words "believe," "plan," "estimate," "expect," "anticipate," "probably," "should," "project," "intend," "continue," and other similar terms and expressions. Various risks, uncertainties and other factors may cause our actual results to differ materially from those expressed or implied in any forward-looking statements. Factors, uncertainties and risks that may result in actual results differing from such forward-looking information include, but are not limited to, those listed in Part I – Item 1A below, as well as other factors discussed throughout this Report, including, without limitation, the factors described under "Critical Accounting Policies" in Part II – Item 7 below, or in other filings or statements made by us. All of the forward-looking statements in this Report and other documents or statements are qualified by these and other factors, risks and uncertainties.
You should not place undue reliance on the forward-looking statements included in this Report. We assume no obligation to update any forward-looking statements, even if experience or future changes make it clear the projected results expressed or implied in such statements will not be realized, except as may be required by law. In evaluating forward-looking statements, you should consider these risks and uncertainties, together with the other risks described in the Form S-4 filed by Dollar Tree, Inc., and other reports and documents filed by Family Dollar with the Securities and Exchange Commission ("SEC").
2
3
PART I
ITEM 1. BUSINESS
General Overview
We operate a chain of more than 8,000 general merchandise retail discount stores in 46 states, providing value-conscious consumers with a selection of competitively priced merchandise in convenient neighborhood stores. Our merchandise assortment includes Consumables, Home Products, Apparel and Accessories, and Seasonal and Electronics. We classify the combination of Home Products, Apparel and Accessories, and Seasonal and Electronics as "Discretionary." We sell merchandise at prices that generally range from less than $1 to $10.
The mailing address of our executive offices is P.O. Box 1017, Charlotte, North Carolina 28201-1017, and our telephone number is (704) 847-6961. Our press releases for the past five years are available on our website, www.familydollar.com. We also make available free of charge through our website all of our reports filed with or furnished to the Securities and Exchange Commission ("SEC") pursuant to the Securities Exchange Act of 1934, as amended (the "Exchange Act"), including our Annual Reports on Form 10-K, Quarterly Reports on Form 10-Q, Current Reports on Form 8-K, and amendments to those reports, as soon as reasonably practicable after they are electronically filed with or furnished to the SEC.
On July 27, 2014, we entered into a merger agreement with Dollar Tree, Inc. ("Dollar Tree"). Through the merger process, financial information relevant to our Company has been published within Form S-4's filed by Dollar Tree. Dollar Tree's reports filed or furnished pursuant to Section 13(a) or 15(d) of the Securities Exchange Act are available free of charge on its website at www.dollartree.com as soon as reasonably practicable after electronic filing of such reports with the SEC. Documents incorporated by reference into the Form S-4 or can be requested free of charge by telephone or written request directed to: Corporate Secretary at Dollar Tree, Inc., 500 Volvo Parkway, Chesapeake, Virginia, 23320, Telephone (757) 321-5000.
In addition, the public may read and copy any of the materials we or Dollar Tree file with the SEC at the SEC's Public Reference Room at 100 F Street, NE, Washington DC 20549. The public may obtain information on the operation of the Public Reference Room by calling the SEC at 1-800-SEC-0330. The SEC maintains a website, www.sec.gov, which contains reports, proxy and information statements, and other information regarding issuers that file electronically with the SEC.
Our History
Our company was founded by Leon Levine in 1959 with the opening of the first Family Dollar store in Charlotte, North Carolina. Family Dollar Stores, Inc. was incorporated in Delaware in 1969, and all then-existing corporate entities became its wholly-owned subsidiaries. In 1970, the Company initially offered its common stock to the public, and today the Company's shares are traded on the New York Stock Exchange under the ticker symbol "FDO."
Our Mission and Strategy
Our mission is to provide our customers with a compelling place to shop, our team members with a compelling place to work, and our shareholders with a compelling place to invest. Our strategy is to provide consumers with value and convenience in a small, easy-to-shop environment in the neighborhoods we serve.
Strategic Initiatives
Our growth prospects remain strong; however, our results continue to be pressured. As a result of these pressures, we initiated an in-depth business review to identify opportunities to strengthen our value proposition, increase operational efficiencies, and improve financial performance. In the second half of fiscal 2014, we implemented a series of restructuring initiatives, including investing to lower prices on nearly 1,000 basic items, closing 377 underperforming stores across the chain, and optimized our workforce through a headcount reduction. Although these internal initiatives position us to deliver stronger returns, we continued to evaluate external strategic alternatives, which are summarized below.
Merger and Acquisition Transactions
On July 27, 2014, we entered into a definitive merger agreement (the "Dollar Tree merger agreement") with Dollar Tree, upon the terms and subject to the conditions of which a subsidiary of Dollar Tree will be merged with and into Family Dollar, with Family Dollar continuing as the surviving entity and a wholly-owned subsidiary of Dollar Tree. The transaction is subject to
4
Family Dollar stockholder approval, expiration or termination of the applicable waiting period under the Hart-Scott-Rodino Antitrust Improvements Act of 1976, as amended (the "HSR Act") and other customary closing conditions.
Upon completion of the merger, each issued and outstanding share of Family Dollar common stock other than shares owned by Dollar Tree or Family Dollar, or by stockholders that have perfected and not withdrawn a demand for appraisal rights pursuant to Section 262 of the Delaware General Corporation Law ("DGCL"), will be converted into the right to receive (i) an amount equal to $59.60 in cash plus (ii) a number of shares of Dollar Tree common stock equal to the exchange ratio. The exchange ratio depends on the volume weighted average of the trading prices of Dollar Tree common stock on the Nasdaq on each of the 20 consecutive Nasdaq trading days ending on the trading day that is three trading days prior to the effective time. If this average stock price is greater than $49.08 and less than $59.98 per share, the exchange ratio will be the quotient of $14.90 divided by the average stock price. If the average stock price is greater than or equal to $59.98, the exchange ratio will be 0.2484. If the average stock price is less than or equal to $49.08, the exchange ratio will be 0.3036. Dollar Tree stated it was prepared to commit to divest up to 500 retail stores in order to achieve the requisite antitrust approvals.
Following the execution of the Dollar Tree merger agreement, Dollar General Corporation ("Dollar General") submitted a non-binding, unsolicited proposal to acquire all the outstanding shares of Family Dollar common stock for $78.50 per share in cash, contingent on due diligence, regulatory approval, and termination of the Dollar Tree merger agreement. In its original proposal, Dollar General stated it was prepared to commit to divest up to 700 retail stores in order to achieve the requisite antitrust approvals. Dollar General subsequently revised its proposal to provide for increased consideration of $80.00 per share in cash and stated that Dollar General was willing to agree to divest up to 1,500 retail stores in order to achieve the requisite antitrust approvals and agree to pay a $500 million "reverse termination fee" to Family Dollar in the event the proposed transaction was not completed for antitrust reasons. Our Board of Directors, after consultation with their advisors, unanimously rejected each proposal from Dollar General on the basis of antitrust regulatory considerations and has unanimously reaffirmed its recommendation that shareholders vote to adopt the Dollar Tree merger agreement. On September 4, 2014, Dollar Tree and Family Dollar amended the Dollar Tree merger agreement to include a commitment by Dollar Tree to divest as many stores as necessary or advisable to obtain antitrust clearance for the transaction.
On September 10, 2014, Dollar General commenced an unsolicited conditional tender offer to acquire all the outstanding common shares of Family Dollar for $80.00 per share in cash. On September 19, 2014, Dollar General filed Form PREC 14A, a preliminary solicitation of proxies in opposition to the proposed acquisition of Family Dollar by Dollar Tree. The offer to purchase is scheduled to expire at 5:00 p.m., New York City time, on October 31, 2014, unless the offer is further extended. The tender offer is subject to numerous conditions. On September 15, 2014 and October 13, 2014, our Board of Directors unanimously recommended Family Dollar's shareholders reject Dollar General's unsolicited conditional tender offer and not tender their shares to Dollar General and reaffirmed its prior recommendation, respectively. In conjunction with its rejection of Dollar General's offer, our Board of Directors, after consultation with their advisors, unanimously reaffirmed its recommendation that shareholders vote to adopt the transaction with Dollar Tree.
On August 11, 2014, Dollar Tree filed a Form S-4 Registration Statement, and on September 25, 2014, October 20, 2014, and October 27, 2014, Dollar Tree filed Amendment No. 1, Amendment No. 2, and Amendment No. 3 to the Amended Form S-4 Registration Statement, respectively. The consummation of the merger with Dollar Tree is subject to customary closing conditions including adoption of the Dollar Tree merger agreement by Family Dollar's shareholders and the expiration or termination of all waiting periods applicable to the merger under the Hart-Scott-Rodino Antitrust Improvements Acts of 1976, as amended. The close of the merger is not subject to any financing condition or a vote of Dollar Tree's shareholders. The merger could be in a position to close as early as December 2014.
The Federal Trade Commission ("FTC") issued a "second request" in connection with the merger and Dollar General's unsolicited conditional tender offer. On October 21, 2014, Family Dollar announced that it has certified substantial compliance with the FTC's second requests for both the Dollar Tree transaction and the Dollar General tender offer.
On October 20, 2014, Family Dollar announced that it has established October 30, 2014 as the record date for determining stockholders entitled to receive notice of, and vote at, the special meeting of stockholders, at which Family Dollar stockholders will be asked to adopt the merger agreement, as amended, with Dollar Tree.
The foregoing description of the Dollar Tree merger agreement does not purport to be complete and is qualified in its entirety by reference to the full text of the Dollar Tree merger agreement, a copy of which is filed as Exhibit 2.1 to our Current Report on Form 8-K filed with the SEC on July 28, 2014, and the terms of which are incorporated herein by reference. The Dollar Tree merger agreement should not be read alone, but should instead be read in conjunction with the other information regarding us that is or will be contained in, or incorporated by reference into, the Forms 10-K, Forms 10-Q and other documents we file with the SEC.
5
Our Company Goals
During fiscal 2014, we remained focused on achieving our four corporate goals: deliver profitable sales growth; build customer loyalty and experience; develop diverse, high performing teams; and drive continuous improvement.
Deliver profitable sales growth
Over the past several fiscal years, we executed a number of merchandising initiatives intended to improve our consumables assortment and to drive more trips to our stores. We expanded our assortment of food, increased our selection of health and beauty aids, and added a number of new merchandise categories, including tobacco products. In September 2012, we engaged in a six-year, exclusive partnership with McLane Company, Inc. ("McLane"), a supply chain services company, to allow us to offer an expanded assortment of frozen and refrigerated food, improve our in-stock levels, and distribute tobacco products to our stores. Through these initiatives, we have continued to drive customer traffic in key consumable categories. In fiscal 2014, our consumables sales increased 2.4% to 73.4% of total sales, as compared to fiscal 2013. We will continue to optimize our consumables assortment, and we expect this trend will continue in fiscal 2015.
While sales of consumables were strong in fiscal 2014, our sales in higher-margin Discretionary categories continued to be challenged. The holiday season was especially difficult and proved to be an early sign of the challenging operating environment we faced for the remainder of our fiscal year. We believe our consumers continued to face economic hardships, which resulted in increased promotional activity across multiple retail channels. Discretionary sales decreased 2.9% in fiscal 2014, as compared to fiscal 2013, which negatively impacted gross margin.
Private brands remain an opportunity to increase sales and profitability. In fiscal 2014, private brand sales increased approximately 11%, as compared to fiscal 2013, and represented approximately 29% of total sales. This growth was driven by the introduction of over 700 new and converted private brand SKUs to our assortment in fiscal 2014. Building on this momentum, in fiscal 2015 we intend to increase our penetration of private brands even further with a greater focus on quality.
In fiscal 2014, approximately 21% of our merchandise purchases (at cost) were manufactured overseas. Of these purchases (at cost), we imported approximately 13% ourselves through our global sourcing program and the remainder were imported and purchased through our domestic suppliers. To improve efficiencies and execution, we closed our Shanghai and Bangkok offices and increased our focus on our Hong Kong and Shenzhen offices, where more than 80% of our imported products are sourced. We continue to evaluate our global sourcing program to drive further efficiencies.
We opened 526 new stores in fiscal 2014. After a comprehensive review of our business, we also completed an initiative to close 377 underperforming stores in the second half of fiscal 2014, in addition to 23 store closures prior to the implementation of our restructuring initiative. In fiscal 2015, we plan to slow our store growth and open approximately 375 new stores, while closing approximately 40 stores, for a net store growth of 335.
Build customer loyalty and experience
In today's economic environment, value and convenience continues to resonate with consumers. To capitalize on this opportunity, in fiscal 2014 we launched and continued to execute several initiatives designed to increase our relevancy to customers by enhancing their shopping experience and to improve their perception of our value and convenience proposition.
We invested significantly to lower prices on nearly 1,000 basic items to deliver more compelling value to our customers. As a result of customer demand, we have expanded and refined our food and household assortments. In fiscal 2014, we added approximately 400 new food items to expand our assortment of key national brands to attract customers and build customer loyalty. We also reduced shelf space in categories where customer response has not met our expectations, and we improved product adjacencies to make it easier for our customers to shop.
In fiscal 2014, we enhanced our ongoing, comprehensive, multi-year store renovation program based on operational learnings and customer feedback. As a part of this program, we introduced an updated store layout, which repositioned our destination categories to drive more impulse purchases and enhance profitability. We renovated, relocated, or expanded 738 stores in fiscal 2014. Since fiscal 2011, we have renovated, relocated or expanded 3,441 stores.
Develop diverse, high-performing teams
We believe customer satisfaction is strongly linked with employee engagement, which is why we continue to invest in
6
developing diverse, high-performing teams. We continue to focus on strengthening Family Dollar culture and engaging Team Members, while also optimizing talent and building leadership capabilities. In fiscal 2014, we made improvements in key leadership roles, programs, and processes, with a focus toward improving the store Team Member experience. As part of our internal strategic initiatives, we optimized the workforce through headcount reduction at the Store Support Center to ensure we have teams well positioned to support our stores, efficiently operate our business, and move key initiatives forward.
During fiscal 2014, we continued to support and strengthen our store teams. We hosted our Annual Leadership Conference, with more than 1,000 of our leaders in this field-focused event to provide an opportunity for leadership messaging, business updates, reinforcement of our strategic plan, recognition, and leadership development. We also continued to reallocate headcount from the Store Support Center in the roll-out of a Field Human Resources Support team consisting of Human Resources Managers to provide our field leadership with support in areas such as talent development, team relations, and retention.
In fiscal 2014, we also continued to strengthen our management team, with key changes in Merchandising, Marketing, Store Operations, Finance, Information Technology, and Supply Chain. We continued to improve programs and practices to reduce Store Manager turnover, which decreased approximately 18% from fiscal 2013. We continued to enhance benefits for our Team Members, such as launching a discounted employee stock purchase program and increasing our matching contributions for our employee 401(k) plan.
Drive continuous improvement
In fiscal 2014, we continued to improve our operational efficiency and effectiveness through a number of initiatives. We continued our ongoing cross-functional effort to simplify store-level tasks and improve execution, primarily through technology initiatives.
• | We deployed a new security tagging program to 65% of the chain, which has contributed to lower inventory shrinkage over fiscal 2013, in comparison to stores without the new system. |
• | We upgraded the point-of-sale ("POS") system in more than 1,100 stores and combined our voice, data, and security monitoring services into a service from one provider in approximately 1,000 stores. As stores convert to this model, they receive better bandwidth, voice and security services, wireless network connections, and back-up network capabilities. |
• | We successfully re-implemented our Enterprise Resource Planning ("ERP") system and introduced new business intelligence capabilities for Finance, Human Resources, and department management across the Company. |
• | We converted two of our distribution centers, and began conversion of a third distribution center, to a pallet delivery process to enable store teams to unload and process freight faster and more easily than traditional door-to-shelf processes. |
• | We introduced a mobility platform and deployed iPads to enable leaders to easily access information and allow for better informed decisions and support for store teams. |
Overview of our Business Operations
Our Customers
Our strategy of providing customers with value and convenience continues to attract customers in a wide range of income brackets, ethnicity groups, and life stages. Our offerings are particularly attractive to consumers in the low to lower-middle income brackets or fixed income households. Depending on their financial situation and geographic proximity, customers rely on Family Dollar for weekly fill-in shopping trips for essential needs or for periodic trips to stock up on household items. To attract new and retain existing customers, we continue to focus on product quality and selection, value, convenient locations, improved store standards, and a pleasant overall customer experience.
Our Stores
A Family Dollar store is typically between 7,500 and 9,500 square feet, with an average of approximately 7,150 square feet of selling space. Our stores generally serve customers who live within three to five miles of the store. At the end of fiscal 2014, we operated 8,042 stores, totaling 58.1 million selling square feet. Approximately 24% of our stores were located in large
7
urban markets, and approximately 20% of our stores were located in small urban markets or suburban areas. Approximately 55% of our stores were in strip malls, 43% were in freestanding buildings and 2% were in downtown buildings.
The relatively small size of a Family Dollar store allows us to select store locations in neighborhoods convenient to our customers in each of these market areas. Family Dollar stores are generally open seven days a week and typically operate between the hours of 8:00 a.m. and 10:00 p.m. Our stores accept cash, checks, debit cards, credit cards, and other electronic payment types, including food stamps.
Our Merchandise
We provide customers with a quality assortment of basic necessities and seasonal merchandise at everyday low prices. While the number of SKUs in a given store can vary based upon the store's size, geographic location, merchandising initiatives, and other factors, our typical store generally carries approximately 6,500 to 7,500 basic SKUs, with fluctuations in seasonal items throughout the year. The majority of our products are priced at $10 or less, with approximately 22% priced at $1 or less. Our stores operate on a self-service basis, and our low overhead enables us to sell merchandise at a relatively moderate markup. In fiscal 2014, the number of customer transactions in comparable stores decreased, as compared to fiscal 2013; however, the amount customers spent during each trip increased.
We offer a focused assortment of merchandise in a number of core categories, such as health and beauty aids, packaged food and refrigerated products, tobacco products, home cleaning supplies, housewares, stationery, seasonal goods, apparel, and home fashions. Reflecting trends in customer demand and diversity of our store base, we are launching a multi-year initiative to cluster assortments based on market dynamics.
We manage the business on the basis of one operating segment and therefore, have only one reportable segment. All stores operate under the Family Dollar name and are substantially the same in terms of size, merchandise, customers, distribution, and operations. The Company has no franchised locations or other lines of business. All of the Company's operations are located in the United States with the exception of certain sourcing entities located in Asia and Europe. The foreign operations solely support domestic operations and are not material. The following table summarizes the percentage of net sales attributable to each product category over the last three fiscal years.
Product Category | 2014 | 2013 | 2012 | ||||||
Consumables | 73.4 | % | 72.4 | % | 69.0 | % | |||
Home Products | 9.6 | % | 10.1 | % | 11.4 | % | |||
Apparel and Accessories | 7.3 | % | 7.6 | % | 8.8 | % | |||
Seasonal and Electronics | 9.7 | % | 9.9 | % | 10.8 | % | |||
The following table describes our product categories in more detail.
8
Consumables | Batteries |
Diapers | |
Food | |
Hardware and automotive supplies | |
Health and beauty aids | |
Household chemicals | |
Paper products | |
Pet food and supplies | |
Tobacco | |
Home Products | Domestics, including blankets, sheets and towels |
Giftware | |
Home décor | |
Housewares | |
Apparel and Accessories | Boys' and girls' clothing |
Fashion accessories | |
Infants' clothing | |
Men's clothing | |
Shoes | |
Women's clothing | |
Seasonal and Electronics | Personal electronics, including pre-paid cellular phones and services |
Seasonal goods | |
Stationery and school supplies | |
Toys | |
We sell high-quality national brands from leading manufacturers including Procter & Gamble, Coca-Cola, Unilever, Nestle, Kimberly Clark, Clorox, Colgate Palmolive, Georgia Pacific, Frito-Lay, Inc., and PepsiCo, which are typically sold at higher prices elsewhere. During fiscal 2014, nationally advertised brand name merchandise accounted for approximately 71% of sales. Merchandise sold under our private brands program, across all merchandise categories, accounted for approximately 29% of sales. During fiscal 2014, closeout merchandise accounted for approximately 3% of total sales.
We purchase merchandise from a wide variety of suppliers and generally have not experienced difficulty in obtaining adequate quantities of merchandise. In fiscal 2014, no single supplier accounted for more than 9% of the merchandise we sold. We purchased approximately 17% of our merchandise (at cost) through our relationship with McLane, which distributes Consumables merchandise from multiple manufacturers.
In fiscal 2014, approximately 21% of our merchandise purchases (at cost) were manufactured overseas. Of these purchases (at cost), we imported approximately 13% ourselves through our global sourcing program and the remainder were imported and purchased through our domestic suppliers. Our vendor arrangements provide for payment in U.S. dollars.
We maintain a substantial variety and depth of merchandise inventory in stock in our stores, and in our distribution centers for weekly store replenishment, to attract customers and meet their shopping needs. We negotiate vendors' trade payment terms to help finance the cost of carrying this inventory. We balance the value of maintaining high inventory levels required to meet customer demand with the potential risk of having inventories at levels exceeding such demand that may need to be marked down in price in order to sell.
Store Operations
We independently manage and operate all of our 8,042 stores in 46 states. For each store, a store manager is responsible for hiring and training store employees, managing the financial performance of the store, and providing quality customer service. The store manager reports to a district manager or area operations manager. A district manager or area operations manager is typically responsible for 15 to 20 stores. During fiscal 2014, no single store accounted for more than one-tenth of one percent of total sales.
Distribution and Logistics
During fiscal 2014, manufacturers or distributors shipped approximately 23% of our merchandise purchases directly to stores. The balance of the merchandise was shipped to one of our eleven distribution centers. To provide consistent, cost-effective service, we enlist the services of several national transportation companies throughout the United States as well as our own
9
private fleet of trucks to deliver merchandise to stores from our distribution centers. During fiscal 2014, approximately 94% of the merchandise delivered to our stores from the distribution centers was delivered by common or contract carriers.
At the end of fiscal 2014, each distribution center served an average of 730 stores, as compared to 720 stores in fiscal 2013. Our tenth distribution center in Ashley, Indiana, began operations in June 2012, and our eleventh distribution center in St. George, Utah, began operations in July 2013. With the current footprint of stores and the opening of the eleventh distribution center in July 2013, the average store distance from distribution center declined approximately 2% at the end of fiscal 2014, as compared to the end of fiscal 2013, and approximately 7% at the end fiscal 2013, as compared to the end of fiscal 2012.
Competition
Our industry is highly competitive on the basis of store locations, convenience, price and quality of merchandise, in-stock consistency, merchandise assortment and presentation, and customer service. We compete for sales and store locations in varying degrees with international, national, regional and local retailing establishments, other discount stores, department stores, variety stores, dollar stores, discount clothing stores, drug stores, grocery stores, convenience stores, outlet stores, warehouse stores and other stores. Many other large U.S. retailers have stores in areas in which we operate. We believe the relatively small size of our stores permits us to operate new stores in most areas, including rural areas and large urban markets, in locations convenient to our customers.
Seasonality
Historically, sales have been highest in the second fiscal quarter (December, January, and February) in connection with the holiday season, representing approximately 27% of total annual sales over the last five fiscal years. Our quarterly results can also be impacted by the timing of certain holidays. We purchase significant amounts of seasonal inventory during the fourth and first quarter in anticipation of in-transit lead times in preparation for the holiday season.
Working Capital
We maintain an adequate level of working capital to support our business needs and our customers' requirements. Such working capital requirements are not, however, in the opinion of management, materially different from those experienced by our major competitors. We believe our sales and payment terms are competitive in and appropriate for the markets in which we compete.
Trademarks
We have registered with the U.S. Patent and Trademark Office the names Family Dollar® and Family Dollar Stores® as service marks, and also have registered, or have filed registration applications for, other names and designs as trademarks for certain merchandise sold in our stores, such as Family Gourmet®, Family Pet®, Kidgets® and Outdoors by Design®. Although in aggregate we consider our trademarks to be valuable to our operations, we do not believe our business is materially dependent on a single trademark or any group of trademarks.
Employees
As of August 30, 2014, we had approximately 35,000 full-time employees and approximately 25,000 part-time employees. None of our employees are covered by collective bargaining agreements. We consider our employee relations generally to be good.
NYSE Certification
In accordance with New York Stock Exchange ("NYSE") rules, on February 10, 2014, we filed the annual certification by our Chief Executive Officer certifying that, as of the date of the certification, Family Dollar was in compliance with the NYSE listing standards. For the fiscal year ended August 30, 2014, our Chief Executive Officer and our Chief Financial Officer executed the certifications required by Section 302 of the Sarbanes-Oxley Act of 2002, which are filed as exhibits to this Report.
10
ITEM 1A. RISK FACTORS
The risks described below could materially and adversely affect our business, financial condition, and results of operations. We also may be adversely affected by risks not currently known or risks we do not currently consider material to our business.
The first section of risk factors below, "Risks Related to our Business," represent those faced by Family Dollar as a standalone company and should be read in conjunction with the second section of risk factors below, "Merger Related Risks," which represent risks Family Dollar currently faces under the Dollar Tree merger agreement.
Risks Related to our Business
Current economic conditions and other economic factors could adversely impact our business in various respects, including impacting our customer's disposable income or discretionary spending.
Our customers' low level of participation in the recovery of the U.S. economy, economic slowdown, or other economic factors may affect disposable consumer income and discretionary spending. Such factors include increased or sustained high unemployment or underemployment levels, increased costs of essential services including medical care and utilities, inflation, business conditions, fuel and energy costs, shopping patterns, consumer debt levels, lack of available credit, delays in tax refunds, and higher interest rates and tax rates. Changes in discretionary spending may cause customers to shift spending to products other than those we sell or change the mix of our sales toward less profitable products. These potential unfavorable customer spending trends may result in slower inventory turnover and greater markdowns on inventory.
The current global economic uncertainty, the impact of recessions, the failure of Congress to approve budgets in a timely manner, and the potential for failures or realignments of financial institutions and the related impact on available credit may impact our suppliers, our landlords, and our operations in an adverse manner including, but not limited to, our inability to readily access liquid funds or credit, increases in the cost of credit, bankruptcy of our suppliers or landlords, and other impacts, which we are currently unable to fully anticipate.
We operate in a highly competitive environment and, as a result, we may not be able to compete effectively or maintain or increase our sales, market share or margins.
We operate in the highly competitive discount retail merchandise sector with numerous competitors, some of which have greater resources than us. We compete for customers, merchandise, real estate locations, and employees. This competitive environment subjects us to various risks, including the ability to continue our store and sales growth and to provide attractive merchandise to our customers at competitive prices that allow us to maintain our profitability. Price reductions by our competitors may result in the reduction of our prices and a corresponding reduction in our profitability.
Consolidation in our retail sector, changes in pricing of merchandise, or offerings of other services by competitors could have a negative impact on the relative attractiveness of our stores to consumers. Our large box competitors are opening stores under small box formats, which creates more competition, particularly in urban markets.
We face increased competition from the use of mobile and web-based technology that facilitates on-line shopping and real-time product and price comparisons. Additionally, the pervasiveness and viral nature of social media could negatively portray or influence our business, employees, and products.
The Company has entered into the Dollar Tree merger agreement. Dollar General has made an unsolicited conditional tender offer to acquire all of the outstanding shares of Family Dollar common stock, and filed a preliminary proxy statement to solicit proxies in opposition to the Dollar Tree merger. The uncertainty surrounding the structure of a combined chain, the target market of a combined chain, and the retention of our current brands and product offerings may have an adverse impact on our current business operations. Our ability to provide convenience in a small box retail format, while offering attractive, competitively-priced products could be impacted by various actions of our competitors that are beyond our control. See Item 1 - "Competition" for further discussion of our competitive position.
Our plans depend significantly on initiatives designed to increase sales and improve the efficiencies, costs, and effectiveness of our operations, independent of business combination transactions. Failure to achieve these plans could affect our performance adversely.
Higher costs or any failure to achieve targeted results associated with the implementation of new programs or initiatives could adversely affect our results of operations. We are undertaking a variety of operating initiatives and infrastructure initiatives
11
including, but not limited to, a significant investment to permanently lower prices on a variety of products, merchandise expansions, a comprehensive store renovation program, private brand expansion, and global sourcing initiatives. These changes may result in temporary disruptions to our business and negatively impact sales. We have also undergone an initiative to close a number of underperforming stores. If, during this store closure initiative, we closed stores with future potential of being higher performing stores or did not close an appropriate number of underperforming stores, there could be an adverse impact on our operations and financial performance. The failure to properly execute any of these initiatives or the failure to obtain the anticipated results of such initiatives could have an adverse impact on our future operating results.
Any disruption in our ability to select, obtain, distribute, and market merchandise attractive to customers at prices allowing us to profitably sell such merchandise could adversely impact our business.
We generally have been able to select and obtain sufficient quantities of attractive merchandise at prices allowing us to profitably sell such merchandise. If we are unable to continue to acquire products attractive to our customers, to obtain such products at costs allowing us to sell such products at a profit, or to market such products effectively to consumers, our sales or profitability could be adversely affected. In addition, the success of our business depends in part on our ability to identify and respond promptly to evolving trends in demographics and consumer preferences, expectations and needs across all markets in which we operate stores. Failure to maintain an attractive selection and to timely identify or effectively respond to changing consumer needs, preferences and spending patterns could adversely affect our relationship with customers, the demand for our products, and our market share.
We have substantially increased the number of our private brand items over the past several years, and the program is a sizable part of our future growth plans. We believe our success in maintaining broad market acceptance of our private brands depends on many factors, including our pricing, costs, quality and customer perception. We may not achieve or maintain our expected sales for our private brands and, as a result, our business and results of operations could be adversely impacted. Additionally, the increased number of private brands could negatively impact our existing relationships with our non-private brand suppliers.
Inappropriate pricing causes products to be less attractive to our customers. We continue to enhance our pricing capabilities to drive customer loyalty and have established a strategic pricing team to improve our value perception and to increase profitability. Inability to successfully implement new pricing strategies could have a negative effect on our business.
Any disruption in the supply or increase in pricing of our merchandise could negatively impact our ability to achieve anticipated operating results. A significant amount of our merchandise is manufactured outside the United States, and changes in the prices and flow of these goods for any reason could have an adverse impact on our operations. For example, because a substantial amount of our imported merchandise is manufactured in China, a change in the Chinese currency or other policies could negatively impact our merchandise costs. The United States and other countries have occasionally proposed and enacted protectionist trade legislation, which may result in changes in tariff structures, trade policies, and restrictions. Any changes could increase the cost of or reduce the availability of certain merchandise. Any of these or other measures or events relating to suppliers and the countries in which they are located, some or all of which are beyond our control, can negatively impact our operations, increase costs, and reduce our profitability.
In addition, our business could be negatively impacted if we cannot find qualified suppliers who meet our standards, and to access products in a timely and efficient manner, especially with respect to suppliers located and goods sourced outside the United States. Political and economic instability in the countries in which foreign suppliers are located, the financial instability of suppliers, suppliers' failure to meet our supplier standards, labor problems experienced by our suppliers, the availability of raw materials to suppliers, merchandise quality issues, currency exchange rates, transport availability, and cost, transport security, inflation, and other factors relating to the suppliers and the countries in which they are located are beyond our control. These and other factors affecting our suppliers, our access to products, and our ability to transport those products could affect our financial performance adversely.
Inability to attract, train, and retain qualified employees, executive officers, and other key personnel, and to control labor costs could adversely affect our business.
Our continuity of business knowledge and growth of the Company could be adversely impacted by our inability to attract, train, and retain qualified employees at the store operations level, in distribution facilities, in sourcing offices, and at the corporate headquarters (the "Store Support Center") level. With uncertainty surrounding the future state of the Company, the pending merger with Dollar Tree, and the unsolicited conditional tender offer from Dollar General, it could become increasingly difficult to retain qualified employees. Additionally, we continually face challenges to reduce turnover at the store operations level, which could negatively impact the customer experience. Various other factors, such as overall labor availability, wage rates, union organizing activity, regulatory or legislative impacts, and benefit costs could all impact our ability to attract, train,
12
and retain employees negatively. We do not currently maintain key person life insurance policies with respect to our executive officers or key personnel.
Our ability to retain qualified employees could impact our ability to profitably conduct our operations and adversely impact our results of operations. Further, our ability to attract or realign our executive officers and key personnel is further complicated by the uncertainty of the future state of the Company. Any changes could require discussion and approval from Dollar Tree, under the Dollar Tree merger agreement.
Our growth is dependent upon our ability to increase sales in existing stores, the success of our new store-opening program and our store renovation program, and our ability to successfully identify and close underperforming stores.
Our growth is dependent on both increases in sales in existing stores and our ability to open profitable new stores. Sales growth in existing stores is dependent upon factors including competition, merchandise selection, store operations, and customer satisfaction. Our ability to open profitable new stores is dependent upon factors including having available capital resources, identifying suitable locations for new stores, negotiating favorable leases and development agreements, competing against local competition, and gaining name recognition in new markets. Unavailability of attractive store locations, delays in acquisition or opening of new stores, and delays or unexpected costs associated with remodeling and renovating existing stores, may negatively impact new store growth and profitability of remodeled or renovated stores. Additionally, difficulties in staffing and operating both existing and new store locations, and lack of customer acceptance of stores in new market areas or our renovated store design may impact our ability to increase sales.
We continually reassess the location and profitability of our store locations. During the second half of fiscal 2014, we closed a number of stores beyond our normal plans for store closures. If, during this store closure initiative, we closed stores with future potential of being higher performing stores or did not close an appropriate number of underperforming stores, there could be an adverse impact on our operations and financial performance. Further, if a significant number of stores will be required to be closed as a result of a business combination, this could have an adverse impact on our operations.
We depend heavily on technology systems to support all aspects of our operations. The failure of existing or new technology to provide anticipated benefits could adversely affect our results of operations.
Our business depends heavily upon the efficient operation of our technological resources. A failure in our information technology systems or controls could negatively impact our operations. In addition, we continuously upgrade and update our current technology or install new technology. In fiscal 2014, the Company re-implemented an Enterprise Resource Planning ("ERP") system. The Company believes it has taken the necessary steps to mitigate risk associated with this reimplementation, including a comprehensive review of internal controls, extensive employee training, and additional verifications and testing to ensure data integrity. Our inability to implement upgrades, updates, or installations in a timely manner, to train our employees effectively in the use of our technology, or to obtain the anticipated benefits of our technology could adversely impact our operations or profitability.
Our technology systems, including our back-up systems, are subject to damage or interruption from power outages, computer and telecommunications failures, computer viruses, other malicious computer programs, denial-of-service attacks, security breaches, catastrophic events such as fires, tornadoes, earthquakes and hurricanes, and usage errors by our employees. If our technology systems and our back-up systems are damaged, breached, or cease to function properly, we may incur significant costs to repair or replace them, and we may suffer interruptions in our operations. Any material interruption in both our technology systems and back-up systems may have an adverse effect on our business or results of operations.
Operational difficulties, including those associated with our ability to develop and operate our stores and distribution facilities, could adversely impact our business.
Our stores are decentralized and are managed through a network of geographically dispersed management personnel. In addition, we rely upon our distribution and logistics network to provide goods to stores in a timely and cost-effective manner. Any disruption, unanticipated expense, or operational failure related to this process could impact our store operations negatively. We maintain a network of distribution facilities throughout our geographic territory and build new facilities to support our growth objectives. Delays in opening distribution facilities or stores could adversely affect our future operations by slowing the unit growth, which may in turn reduce revenue growth. Adverse changes in the cost of operating distribution facilities and stores, such as changes in labor, utility and other operating costs, could have an adverse impact on our financial performance.
13
Our profitability is vulnerable to cost increases, inflation and energy prices.
Future increases in our costs, such as the cost of merchandise, shipping rates, freight and fuel costs, and store occupancy costs, may reduce our profitability. The minimum wage has increased or is scheduled to increase in multiple states and local jurisdictions, and there is a possibility Congress will increase the federal minimum wage. These cost changes may be the result of inflationary pressures which could further reduce our sales or profitability. Increases in other operating costs, including changes in energy prices, wage rates and lease and utility costs, may increase our costs of sales or operating expenses and reduce our profitability.
Our performance may be adversely impacted if we are not successful in managing our inventory balances.
Our inventory balance represented approximately 42% of our total assets as of August 30, 2014. Efficient inventory management is a key component of our business success and profitability. To be successful, we must maintain sufficient inventory levels and appropriate product mix throughout the year to meet our customers' demands without allowing those levels to increase to such an extent that the cost to store and hold the goods adversely impacts our financial results. If our buying decisions are not accurate or well-timed in correlation to customer trends and spending levels, we may incur unanticipated markdowns to dispose of the excess inventory. Further, we believe excess inventory levels in stores subjects us to the risk of increased inventory shrinkage. If we are not successful in managing our inventory balances and shrinkage, our results from operations and cash flows from operations may be negatively affected.
Changes in and our compliance with state or federal legislation or regulations could impact our operations.
We employ more than 60,000 team members and are exposed to the risk federal or state legislation, particularly related to our team members, may negatively impact our operations. Changes in federal or state wage requirements, employee rights, health care, social welfare or entitlement programs such as health insurance, paid leave programs, or other changes in workplace regulation or tax laws could adversely impact our ability to achieve our financial targets. Changes in other regulatory areas, such as consumer credit, privacy and information security, product safety, supply chain transparency or environmental could cause our expenses to increase. In 2010, Congress enacted comprehensive health care reform legislation which includes guaranteed coverage requirements, eliminates pre-existing condition exclusions and annual and lifetime maximum limits, restricts the extent to which policies can be rescinded, and imposes new and significant taxes on health insurers and health care benefits. Due to the complexity of the health care reform legislation, the challenges faced in implementation regulations and interpretive guidance, and the phased-in nature of the implementation, it is difficult to predict the overall impact of the health care reform legislation on our business over the coming years. Possible adverse effects of the health care reform legislation include increased costs, exposure to expanded liability, and requirements for us to revise ways in which we conduct business.
Our business is subject to federal, state, local, and international laws, rules, and regulations, such as state and local wage and hour laws, anti-corruption laws, import and export laws, unclaimed property laws, and many others. The complexity of the regulatory environment in which we operate and the related cost of compliance are both increasing due to legal and regulatory requirements, increased enforcement, and our ongoing expansion of our global sourcing operations. In addition, as a result of operating in multiple countries, we must comply with multiple foreign laws and regulations which may differ substantially from country to country and may conflict with corresponding U.S. laws and regulations. We may also be subject to investigations or audits by governmental authorities and regulatory agencies. These investigations and audits can occur in the ordinary course of business or can result from increased scrutiny from a particular agency towards an industry, country, or practice. If we fail to comply with laws, rules, and regulations or the manner in which they are interpreted or applied, we may be subject to government enforcement action, class action litigation or other litigation, damage to our reputation, civil and criminal liability, damages, fines and penalties, and increased cost of regulatory compliance, any of which could adversely affect our results of operations and financial performance.
Adverse impacts associated with legal proceedings and claims could negatively affect our business.
The ongoing antitrust investigations by federal and state regulators of the pending merger between Family Dollar and Dollar Tree and Dollar General's proposals to Family Dollar could negatively impact our store operations, growth, and financial results. The investigations could extend for a significant time, and regulators may seek to prohibit such transactions or, as a condition to approving such transactions, require the divestiture of certain stores and other assets.
We are involved in a number of legal proceedings which include employment, shareholder actions, tort, real estate, commercial, and other litigation. Certain of these lawsuits, if decided adversely to us or settled by us, may result in a liability material to our results of operations, financial condition, and liquidity.
14
Lawsuits filed by competitors for alleged violations of certain restrictive covenants, binding on the occupants of shopping centers, could also have an adverse impact on our store operations. We, and many of our competitors, are currently engaged in a lawsuit with Winn-Dixie, and depending on the outcome of the lawsuit, the sale of food or other items at Family Dollar stores in locations near Winn-Dixie may be limited, which would negatively impact sales.
Nationally, the number of employment-related class actions filed each year has continued to increase, and recent changes and proposed changes in federal and state laws may cause claims to rise even more. We are currently a defendant in numerous employment cases containing class-action allegations, including those in which the plaintiffs have alleged violations of federal and state wage and hour laws. The cost to defend these class-action lawsuits may be significant. Plaintiffs in these types of cases may seek recovery of significant or indeterminate amounts, and the magnitude of the potential loss relating to these lawsuits may remain unknown for substantial periods of time. In addition, certain of these lawsuits, if decided adversely to us or settled by us, may result in a liability material to our financial statements as a whole or may negatively affect our operating results if changes to our business operations are required.
There also may be adverse publicity associated with litigation that could negatively affect customer perception of our business, regardless of whether the allegations are valid or whether we are ultimately found liable. As a result, litigation may adversely affect our business, financial condition and results of operations. Refer to Note 13 to the Consolidated Financial Statements included in this Report for further details regarding certain of these pending matters.
If we are unable to secure our customers' confidential and credit card information, or other private data relating to our employees, suppliers or the Company, we could be subject to negative publicity, costly government enforcement actions or private litigation, which could damage our business reputation and adversely affect our profitability.
The protection of our customer, employee and Company data is critical to us. We have procedures and technology in place to safeguard our customers' debit and credit card information, our employees' private data, suppliers' data, and the Company's records and intellectual property. As a retailer that accepts debit and credit cards for payment, we are subject to the Payment Card Industry Data Security Standard ("PCI DSS"), issued by the PCI Council. PCI DSS contains compliance guidelines and standards with regard to our security surrounding the physical and electronic storage, processing, and transmission of individual cardholder data.
Despite our compliance with PCI DSS standards, the procedures, technology and other information security measures, we cannot be certain all our information technology ("IT") systems are able to prevent, contain or detect any cyber-attacks, cyber- terrorism, or security breaches from known malware or malware that may be developed in the future. As evidenced by other retailers who have recently suffered serious security breaches, we may be vulnerable to, and unable to detect and appropriately respond to, data security breaches and data loss, including cyber-security attacks. If we experience a data security breach of any kind, whether external, internal or misuse of sensitive data, we could be exposed to negative publicity, government enforcement actions, private litigation, penalties or costly response measures, which may not be covered by our insurance policies. In addition, our reputation within the business community and with our customers may be affected, which could result in our customers discontinuing the use of debit or credit cards in our stores or not shopping in our stores altogether.
A breach of our security measures, a breach of our third-party service providers' security measures, or failure to comply with applicable privacy and information security laws and regulations could result in exposure of sensitive data. Such a breach or failure, which could go undetected for a period of time or not be detected at all, could have the following impacts:
• | Result in significant costs to protect compromised customers' or employees' personal data and to restore their confidence in us; |
• | Require significant resources to address the problems and to further upgrade the security measures, which guard sensitive information; and |
• | Result in disruption of our operations which could require us to make changes to our information systems and administrative processes to address security issues and compliance with applicable laws and regulations. |
To the extent any disruption results in the loss, damage or misappropriation of information, we may be adversely affected by claims from customers, financial institutions, regulatory authorities, payment card associations, and others. In addition, the cost of complying with stricter privacy and information security laws and standards could be significant to us.
15
We rely on suppliers, third-party distributors, and carriers whose operations are outside our control and any failure by them to deliver products in a timely manner may damage our reputation and could cause us to lose customers.
We rely on arrangements with third-party distributors and carriers such as independent shipping companies for timely delivery of products to stores and distribution operations throughout the country. As a result of our reliance on third-party distributors and carriers, including McLane, we are subject to carrier disruptions and increased costs due to factors beyond our control, including labor strikes, inclement weather, natural disasters, trade restrictions, and increased fuel costs. If the services of any of these third parties become unsatisfactory, we may experience delays in meeting our customers' product demands and we may not be able to find a suitable replacement on a timely basis or on commercially reasonable terms. Any failure to deliver products in a timely manner may damage our reputation and could cause us to lose customers.
Our largest supplier accounted for almost 9% of our merchandise purchases (at cost) and we distributed approximately 17% of our merchandise through our relationship with McLane. We have not experienced difficulty in obtaining sufficient quantities of core merchandise and believe, if one or more of our current sources of supply became unavailable, we would generally be able to obtain alternative sources without experiencing a substantial disruption of our business. However, such alternative sources could increase our merchandise costs and reduce the quality of our merchandise, and an inability to obtain alternative sources could adversely affect our sales.
Our ability to obtain additional financing on favorable terms, if needed, could be adversely affected by the uncertainty surrounding the future state of the Company and the volatility in the capital markets.
In the event financial results fall below market expectations for several consecutive quarters, our debt rating could be downgraded, which would have an adverse impact on our ability to secure additional financing. Additionally, the pending merger with Dollar Tree, including the related financing by Dollar Tree and the Financing Sources, as defined in the Dollar Tree merger agreement, could have an adverse impact on our ability to secure additional financing. Further, completion of an acquisition or merger could result in our Company no longer being considered investment grade, which could result in difficulty obtaining additional new financing.
We obtain and manage liquidity from the positive cash flow we generate from our operating activities and our access to capital markets, including our credit facilities with a consortium of banks. There is no assurance our ability to obtain additional financing through the capital markets, if needed, will not be adversely impacted by economic conditions. Tightening in the credit markets, low liquidity, and volatility in the capital markets could result in diminished availability of credit, higher cost of borrowing, and lack of confidence in the equity market, making it increasingly difficult to obtain additional financing on terms favorable to us.
We are exposed to the risk of natural disasters, unusual weather, pandemic outbreaks, global political events, war, and terrorism. These events could disrupt business and result in lower sales, increased operating costs, and capital expenditures.
Our store locations, distribution centers, sourcing offices, and Store Support Center, as well as certain of our vendors and customers, are located in areas which could be subject to unusual weather patterns or natural disasters such as floods, hurricanes, tornadoes or earthquakes. Adverse weather conditions or other extreme changes in the weather, including resulting electrical and technological failures, may disrupt our business and may adversely affect our ability to sell and distribute products.
In addition, we operate in markets susceptible to pandemic outbreaks, war, terrorist acts, or disruptive global political events, such as civil unrest in countries in which our suppliers are located. Our business may be harmed if our ability to sell and distribute products is impacted by any such events. Such events could result in physical damage or temporary closure to one or more of our properties, a temporary shortage of adequate work force in the market, a temporary or permanent disruption or delay in the transport and delivery of goods to our distribution centers and stores, a disruption of technology support or information systems, or fuel shortages or dramatic increases in fuel prices. Additionally, such events could influence customer trends. All these possible outcomes could increase the cost of doing business and negatively impact our net sales, properties or operations.
Failure to comply with our debt covenants could adversely affect our capital resources, financial condition and liquidity.
Our debt agreements contain certain restrictive covenants, which impose various operating and financial restrictions on us. Such restrictions include, but are not limited to, a consolidated debt to consolidated capitalization ratio, a fixed charge coverage ratio, and a priority debt ratio. Our failure to comply with the restrictive covenants in our debt agreements, as a result of one or
16
more of the factors listed in this section, could result in an event of default, which, if not cured or waived, could result in us having to repay our borrowings before their due dates. If we are forced to refinance these borrowings on less favorable terms or if we were to experience difficulty in refinancing the debt prior to maturity, our results of operations or financial condition could be harmed. In addition, if we are in default under any of our existing or future debt facilities, we will be unable to borrow additional amounts under those facilities to the extent otherwise available.
Product and food safety concerns and the effects of legislation and regulations on product and food safety and quality could adversely affect our results of operations and perception by customers.
Federal or state legislation and regulations regarding product and food quality and safety may negatively impact our operations. Any changes in product safety or quality legislation or regulations may lead to product recalls and the disposal or write-off of merchandise inventories, as well as certain fines or penalties and reputational damage. Our inability to timely comply with regulatory requirements or execute product recalls could result in substantial fines or penalties, which could have an adverse impact on our financial results. All our vendors and their products must comply with applicable product and food safety laws.
We may be subject to product liability claims from customers relating to food and other products recalled, defective or otherwise alleged to be harmful. Such claims may result from tampering by unauthorized third parties, product contamination or spoilage, including the presence of foreign objects, substances, chemicals, other agents, or residues introduced during the growing, storage, handling and transportation phases. The outcome of claims against the Company could have an adverse impact on our financial results. Additionally, negative customer perceptions regarding the safety of our products could cause us to lose market share to our competitors, which can be difficult to regain.
Our current insurance program may expose us to unexpected costs and negatively affect our financial performance.
We use a combination of third-party insurance and self-insurance to provide for potential liability for workers' compensation, automobile and general liability, property, director and officers' liability, and employee health care benefits. Any actuarial projection of losses is subject to a high degree of variability. Changes in legal claims, trends and interpretations, variability in inflation rates, changes in the nature and method of claims settlement, benefit level changes due to changes in applicable laws, insolvency of insurance carriers, and changes in discount rates could all adversely affect our financial condition, results of operations, or cash flows.
New accounting guidance or changes in the interpretation or application of existing accounting guidance could adversely affect our financial performance.
New accounting guidance may require systems, which could increase our operating costs, and other changes, including changes to our financial statements. For example, implementing future accounting guidance related to leases, contingencies, and other areas impacted by the convergence project between the Financial Accounting Standards Board ("FASB") and the International Accounting Standards Board ("IASB") could require us to make significant changes to our lease management system or other accounting systems, and could result in changes to our financial statements.
Unanticipated changes in the interpretation or application of existing accounting guidance could result in material charges to or restatements of our financial statements, which may further result in litigation or regulatory actions which could have an adverse effect on our financial condition and results of operations.
Merger Related Risks
The value of the stock portion of the merger consideration is subject to changes based on fluctuations in the value of Dollar Tree common stock, and Family Dollar stockholders may receive stock consideration with a value that, at the time received, is less than $14.90 per share of Family Dollar common stock.
The market value of Dollar Tree common stock will fluctuate during the period before the date of the special meeting of Family Dollar stockholders to vote on the adoption of the Dollar Tree merger agreement, during the 20 trading day period the exchange ratio will be based upon, and the time between the last day of the 20 trading day period and the time Family Dollar stockholders receive merger consideration in the form of Dollar Tree common stock, as well as thereafter.
Upon completion of the merger, each issued and outstanding share of Family Dollar common stock will be converted into the right to receive the per share merger consideration, which is equal to $59.60 in cash and a number of Dollar Tree shares equal to the exchange ratio, which depends on the average stock price. If the average Dollar Tree stock price is greater than $49.08 and less than $59.98 per share, the exchange ratio will be the quotient of $14.90 divided by the average stock price. If the
17
average stock price is greater than or equal to $59.98, the exchange ratio will be 0.2484. If the average stock price is less than or equal to $49.08, the exchange ratio will be 0.3036. Accordingly, the actual number of shares and the value of Dollar Tree common stock delivered to Family Dollar stockholders will depend on the average stock price, and the value of the shares of Dollar Tree common stock delivered for each such share of Family Dollar common stock may be greater than or less than, or equal to, $14.90. It is impossible to accurately predict the market price of Dollar Tree common stock at the effective time or during the period over which the average stock price is calculated and therefore impossible to accurately predict the number or value of the shares of Dollar Tree common stock that Family Dollar stockholders will be delivered in the merger.
The market price of Dollar Tree common stock after the merger will continue to fluctuate and may be affected by factors different from those affecting shares of Family Dollar common stock currently.
Upon completion of the merger, holders of Family Dollar common stock will become holders of Dollar Tree common stock. The market price of Dollar Tree common stock may fluctuate significantly following consummation of the merger and holders of Family Dollar common stock could lose the value of their investment in Dollar Tree common stock. In addition, the stock market has experienced significant price and volume fluctuations in recent times, which could have a material adverse effect on the market for, or liquidity of, the Dollar Tree common stock, regardless of Dollar Tree's actual operating performance. In addition, Dollar Tree's business differs in important respects from that of Family Dollar, and accordingly, the results of operations of the combined company and the market price of Dollar Tree common stock after the completion of the merger may be affected by factors different from those currently affecting the independent results of operations of each of Dollar Tree and Family Dollar.
Dollar Tree does not intend to pay dividends in the foreseeable future, and current Family Dollar stockholders may have to rely on increases in the trading price of Dollar Tree common stock for returns on their investment following the merger. In addition, the Dollar Tree merger agreement places restrictions on Family Dollar's ability to pay dividends.
Family Dollar and Dollar Tree have had different dividend policies historically. Family Dollar has consistently paid a regular quarterly dividend, but Dollar Tree does not currently pay regular quarterly dividends and does not anticipate paying dividends on its common stock in the foreseeable future. Any payment of dividends by Dollar Tree would require approval by the Dollar Tree board of directors and the board may change its dividend policy at any time. As such, Dollar Tree may not pay any regular dividends in the foreseeable future, in which case former Family Dollar stockholders who become stockholders of Dollar Tree would no longer be able to rely on receiving regular dividend payments. Former Family Dollar stockholders, and other Dollar Tree stockholders, would have to rely on increases in the trading price of Dollar Tree common stock for any returns on their investment. In addition, under the Dollar Tree merger agreement, Family Dollar is not permitted to pay dividends other than a single cash dividend of $0.31 in the first quarter of fiscal year 2015.
Sales of shares of Dollar Tree common stock before and after the completion of the transaction may cause the market price of Dollar Tree common stock to fall.
The issuance of new shares of Dollar Tree common stock in connection with the transaction could have the effect of depressing the market price for Dollar Tree common stock.
In addition, many Family Dollar stockholders may decide not to hold the shares of Dollar Tree common stock they will receive in the merger. Other Family Dollar stockholders, such as funds with limitations on their permitted holdings of stock in individual issuers, may be required to sell the shares of Dollar Tree common stock they receive in the merger. Such sales of Dollar Tree common stock could have the effect of depressing the market price for Dollar Tree common stock and may take place promptly following the merger.
Completion of the merger is subject to conditions and if these conditions are not satisfied or waived, the merger will not be completed. The Dollar Tree merger agreement can also be terminated by Family Dollar under certain circumstances relating to a company superior proposal, as described in the Dollar Tree merger agreement.
The obligations of Dollar Tree and Family Dollar to complete the merger are subject to satisfaction or waiver, to the extent permitted under applicable law, of a number of conditions including adoption of the merger by the Family Dollar stockholders, expiration or termination of the applicable waiting periods under the Hart-Scott-Rodino Antitrust Improvements Act of 1976 ("HSR Act"), the effectiveness of the Form S-4, the approval of the listing on the Nasdaq of the Dollar Tree common stock to be issued in the merger, the absence of an injunction prohibiting the merger, the accuracy of the representations, and the warranties of the other party under the Dollar Tree merger agreement (subject to the materiality standards set forth in the Dollar Tree merger agreement), the performance by the other party of its respective obligations under the Dollar Tree merger agreement in all material respects, delivery of officer certificates by the other party certifying satisfaction of the two preceding
18
conditions, and in the case of Dollar Tree's obligations to complete the merger, the absence of a material adverse effect, as described in the Dollar Tree merger agreement, on Family Dollar following July 27, 2014.
The satisfaction of all of the required conditions could delay the completion of the merger for a significant period of time or prevent it from occurring. Any delay in completing the merger could cause Dollar Tree not to realize some or all of the benefits that Dollar Tree expects to achieve if the merger is successfully completed within its expected timeframe. Further, there can be no assurance the conditions to the closing of the merger will be satisfied or waived or the merger will be completed. See the risk factor entitled "Failure to complete the merger could negatively impact the stock price and the future business and financial results of Family Dollar,'' below.
Under certain circumstances, if a third party makes a company superior proposal, as described in the Dollar Tree merger agreement, to acquire Family Dollar, Family Dollar could pay Dollar Tree a termination fee of $305 million, terminate the Dollar Tree merger agreement, and sign a merger agreement with the third party, and the pending merger between Family Dollar and Dollar Tree would not be completed.
In order to complete the merger, Dollar Tree and Family Dollar must make certain governmental filings and obtain certain governmental authorizations, and if such filings and authorizations are not made or granted or are granted with conditions, or if regulators otherwise seek to impose conditions or to challenge the merger, completion of the merger may be jeopardized or the anticipated benefits of the merger could be reduced.
Although Dollar Tree and Family Dollar have agreed in the Dollar Tree merger agreement to use their reasonable best efforts, subject to certain limitations, to make certain governmental filings, and obtain the required expiration or termination of the waiting period under the HSR Act, there can be no assurance the waiting period under the HSR Act will expire or be terminated. As a condition to granting termination of the waiting period under the HSR Act or avoiding a lawsuit challenging the merger, governmental authorities may impose requirements, limitations or costs or require divestitures or place restrictions on the conduct of Dollar Tree's business after completion of the merger. Under the terms of the Dollar Tree merger agreement, subject to certain exceptions, Dollar Tree and its subsidiaries are required to accept certain conditions and take certain actions imposed by governmental authorities that would apply to, or affect, the businesses, assets or properties of it, its subsidiaries or Family Dollar and its subsidiaries. There can be no assurance regulators will not impose conditions, terms, obligations or restrictions and that such conditions, terms, obligations or restrictions will not have the effect of delaying completion of the merger or imposing additional material costs on or materially limiting the revenues of the combined company following the merger, or otherwise adversely affecting Dollar Tree's businesses and results of operations after completion of the merger. In addition, we can provide no assurance these conditions, terms, obligations or restrictions will not result in the delay or abandonment of the merger. There can also be no assurance regulators will not seek to challenge the merger.
Combining the two companies may be more difficult, costly, or time consuming than expected and the anticipated benefits and cost savings of the merger may not be realized.
Family Dollar and Dollar Tree have operated and, until the completion of the merger, will continue to operate, independently. The success of the merger, including anticipated benefits and cost savings, will depend, in part, on Dollar Tree's ability to successfully combine and integrate the businesses of Dollar Tree and Family Dollar. It is possible the pending nature of the merger and/or the integration process could result in the loss of key employees, higher than expected costs, diversion of management attention of both Family Dollar and Dollar Tree, increased competition, the disruption of either company's ongoing businesses or inconsistencies in standards, controls, procedures and policies that adversely affect the combined company's ability to maintain relationships with customers, vendors, and employees or to achieve the anticipated benefits and cost savings of the merger. If Dollar Tree experiences difficulties with the integration process, the anticipated benefits of the merger may not be realized fully or at all, or may take longer to realize than expected. Integration efforts between the two companies will also divert management's attention and resources. These integration matters could have an adverse effect on each of Dollar Tree and Family Dollar during this transition period and for an undetermined period after completion of the merger on the combined company. In addition, the actual cost savings of the merger could be less than anticipated.
Family Dollar's executive officers and directors have interests in the merger that may be different from your interests as a stockholder of Family Dollar or as a stockholder of Dollar Tree.
When considering the recommendation of the Family Dollar board that Family Dollar stockholders adopt the Dollar Tree merger agreement, Family Dollar stockholders should be aware that directors and executive officers of Family Dollar have certain interests in the merger that may be different from or in addition to the interests of Family Dollar stockholders and Dollar Tree stockholders generally. These interests, which arise from both contractual arrangements existing prior to the execution of the Dollar Tree merger agreement and provisions of the Dollar Tree merger agreement, include, among others, the treatment of
19
outstanding equity awards pursuant to the Dollar Tree merger agreement, potential severance benefits and other payments, retention, and rights to ongoing indemnification and insurance coverage by the surviving company for acts or omissions occurring prior to the merger. As a result of these interests, these directors and executive officers of Family Dollar might be more likely to support and to vote in favor of the proposals described in the proxy statement than if they did not have these interests. Family Dollar's stockholders should consider whether these interests might have influenced these directors and executive officers to support or recommend adoption of the Dollar Tree merger agreement.
The Dollar Tree merger agreement limits Family Dollar's ability to pursue alternatives to the merger and may discourage other companies from trying to acquire Family Dollar for greater consideration than what Dollar Tree has agreed to pay.
The Dollar Tree merger agreement contains provisions that make it more difficult for Family Dollar to sell its business to a party other than Dollar Tree. These provisions include a general prohibition on Family Dollar soliciting any acquisition proposal or offer for a competing transaction. In some circumstances upon termination of the Dollar Tree merger agreement, Family Dollar may be required to pay to Dollar Tree its out-of-pocket expenses not to exceed $90 million and/or a termination fee of $305 million, less any payment paid in respect of Dollar Tree's out-of-pocket expenses. Further, there are only limited exceptions to Family Dollar's agreement that the Family Dollar Board of Directors will not withdraw or modify in a manner adverse to Dollar Tree the recommendation of the Family Dollar board in favor of the adoption of the Dollar Tree merger agreement and to Family Dollar's agreement not to enter into an agreement with respect to a company takeover proposal.
These provisions might discourage a third party that has an interest in acquiring all or a significant part of Family Dollar from considering or proposing an acquisition, even if the party were prepared to pay consideration with a higher per share cash or market value than the market value proposed to be received or realized in the merger, or might result in a potential competing acquirer proposing to pay a lower price than it might otherwise have proposed to pay because of the added expense of the termination fee or the payment of expenses that may become payable in certain circumstances.
Actions by Dollar General may negatively impact the interests of Family Dollar's stockholders and Family Dollar.
The Dollar General tender offer and actions by Dollar General could negatively impact the interests of Family Dollar stockholders and Family Dollar. Since August 18, 2014, Dollar General has made two unsolicited conditional proposals to acquire Family Dollar, and commenced the Dollar General tender offer, each of which has been unanimously rejected by the Family Dollar board.
Dollar General has also filed a preliminary proxy statement with the SEC to solicit proxies in opposition to the Dollar Tree merger. It is unclear what additional actions Dollar General may take to further the Dollar General tender offer or to prevent the Dollar Tree merger from occurring. These additional actions taken or to be taken by Dollar General may cause disruption in Family Dollar's business and could negatively impact the expected timing of the consummation of the Dollar Tree merger. In addition, Family Dollar's stockholders may be persuaded to vote against adoption of the Dollar Tree merger agreement as a result of Dollar General's actions and, consequently, the required stockholder approval of the Dollar Tree merger may not be obtained. If, at the special meeting, Family Dollar stockholders were to fail to approve the Dollar Tree merger, then:
• | The Dollar Tree merger agreement may be terminated without any money going to Family Dollar stockholders; |
• | If the Dollar Tree merger agreement is terminated, Family Dollar will have to reimburse Dollar Tree in cash for its out-of-pocket expenses up to $90 million and under certain circumstances, including a consummation of a transaction with Dollar General, will be required to pay a termination fee to Dollar Tree in cash of $305 million, less any prior payment in respect of Dollar Tree's out-of-pocket expenses; and |
• | Family Dollar may remain a stand-alone company and reject any proposed transactions with Dollar General, including on the basis of antitrust regulatory considerations, or other third parties; and |
• | The Dollar General tender offer may not be completed on the proposed terms because one or more conditions, including the condition that Dollar General and Family Dollar must have entered into a merger agreement in form and substance satisfactory to Dollar General in its reasonable discretion, are not satisfied or Dollar General may unilaterally decide to fail to extend its tender offer or change the price per share or other terms of the offer as described below. |
Family Dollar does not expect the Dollar General tender offer to receive antitrust regulatory clearance before the tender offer's currently scheduled expiration date and, if this turns out to be the case, Dollar General will not be able to purchase any tendered shares in connection with the scheduled expiration of the tender offer. Dollar General may determine not to extend its tender offer beyond the upcoming or any extended expiration date. Moreover, even if Dollar General were to extend its tender offer, Dollar General may decide not to continue to offer the same price per share or other terms upon any extension of the Dollar General tender offer and may elect in its "reasonable discretion" not to enter into a merger agreement with Family Dollar on the
20
terms currently described in its offer. Furthermore, Dollar General has not indicated it will extend the tender offer over a period long enough to permit Dollar General to obtain antitrust regulatory clearance for a combination with Family Dollar. Also see the risk factor entitled "Failure to complete the merger could negatively impact the stock price and the future business and financial results of Family Dollar.''
Failure to complete the merger could negatively impact the stock price and the future business and financial results of Family Dollar.
If the merger is not completed for any reason, including as a result of Family Dollar stockholders failing to adopt the Dollar Tree merger agreement, the ongoing business of Family Dollar may be adversely affected and, without realizing any of the benefits of having completed the merger, Family Dollar would be subject to a number of risks, including the following:
• | Family Dollar may experience negative reactions from the financial markets, including negative impacts on its stock price; |
• | Family Dollar may experience negative reactions from its customers, vendors and employees; |
• | Family Dollar will be required to pay certain costs relating to the merger, whether or not the merger is completed; |
• | The Dollar Tree merger agreement places certain restrictions on the conduct of Family Dollar's businesses prior to completion of the merger. Such restrictions, the waiver of which is subject to the consent of Dollar Tree (in certain cases, not to be unreasonably withheld, conditioned or delayed), may prevent Family Dollar from making certain acquisitions or taking certain other specified actions during the pendency of the merger; and |
• | Matters relating to the merger, including integration planning, will require substantial commitments of time and resources by Family Dollar management, which would otherwise have been devoted to day-to-day operations and other opportunities that may have been beneficial to Family Dollar as an independent company. |
In addition to the above risks, Family Dollar may be required, under certain circumstances, to pay to Dollar Tree a termination fee of $305 million or the payment of Dollar Tree's out-of-pocket expenses incurred in connection with the merger or the Dollar Tree merger agreement not to exceed $90 million, which may materially adversely affect Family Dollar's financial results. Further, Family Dollar could be subject to litigation related to any failure to complete the merger or related to any enforcement proceeding commenced against Family Dollar to perform its obligations under the Dollar Tree merger agreement. If the merger is not completed, these risks may materialize and may adversely affect Family Dollar's businesses, financial condition, financial results, and stock price.
The shares of Dollar Tree common stock to be received by Family Dollar stockholders as a result of the merger will have rights different from the shares of Family Dollar common stock.
Upon completion of the merger, Family Dollar stockholders will no longer be stockholders of Family Dollar but will instead become Dollar Tree stockholders, and their rights as stockholders will be governed by the terms of the Dollar Tree charter and bylaws and by Virginia corporate law. The terms of the Dollar Tree charter and bylaws and Virginia corporate law are, in some respects, different than the terms of the Family Dollar charter and bylaws and Delaware corporate law, which currently govern the rights of Family Dollar stockholders.
After the merger, Family Dollar stockholders will have a significantly lower ownership and voting interest in Dollar Tree than they currently have in Family Dollar and will exercise less influence over management.
It is expected that, immediately after completion of the merger, former Family Dollar stockholders will have less of an ownership percentage of Dollar Tree common stock, compared to their previous ownership percentage of Family Dollar common stock. Consequently, former Family Dollar stockholders will have less influence over the management and policies of Dollar Tree than they currently have over the management and policies of Family Dollar.
The fairness opinion obtained by Family Dollar from its financial advisor will not reflect changes in circumstances between the date of the signing of the Dollar Tree merger agreement and the completion of the merger.
Family Dollar has obtained a fairness opinion, dated July 27, 2014, which has not been updated as of the date of this Annual report on Form 10-K, and will not be updated, revised, or reaffirmed at the time of the completion of the merger. In the opinion, judgments and assumptions were made by Family Dollar's financial advisor with regard to industry performance, general business, market and financial conditions and other matters, which are beyond the control of Family Dollar or Dollar Tree. These include, among other things, the impact of competition on the businesses of Family Dollar and Dollar Tree, the industry generally, industry growth, and the absence of any adverse material change in the financial condition and prospects of Family Dollar and Dollar Tree, the industry and in the financial markets in general, which could affect the public trading value of
21
Family Dollar common stock and Dollar Tree common stock by the time the merger is completed. The fairness opinion does not address the fairness of the merger consideration, from a financial point of view, at the time the merger is completed or as of any date other than the date of the opinion nor the prices at which Family Dollar common stock or Dollar Tree common stock will trade at any time.
Three lawsuits have been filed against Family Dollar, its directors, Dollar Tree and the merger subsidiary challenging the merger, and an adverse ruling in such lawsuits may prevent the merger from becoming effective or from becoming effective within the expected timeframe.
Family Dollar, its directors, Dollar Tree and the merger subsidiary are named as defendants in three putative class action lawsuits brought by purported Family Dollar stockholders challenging the pending merger, seeking, among other things, to enjoin consummation of the merger. One of the conditions to the completion of the merger is that no injunction by any court or other tribunal of competent jurisdiction will be in effect that prohibits or makes illegal the consummation of the merger. As such, if any of the plaintiffs are successful in obtaining an injunction prohibiting the consummation of the merger, then such injunction may prevent the merger from becoming effective or from becoming effective within the expected timeframe. See Note 13 to the Consolidated Financial Statements.
22
ITEM 1B. UNRESOLVED STAFF COMMENTS
None noted.
ITEM 2. PROPERTIES
Stores
We operate a chain of self-service retail discount stores. As of October 4, 2014, there were 8,055 stores in 46 states and the District of Columbia as follows:
Texas | 1,020 | West Virginia | 115 | ||
Florida | 593 | Massachusetts | 113 | ||
Ohio | 479 | Arkansas | 112 | ||
North Carolina | 417 | New Jersey | 111 | ||
Michigan | 403 | Maryland | 102 | ||
Georgia | 397 | Minnesota | 76 | ||
New York | 336 | Utah | 61 | ||
Pennsylvania | 304 | Maine | 60 | ||
Louisiana | 293 | Connecticut | 59 | ||
Virginia | 247 | Kansas | 50 | ||
Tennessee | 246 | Idaho | 44 | ||
Illinois | 235 | Nevada | 41 | ||
South Carolina | 225 | Nebraska | 34 | ||
Indiana | 210 | Iowa | 33 | ||
Kentucky | 208 | New Hampshire | 32 | ||
Alabama | 172 | Wyoming | 29 | ||
Mississippi | 157 | Rhode Island | 28 | ||
Arizona | 154 | South Dakota | 25 | ||
Wisconsin | 145 | Delaware | 23 | ||
Colorado | 133 | North Dakota | 19 | ||
Oklahoma | 132 | Vermont | 17 | ||
New Mexico | 119 | Montana | 7 | ||
California | 118 | District of Columbia | 3 | ||
Missouri | 118 | ||||
As of October 4, 2014, we had, in the aggregate, approximately 69.5 million square feet of total store space (including receiving rooms and other non-selling areas) and approximately 58.3 million square feet of selling space.
The number of stores we operated at the end of each of our last five fiscal years was:
Fiscal Year | Number of Stores at Year End | ||
2010 | 6,785 | ||
2011 | 7,023 | ||
2012 | 7,442 | ||
2013 | 7,916 | ||
2014 | 8,042 | ||
During fiscal 2014, we opened 526 stores, closed 400 stores, and renovated, relocated or expanded 738 stores. From August 30, 2014, through October 4, 2014, we opened 13 new stores, closed no stores, and renovated, relocated or expanded 47 stores.
23
As of October 4, 2014, we owned 198 of the total 8,055 stores we operated. Most of our leases have an initial term between five and fifteen years and provide for fixed rentals, and most of our leases require additional payments based upon a percentage of sales, property taxes, insurance premiums, or common area maintenance charges. Of our 7,857 leased stores at October 4, 2014, all but 690 leases grant us options to renew for additional terms, in most cases for a number of successive five-year periods.
Store Support Center
We own our Store Support Center located in Matthews, North Carolina, just outside of Charlotte.
Distribution Centers
We own eleven full-service distribution centers, which include receiving, warehousing, shipping, and storage facilities. Following is a summary of our distribution centers:
Facility Size | ||||||
Distribution Center | Land | Building | Date Operational | |||
Matthews, NC(1) | 108 acres | 1,240,000 sq. ft. | 1974 | |||
West Memphis, AR | 75 acres | 850,000 sq. ft. | April 1994 | |||
Front Royal, VA | 108 acres | 907,000 sq. ft. | January 1998 | |||
Duncan, OK | 85 acres | 907,000 sq. ft. | July 1999 | |||
Morehead, KY | 94 acres | 907,000 sq. ft. | June 2000 | |||
Maquoketa, IA | 74 acres | 907,000 sq. ft. | March 2002 | |||
Odessa, TX | 89 acres | 907,000 sq. ft. | July 2003 | |||
Marianna, FL | 76 acres | 907,000 sq. ft. | January 2005 | |||
Rome, NY | 87 acres | 907,000 sq. ft. | April 2006 | |||
Ashley, IN | 89 acres | 814,019 sq. ft. | June 2012 | |||
St. George, UT | 88 acres | 814,019 sq. ft. | July 2013 | |||
(1) Approximately 310,000 sq. ft. used for Store Support Center and approximately 930,000 sq. ft. used for distribution center.
ITEM 3. LEGAL PROCEEDINGS
Information for this item is included in Note 13 to the Consolidated Financial Statements included in this Report, and incorporated herein by reference.
ITEM 4. MINE SAFETY DISCLOSURES
Not applicable.
24
Executive Officers of the Company
The following information is furnished with respect to each of the executive officers of Family Dollar as of October 4, 2014.
Name | Position and Office | Age | |||
Howard R. Levine | Chairman of the Board and Chief Executive Officer | 55 | |||
Mary A. Winston | Executive Vice President - Chief Financial Officer | 52 | |||
Barry W. Sullivan | Executive Vice President - Store Operations | 50 | |||
James C. Snyder, Jr. | Senior Vice President - General Counsel and Secretary | 50 | |||
Jason S. Reiser | Executive Vice President - Chief Merchandising Officer | 46 | |||
Bryan E. Venberg | Senior Vice President - Human Resources | 46 | |||
Mr. Howard R. Levine was employed by the Company in various capacities in the Merchandising Department from 1981 to 1987, including employment as Senior Vice President - Merchandising and Advertising. From 1988 to 1992, Mr. Levine was President of Best Price Clothing Stores, Inc., a chain of ladies' apparel stores. From 1992 to April 1996, he was self-employed as an investment manager. He rejoined the Company in April 1996 and was elected Vice President - General Merchandise Manager: Softlines; Senior Vice President - Merchandising and Advertising in September 1996; President and Chief Operating Officer in April 1997; Chief Executive Officer in August 1998; and Chairman of the Board in January 2003. He is the son of Leon Levine, the founder and former Chairman of the Board of the Company.
Ms. Mary A. Winston was employed by the Company as Executive Vice President - Chief Financial Officer in April 2012. Prior to joining the Company, Ms. Winston served as Senior Vice President and Chief Financial Officer of Giant Eagle, Inc., a food retailer and food distributor, since 2008. She was President and Founder of WinsCo Financial, LLC, a financial solutions consulting firm, from 2007 to 2008 and served as Executive Vice President and Chief Financial Officer of Scholastic Corporation, a children's publishing and media company, from 2004 to 2007. Ms. Winston has also served as a Vice President, Treasurer, and then Controller of Visteon Corporation, an automotive parts supplier, and as a Vice President, Global Financial Operations, of Pfizer Inc., a global pharmaceutical company. She has also been a director of Dover Corporation, a diversified manufacturing company, since 2005 and is the chair of its Audit Committee, and a director of Plexus Corporation, an electronic manufacturing services company, since 2008 and is a member of its Audit Committee and its Nominating and Governance Committee.
Mr. Barry W. Sullivan was employed by the Company as Vice President - Store Operations in September 2002 and was promoted to Senior Vice President - Store Operations in May 2005 and to Executive Vice President - Store Operations in October 2007.
Mr. James C. Snyder, Jr., was employed by the Company as Senior Vice President - General Counsel and Secretary in April 2009. Prior to his employment by the Company, he was employed by The Home Depot, Inc., a chain of home improvement stores, from July 2001 to March 2009, where his last position was Vice President and Associate General Counsel for Legal and Risk Management.
Mr. Jason S. Reiser was employed by the Company as Senior Vice President- Merchandising form July 2013 to January 2014 and was promoted to Executive Vice President - Chief Merchandising Officer in January 2014. Prior to his role at the Company, he was employed by Wal-Mart Stores, Inc. for 17 years in a variety of roles, including as Merchandising Vice President, Health & Family Care of Sam's Club from November 2010 to June 2013, as Vice President, Health & Wellness Operations and Compliance of Sam's Club from May 2010 to November 2010, and as Senior Category Director, at Wal-Mart from May 2009 to May 2010.
Mr. Bryan E. Venberg was employed by the Company as Senior Vice President - Human Resources in February 2008. Prior to his employment by the Company, he was employed by ShopNBC, a multi-media retailer, from May 2004 to November 2007, where his last position was Senior Vice President - Operations, Customer Service and Human Resources.
All executive officers of the Company are elected annually by, and serve at the pleasure of, the Board of Directors until their successors are duly elected.
25
PART II
ITEM 5. MARKET FOR REGISTRANT'S COMMON EQUITY, RELATED STOCKHOLDER MATTERS AND ISSUER PURCHASES OF EQUITY SECURITIES
Our common stock is traded on the NYSE under the ticker symbol FDO. At October 4, 2014, there were 4,061 holders of record of our common stock. The accompanying tables give the high and low sales prices of our common stock and the dividends declared per share for each quarter of fiscal 2014 and fiscal 2013. In fiscal 2014 and 2013, dividends were paid in each quarter.
On September 3, 2014, subsequent to the end of fiscal 2014, we announced our Board of Directors declared a regular quarterly cash dividend on the Company's common stock of $0.31 per share, payable October 15, 2014, to shareholders of record at the close of business on September 15, 2014. Under the Dollar Tree merger agreement, the combined company does not plan to pay a dividend to shareholders after the consummation of the merger.
Refer to Note 15 of the Consolidated Financial Statements included in this Report for additional information on equity securities.
Market Prices and Dividends
2014 | High | Low | Dividends Declared | Dividends Paid | ||||||||||||
First Quarter | $ | 75.29 | $ | 66.94 | $ | 0.26 | $ | 0.26 | ||||||||
Second Quarter | 70.01 | 59.67 | 0.26 | 0.26 | ||||||||||||
Third Quarter | 66.13 | 55.64 | 0.31 | 0.31 | ||||||||||||
Fourth Quarter | 80.20 | 58.21 | 0.31 | 0.31 | ||||||||||||
2013 | High | Low | Dividends Declared | Dividends Paid | ||||||||||||
First Quarter | $ | 70.17 | $ | 61.26 | $ | 0.21 | $ | 0.21 | ||||||||
Second Quarter | 72.54 | 54.06 | 0.21 | 0.21 | ||||||||||||
Third Quarter | 65.82 | 57.50 | 0.26 | 0.26 | ||||||||||||
Fourth Quarter | 74.44 | 59.30 | 0.26 | 0.26 | ||||||||||||
Issuer Purchases of Equity Securities
The following table sets forth information with respect to purchases of shares of our common stock made during the quarter ended August 30, 2014, by us, on our behalf or by any "affiliated purchaser" as defined by Rule 10b-18(a)(3) of the Exchange Act.
Period | Total Number of Shares Purchased | Average Price Paid per Share | Total Number of Shares Purchased as Part of Publicly Announced Plans or Programs(1) | Maximum Number of Shares that May Yet Be Purchased Under the Plans or Programs(1)(2) | |||||||||
June (6/1/2014 - 7/5/2014) | — | $ | — | — | 3,740,937 | ||||||||
July (7/6/2014 - 8/2/2014) | — | — | — | 3,240,337 | |||||||||
August (8/3/2014 - 8/30/2014) | — | — | — | 3,078,787 | |||||||||
Total | — | $ | — | — | 3,078,787 | ||||||||
(1) | On January 17, 2013, we announced that the Board of Directors authorized the purchase of up to an additional $300 million of the Company's outstanding common stock. As of August 30, 2014, the Company had $245.8 million remaining under the current share repurchase authorization. |
(2) | Remaining dollar amounts are converted to shares using the closing stock price as of the end of the fiscal month. |
26
See Note 15 to the Consolidated Financial Statements included in this Report for more information regarding share repurchases.
Equity Compensation Plan Information
This information is included in Part III of this report under the caption "Equity Compensation Plan Information" and is incorporated herein by reference.
Stock Performance Graph
The following graph sets forth the yearly percentage change in the cumulative total shareholder return on our common stock during the five fiscal years ended August 30, 2014, compared with the cumulative total returns of the S&P 500 Index and the S&P General Merchandise Stores Index. The comparison assumes $100 was invested on August 29, 2009, in stock or on August 31, 2009, in index, including reinvestment of dividends. Indexes are calculated on a month-end basis.
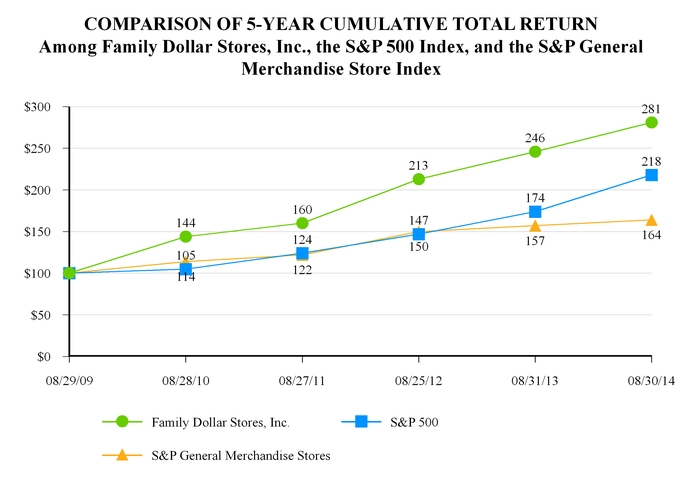
27
ITEM 6. SELECTED FINANCIAL DATA
Years Ended | ||||||||||||||||||||
(in thousands, except per share, store, and net sales per square foot data) | August 30, 2014 | August 31, 2013* | August 25, 2012 | August 27, 2011 | August 28, 2010 | |||||||||||||||
Net sales | $ | 10,489,330 | $ | 10,391,457 | $ | 9,331,005 | $ | 8,547,835 | $ | 7,866,971 | ||||||||||
Cost of sales(1) | 6,946,115 | 6,836,712 | 6,071,058 | 5,515,540 | 5,058,971 | |||||||||||||||
Cost of sales - restructuring(2) | 11,930 | — | — | — | — | |||||||||||||||
Gross profit | 3,531,285 | 3,554,745 | 3,259,947 | 3,032,295 | 2,808,000 | |||||||||||||||
Selling, general and administrative expenses | 3,022,219 | 2,866,788 | 2,584,234 | 2,409,522 | 2,234,347 | |||||||||||||||
Restructuring(2) | 78,180 | — | — | — | — | |||||||||||||||
Other Charges(3) | 9,434 | — | 11,500 | — | — | |||||||||||||||
Operating profit | 421,452 | 687,957 | 664,213 | 622,773 | 573,653 | |||||||||||||||
Income before income taxes | 422,754 | 690,697 | 663,938 | 617,158 | 563,858 | |||||||||||||||
Income taxes | 138,251 | 247,122 | 241,698 | 228,713 | 205,723 | |||||||||||||||
Net income | $ | 284,503 | $ | 443,575 | $ | 422,240 | $ | 388,445 | $ | 358,135 | ||||||||||
Diluted net income per common share | $ | 2.49 | $ | 3.83 | $ | 3.58 | $ | 3.12 | $ | 2.62 | ||||||||||
Dividends declared per common share | $ | 1.14 | $ | 0.94 | $ | 0.60 | $ | 0.695 | $ | 0.60 | ||||||||||
Cash dividends paid per common share | $ | 1.14 | $ | 0.94 | $ | 0.78 | $ | 0.67 | $ | 0.58 | ||||||||||
Cash dividends paid | $ | 130,087 | $ | 108,334 | $ | 91,390 | $ | 83,439 | $ | 78,913 | ||||||||||
Comparable store sales growth(4) | (2.1 | )% | 3.0 | % | 4.7 | % | 5.5 | % | 4.8 | % | ||||||||||
Ending selling square feet | 58,112 | 56,846 | 53,207 | 49,996 | 48,225 | |||||||||||||||
Net sales per square foot(5) | $ | 180 | $ | 189 | $ | 181 | $ | 174 | $ | 165 | ||||||||||
Consumables sales | 73.4 | % | 72.4 | % | 69.0 | % | 66.5 | % | 65.1 | % | ||||||||||
Home products sales | 9.6 | % | 10.1 | % | 11.4 | % | 12.7 | % | 13.2 | % | ||||||||||
Apparel and accessories sales | 7.3 | % | 7.6 | % | 8.8 | % | 10.0 | % | 10.7 | % | ||||||||||
Seasonal and electronics sales | 9.7 | % | 9.9 | % | 10.8 | % | 10.8 | % | 11.0 | % | ||||||||||
Net cash provided by operating activities | $ | 469,162 | $ | 471,973 | $ | 369,371 | $ | 528,064 | $ | 591,539 | ||||||||||
Net cash used in investing activities | (199,984 | ) | (314,591 | ) | (198,311 | ) | (280,418 | ) | (306,948 | ) | ||||||||||
Net cash used in financing activities | (270,337 | ) | (108,716 | ) | (220,132 | ) | (488,995 | ) | (340,727 | ) | ||||||||||
Total capital expenditures | (436,288 | ) | (744,428 | ) | (603,313 | ) | (345,268 | ) | (212,435 | ) | ||||||||||
Total proceeds from sale-leaseback | 194,766 | 345,249 | 359,663 | — | — | |||||||||||||||
Total repurchases of common stock | (125,038 | ) | (74,954 | ) | (191,573 | ) | (670,466 | ) | (332,189 | ) | ||||||||||
Total assets | 3,857,295 | 3,709,861 | 3,373,065 | 2,996,205 | 2,968,145 | |||||||||||||||
Working capital | 973,016 | 776,783 | 702,513 | 516,789 | 641,527 | |||||||||||||||
Long-term investment securities(6) | — | 22,977 | 23,720 | 107,458 | 147,108 | |||||||||||||||
Long-term debt | 500,426 | 516,475 | 532,520 | 548,570 | 250,000 | |||||||||||||||
Shareholders' equity | $ | 1,665,725 | $ | 1,599,055 | $ | 1,297,627 | $ | 1,087,074 | $ | 1,421,554 | ||||||||||
Stores opened | 526 | 500 | 475 | 300 | 200 | |||||||||||||||
Stores closed | 400 | 26 | 56 | 62 | 70 | |||||||||||||||
Number of stores—end of year | 8,042 | 7,916 | 7,442 | 7,023 | 6,785 | |||||||||||||||
* | Fiscal 2013 contains 53 weeks. All other fiscal years presented include 52 weeks. The additional week in fiscal 2013 accounted for approximately $189 million in net sales and approximately $0.07 of diluted net income per common share. |
(1) | Fiscal 2013 includes a $5.0 million favorable accounting adjustment within Cost of sales related to certain vendor allowances. |
(2) | Fiscal 2014 includes charges related to store closures and workforce optimization initiatives. Charges relate primarily to $11.9 million of inventory write-downs included in Cost of sales - restructuring to sell through merchandise at closed stores, and $78.2 million of future lease obligations at closed stores, property and equipment impairments at closed stores, and termination benefits, included in Restructuring. |
(3) | Fiscal 2014 includes $9.4 million in expenses related to the Company's merger agreement with Dollar Tree, Inc. Fiscal 2012 includes the impact of a litigation charge of $11.5 million recorded in the fourth quarter of fiscal 2012. |
(4) | Comparable store sales growth describes the change in net sales in any period for stores considered comparable to the prior period. Comparable store sales include net sales at stores that have been open more than 13 months. A store becomes comparable the first calendar week it has sales after 13 months of being opened. Renovated, relocated, or expanded stores are included in the comparable store sales calculation to the extent they had sales during comparable weeks in each year. The method of calculating comparable store sales varies across the retail industry. As a result, our comparable store sales calculation may be different than similarly titled measures reported by other companies. |
(5) | Net sales per square foot was calculated based on total sales for the preceding 12 months as of the ending date of the reporting period divided by the average selling square footage during the period, including the end of the fiscal year, the beginning of the fiscal year, and the end of each of our three interim fiscal quarters. Comparable store sales represent the change in sales attributable to stores open in both the current and prior period, whereas sales per square foot represents total net sales divided by the average total selling square footage. As a result, all stores are included in the sales per square foot calculation, including stores without a full year of sales. |
(6) | As of August 30, 2014, a $4.8 million balance of investment securities was moved to short-term investment securities on the Consolidated Balance Sheet. |
28
ITEM 7. MANAGEMENT'S DISCUSSION AND ANALYSIS OF FINANCIAL CONDITION AND RESULTS OF OPERATIONS
The following discussion summarizes the significant factors affecting our consolidated results of operations and financial condition for fiscal 2014, fiscal 2013, and fiscal 2012, and our expectations for fiscal 2015. You should read this discussion in conjunction with our Consolidated Financial Statements and the Notes to Consolidated Financial Statements, which are included in this Report. Our discussion contains forward-looking statements which are based upon our current expectations and which involve risks and uncertainties. Actual results and the timing of events could differ materially from those anticipated in these forward-looking statements as a result of a number of factors, including those set forth in the "Cautionary Statement Regarding Forward-Looking Statements" in the General Information section of this Report and the "Risk Factors" listed in Part I—Item 1A of this Report.
Our fiscal year generally ends on the Saturday closest to August 31 of each year, which generally results in an extra week every six years. Fiscal 2014 was a 52-week year, fiscal 2013 was a 53-week year, and fiscal 2012 was a 52-week year. Fiscal 2015 will be a 52-week year.
Executive Overview
We operate a chain of more than 8,000 general merchandise retail discount stores in 46 states, providing consumers with a selection of competitively priced merchandise in convenient neighborhood stores. Our merchandise assortment includes Consumables, Home Products, Apparel and Accessories, and Seasonal and Electronics. We classify the combination of Home Products, Apparel and Accessories, and Seasonal and Electronics as "Discretionary." We sell merchandise at prices that generally range from less than $1 to $10.
We believe during fiscal 2014, our customers continued to face increased financial pressures, including continued high unemployment rates, increased payroll taxes, and volatility in gasoline prices. In fiscal 2014, customers focused their spending on necessities, with sales in Consumables comprising 73.4% of our total sales. In addition, our industry remains highly competitive on the basis of store locations, convenience, price and quality of merchandise, in-stock consistency, merchandise assortment and presentation, and customer service. In fiscal 2014, these trends continued to pressure our profitability.
As a result of these pressures, we initiated an in-depth business review to identify opportunities to strengthen our value proposition, increase operational efficiencies, and improve financial performance. In the second half of fiscal 2014, we implemented a series of strategic initiatives, including investing to permanently lower prices on nearly 1,000 basic items, closing 377 underperforming stores across the chain, and reducing expenses through workforce optimization. Although these internal strategic initiatives position us to deliver stronger returns, we continued to evaluate external strategic alternatives, which led us to enter into the Dollar Tree merger agreement, as discussed in the Business section above.
During fiscal 2014, as compared with fiscal 2013, our net sales increased 0.9% to $10.49 billion. Comparable store sales (stores open more than 13 months) for fiscal 2014 decreased 2.1%, as compared to fiscal 2013. Consistent with the National Retail Federation Calendar, fiscal 2014 included 52 weeks, as compared to 53 weeks in fiscal 2013. Excluding the additional week of sales in fiscal 2013, our net sales increased 2.8% in fiscal 2014, as compared to fiscal 2013. As a result of decreased comparable store sales and charges associated with our restructuring initiatives, our net income decreased to $284.5 million, and our diluted net income per common share decreased to $2.49.
During fiscal 2014, we remained focused on achieving our four corporate goals: deliver profitable sales growth; build customer loyalty and experience; develop diverse, high performing teams; and drive continuous improvement. We completed the following in fiscal 2014:
• | We completed internal restructuring initiatives including a reduction of corporate overhead, closing 377 underperforming stores, and lowering prices on nearly 1,000 basic items. |
• | We opened 526 new stores and renovated, relocated or expanded 738 stores. |
• | We converted two distribution centers to a pallet delivery system and began conversion of a third distribution center. |
• | We added more than 700 private brand SKUs through a combination of introduction of new items and conversion of existing control brands to private brand. |
• | We reduced store manager turnover by approximately 18%, as compared to fiscal 2013. |
• | We deployed new technology aimed at reducing inventory shrinkage in approximately 65% of the chain. |
• | We upgraded our point of sale system in more than 1,100 stores to improve the checkout experience. |
29
Fiscal 2015 Outlook
On July 27, 2014, we entered into the Dollar Tree merger agreement. The following outlook only considers Family Dollar as a standalone company and excludes any outlook from the pending business combination.
In fiscal 2015, we plan to continue to execute and evaluate our initiatives designed to deliver profitable sales growth, build customer loyalty and experience, and drive continuous improvement.
During fiscal 2015, we expect to open approximately 375 new stores and close 40 stores, for a net store growth of 335. Additionally, we plan to renovate, relocate, or expand approximately 775 stores.
To deliver even more compelling value to our customers, we lowered prices on nearly 1,000 basic items during fiscal 2014. In fiscal 2015, we expect to sustain everyday low costs by proactively managing our product assortment and critically reviewing pricing in all product categories. We also plan to expand our program which allows customers to present a local competitor's printed ad in our stores, and we guarantee Family Dollar will match their price.
To increase relevancy with our customers and drive discretionary spend, we expect we will accelerate our rollout of beer and wine and expand our tobacco assortment. Additionally, reflecting trends in customer demand and the diversity of our store base, we will be launching an initiative to cluster assortments based on market dynamics, while creating a flexible supply chain and market-specific store formats to drive higher productivity and return on investment.
In fiscal 2014, we expanded our private brand assortment. In fiscal 2015 we expect to continue penetration of private brands, including a refresh of certain private brands in Consumables to offer our customers more quality and value while broadening their appeal. We intend to drive greater awareness of our private brands program through right-sized marketing and improved visual merchandising support.
We have increased global sourcing and plan to continue to utilize global sourcing as it remains an opportunity to increase profitability. In fiscal 2015, we plan to focus on the quality and value of sourced products, and to continue to expand our supplier network in an effort to increase the level and amount of direct imports.
Non-GAAP Measures
In our analysis of the results of operations, we utilized non-GAAP financial measures for operating profit, net income and diluted net income per common share. We believe these non-GAAP financial measures better enable management and investors to understand and analyze our performance by providing meaningful information relevant to events that impact the comparability of underlying business results from period to period. In the measures presented, we have excluded the restructuring charges and merger related fees as presented in Note 2 to the Consolidated Financial Statements because the exclusion of such amounts facilitates the comparison of the Company's financial results to its historical operating results. However, these supplemental measures should be considered in addition to, and not as a substitute for or superior to, the related measures determined in accordance with GAAP.
The following table reconciles operating profit, income before taxes, net income, and diluted net income per common share (GAAP financial measures) for the periods presented to adjusted operating profit, adjusted net income and adjusted diluted net income per common share (non-GAAP financial measures) for the periods presented.
30
52 Weeks Ended | 53 Weeks Ended | 52 Weeks Ended | ||||||||||
(in thousands, except per share amounts) | August 30, 2014 | August 31, 2013 | August 25, 2012 | |||||||||
Operating profit | $ | 421,452 | $ | 687,957 | $ | 664,213 | ||||||
Cost of sales - restructuring | 11,930 | — | — | |||||||||
Restructuring | 78,180 | — | — | |||||||||
Merger fees | 9,434 | — | — | |||||||||
Accounting adjustment - vendor allowances | — | (4,953 | ) | — | ||||||||
Litigation charge | — | — | 11,500 | |||||||||
Adjusted operating profit | $ | 520,996 | $ | 683,004 | $ | 675,713 | ||||||
Income before taxes | $ | 422,754 | $ | 690,697 | $ | 663,938 | ||||||
Cost of sales - restructuring | 11,930 | — | — | |||||||||
Restructuring | 78,180 | — | — | |||||||||
Merger fees | 9,434 | — | — | |||||||||
Accounting adjustment - vendor allowances | — | (4,953 | ) | — | ||||||||
Litigation charge | — | — | 11,500 | |||||||||
Adjusted income before taxes | $ | 522,298 | $ | 685,744 | $ | 675,438 | ||||||
Net income | $ | 284,503 | $ | 443,575 | $ | 422,240 | ||||||
After-tax impact of Cost of sales - restructuring | 7,762 | — | — | |||||||||
After-tax impact of Restructuring | 50,864 | — | — | |||||||||
After-tax impact of Merger fees | 6,138 | — | — | |||||||||
After-tax impact of Accounting adjustment - vendor allowances | — | (3,175 | ) | — | ||||||||
After-tax impact of Litigation charge | — | — | 7,140 | |||||||||
Adjusted net income | $ | 349,267 | $ | 440,400 | $ | 429,380 | ||||||
Diluted net income per common share | $ | 2.49 | $ | 3.83 | $ | 3.58 | ||||||
Per share impact of Cost of sales - restructuring | 0.07 | — | — | |||||||||
Per share impact of Restructuring | 0.44 | — | — | |||||||||
Per share impact of Merger fees | 0.05 | — | — | |||||||||
Per share impact of Accounting adjustment - vendor allowances | — | (0.03 | ) | — | ||||||||
Per share impact of Litigation charge | — | — | 0.06 | |||||||||
Adjusted diluted net income per common share | $ | 3.05 | $ | 3.80 | $ | 3.64 | ||||||
Results of Operations
Our results of operations for fiscal 2014, fiscal 2013 and fiscal 2012 are highlighted in the table below and discussed in the following paragraphs:
31
52 Weeks Ended | 53 Weeks Ended | 52 Weeks Ended | ||||||||||||||||
(in thousands) | August 30, 2014 | % of Net Sales* | August 31, 2013 | % of Net Sales* | August 25, 2012 | % of Net Sales* | ||||||||||||
Net sales | $ | 10,489,330 | $ | 10,391,457 | $ | 9,331,005 | ||||||||||||
Cost and expenses: | ||||||||||||||||||
Cost of sales** | 6,946,115 | 66.2 | % | 6,836,712 | 65.8 | % | 6,071,058 | 65.1 | % | |||||||||
Cost of sales - restructuring | 11,930 | 0.1 | % | — | — | % | — | — | % | |||||||||
Selling, general and administrative | 3,022,219 | 28.8 | % | 2,866,788 | 27.6 | % | 2,584,234 | 27.7 | % | |||||||||
Restructuring | 78,180 | 0.7 | % | — | — | % | — | — | % | |||||||||
Merger fees | 9,434 | 0.1 | % | — | — | % | — | — | % | |||||||||
Litigation charge | — | — | % | — | — | % | 11,500 | 0.1 | % | |||||||||
Cost of sales and operating expenses | 10,067,878 | 96.0 | % | 9,703,500 | 93.4 | % | 8,666,792 | 92.9 | % | |||||||||
Operating profit | 421,452 | 4.0 | % | 687,957 | 6.6 | % | 664,213 | 7.1 | % | |||||||||
Investment income | 190 | — | % | 422 | — | % | 927 | — | % | |||||||||
Interest expense | 30,038 | 0.3 | % | 25,888 | 0.2 | % | 25,090 | 0.3 | % | |||||||||
Other Income | 31,150 | 0.3 | % | 28,206 | 0.3 | % | 23,888 | 0.3 | % | |||||||||
Income before income taxes | 422,754 | 4.0 | % | 690,697 | 6.7 | % | 663,938 | 7.1 | % | |||||||||
Income taxes | 138,251 | 1.3 | % | 247,122 | 2.4 | % | 241,698 | 2.6 | % | |||||||||
Net Income | $ | 284,503 | 2.7 | % | $ | 443,575 | 4.3 | % | $ | 422,240 | 4.5 | % | ||||||
*Percentages are rounded. | ||||||||||||||||||
**Included in Cost of Sales for fiscal 2013 was a $5.0 million favorable accounting adjustment related to certain vendor allowances. | ||||||||||||||||||
Comparison of Fiscal 2014 to Fiscal 2013
Net Sales
Net sales increased 0.9% in fiscal 2014, as compared to fiscal 2013, which was primarily due to sales from new stores opened as part of our store growth program, partially offset by a decrease in comparable store sales. Consistent with the National Retail Federation Calendar, fiscal 2013 included an extra week. The additional week accounted for approximately $189 million in net sales for fiscal 2013. Excluding the impact of the extra week of sales in fiscal 2013, net sales in fiscal 2014 increased 2.8%. The average number of stores in operation increased to 8,095 in fiscal 2014, from 7,680 fiscal 2013, or an increase of 5.4%.
Comparable store sales growth describes the change in net sales in any period for stores considered comparable to the prior period. Comparable store sales include net sales at stores that have been open more than 13 months. A store becomes comparable the first calendar week it has sales after 13 months of being open. Renovated, relocated, or expanded stores are included in the comparable store sales calculation to the extent they had sales during comparable weeks in each year. The method of calculating comparable store sales varies across the retail industry. As a result, our comparable store sales calculation may be different than similarly titled measures reported by other companies.
Comparable store sales were strongest in the Consumables category, however all categories had negative comparable sales in fiscal 2014, as compared to fiscal 2013. There was a 2.1% decrease in total comparable store sales in fiscal 2014, as compared to fiscal 2013, as a result of a decrease in customer transactions in comparable stores, which was partially offset by an increase in average customer transaction values. During fiscal 2014, the number of customer transactions decreased approximately 2.6%, and the average customer transaction increased approximately 0.5%, as compared to fiscal 2013.
Cost of Sales
Cost of sales increased 1.6% in fiscal 2014, as compared to fiscal 2013. Cost of sales, as a percentage of net sales, was 66.2% in fiscal 2014 and 65.8% in fiscal 2013. Cost of sales, as a percentage of net sales, was negatively impacted by the following:
• | A shift in sales mix to lower-margin consumable merchandise. An increase in lower-margin Consumables, as well as softness in sales of higher-margin Discretionary items, continued to pressure cost of sales as a percentage of net sales. |
• | A decrease in markups on merchandise sales. As we remain committed to strengthening our value perception, we lowered prices on nearly 1,000 basic items during fiscal 2014. |
32
• | An increase in markdowns. In a challenging macro-economic environment, we continued to use markdowns to drive revenue growth and manage inventory levels as we continued to refine our assortment of Consumables merchandise. |
• | Vendor allowance adjustment in fiscal 2013. Included in Cost of sales for fiscal 2013 was a $5.0 million favorable accounting adjustment related to certain vendor allowances. |
These unfavorable items were partially offset by the following:
• | Lower freight expense. The decrease in freight expense was impacted by our ongoing relationship with McLane, which resulted in less merchandise being handled through our own distribution network. |
• | A decrease in inventory shrinkage. The decrease in inventory shrinkage resulted from technology introduced into stores and decreased store manager turnover. |
Cost of Sales - Restructuring
In the second half of fiscal 2014, the Company closed 377 underperforming stores across the chain as part of a series of restructuring initiatives. Inventory write-downs of $11.9 million were included in Cost of Sales - Restructuring and were incurred to sell through merchandise at stores closed as part of the restructuring initiatives.
Selling, General and Administrative Expenses
Selling, general and administrative ("SG&A") expenses increased 5.4% in fiscal 2014, as compared to fiscal 2013. The increase in these expenses was primarily due to additional costs arising from the continued growth in the number of stores in operation. SG&A expenses, as a percentage of net sales, were 28.8% in fiscal 2014, as compared to 27.6% in fiscal 2013. SG&A expenses, as a percentage of net sales, de-leveraged in the following categories as a result of the decrease in comparable store sales, as compared to the fiscal 2013:
• | Increased store occupancy costs (approximately 0.9% of net sales). |
• | Increased store payroll costs (approximately 0.3% of net sales). |
These unfavorable items were partially offset by the following:
• | Lower incentive compensation expense (approximately 0.2% of net sales). Reflecting our pay-for-performance philosophy, incentive compensation costs decreased as a percentage of net sales as a result of our relative performance against our target in fiscal 2014, as compared to fiscal 2013. |
• | Decreased advertising costs (approximately 0.2% of net sales). We continued to focus on improving the efficiency and effectiveness of our advertising through changes in the timing, number of pages, and type of merchandise included in our promotional materials, which resulted in a decrease in overall advertising spending, as a percentage of net sales, in fiscal 2014, as compared to fiscal 2013. |
Restructuring
In the second half of fiscal 2014, the Company implemented a series of restructuring initiatives, including closing 377 underperforming stores across the chain and optimized our workforce through a headcount reduction. The $78.2 million charge included in Restructuring consists primarily of future lease obligations and property and equipment impairments related to the store closures and termination benefits associated with the workforce optimization.
Merger Fees
On July 27, 2014, we entered into the Dollar Tree merger agreement, upon the terms and subject to the conditions of which a subsidiary of Dollar Tree will be merged with and into Family Dollar, with Family Dollar continuing as the surviving entity and a wholly-owned subsidiary of Dollar Tree. In executing the Dollar Tree merger agreement, the Company incurred $9.4 million of professional fees during fiscal 2014, consisting primarily of financial advisory and legal costs.
Investment Income, Interest Expense, and Other Income
The changes in investment income, interest expense and other income in fiscal 2014, as compared to fiscal 2013 were not material.
Income Taxes
33
The effective tax rate was 32.7% for fiscal 2014, as compared to 35.8% for fiscal 2013. The effective tax rate was lower primarily due to tax benefits associated with federal jobs tax credits, foreign tax benefits associated with global sourcing, and favorable changes in the reserves for uncertain tax positions.
Comparison of Fiscal 2013 to Fiscal 2012
Net Sales
Net sales increased 11.4% in fiscal 2013, as compared to fiscal 2012. Consistent with the National Retail Federation Calendar, fiscal 2013 included an extra week, which accounted for approximately $189 million in net sales, or approximately 2.0% of the net sales increase. Additionally, the net sales increase in fiscal 2013 reflects an increase in comparable store sales and new stores opened as part of our store growth program.
Comparable store sales increased 3.0% in the fiscal 2013, as compared to fiscal 2012, as a result of an increase in both customer transactions in comparable stores and average customer transaction values. During fiscal 2013, the number of customer transactions increased approximately 1.7%, and the average customer transaction increased approximately 1.3%, as compared to fiscal 2012. Sales during fiscal 2013, on a comparable store basis, were strongest in the Consumables category.
The average number of stores in operation during fiscal 2013 was 6.7% higher than the average number of stores in operation during fiscal 2012. We had 7,916 stores in operation at the end of fiscal 2013, as compared to 7,442 stores in operation at the end of fiscal 2012. As of August 31, 2013, we had, in the aggregate, approximately 56.8 million square feet of selling space, as compared to 53.2 million square feet as of August 25, 2012.
Cost of Sales
Cost of sales increased 12.6% in fiscal 2013, as compared to fiscal 2012. The increase was primarily due to additional sales volume. Included in Cost of sales for fiscal 2013 was a $5.0 million favorable accounting adjustment related to certain vendor allowances. Cost of sales, as a percentage of net sales, was 65.8% in fiscal 2013, as compared to 65.1% in fiscal 2012. Cost of sales, as a percentage of net sales, was negatively impacted by the following:
• | A shift in sales mix to lower-margin consumable merchandise. An increase in lower-margin Consumables, as well as softness in sales of Discretionary items, pressured cost of sales as a percentage of net sales. |
• | An increase in inventory shrinkage. While our inventory levels were lower on a per store basis at the end of fiscal 2013, as compared to fiscal 2012, the average inventory balance in our stores was higher throughout fiscal 2013, as compared to fiscal 2012. Inventory shrinkage increased during fiscal 2013, as compared to fiscal 2012, due in part to increased average inventory levels throughout fiscal 2013. |
• | An increase in markdowns. In a challenging macro-economic environment, we used markdowns to drive revenue growth as we refined our assortment of Consumables merchandise. |
These unfavorable items were partially offset by the following:
• | An increase in markups on merchandise sales. We focused on improving our purchase markups through better price management, expanded our global sourcing efforts, and developed our private brand assortment, which resulted in higher gross profit margin. |
• | A decrease in freight expense. The decrease in freight expense was impacted by our relationship with McLane, which began in September 2012 and resulted in less merchandise being handled through our own distribution network. |
Selling, General and Administrative Expenses
SG&A expenses increased 10.9% in fiscal 2013, as compared to fiscal 2012. The increase in these expenses was due in part to additional sales volume and additional costs arising from the continued growth in the number of stores in operation. SG&A expenses, as a percentage of net sales, were 27.6% in fiscal 2013, as compared to 27.7% in fiscal 2012. SG&A expenses, as a percentage of net sales, were leveraged as a result of the following, as compared to fiscal 2012:
• | Decreased non-store payroll costs, including incentive compensation expense (approximately 0.2% of net sales). Reflecting our pay-for-performance philosophy, incentive compensation costs decreased as a percentage of net sales as a result of our relative performance against our target in fiscal 2013, as compared to fiscal 2012. |
34
This favorable item was partially offset by the following:
• | Increased store occupancy costs (approximately 0.2% of net sales). Rent expense increased as a percentage of net sales in fiscal 2013, as compared to fiscal 2012, primarily driven by the additional rental expense on the 532 stores sold pursuant to sale-leaseback transactions in the second half of fiscal 2012 and in fiscal 2013. |
Litigation Charge
During the fourth quarter of fiscal 2012, we recorded an $11.5 million litigation charge associated with the preliminary settlement of a lawsuit in the state of New York. This lawsuit involved claims for overtime pay from New York store managers who worked in our stores.
Investment Income, Interest Expense, and Other Income
The changes in investment income, interest expense and other income in fiscal 2013, as compared to fiscal 2012 were not material.
Income Taxes
The effective tax rate was 35.8% for fiscal 2013, as compared to 36.4% for fiscal 2012. The decrease in the effective tax rate in fiscal 2013, as compared to fiscal 2012, was due primarily to a decrease in the reserve for state taxes and an increase in the benefit of federal tax credits, partially offset by an increase in the reserves for uncertain tax positions.
Liquidity and Capital Resources
General
We have consistently maintained a strong liquidity position. During fiscal 2014, our cash and cash equivalents decreased $1.2 million from the end of fiscal 2013, and our operating cash flows were $469.2 million. We believe our operating cash flows, proceeds from sale-leaseback transactions, and credit facilities are sufficient to fund our regular operating needs, capital expenditure program, share repurchases, cash dividend payments, and principal and interest payments. We have availability under our two credit facilities to borrow up to $900 million, less standby letters of credit needed for collateral for our insurance programs of $18.7 million as of August 30, 2014, to supplement operating cash flows. During fiscal 2014, to help supplement our operating cash flows and to support our growth initiatives, we had an average daily outstanding balance of $214.8 million on our unsecured revolving credit facilities. As of August 30, 2014, we had no short-term borrowings outstanding under these facilities. Working capital at the end of fiscal 2014 was $973.0 million, as compared to $776.8 million at the end of fiscal 2013. We believe operating cash flows and capacity under existing credit facilities will continue to provide sufficient liquidity for our ongoing operations and growth initiatives.
Restricted Cash and Investments
We have restricted a portion of cash and investments to serve as collateral for certain of our insurance obligations held at our wholly owned captive insurance subsidiary. These restricted funds cannot be withdrawn from the Company's account without the consent of the secured party. As of August 30, 2014, the Company held $34.4 million in this restricted account, of which $31.4 million was included in Restricted Cash and Investments and $3.0 million was included in Other Assets in the Consolidated Balance Sheets. As of August 31, 2013, we held $55.5 million in this restricted account, of which $35.4 million was included in Restricted Cash and Investments and $20.1 million was included in Other Assets in the Consolidated Balance Sheets. The classification between current and non-current is based on the timing of expected payments of the secured insurance obligations. The decrease in restricted cash and investments, as compared to fiscal 2013, is attributable to a reduction in the required collateralization amount related to workers' compensation insurance claims.
Build-to-Suit and Sale-Leaseback Transactions
The Company uses build-to-suit and sale-leaseback transactions to construct and lease new stores. In a build-to-suit transaction, an unrelated third-party funds the new store construction and owns the property throughout and upon completion of construction. In a sale-leaseback transaction, the Company funds the new store construction and owns the property throughout and upon completion of construction. Upon completion of the stores' construction in build-to-suit transactions and concurrent with the sale of stores in sale-leaseback transactions, the Company enters into agreements to lease the properties over an initial
35
term of 15 years, with four, 5-year fixed renewal options. The Company evaluates each store individually upon certain events during the life of the lease, including individual renewal options. The Company classifies these leases as operating leases, actively uses the leased properties, and considers the leases as normal sale-leasebacks.
During fiscal 2014, the Company completed 356 build-to-suit transactions to support new store growth. Additionally, the Company completed sale-leaseback transactions under which it sold 159 stores to unrelated third-parties for net proceeds of approximately $194.8 million during fiscal 2014. Upon closing of the transactions, the Company realized a gain on the sale of the stores of $28.4 million, of which $1.1 million was recognized immediately and approximately $27.3 million was deferred and will amortize over the initial lease terms.
During fiscal 2013, the Company completed 230 build-to-suit transactions. Additionally, the Company completed sale-leaseback transactions under which it sold 256 stores and 29 parcels of land to unrelated third-parties for net proceeds of approximately $345.2 million. Upon closing of the transactions, the Company realized a gain on the sale of the stores of $84.7 million, of which approximately $2.4 million was recognized immediately and approximately $82.3 million was deferred and will amortize over the initial lease terms.
Credit Facilities
On November 13, 2013, the Company entered into a five-year unsecured revolving credit facility with a syndicate of lenders for borrowings of up to $600 million. The credit facility matures on November 13, 2018, and provides for two, one-year extensions that require lender consent. Any borrowings under the credit facility accrue interest at a variable rate based on short-term market interest rates.
On November 13, 2013, the Company entered into a four-year unsecured revolving credit facility with a syndicate of lenders for borrowings of up to $300 million. The credit facility matures on November 13, 2017, and provides for two, one-year extensions that require lender consent. Any borrowings under the credit facility accrue interest at a variable rate based on short-term market interest rates.
The revolving credit facilities provide the Company the capacity to borrow up to $900 million, less standby letters of credit needed for collateral for its insurance program of $18.7 million as of August 30, 2014. The prior unsecured revolving credit facilities provided the Company the capacity to borrow up to $700 million, less standby letters of credit needed for collateral for its insurance program of $18.8 million as of August 31, 2013.
The Company had no short-term borrowings outstanding under its unsecured revolving credit facilities as of August 30, 2014, or as of August 31, 2013. During fiscal 2014, the Company had no net borrowings and had an average daily outstanding balance of $214.8 million at a weighted-average interest rate of 1.4% under its unsecured revolving credit facilities. This compares to net repayments of $15.0 million and an average daily outstanding balance of $141.5 million at a weighted-average interest rate of 1.5% under the Company's unsecured revolving credit facilities during fiscal 2013.
The Company's unsecured revolving credit facilities contain certain restrictive financial covenants, which include a consolidated debt to consolidated capitalization ratio, a fixed charge coverage ratio, and a priority debt to consolidated net worth ratio. As of August 30, 2014, the Company was in compliance with all such covenants.
Long-Term Debt
On January 28, 2011, the Company issued $300 million of 5.00% unsecured senior notes due February 1, 2021 (the "2021 Notes"), through a public offering. The Company's proceeds were approximately $298.5 million, net of an issuance discount of $1.5 million. In addition, the Company incurred issuance costs of approximately $3.3 million. Both the discount and issuance costs are being amortized to interest expense over the term of the 2021 Notes. Interest on the 2021 Notes is payable semiannually in arrears on February 1 and August 1 of each year, commencing on August 1, 2011. The 2021 Notes rank pari passu in right of payment with the Company's other unsecured senior indebtedness and will be senior in right of payment to any subordinated indebtedness. The Company may redeem the 2021 Notes in whole at any time or in part from time to time, at the option of the Company, subject to a make-whole premium. In addition, upon the occurrence of certain change of control triggering events, the Company may be required to repurchase the 2021 Notes, at a price equal to 101% of their principal amount, plus accrued and unpaid interest to the date of repurchase.
On September 27, 2005, the Company obtained $250 million through a private placement of unsecured senior notes due September 27, 2015 (the "2015 Notes"), to a group of institutional accredited investors. The 2015 Notes were issued in two tranches at par and rank pari passu in right of payment with the Company's other unsecured senior indebtedness. The first
36
tranche has an aggregate principal amount of $169 million, is payable in a single installment on September 27, 2015, and bears interest at a rate of 5.41% per annum from the date of issuance. The second tranche has an aggregate principal amount of $81 million, matures on September 27, 2015, with amortization which commenced on September 27, 2011, and bears interest at a rate of 5.24% per annum from the date of issuance. The second tranche had a required principal payment of $16.2 million on September 27, 2011, and on each September 27 thereafter to and including September 27, 2015. The Company has made all required principal payments from September 2011 through September 2014. Interest on the 2015 Notes is payable semiannually in arrears on March 27 and September 27 of each year. The 2015 Notes contain certain restrictive financial covenants, which include a consolidated debt to consolidated total capitalization ratio, a fixed charge coverage ratio, and a priority debt to consolidated net worth ratio. As of August 30, 2014, the Company was in compliance with all such covenants.
Other Considerations
During the second half of fiscal 2014, we implemented strategic restructuring initiatives, which are expected to result in annualized operating profit benefit of $40 million to $45 million. The operating profit benefits began to be realized in fiscal 2014 and consisted primarily of reduced labor expense related to the headcount reductions and operating profit benefits associated with the closed stores. We expect to continue to incur cash outlays associated with the lease obligations pursuant to the contractual obligations of the leases. The lease obligations for the stores closed as part of the restructuring initiatives are included in the aggregate minimum annual rental under operating leases as discussed below.
In the fourth quarter of fiscal 2014, the Company entered into the Dollar Tree merger agreement, under which Dollar Tree will acquire Family Dollar in a cash and stock transaction. In conjunction with the Dollar Tree merger agreement, the Company incurred $9.4 million of professional fees during fiscal 2014, consisting primarily of financial advisory and legal costs. In fiscal 2015, the Company estimates it will incur between $45 million and $55 million of additional professional fees related to the pending merger.
Our inventory per store increased 8.0%, as compared to the end of fiscal 2013, primarily driven by the accelerated receipt of shipments and in-transit inventory for holiday merchandise. Total merchandise inventories at the end of fiscal 2014 increased 9.7%, as compared to fiscal 2013, due to both the accelerated receipt of shipments and the new stores opened during fiscal 2014.
Capital expenditures for fiscal 2014 were $436.3 million, as compared to $744.4 million in fiscal 2013. The decrease in capital expenditures was primarily related to a shift to build-to-suit transactions from sale-leaseback transactions in fiscal 2014, as compared to fiscal 2013, and the completion of construction for the eleventh distribution center in fiscal 2013. A summary of spending in fiscal 2014 and fiscal 2013 is as follows:
52 Weeks Ended | 53 Weeks Ended | |||||||
(in thousands) | August 30, 2014 | August 31, 2013 | ||||||
New stores | $ | 148,947 | $ | 385,191 | ||||
Store renovations | 141,400 | 149,120 | ||||||
Existing stores | 72,858 | 52,972 | ||||||
Supply chain | 31,006 | 76,002 | ||||||
Corporate and technology investments | 42,077 | 81,143 | ||||||
Total capital expenditures | $ | 436,288 | $ | 744,428 | ||||
The total number of stores open at year-end increased 1.6% in fiscal 2014, as compared to fiscal 2013. However, the average store count increased 5.4% in fiscal 2014, as compared to fiscal 2013. The total number of stores at year-end increased 6.4% in fiscal 2013 and the average store count increased 6.7% in fiscal 2013, as compared to fiscal 2012. The average store count is calculated as rolling 13-month average using the ending store count per fiscal month. A summary of store information is as follows:
37
Fiscal 2014 | Fiscal 2013 | Fiscal 2012 | |||||||
Store count - beginning of year | 7,916 | 7,442 | 7,023 | ||||||
New stores | 526 | 500 | 475 | ||||||
Closed stores | 400 | 26 | 56 | ||||||
Store count - end of year | 8,042 | 7,916 | 7,442 | ||||||
Total relocated, expanded, and renovated stores | 738 | 830 | 854 | ||||||
Total selling square feet (in thousands) | 58,112 | 56,846 | 53,207 | ||||||
Average store count | 8,095 | 7,680 | 7,197 | ||||||
During fiscal 2014, the Company purchased a total of 1.8 million shares of its common stock at a cost of $125.0 million. All shares were purchased pursuant to share repurchase authorizations approved by the Board of Directors. As of August 30, 2014, the Company had $245.8 million remaining under the current share repurchase authorization.
The timing and amount of any shares repurchased have been and will continue to be determined by management based on its evaluation of market conditions and other factors. Our share repurchase programs do not have a stated expiration date, and purchases may be made through open market purchases, private market transactions, or other structured transactions.
In addition to the Restricted Cash and Investments noted above, our wholly-owned captive insurance subsidiary maintains unrestricted balances in cash and cash equivalents and investment securities used in connection with our retained workers' compensation, general liability and automobile liability risks and are not designated for general corporate purposes. As of August 30, 2014, these cash and cash equivalents and investment securities balances were $4.0 million and $8.8 million, respectively.
Additionally, during fiscal 2014, we continued to develop our global sourcing teams in Europe and Asia, by enhancing our integration processes, and expanding our supplier network. As of August 30, 2014, we had $42.5 million of cash and cash equivalents in our foreign entities. We are not dependent on dividends from our foreign entities to fund our domestic operations. Unremitted earnings from foreign entities, which are considered to be invested indefinitely, would become subject to U.S. income taxes if they were remitted as dividends or were lent to a domestic entity.
Cash Flows From Operating Activities
During fiscal 2014, we had net cash provided by operating activities of $469.2 million, as compared to net cash provided by operating activities of $472.0 million in fiscal 2013. The decrease was due primarily to changes in merchandise inventories, prepayments and other current assets, and accounts payable and accrued liabilities, all in the ordinary course of business.
Additionally, in fiscal 2014, we incurred non-cash charges for restructuring activities, including an impairment on property and equipment, lease obligations on closed stores, and fees related to our pending merger with Dollar Tree. Refer to Note 2 for additional information on these activities.
During fiscal 2013, we had net cash provided by operating activities of $472.0 million, as compared to net cash provided by operating activities of $369.4 million in fiscal 2012. The increase was due primarily to a reduction in payments for merchandise inventories in fiscal 2013, as compared to fiscal 2012, which was offset partially by changes in prepayments and other current assets and income taxes, all in the ordinary course of business.
Cash Flows From Investing Activities
During fiscal 2014, we had net cash used in investing activities of $200.0 million, as compared to net cash used in investing activities of $314.6 million in fiscal 2013. The decrease was due primarily to a decline in capital expenditures and net proceeds from sale-leaseback transactions, which are included in the other considerations discussion above.
During fiscal 2013, we had net cash used in investing activities of $314.6 million, as compared to net cash used in investing activities of $198.3 million in fiscal 2012. The increase was due primarily to an increase in capital expenditures as a result of opening new stores under our sale-leaseback program, offset partially by net changes in restricted cash and investments and investment securities.
Cash Flows From Financing Activities
38
During fiscal 2014, we had net cash used in financing activities of $270.3 million, as compared to net cash used in financing activities $108.7 million during fiscal 2013. The increase in fiscal 2014 was due primarily to repurchases of common stock and payments of dividends in fiscal 2014, as compared to fiscal 2013.
During fiscal 2013, we had net cash used in financing activities of $108.7 million, as compared to net cash used in financing activities of $220.1 million during fiscal 2012. We purchased $75.0 million of our common stock during fiscal 2013 as compared to $191.6 million in fiscal 2012, a decrease in share repurchases of $116.6 million.
Contractual Obligations and Other Commercial Commitments
The following table shows our obligations and commitments to make future payments under contractual obligations at the end of fiscal 2014. Merchandise letters of credit represent obligations due within the next year to suppliers for merchandise the Company has agreed to purchase. Construction obligations relate primarily to amounts due to developers for new store construction projects, which have yet to be completed. Minimum royalty payments are related to an exclusive agreement to sell certain branded merchandise.
Contractual Obligation Payments Due During | ||||||||||||||||||||||||||||
(in thousands) | Total | Fiscal 2015 | Fiscal 2016 | Fiscal 2017 | Fiscal 2018 | Fiscal 2019 | Thereafter | |||||||||||||||||||||
Long-term debt | $ | 501,400 | $ | 16,200 | $ | 185,200 | $ | — | $ | — | $ | — | $ | 300,000 | ||||||||||||||
Interest | 112,912 | 25,416 | 19,996 | 15,000 | 15,000 | 15,000 | 22,500 | |||||||||||||||||||||
Merchandise letters of credit | 67,534 | 67,534 | — | — | — | — | — | |||||||||||||||||||||
Operating leases | 4,238,878 | 589,846 | 553,859 | 510,208 | 460,031 | 406,167 | 1,718,767 | |||||||||||||||||||||
Construction obligations | 41,456 | 41,456 | — | — | — | — | — | |||||||||||||||||||||
Minimum royalties | 700 | 700 | — | — | — | — | — | |||||||||||||||||||||
Total | $ | 4,962,880 | $ | 741,152 | $ | 759,055 | $ | 525,208 | $ | 475,031 | $ | 421,167 | $ | 2,041,267 | ||||||||||||||
As of August 30, 2014, we had $24.7 million in liabilities related to our uncertain tax positions. At this time, we cannot reasonably determine the timing of any payments related to these liabilities, except for $4.8 million, which were classified as current liabilities and may become payable within the next 12 months. See Note 11 to the Consolidated Financial Statements included in this Report for more information on our tax liabilities.
The following table shows our other commercial commitments at the end of fiscal 2014.
(in thousands) | Total Amounts Committed | |||
Standby letters of credit | $ | 48,695 | ||
Surety bonds | 49,256 | |||
Total | $ | 97,951 | ||
A substantial portion of the outstanding amount of standby letters of credit, which are primarily renewed on an annual basis, is used as surety for future premium and deductible payments to our workers' compensation and general liability insurance carrier. We accrue for these future payment liabilities as described in the "Critical Accounting Policies" section of this discussion.
We issue inventory purchase orders in the normal course of business, which we may choose to cancel. We do not consider purchase orders to be firm inventory commitments; therefore, they are excluded from the table above. If we choose to cancel a purchase order, we may be obligated to reimburse the vendor for unrecoverable outlays incurred prior to cancellation.
Pending Merger Commitments
The Dollar Tree merger agreement contains provisions that in the event of termination of the Dollar Tree merger agreement, Family Dollar may be required to pay to Dollar Tree its out-of-pocket expenses, not to exceed $90 million, if the merger agreement is terminated by either Dollar Tree or Family Dollar because Family Dollar fails to obtain the required stockholder approval at the Family Dollar stockholders' meeting (as it may be adjourned or postponed). In addition, Family Dollar may be required to pay a termination fee of $305 million, less any payment paid in respect of Dollar Tree's out-of-pocket expenses,
39
under certain circumstances, including a change in the recommendation of the board of directors of Family Dollar or termination of the Dollar Tree merger agreement by Family Dollar to enter into an agreement for a "Company Superior Proposal" (as defined in the Dollar Tree merger agreement). As of August 30, 2014, no amount has been recorded in our Consolidated Financial Statements related to these provisions.
Off Balance Sheet Arrangements
The Company does not have any material off balance sheet arrangements other than the operating leases included in the "Contractual Obligations and Other Commercial Commitments" section above. Our operating lease obligations are primarily related to payments due under noncancelable store leases.
Recent Accounting Pronouncements
In May 2014, the Financial Accounting Standards Board ("FASB") issued Accounting Standards Update ("ASU") 2014-09 Revenue from Contracts with Customers (Topic 606) ("ASU 2014-09"). The ASU is a comprehensive new revenue recognition model requiring a company to recognize revenue to depict the transfer of goods or services to a customer at an amount reflecting the consideration it expects to receive in exchange for those goods or services. In adopting ASU 2014-09, companies may use either a full retrospective or a modified retrospective approach. ASU 2014-09 is effective for the first interim period within annual reporting periods beginning after December 15, 2016, and early adoption is not permitted. The Company will adopt ASU 2014-09 during the first quarter of fiscal 2018. The Company is still assessing the impact of this ASU on the Consolidated Financial Statements.
In September 2013, the Internal Revenue Service issued updated tax regulations for the Deduction and Capitalization of Expenditures Related to Tangible Property. The regulations can be adopted early; however, the mandatory effective date for the Company is the first quarter of fiscal 2015. These regulations provide additional guidance related to the capitalization and expensing of fixed assets, repairs, and other expenditure types related to the updated tax regulations. Based upon the Company's analysis, the regulations are not expected to have a material impact on the Company's Consolidated Financial Statements.
In July 2013, the FASB issued Accounting Standards Update 2013-11 Income Taxes (Topic 740): Presentation of an Unrecognized Tax Benefit When a Net Operating Loss Carryforward, a Similar Tax Loss, or a Tax Credit Carryforward Exists ("ASU 2013-11"). The ASU is effective for fiscal years, and interim periods within those years, beginning after December 15, 2013. The Company will adopt ASU 2013-11 during the first quarter of fiscal 2015, which is not expected to have a material impact on the Company's Consolidated Financial Statements.
In February 2013, the FASB issued Accounting Standards Update 2013-02 Reporting of Amounts Reclassified Out of Accumulated Other Comprehensive Income ("ASU 2013-02"). ASU 2013-02 requires an entity to provide information about the amounts reclassified out of accumulated other comprehensive income by component. The ASU is effective for fiscal years, and interim periods within those years, beginning after December 15, 2012. The ASU was effective for the Company beginning in the first quarter of fiscal 2014 and did not have a material impact on the Company's Consolidated Financial Statements.
Critical Accounting Policies
Our financial statements have been prepared in accordance with accounting policies generally accepted in the United States of America. Our discussion and analysis of our financial condition and results of operations are based on these financial statements. The preparation of these financial statements requires the application of accounting policies in addition to certain estimates and judgments by our management. Our estimates and judgments are based on currently available information, historical results and other assumptions we believe are reasonable. Actual results could differ from these estimates.
We believe the following accounting principles are critical because they involve significant judgments, assumptions and estimates used in the preparation of our Consolidated Financial Statements.
Merchandise Inventories:
Our inventories are valued using the retail method, based on retail prices less markup percentages, which approximates the lower of first-in, first-out (FIFO) cost or market. We record adjustments to inventory through cost of sales when retail price reductions, or markdowns, are taken against on-hand inventory. In addition, we make estimates and judgments regarding, among other things, initial markups, markdowns, future demand for specific product categories and market conditions, all of
40
which can significantly impact inventory valuation. These estimates and judgments are based on the application of a consistent methodology each period. While we believe we have sufficient current and historical knowledge to record reasonable estimates for these components, if actual demand or market conditions are different than our projections, it is possible actual results could differ from recorded estimates. This risk is generally higher for seasonal merchandise than for non-seasonal merchandise. We estimate inventory losses for damaged, lost or stolen inventory (inventory shrinkage) for the period from the most recent physical inventory to the financial statement date. The accrual for estimated inventory shrinkage was $79.5 million as of the end of fiscal 2014 and $77.5 million as of the end of fiscal 2013. The accrual for estimated inventory shrinkage is based on the trailing twelve-month actual inventory shrinkage rate and can fluctuate from period to period based on the timing of the physical inventory counts. Stores receive a physical inventory at least annually. There were no material changes in the estimates or assumptions related to the valuation of inventory during fiscal 2014. As a result of the strategic initiative to close 377 underperforming stores during the second half of fiscal 2014, an additional $11.9 million of markdowns were incurred to sell through inventory at these stores. Additionally, an adjustment to shrink expense was made to Cost of sales for any inventory balance remaining on the books and records after the stores were closed. Refer to Note 2 to the Consolidated Financial Statements included in this Report for more information on restructuring activities.
Property and Equipment:
We state property and equipment at cost. We calculate depreciation for financial reporting purposes using the straight-line method over the estimated useful lives of the related assets. For leasehold improvements, this depreciation is over the shorter of the term of the related lease (generally between five and fifteen years), including reasonably assured renewal options, or the asset's useful economic life. The valuation and classification of these assets and the assignment of useful depreciable lives involves significant judgments and the use of estimates.
The increase in gross property and equipment, before depreciation, is not commensurate with capital expenditures as a result of the impairment recorded for 377 underperforming stores closed as part of the Company's strategic initiatives in fiscal 2014 and as a result of the significant amount of assets sold during the year under sale-leaseback transactions. We generally do not assign salvage value to property and equipment. We review property and equipment for impairment whenever events or changes in circumstances indicate that the carrying amount of an asset may not be recoverable. As a result of the strategic initiative to close underperforming stores during the second half of fiscal 2014, an impairment of $19.9 million on property and equipment was recorded in fiscal 2014. Refer to Note 2 to the Consolidated Financial Statements included in this Report for more information on restructuring activities. Refer to Notes 1 and 6 to the Consolidated Financial Statements included in this Report for more information on property and equipment.
Insurance Liabilities:
We are primarily self-insured for health care, property loss, workers' compensation, general liability, and auto liability costs. These costs are significant primarily due to the large number of retail locations and employees. Our self-insurance liabilities are based on the total estimated costs of claims filed and estimates of claims incurred but not reported, less amounts paid against such claims, and are not discounted. We review current and historical claims data in developing our estimates. We also use information provided by outside actuaries with respect to medical, workers' compensation, general liability, and auto liability claims. The insurance liabilities we record are mainly influenced by changes in payroll expense, sales, number of vehicles, and the frequency and severity of claims. The estimates of more recent claims are more volatile and more likely to change than older claims. If the underlying facts and circumstances of the claims change or if the historical trend is not indicative of future trends, then we may be required to record additional expense or a reduction in expense, which could be material to our reported financial condition and results of operations.
We record our liabilities for workers' compensation, general liability and auto liability costs on a gross basis, and record a separate insurance asset for amounts recoverable under stop-loss insurance policies on the Consolidated Balance Sheets. In addition, our gross liabilities and the related insurance asset are separated into current and non-current amounts on the Consolidated Balance Sheets.
Our total liabilities for workers' compensation, general liability and auto liability costs were $224.9 million ($52.6 million current and $172.3 million non-current) as of the end of fiscal 2014 and $232.1 million ($52.2 million current and $179.9 million non-current) as of the end of fiscal 2013. The current portion of the liabilities is included in Accrued Liabilities on the Consolidated Balance Sheets, and the non-current portion is included in Other Liabilities. The insurance assets related to these amounts totaled $29.7 million ($2.1 million current and $27.6 million non-current) as of the end of fiscal 2014 and $31.7 million ($2.5 million current and $29.2 million non-current) as of the end of fiscal 2013. The current portion of the assets is included in Prepayments and other current assets on the Consolidated Balance Sheets, and the non-current portion is included in Other Assets. There were no other material estimates for insurance liabilities during fiscal 2014 or fiscal 2013. Our insurance
41
expense during fiscal 2014, fiscal 2013 and fiscal 2012 was impacted by changes in our liabilities for workers' compensation, general liability and auto liability costs.
Contingent Income Tax Liabilities:
We are subject to routine income tax audits in the normal course of business, and we record contingent income tax liabilities related to our uncertain tax positions. Our liabilities related to uncertain tax positions require an assessment of the probability of the income-tax-related exposures and settlements and are influenced by our historical audit experiences with various taxing authorities, as well as by current income tax trends. If circumstances change, we may be required to record adjustments that could be material to our reported financial condition and results of operations. Our liabilities related to uncertain tax positions were $24.7 million as of the end of fiscal 2014 and $30.2 million as of the end of fiscal 2013. There were no material changes in the estimates or assumptions used to determine contingent income tax liabilities during fiscal 2014. Refer to Note 11 to the Consolidated Financial Statements included in this Report for more information on our contingent income tax liabilities.
Contingent Legal Liabilities:
We are involved in numerous legal proceedings and claims. Our accruals, if any, related to these proceedings and claims are based on a determination of whether or not the loss is both probable and reasonably estimable. We review outstanding claims and proceedings with external counsel to assess probability and estimates of loss. We re-evaluate the claims and proceedings each quarter or as new and significant information becomes available, and we adjust or establish accruals, if necessary. If circumstances change, we may be required to record adjustments that could be material to our Consolidated Financial Statements. Our total legal liabilities were not material as of the end of fiscal 2014 or fiscal 2013. There were no material changes in the estimates or assumptions used to determine contingent legal liabilities during fiscal 2014. See Note 13 to the Consolidated Financial Statements included in this Report for more information on our contingent legal liabilities.
Liabilities for Closed Stores:
From time to time, we vacate stores prior to the expiration of the related lease. For vacated locations with remaining lease commitments, we record an expense for the present value of our future lease payments and related costs, including real estate taxes, insurance, and common area maintenance, from the date of closure through the end of the remaining lease terms, net of expected future sublease rental income. Our estimate of future cash flows is based on historical experience; our analysis of the specific real estate market, including input from independent real estate disposition experts; and economic conditions that can be difficult to predict. Cash flows are discounted using our incremental borrowing interest rates that coincide with the remaining lease terms. As of August 30, 2014, we recorded a liability of $43.7 million related to the strategic initiative to close 377 underperforming stores during the second half of fiscal 2014. Of this liability, $13.3 million was included in Accrued liabilities and $30.4 million was included in Other liabilities in the Consolidated Balance Sheet. Refer to Note 2 to the Consolidated Financial Statements included in this Report for more information on restructuring activities.
Stock-based Compensation Expense:
We measure stock-based compensation expense based on the estimated fair value of the award on the grant date. The determination of the fair value of our employee stock options on the grant date is calculated using a Black-Scholes option-pricing model and is affected by our stock price, as well as by assumptions regarding a number of complex and subjective variables. These variables include, but are not limited to, the expected stock price volatility over the term of the awards, and actual and projected employee stock option exercise behaviors. We also grant performance share rights and adjust compensation expense each quarter based on the ultimate number of shares expected to be issued, which is dependent upon the Company's performance relative to a peer group. If factors change and we employ different assumptions to measure stock-based compensation in future periods, the compensation expense recorded may differ significantly from the amount recorded in the current period. Our results for fiscal 2014, fiscal 2013 and fiscal 2012 include stock-based compensation expense of $15.4 million, $16.3 million, and $15.9 million, respectively. There were no material changes in the estimates or assumptions used to determine stock-based compensation during fiscal 2014. See Note 14 to the Consolidated Financial Statements included in this Report for more information on stock-based compensation.
ITEM 7A. QUANTITATIVE AND QUALITATIVE DISCLOSURES ABOUT MARKET RISK
We are subject to market risk from exposure to changes in interest rates based on our financing, investing and cash management activities. We maintain unsecured revolving credit facilities at variable rates of interest to meet the short-term needs of our expansion program and seasonal inventory increases. We performed a sensitivity analysis assuming a hypothetical 100 basis point movement in interest rates applied to the average daily borrowings under our credit facility. As of August 30,
42
2014, the analysis indicated such a movement would not have a material impact on our financial position, results of operations or cash flows. During fiscal 2014 and fiscal 2013 we incurred an immaterial amount of interest expense related to our credit facilities. Refer to Note 7 to the Consolidated Financial Statements included in this Report for more information on our credit facilities.
43
ITEM 8. FINANCIAL STATEMENTS AND SUPPLEMENTARY DATA
INDEX TO CONSOLIDATED FINANCIAL STATEMENTS
FAMILY DOLLAR STORES, INC., AND SUBSIDIARIES
Page No. | |
44
Report of Independent Registered Public Accounting Firm
To the Board of Directors and Shareholders of Family Dollar Stores, Inc., and Subsidiaries:
In our opinion, the accompanying consolidated balance sheets and the related consolidated statements of income and comprehensive income, of shareholders' equity and of cash flows present fairly, in all material respects, the financial position of Family Dollar Stores, Inc. and its subsidiaries at August 30, 2014 and August 31, 2013, and the results of their operations and their cash flows for each of the three years in the period ended August 30, 2014 in conformity with accounting principles generally accepted in the United States of America. Also in our opinion, the Company maintained, in all material respects, effective internal control over financial reporting as of August 30, 2014, based on criteria established in Internal Control - Integrated Framework (1992) issued by the Committee of Sponsoring Organizations of the Treadway Commission (COSO). The Company's management is responsible for these financial statements, for maintaining effective internal control over financial reporting and for its assessment of the effectiveness of internal control over financial reporting, included in Management's Report on Internal Control Over Financial Reporting appearing in Item 9A in this Form 10-K. Our responsibility is to express opinions on these financial statements and on the Company's internal control over financial reporting based on our integrated audits. We conducted our audits in accordance with the standards of the Public Company Accounting Oversight Board (United States). Those standards require that we plan and perform the audits to obtain reasonable assurance about whether the financial statements are free of material misstatement and whether effective internal control over financial reporting was maintained in all material respects. Our audits of the financial statements included examining, on a test basis, evidence supporting the amounts and disclosures in the financial statements, assessing the accounting principles used and significant estimates made by management, and evaluating the overall financial statement presentation. Our audit of internal control over financial reporting included obtaining an understanding of internal control over financial reporting, assessing the risk that a material weakness exists, and testing and evaluating the design and operating effectiveness of internal control based on the assessed risk. Our audits also included performing such other procedures as we considered necessary in the circumstances. We believe that our audits provide a reasonable basis for our opinions.
A company's internal control over financial reporting is a process designed to provide reasonable assurance regarding the reliability of financial reporting and the preparation of financial statements for external purposes in accordance with generally accepted accounting principles. A company's internal control over financial reporting includes those policies and procedures that (i) pertain to the maintenance of records that, in reasonable detail, accurately and fairly reflect the transactions and dispositions of the assets of the company; (ii) provide reasonable assurance that transactions are recorded as necessary to permit preparation of financial statements in accordance with generally accepted accounting principles, and that receipts and expenditures of the company are being made only in accordance with authorizations of management and directors of the company; and (iii) provide reasonable assurance regarding prevention or timely detection of unauthorized acquisition, use, or disposition of the company's assets that could have a material effect on the financial statements.
Because of its inherent limitations, internal control over financial reporting may not prevent or detect misstatements. Also, projections of any evaluation of effectiveness to future periods are subject to the risk that controls may become inadequate because of changes in conditions, or that the degree of compliance with the policies or procedures may deteriorate.
/s/ PricewaterhouseCoopers LLP
Charlotte, North Carolina
October 29, 2014
45
FAMILY DOLLAR STORES, INC., AND SUBSIDIARIES
CONSOLIDATED BALANCE SHEETS
(in thousands, except per share and share amounts) | August 30, 2014 | August 31, 2013 | ||||||
Assets | ||||||||
Current assets: | ||||||||
Cash and cash equivalents | $ | 139,840 | $ | 140,999 | ||||
Short-term investment securities | 8,800 | 4,000 | ||||||
Restricted cash and investments | 31,380 | 35,443 | ||||||
Merchandise inventories | 1,609,932 | 1,467,016 | ||||||
Deferred income taxes | 65,856 | 34,510 | ||||||
Income tax refund receivable | 64,458 | 13,485 | ||||||
Prepayments and other current assets (Note 5) | 181,780 | 161,552 | ||||||
Total current assets | 2,102,046 | 1,857,005 | ||||||
Property and equipment, net (Note 6) | 1,688,213 | 1,732,544 | ||||||
Investment securities | — | 22,977 | ||||||
Other assets | 67,036 | 97,335 | ||||||
Total assets | $ | 3,857,295 | $ | 3,709,861 | ||||
Liabilities and Shareholders' Equity | ||||||||
Current liabilities: | ||||||||
Short-term borrowings (Note 7) | $ | — | $ | — | ||||
Current portion of long-term debt (Note 7) | 16,200 | 16,200 | ||||||
Accounts payable | 773,021 | 723,200 | ||||||
Accrued liabilities (Note 9) | 335,054 | 335,854 | ||||||
Income taxes | 4,755 | 4,968 | ||||||
Total current liabilities | 1,129,030 | 1,080,222 | ||||||
Long-term debt (Note 7) | 484,226 | 500,275 | ||||||
Other liabilities (Note 10) | 316,382 | 289,194 | ||||||
Deferred gain (Note 8) | 227,080 | 218,088 | ||||||
Deferred income taxes | 34,852 | 23,027 | ||||||
Commitments and contingencies (Note 13) | ||||||||
Shareholders' equity (Note 15): | ||||||||
Preferred stock, $1 par; authorized 500,000 shares; no shares issued and outstanding | — | — | ||||||
Common stock, $0.10 par; authorized 600,000,000 shares; issued 120,749,980 shares at August 30, 2014, and 120,091,158 shares at August 31, 2013, and outstanding 113,986,257 shares at August 30, 2014, and 115,092,113 shares at August 31, 2013 | 12,077 | 12,009 | ||||||
Capital in excess of par | 333,579 | 299,865 | ||||||
Retained earnings | 1,724,041 | 1,569,625 | ||||||
Accumulated other comprehensive loss | (489 | ) | (2,195 | ) | ||||
Common stock held in treasury, at cost (6,763,723 shares at August 30, 2014, and 4,999,045 shares at August 31, 2013) | (403,483 | ) | (280,249 | ) | ||||
Total shareholders' equity | 1,665,725 | 1,599,055 | ||||||
Total liabilities and shareholders' equity | $ | 3,857,295 | $ | 3,709,861 | ||||
The accompanying notes are an integral part of the consolidated financial statements.
46
FAMILY DOLLAR STORES, INC., AND SUBSIDIARIES
CONSOLIDATED STATEMENTS OF INCOME
52 Weeks Ended | 53 Weeks Ended | 52 Weeks Ended | ||||||||||
(in thousands, except per share amounts) | August 30, 2014 | August 31, 2013 | August 25, 2012 | |||||||||
Net sales | $ | 10,489,330 | $ | 10,391,457 | $ | 9,331,005 | ||||||
Cost and expenses: | ||||||||||||
Cost of sales | 6,946,115 | 6,836,712 | 6,071,058 | |||||||||
Cost of sales - restructuring | 11,930 | — | — | |||||||||
Selling, general and administrative | 3,022,219 | 2,866,788 | 2,584,234 | |||||||||
Restructuring | 78,180 | — | — | |||||||||
Merger fees | 9,434 | — | — | |||||||||
Litigation charge | — | — | 11,500 | |||||||||
Cost of sales and operating expenses | 10,067,878 | 9,703,500 | 8,666,792 | |||||||||
Operating profit | 421,452 | 687,957 | 664,213 | |||||||||
Investment income | 190 | 422 | 927 | |||||||||
Interest expense | 30,038 | 25,888 | 25,090 | |||||||||
Other income | 31,150 | 28,206 | 23,888 | |||||||||
Income before income taxes | 422,754 | 690,697 | 663,938 | |||||||||
Income taxes | 138,251 | 247,122 | 241,698 | |||||||||
Net income | $ | 284,503 | $ | 443,575 | $ | 422,240 | ||||||
Net income per common share—basic | $ | 2.49 | $ | 3.85 | $ | 3.61 | ||||||
Weighted average shares—basic | 114,035 | 115,252 | 117,097 | |||||||||
Net income per common share—diluted | $ | 2.49 | $ | 3.83 | $ | 3.58 | ||||||
Weighted average shares—diluted | 114,421 | 115,805 | 118,058 | |||||||||
The accompanying notes are an integral part of the consolidated financial statements.
47
FAMILY DOLLAR STORES, INC., AND SUBSIDIARIES
CONSOLIDATED STATEMENTS OF COMPREHENSIVE INCOME
52 Weeks Ended | 53 Weeks Ended | 52 Weeks Ended | ||||||||||
(in thousands) | August 30, 2014 | August 31, 2013 | August 25, 2012 | |||||||||
Net income | $ | 284,503 | $ | 443,575 | $ | 422,240 | ||||||
Other comprehensive income: | ||||||||||||
Unrealized net gains/(losses) on investment securities (net of taxes) | 1,679 | (413 | ) | 4,527 | ||||||||
Other | 27 | 59 | 35 | |||||||||
Other comprehensive income/(loss) | $ | 1,706 | $ | (354 | ) | $ | 4,562 | |||||
Comprehensive income | $ | 286,209 | $ | 443,221 | $ | 426,802 | ||||||
There were no material reclassifications from accumulated other comprehensive income into net income.
The accompanying notes are an integral part of the consolidated financial statements.
48
FAMILY DOLLAR STORES, INC., AND SUBSIDIARIES
CONSOLIDATED STATEMENTS OF CASH FLOWS
52 Weeks Ended | 53 Weeks Ended | 52 Weeks Ended | ||||||||||
(in thousands) | August 30, 2014 | August 31, 2013 | August 25, 2012 | |||||||||
Cash flows from operating activities: | ||||||||||||
Net income | $ | 284,503 | $ | 443,575 | $ | 422,240 | ||||||
Adjustments to reconcile net income to net cash provided by operating activities: | ||||||||||||
Depreciation and amortization | 265,461 | 239,485 | 213,835 | |||||||||
Amortization of deferred gain | (18,005 | ) | (15,123 | ) | (3,087 | ) | ||||||
Impairment on property and equipment - restructuring | 19,926 | — | — | |||||||||
Lease obligations on closed stores - restructuring | 43,689 | — | — | |||||||||
Merger fees | 9,115 | — | — | |||||||||
Deferred income taxes | (14,124 | ) | 3,693 | (24,321 | ) | |||||||
Excess tax benefits from stock-based compensation | (6,352 | ) | (13,231 | ) | (12,345 | ) | ||||||
Stock-based compensation | 15,363 | 16,258 | 15,902 | |||||||||
Loss on disposition of property and equipment | 9,182 | 5,826 | 11,429 | |||||||||
Changes in operating assets and liabilities: | ||||||||||||
Merchandise inventories | (142,916 | ) | (40,853 | ) | (271,503 | ) | ||||||
Prepayments and other current assets | (20,231 | ) | (113,920 | ) | 23,838 | |||||||
Other assets | 14,601 | (449 | ) | (2,506 | ) | |||||||
Accounts payable and accrued liabilities | 65,570 | (32,656 | ) | (36,497 | ) | |||||||
Income taxes | (51,186 | ) | (40,374 | ) | 37,209 | |||||||
Other liabilities | (5,434 | ) | 19,742 | (4,823 | ) | |||||||
Net cash provided by operating activities | 469,162 | 471,973 | 369,371 | |||||||||
Cash flows from investing activities: | ||||||||||||
Purchases of restricted and unrestricted investment securities | (53,481 | ) | (44,278 | ) | (211,142 | ) | ||||||
Sales of restricted and unrestricted investment securities | 93,647 | 45,728 | 334,915 | |||||||||
Net change in restricted cash | 390 | 79,924 | (80,389 | ) | ||||||||
Capital expenditures | (436,288 | ) | (744,428 | ) | (603,313 | ) | ||||||
Net proceeds from sale-leaseback | 194,766 | 345,249 | 359,663 | |||||||||
Proceeds from dispositions of property and equipment | 982 | 3,214 | 1,955 | |||||||||
Net cash used in investing activities | (199,984 | ) | (314,591 | ) | (198,311 | ) | ||||||
Cash flows from financing activities: | ||||||||||||
Short-term borrowings | 2,208,000 | 2,060,000 | 362,300 | |||||||||
Repayment of short-term borrowings | (2,208,000 | ) | (2,075,000 | ) | (347,300 | ) | ||||||
Repayments of long-term debt | (16,200 | ) | (16,200 | ) | (16,200 | ) | ||||||
Repurchases of common stock | (125,038 | ) | (74,954 | ) | (191,573 | ) | ||||||
Change in cash overdrafts | (24,525 | ) | 71,745 | 26,786 | ||||||||
Proceeds from exercise of employee stock options | 19,161 | 20,796 | 24,900 | |||||||||
Excess tax benefits from stock-based compensation | 6,352 | 13,231 | 12,345 | |||||||||
Payment of dividends | (130,087 | ) | (108,334 | ) | (91,390 | ) | ||||||
Net cash used in financing activities | (270,337 | ) | (108,716 | ) | (220,132 | ) | ||||||
Net change in cash and cash equivalents | (1,159 | ) | 48,666 | (49,072 | ) | |||||||
Cash and cash equivalents at beginning of year | 140,999 | 92,333 | 141,405 | |||||||||
Cash and cash equivalents at end of year | $ | 139,840 | $ | 140,999 | $ | 92,333 | ||||||
Supplemental disclosures of cash flow information: | ||||||||||||
Purchases of property and equipment awaiting processing for payment, included in accounts payable | $ | 38,530 | $ | 57,379 | $ | 54,609 | ||||||
Cash paid during the period for: | ||||||||||||
Interest, net of amounts capitalized | 26,596 | 21,895 | 24,001 | |||||||||
Income taxes, net of refunds | 208,694 | 272,748 | 234,740 | |||||||||
The accompanying notes are an integral part of the consolidated financial statements.
49
FAMILY DOLLAR STORES, INC., AND SUBSIDIARIES
CONSOLIDATED STATEMENTS OF SHAREHOLDERS' EQUITY
(in thousands, except per share and share amounts) | Common Stock | Capital in excess of par | Retained earnings | Accumulated other comprehensive loss | Treasury stock | Total | ||||||||||||||||||
Balance, August 27, 2011 (117,353,341 shares common stock; 29,962,891 shares treasury stock) | $ | 14,732 | $ | 274,445 | $ | 1,969,749 | $ | (6,403 | ) | $ | (1,165,449 | ) | $ | 1,087,074 | ||||||||||
Net income for the year | 422,240 | 422,240 | ||||||||||||||||||||||
Unrealized gains on investment securities (net of $2.7 million of taxes) | 4,527 | 4,527 | ||||||||||||||||||||||
Other | 35 | 35 | ||||||||||||||||||||||
Issuance of 1,209,507 common shares under incentive plans, including tax benefits | 121 | 29,602 | 29,723 | |||||||||||||||||||||
Purchase of 3,214,866 common shares for treasury | (191,573 | ) | (191,573 | ) | ||||||||||||||||||||
Retirement of 29,400,000 shares of treasury stock | (2,940 | ) | (60,139 | ) | (1,087,303 | ) | 1,150,382 | — | ||||||||||||||||
Issuance of 14,066 shares of treasury stock under incentive plans | 152 | 622 | 774 | |||||||||||||||||||||
Stock-based compensation | 15,129 | 15,129 | ||||||||||||||||||||||
Dividends declared on common stock, $0.60 per share | (70,302 | ) | (70,302 | ) | ||||||||||||||||||||
Balance, August 25, 2012 (115,362,048 shares common stock; 3,763,691 shares treasury stock) | 11,913 | 259,189 | 1,234,384 | (1,841 | ) | (206,018 | ) | 1,297,627 | ||||||||||||||||
Net income for the year | 443,575 | 443,575 | ||||||||||||||||||||||
Unrealized gains on investment securities (net of $0.4 million of taxes) | (413 | ) | (413 | ) | ||||||||||||||||||||
Other | 59 | 59 | ||||||||||||||||||||||
Issuance of 965,419 common shares under incentive plans, including tax benefits | 96 | 25,141 | 25,237 | |||||||||||||||||||||
Purchase of 1,248,284 common shares for treasury | (74,954 | ) | (74,954 | ) | ||||||||||||||||||||
Issuance of 12,930 shares of treasury stock under incentive plans | 27 | 723 | 750 | |||||||||||||||||||||
Stock-based compensation | 15,508 | 15,508 | ||||||||||||||||||||||
Dividends declared on common stock, $0.94 per share | (108,334 | ) | (108,334 | ) | ||||||||||||||||||||
Balance, August 31, 2013 (115,092,113 shares common stock; 4,999,045 shares treasury stock) | $ | 12,009 | $ | 299,865 | $ | 1,569,625 | $ | (2,195 | ) | $ | (280,249 | ) | $ | 1,599,055 | ||||||||||
Net income for the year | 284,503 | 284,503 | ||||||||||||||||||||||
Unrealized gains on investment securities (net of $0.9 million of taxes) | 1,679 | 1,679 | ||||||||||||||||||||||
Other | 27 | 27 | ||||||||||||||||||||||
Issuance of 658,822 common shares under incentive plans, including tax benefits | 66 | 20,143 | 20,209 | |||||||||||||||||||||
Purchase of 1,794,921 common shares for treasury | (125,038 | ) | (125,038 | ) | ||||||||||||||||||||
Issuance of 30,243 shares of treasury stock under incentive plans | 2 | 13 | 1,804 | 1,819 | ||||||||||||||||||||
Stock-based compensation | 13,558 | 13,558 | ||||||||||||||||||||||
Dividends declared on common stock, $1.14 per share | (130,087 | ) | (130,087 | ) | ||||||||||||||||||||
Balance, August 30, 2014 (113,986,257 shares common stock; 6,763,723 shares treasury stock) | $ | 12,077 | $ | 333,579 | $ | 1,724,041 | $ | (489 | ) | $ | (403,483 | ) | $ | 1,665,725 | ||||||||||
The accompanying notes are an integral part of the consolidated financial statements.
50
FAMILY DOLLAR STORES, INC., AND SUBSIDIARIES
NOTES TO CONSOLIDATED FINANCIAL STATEMENTS
1. Description of Business and Summary of Significant Accounting Policies:
Description of business
The Company operates a chain of more than 8,000 general merchandise retail discount stores in 46 contiguous states, providing consumers with a selection of competitively priced merchandise in convenient neighborhood stores. The Company's products include health and beauty aids, packaged food and refrigerated products, home cleaning supplies, housewares, stationery, seasonal goods, apparel, and domestics. In the typical Family Dollar store, the majority of the products are priced at $10 or less, with many of the products priced at $1 or less. The Company manages its business on the basis of one operating segment.
Dollar Tree merger agreement
On July 27, 2014, the Company entered into the Dollar Tree merger agreement, upon the terms and subject to the conditions of which a subsidiary of Dollar Tree will be merged with and into Family Dollar, with Family Dollar continuing as the surviving entity and a wholly-owned subsidiary of Dollar Tree. The merger is subject to Family Dollar stockholder approval, expiration, or termination of the applicable waiting period under the HSR Act and other customary closing conditions. The merger could be in a position to close as early as December 2014.
Principles of consolidation
The consolidated financial statements include the accounts of the Company and its subsidiaries, all of which are wholly- owned. All intercompany balances and transactions have been eliminated.
Fiscal year
The Company's fiscal year generally ends on the Saturday closest to August 31 of each year, which generally results in an extra week every six years. Fiscal 2014 was a 52-week year, fiscal 2013 was a 53-week year, and fiscal 2012 was a 52-week year.
Use of estimates
The preparation of the Company's consolidated financial statements, in conformity with accounting principles generally accepted in the United States of America, requires management to make estimates and assumptions. These estimates and assumptions affect the reported amounts of assets and liabilities, the disclosure of contingent assets and liabilities at the date of the financial statements and the reported amounts of revenues and expenses during the reporting period. Actual results could differ from these estimates.
Cash and cash equivalents
The Company considers all highly liquid investments with an original maturity of three months or less to be cash equivalents. The carrying amount of the Company's cash equivalents approximates fair value due to the short maturities of these investments and consists primarily of money market funds and other overnight investments. The Company maintains cash deposits with major banks, which from time to time may exceed federally insured limits. The Company periodically assesses the financial condition of the institutions and believes the risk of any loss is remote. Payments due from banks for third-party credit card, debit card and electronic benefit transactions are generally processed within 24-72 hours and are classified as cash equivalents.
The Company maintains zero balance cash disbursement accounts with certain banks. Outstanding checks in excess of funds on deposit with respect to these banks, referred to as cash overdrafts, are classified as Accounts Payable on the Consolidated Balance Sheets, and totaled $76.0 million at the end of fiscal 2014. Cash overdrafts totaled $100.5 million at the end of fiscal 2013. Changes in these overdraft amounts are recorded as financing activities on the Consolidated Statements of Cash Flows.
The Company's wholly-owned captive insurance subsidiary maintains balances in cash and cash equivalents used in connection with the Company's retained workers' compensation, general liability, and automobile liability risks and are not designated for general corporate purposes. These cash and cash equivalents balances totaled $4.0 million as of the end of fiscal 2014 and $2.7 million as of the end of fiscal 2013.
Investment securities
51
The Company classifies all investment securities as available-for-sale. Securities accounted for as available-for-sale are required to be reported at fair value with unrealized gains and losses, net of taxes, excluded from net income and shown separately as a component of Accumulated Other Comprehensive Income within Shareholders' Equity on the Consolidated Balance Sheets. The Company's short-term investment securities currently consist primarily of short-term bond mutual funds and municipal debt securities. Historically, the Company's long-term investment securities consisted of auction rate securities; however these were fully settled subsequent to year-end, therefore classified as short-term at the end of fiscal 2014. Refer to Notes 3 and 4 for more information on the Company's investment securities.
In addition to the cash and cash equivalents balances discussed above, the Company's wholly-owned captive insurance subsidiary also maintains balances in investment securities not designated for general corporate purposes. These investment securities balances were $8.8 million as of the end of fiscal 2014 and $27.0 million as of the end of fiscal 2013.
Restricted cash and investments
The Company has restricted certain cash and investments to serve as collateral for certain of our insurance obligations held at our wholly owned captive insurance subsidiary. These restricted funds cannot be withdrawn from the Company's account without the consent of the secured party. As of August 30, 2014, the Company held $34.4 million in this restricted account, of which $31.4 million was included in Restricted Cash and Investments and $3.0 million was included in Other Assets in the Consolidated Balance Sheets. As of August 31, 2013, we held $55.5 million in this restricted account, of which $35.4 million was included in Restricted Cash and Investments and $20.1 million was included in Other Assets in the Consolidated Balance Sheets. The classification between current and non-current is based on the timing of expected payments of the secured insurance obligations.
Merchandise inventories
Inventories are valued using the retail method, based on retail prices less markup percentages, which approximates the lower of first-in, first-out (FIFO) cost or market. The Company records adjustments to inventory through cost of goods sold when retail price reductions, or markdowns, are taken against on-hand inventory. In addition, the Company makes estimates and judgments regarding, among other things, initial markups, markdowns, future demand for specific product categories and market conditions, all of which can significantly impact inventory valuation. These estimates and judgments are based on the application of a consistent methodology each period. The Company estimates inventory losses for damaged, lost or stolen inventory (inventory shrinkage) for the period from the most recent physical inventory to the financial statement date. The accrual for estimated inventory shrinkage is based on the trailing twelve-month actual inventory shrinkage rate and can fluctuate from period to period based on the timing of the physical inventory counts. Virtually all stores that have been open for approximately one year conduct a physical inventory at least annually. There were no material changes in the estimates or assumptions related to the valuation of inventory during fiscal 2014.
Property and equipment
Property and equipment is stated at cost. Depreciation for financial reporting purposes is calculated using the straight-line method over the estimated useful lives of the related assets. For leasehold improvements, this depreciation is over the shorter of the term of the related lease (generally between five and fifteen years) including reasonably assured renewal options or the asset's useful economic life. Estimated useful lives of property and equipment are shown below.
Buildings and building improvements | 5-40 years |
Furniture, fixtures and equipment | 3-10 years |
Transportation equipment | 3-10 years |
Leasehold improvements | 5-10 years |
The Company capitalizes certain costs incurred in connection with developing, obtaining and implementing software for internal use. Capitalized costs are amortized over the expected economic life of the assets, generally ranging from three to eight years.
Property and equipment is reviewed for impairment whenever events or changes in circumstances indicate the carrying amount of an asset may not be recoverable. Impairment losses on fixed assets typically relate to store closings. As part of its strategic initiatives, during the second half of fiscal 2014, the Company closed 377 underperforming stores. As a result of this initiative,
52
an impairment of $19.9 million was recorded. Historically, impairment losses on fixed assets related to normal store closings have not been material to the Company's financial position or results of operations. Refer to Note 2 for more information on restructuring activities.
Capitalized interest
The Company capitalizes interest on borrowed funds during the construction of property and equipment. The Company capitalized $2.7 million, $7.3 million, and $4.0 million of interest costs during fiscal 2014, fiscal 2013 and fiscal 2012, respectively.
Treasury share retirement
The Company periodically retires treasury shares acquired through share repurchases and returns those shares to the status of authorized but unissued. The Company accounts for treasury stock transactions under the cost method. For each reacquisition of common stock, the number of shares and the acquisition price for those shares is added to the existing treasury stock count and total value. Thus, the average cost per share is re-averaged each time shares are acquired. When treasury shares are retired, the Company's policy is to allocate the excess of the repurchase price over the par value of shares acquired to both Retained Earnings and Capital in Excess of Par. The portion allocated to Capital in Excess of Par is determined by applying a percentage, determined by dividing the number of shares to be retired by the number of shares issued, to the balance of Capital in Excess of Par as of the retirement date.
Revenues
The Company recognizes revenue, net of returns and sales tax, at the time the customer tenders payment for and takes possession of the merchandise.
Certain merchandise at our stores is owned and maintained by third parties. For each one of these merchandise arrangements, the Company records revenue on either a gross or net basis in accordance with ASC 605-45, "Revenue Recognition - Principal Agent Considerations." In determining the appropriate treatment, the Company considers factors such as identification of the primary obligor, inventory risk, latitude in establishing price, discretion in supplier selection, determination of merchandise specifications, and credit risk.
The Company recognizes gift card sales revenue at the time of redemption. A liability for gift cards is established for the cash value at the time of purchase or reload, and is recorded in Accrued liabilities. If a gift card is not redeemed, revenue is recognized using a time-based method over the period from issuance to the point where likelihood of redemption is considered remote. The gift cards do not have an expiration date or monthly fees. Gift card breakage income was first recorded in the first quarter of fiscal 2014, and in fiscal 2014 was $1.6 million.
Cost of sales
Cost of sales includes the purchase cost of merchandise and transportation costs to the Company's distribution centers and stores. Buying, distribution center and occupancy costs, including depreciation, are not included in cost of sales. As a result, cost of sales may not be comparable to those of other retailers that may include these costs in their cost of sales.
Selling, general and administrative expenses
All operating costs, except transportation costs to the Company's distribution centers and stores, are included in SG&A. Buying, distribution center and occupancy costs, including depreciation, are included in SG&A rather than cost of sales.
Insurance liabilities
The Company is primarily self-insured for health care, property loss, workers' compensation, general liability, and auto liability costs. These liabilities are based on the total estimated costs of claims filed and estimates of claims incurred but not reported, less amounts paid against such claims, and are not discounted.
Advertising costs
53
Advertising costs, net of co-op recoveries from vendors, are expensed during the period of the advertisement and amounted to $7.8 million, $18.9 million and $19.6 million in fiscal 2014, fiscal 2013 and fiscal 2012, respectively.
Vendor allowances
The Company receives vendor support in the form of cash payments or allowances through a variety of reimbursements such as purchase discounts, cooperative advertising, markdowns, scandowns, and volume rebates. The Company has agreements with vendors setting forth the specific conditions for each allowance or payment. In accordance with ASC 605-50, "Revenue Recognition - Customer Payments and Incentives," depending on the arrangement, the Company either recognizes the allowance as a reduction of current costs or defers the payment over the period the related merchandise is sold. If the payment is a reimbursement for costs incurred, it is offset against those related costs; otherwise, it is treated as a reduction to the cost of merchandise.
Operating leases
Except for its Store Support Center and distribution centers, the Company generally conducts its operations from leased facilities. Store real estate leases typically have an initial term between five and fifteen years with multiple renewal options for additional five-year periods. The Company also has leases for equipment generally with lease terms of five years to ten years.
All the Company's store leases are classified as operating leases. The Company recognizes rental expense for its store leases on a straight-line basis over the base, non-cancelable lease term. For purposes of recognizing incentives, premiums, and minimum rental expenses, the Company uses the date of initial possession to begin amortization, which is generally when the Company enters the space and begins to make improvements in preparation for intended use. For tenant improvement allowances and rent holidays, the Company records a deferred rent liability at the inception of the lease term and amortizes the deferred rent over the terms of the leases as reductions to rent expense on the Consolidated Statements of Income.
When necessary, the Company vacates stores prior to the expiration of the related lease. For vacated locations with remaining lease commitments, the Company records an expense for the present value of the future lease payments and related costs, including real estate taxes, insurance, and common area maintenance, from the date of closure through the end of the remaining lease terms, net of expected future sublease rental income. The estimate of future cash flows is based on historical experience; analysis of the specific real estate market, including input from independent real estate disposition experts; and economic conditions that can be difficult to predict. Cash flows are discounted using the incremental borrowing interest rates that coincide with the remaining lease terms.
Certain leases provide for contingent rental payments based upon a percentage of store sales. The Company accrues for contingent rental expense as it becomes probable that specified sales targets will be met.
Income taxes
The Company records deferred income tax assets and liabilities for the expected future tax consequences of temporary differences between the financial reporting basis and the income tax basis of its assets and liabilities. The Company estimates contingent income tax liabilities based on an assessment of the probability of the income-tax-related exposures and settlements related to uncertain tax positions. The Company intends to reinvest certain undistributed earnings of foreign subsidiaries indefinitely and anticipates earnings will not be repatriated. Were the Company's intention to change, the Company would be subject to U.S. taxes and withholding taxes payable to various foreign governments. Refer to Note 11 for more information on the Company's income taxes.
Stock-based compensation
The Company recognizes compensation expense related to its stock-based awards based on the fair value of the awards on the grant date. The Company utilizes the Black-Scholes option-pricing model to estimate the grant-date fair value of its stock option awards. The Company also grants performance share rights and adjusts compensation expense each quarter based on the ultimate number of shares expected to be issued, which is dependent upon the Company's performance relative to a peer group. If factors change and the Company employs different assumptions to measure stock-based compensation in future periods, the compensation expense recorded may differ significantly from the amount recorded in the current period. The grant-date fair value of the Company's performance share rights awards is based on the stock price on the grant date. Compensation expense for the Company's stock-based awards is recognized on a straight-line basis, net of estimated forfeitures, over the service period of each award. Refer to Note 14 for more information on the Company's stock-based compensation plans.
54
Other Income
The Company classifies income earned on non-merchandise transactions, which primarily includes fees charged to customers when receiving cash back on debit card transactions, in a line item captioned Other Income below Operating Profit.
Recent accounting pronouncements
In May 2014, the Financial Accounting Standards Board ("FASB") issued Accounting Standards Update ("ASU") 2014-09 Revenue from Contracts with Customers (Topic 606) ("ASU 2014-09"). The ASU is a comprehensive new revenue recognition model requiring a company to recognize revenue to depict the transfer of goods or services to a customer at an amount reflecting the consideration it expects to receive in exchange for those goods or services. In adopting ASU 2014-09, companies may use either a full retrospective or a modified retrospective approach. ASU 2014-09 is effective for the first interim period within annual reporting periods beginning after December 15, 2016, and early adoption is not permitted. The Company will adopt ASU 2014-09 during the first quarter of fiscal 2018. The Company is still assessing the impact of this ASU on the Consolidated Financial Statements.
In July 2013, the FASB issued Accounting Standards Update 2013-11 Income Taxes (Topic 740): Presentation of an Unrecognized Tax Benefit When a Net Operating Loss Carryforward, a Similar Tax Loss, or a Tax Credit Carryforward Exists ("ASU 2013-11"). The ASU is effective for fiscal years, and interim periods within those years, beginning after December 15, 2013. The Company will adopt ASU 2013-11 during the first quarter of fiscal 2015, which is not expected to have a material impact on the Company's Consolidated Financial Statements.
In February 2013, the FASB issued Accounting Standards Update 2013-02 Reporting of Amounts Reclassified Out of Accumulated Other Comprehensive Income ("ASU 2013-02"). ASU 2013-02 requires an entity to provide information about the amounts reclassified out of accumulated other comprehensive income by component. The ASU is effective for fiscal years, and interim periods within those years, beginning after December 15, 2012. The ASU was effective for the Company beginning in the first quarter of fiscal 2014 and did not have a material impact on the Company's Consolidated Financial Statements.
2. Restructuring and Related Activities
Beginning in the third quarter of fiscal 2014, the Company implemented a series of restructuring initiatives intended to strengthen its value proposition, increase operational efficiencies and improve financial performance. The restructuring initiatives included closing 377 underperforming stores across the chain and reducing expenses through workforce optimization. These restructuring initiatives were completed during the third and fourth quarters of fiscal 2014.
The Company incurred $90.1 million of charges related to the restructuring initiatives implemented in fiscal 2014. These charges consisted primarily of lease obligations, property and equipment impairments, inventory write-downs, and termination benefits directly associated with the store closings and workforce optimization.
Of the charges incurred in fiscal 2014 related to these restructuring initiatives, the inventory write-downs are presented in the Cost of Sales - Restructuring line item and the remainder of the restructuring charges are included in the Restructuring line item in the Consolidated Statements of Income. The composition of the restructuring charges incurred during fiscal 2014 were as shown below. Refer to Note 18 for a summary of these charges per quarter.
(in thousands) | Classification of Charge | 52 Weeks Ended | ||||
Charge | August 30, 2014 | |||||
Inventory write-downs | Non-cash | $ | 11,930 | |||
Cost of sales - restructuring | 11,930 | |||||
Property and equipment impairments | Non-cash | $ | 19,925 | |||
Employee termination benefits | Cash | $ | 3,842 | |||
Lease obligations | Cash | $ | 46,142 | |||
Other | Cash | $ | 8,271 | |||
Restructuring | 78,180 | |||||
Total restructuring charges | $ | 90,110 | ||||
55
The table below summarizes the restructuring accrual activity related to the Company's restructuring initiatives for fiscal 2014.
(in thousands) | Employee termination benefits | Lease Obligations | Other | Total | ||||||||||||
Balance as of August 31, 2013 | $ | — | $ | — | $ | — | $ | — | ||||||||
Charges | 3,842 | 46,142 | 8,271 | 58,255 | ||||||||||||
Cash payments | (3,019 | ) | (2,453 | ) | (4,065 | ) | (9,537 | ) | ||||||||
Balance as of August 30, 2014 | $ | 823 | $ | 43,689 | $ | 4,206 | $ | 48,718 | ||||||||
The Company does not expect to incur any further material charges related to fiscal 2014 restructuring initiatives.
Additionally, in the fourth quarter of fiscal 2014, the Company entered into the Dollar Tree merger agreement, under which Dollar Tree will acquire Family Dollar in a cash and stock transaction. In conjunction with this pending merger agreement, the Company incurred $9.4 million of professional fees during fiscal 2014, consisting primarily of financial advisory and legal costs. As of August 30, 2014, the Company's accrual for fees associated with the pending merger was $9.1 million; included within Accrued liabilities on the Consolidated Balance Sheet.
3. Fair Value Measurements:
Fair value accounting standards define fair value as the price that would be received to sell an asset or paid to transfer a liability in an orderly transaction between market participants at the measurement date. The following fair value hierarchy prioritizes the inputs used to measure fair value into three levels, giving the highest priority to Level 1 inputs and the lowest priority to Level 3 inputs.
• | Level 1—Quoted prices in active markets for identical assets or liabilities. |
• | Level 2—Inputs other than quoted prices included within Level 1 that are observable for the asset or liability, either directly or indirectly, such as quoted prices for similar assets or liabilities in active markets, quoted prices for identical or similar assets or liabilities in markets that are not active, inputs other than quoted prices that are observable for the asset or liability, or inputs that are derived principally from or corroborated by observable market data by correlation or other means. |
• | Level 3—Inputs that are unobservable for the asset or liability. |
The unobservable inputs in Level 3 can only be used to measure fair value to the extent that observable inputs in Level 1 and Level 2 are not available. The following table represents the Company's fair value hierarchy as of August 30, 2014, and August 31, 2013, for items required to be measured at fair value on a recurring basis:
56
August 30, 2014 | ||||||||||||||||
(in thousands) | Fair Value | Level 1 | Level 2 | Level 3 | ||||||||||||
Cash equivalents: | ||||||||||||||||
Money market funds | $ | 2,502 | $ | 2,502 | $ | — | $ | — | ||||||||
Investment securities: | ||||||||||||||||
Auction rate securities | 4,800 | — | — | 4,800 | ||||||||||||
Short-term bond mutual fund | 4,000 | 4,000 | — | — | ||||||||||||
Restricted cash and investments: (1) | ||||||||||||||||
Money market funds | 46 | 46 | — | — | ||||||||||||
Municipal debt securities | 34,398 | — | 34,398 | — | ||||||||||||
Other assets: | ||||||||||||||||
Mutual funds(2) | 19,689 | 19,689 | — | — | ||||||||||||
August 31, 2013 | ||||||||||||||||
(in thousands) | Fair Value | Level 1 | Level 2 | Level 3 | ||||||||||||
Cash equivalents: | ||||||||||||||||
Money market funds | $ | 26,200 | $ | 26,200 | $ | — | $ | — | ||||||||
Investment securities: | ||||||||||||||||
Auction rate securities | 22,977 | — | — | 22,977 | ||||||||||||
Short-term bond mutual fund | 4,000 | 4,000 | — | — | ||||||||||||
Restricted cash and investments: (1) | ||||||||||||||||
Money market funds | 437 | 437 | — | — | ||||||||||||
Municipal debt securities | 55,055 | — | 55,055 | — | ||||||||||||
Other assets: | ||||||||||||||||
Mutual funds(2) | 20,043 | 20,043 | — | — | ||||||||||||
(1) | As of August 30, 2014, restricted cash and investments of $31.4 million and $3.0 million were included in Restricted Cash and Investments and Other Assets, respectively, in the Consolidated Balance Sheets. As of August 31, 2013, restricted cash and investments of $35.4 million and $20.1 million were included in Restricted Cash and Investments and Other Assets, respectively, in the Consolidated Balance Sheets. |
(2) | Represents assets held pursuant to a deferred compensation plan for certain key management employees. The Company has recorded a corresponding liability related to the deferred compensation plan in an amount equivalent to the assets above. The liability for the deferred compensation plan is recorded in Other Liabilities on the Consolidated Balance Sheets. |
On a non-recurring basis, the Company adjusts certain Property and Equipment to fair value through impairment charges. Property and Equipment is reviewed for impairment whenever events or changes in circumstances indicate the carrying amount of an asset or asset group may not be recoverable. The fair value of the Property and Equipment is determined based on a discounted cash flow analysis using Level 3 inputs. The Company estimates future cash flows based on historical experience and its expectations of future performance. Impairment charges related to the store closure initiative were $19.9 million during fiscal 2014 and were not material during fiscal 2013. Refer to Note 2 for further discussion of the store closure initiative and related impairment charges.
Level 2 Inputs
All assets classified as Level 2 are valued using matrix pricing. The Company believes that while the assets valued using Level 2 inputs currently trade in active markets and prices could be obtained for identical assets, the classification of these investments as Level 2 is more appropriate when matrix pricing is used.
Auction Rate Securities
The Company's auction rate securities ("ARS") are tax-exempt bonds collateralized by federally guaranteed student loans and were valued using Level 3 inputs. Due to continued issues in the global credit and capital markets, and specifically the ARS market, the Company's $4.8 million par value ARS portfolio has historically experienced sustained failed auctions. The
57
Company has been able to liquidate the investments, at or close to par value, when any of the following events occur: a successful auction, a buyer is found outside the auction process, the securities are called or refinanced by the issuer, or the underlying securities mature. For the past several years, the Company liquidated substantially all of its ARS portfolio at or near par through issuer calls, refinancings, or upon maturity.
During fiscal 2014, the Company settled $20.9 million par value of its ARS portfolio and realized a loss of $0.3 million on these settlements. As of August 30, 2014, the Company's ARS portfolio was $4.8 million par value. Subsequent to year-end, on September 4, 2014, the Company settled the remainder of its ARS portfolio at par.
The Company had no temporary gross unrealized loss of with respect to its ARS portfolio as of August 30, 2014. Changes in the unrealized loss were included in Accumulated Other Comprehensive Loss within Shareholders' Equity on the Consolidated Balance Sheet.
As of August 30, 2014, the ARS portfolio was classified within short-term investment securities as a result of a receipt of a redemption call notice prior to year-end. In previous fiscal years, due to the continued failure of the auction process and the continued uncertainty regarding the timing of future liquidity, the ARS portfolio was classified within long-term investment securities. The fair value of each security was determined through the use of a discounted cash flow analysis using Level 3 inputs because there is no active market for the Company's ARS portfolio. The two most significant unobservable inputs used in the analysis were as follows:
• | The weighted-average expected term to liquidate the securities. The assumption used in the analysis was based on the Company's estimate of the timing of future liquidity, which assumed the securities would be called or refinanced by the issuer or repurchased by the broker dealers prior to maturity. |
• | The illiquidity factor applied to the discount rate. The assumption used in the analysis was based on market rates for similar liquid tax-exempt securities with comparable ratings and maturities. Due to the uncertainty surrounding the timing of future liquidity, a factor was applied to the discount rates to reflect the illiquidity of the investments. |
The inputs used in the Company's analysis were sensitive to market conditions, and the Company's valuation of its ARS portfolio could have changed based on the assumptions used. As of August 30, 2014, a 100 basis point increase or decrease in the illiquidity factor, along with a 12-month increase or decrease in the weighted average term, did not result in a material range of a gross unrealized loss.
The Company also evaluated each of its ARS for other-than-temporary impairment. The Company's evaluation was based on an analysis of the credit rating and parity ratio of each security. The parity ratio is the ratio of trust assets available for distribution to creditors to the trust obligations to those creditors. The credit quality of the Company's ARS portfolio remains high and the securities had a weighted average parity ratio of 143.9% as of August 30, 2014. Based on these factors, the Company concluded there was no other-than-temporary impairment as of August 30, 2014.
The following tables summarize the change in the fair value of the Company's ARS portfolio measured using Level 3 inputs during fiscal 2014 and during fiscal 2013:
(in thousands) | Fiscal 2014 | Fiscal 2013 | ||||||
Beginning balance - Level 3 inputs | $ | 22,977 | $ | 23,720 | ||||
Sales | (20,569 | ) | (200 | ) | ||||
Realized gains/(losses) on sale of investments | (281 | ) | — | |||||
Net unrealized gains/(losses) included in other comprehensive income | 2,673 | (543 | ) | |||||
Ending Balance - Level 3 inputs | $ | 4,800 | $ | 22,977 | ||||
Additional Fair Value Disclosures
The estimated fair value of the Company's current and long-term debt was $530.4 million as of August 30, 2014, and $546.4 million as of August 31, 2013. The Company has both public notes and private placement notes. The fair value for the public notes is determined using Level 1 inputs as quoted prices in active markets for identical assets or liabilities are available. The fair value of the portion of the debt that are private placement notes is determined through the use of a discounted cash flow analysis using Level 3 inputs as there are no quoted prices in active markets for these notes. The discount rate used in the analysis was based on borrowing rates available to the Company for debt of the same remaining maturities, issued in the same private placement debt market. The fair value of the Company's current and long-term debt was greater than the carrying value
58
of the debt by $30.0 million as of August 30, 2014, and $29.9 million as of August 31, 2013. See Note 7 for more information on the Company's long-term debt.
4. Investment Securities:
The Company's investment securities are currently classified as available-for-sale as the Company does not intend to hold the securities to maturity and does not purchase the securities for the purpose of selling them to make a profit on short-term differences in price. Available-for-sale securities are carried at estimated fair value, with unrealized gains and losses, if any, reported as a component of Shareholders' Equity. The Company's investments consisted of the following available-for-sale securities at the end of fiscal 2014 and fiscal 2013:
August 30, 2014 | ||||||||||||||||||
(in thousands) | Amortized Cost | Gross Unrealized Holding Gains | Gross Unrealized Holding Losses | Fair Value | ||||||||||||||
Auction rate securities | $ | 4,800 | $ | — | $ | — | $ | 4,800 | ||||||||||
Short-term bond mutual fund | 4,000 | — | — | 4,000 | ||||||||||||||
Municipal debt securities | 34,355 | 43 | 34,398 | |||||||||||||||
August 31, 2013 | |||||||||||||||||||
(in thousands) | Amortized Cost | Gross Unrealized Holding Gains | Gross Unrealized Holding Losses | Fair Value | |||||||||||||||
Auction rate securities | $ | 25,650 | $ | — | $ | 2,673 | (1 | ) | $ | 22,977 | |||||||||
Short-term bond mutual fund | 4,000 | — | — | 4,000 | |||||||||||||||
Municipal debt securities | 54,954 | 101 | — | 55,055 | |||||||||||||||
(1) | The gross unrealized holding losses for fiscal 2013 was in a continuous unrealized loss position for 12 months or longer. |
As discussed in Note 3 above, subsequent to year-end all the Company's auction rate securities were sold at par. The contractual maturity for the $4.8 million security outstanding at August 30, 2014 was 26 years. The Company's other debt securities include primarily municipal bonds and have weighted average maturities of less than one year.
Proceeds from sales of investment securities available-for-sale during fiscal 2014 were $93.7 million, as compared to $45.7 million in fiscal 2013 and $334.9 million in fiscal 2012. No material gains or losses were realized on those sales for fiscal 2014, fiscal 2013, and fiscal 2012.
The Company also holds investments in mutual funds in connection with a deferred compensation plan for certain key management employees. These investments are classified as trading securities and are included, at fair value, in other assets on the Consolidated Balance Sheets. The Company records an offsetting deferred compensation liability in Other Liabilities. The fair value of the deferred compensation plan assets was $19.7 million as of the end of fiscal 2014 and $20.0 million as of the end of fiscal 2013. See Note 12 below for more information on the deferred compensation plan.
5. Prepayments and Other Current Assets:
Prepayments and Other Current Assets consisted of the following at the end of fiscal 2014 and fiscal 2013:
(in thousands) | August 30, 2014 | August 31, 2013 | ||||||
Vendor accounts receivable (net) | $ | 52,255 | $ | 70,579 | ||||
Prepaid rent | 50,570 | 45,684 | ||||||
Other(1) | 78,955 | 45,289 | ||||||
Total prepayments and other current assets | $ | 181,780 | $ | 161,552 | ||||
(1) | Other current assets consist primarily of accrued interest receivable, short-term insurance assets, non-vendor receivables, prepaid supplies, prepaid advertising, and other prepaid expenses. |
59
The Company performed an evaluation and recorded an allowance for doubtful accounts on all accounts receivable balances. The allowance for doubtful accounts was not material to the financial statements in fiscal 2014, fiscal 2013, or fiscal 2012.
6. Property and Equipment:
Property and equipment is recorded at cost and consisted of the following at the end of fiscal 2014 and fiscal 2013:
(in thousands) | August 30, 2014 | August 31, 2013 | ||||||
Buildings and building improvements | $ | 521,805 | $ | 567,133 | ||||
Furniture, fixtures, and equipment | 2,170,436 | 1,949,873 | ||||||
Transportation equipment | 105,839 | 93,963 | ||||||
Leasehold improvements | 594,338 | 552,218 | ||||||
Construction in progress | 87,499 | 131,793 | ||||||
3,479,917 | 3,294,980 | |||||||
Less: accumulated depreciation and amortization | 1,859,988 | 1,665,452 | ||||||
1,619,929 | 1,629,528 | |||||||
Land | 68,284 | 103,016 | ||||||
Property and equipment, net | $ | 1,688,213 | $ | 1,732,544 | ||||
Depreciation expense was $265.3 million, $238.9 million, and $204.5 million for fiscal 2014, fiscal 2013, and fiscal 2012, respectively. The increase in gross property and equipment, before depreciation, is not commensurate with capital expenditures as a result of the impairment recorded for 377 underperforming stores closed as part of the Company's strategic initiatives in fiscal 2014 and as a result of the significant amount of assets sold during the year under sale-leaseback transactions. Refer to Note 2 for further discussion of the store closure initiative and related impairment charges and to Note 8 for additional information on sale-leaseback transactions.
7. Current and Long-Term Debt:
Current and long-term debt consisted of the following at the end of fiscal 2014 and fiscal 2013:
(in thousands) | August 30, 2014 | August 31, 2013 | ||||||
5.24% Notes due September 27, 2015 | $ | 32,400 | $ | 48,600 | ||||
5.41% Notes due September 27, 2015 | 169,000 | 169,000 | ||||||
5.00% Notes due February 1, 2021 | 299,026 | 298,875 | ||||||
Total long-term debt | 500,426 | 516,475 | ||||||
Less: Current portion of long-term debt | 16,200 | 16,200 | ||||||
Long-term portion of long-term debt | $ | 484,226 | $ | 500,275 | ||||
On January 28, 2011, the Company issued $300 million of 5.00% unsecured senior notes due February 1, 2021 (the "2021 Notes"), through a public offering. The Company's proceeds were approximately $298.5 million, net of an issuance discount of $1.5 million. In addition, the Company incurred issuance costs of approximately $3.3 million. Both the discount and issuance costs are being amortized to interest expense over the term of the 2021 Notes. Interest on the 2021 Notes is payable semiannually in arrears on February 1 and August 1 of each year, commencing on August 1, 2011. The 2021 Notes rank pari passu in right of payment with the Company's other unsecured senior indebtedness and will be senior in right of payment to any subordinated indebtedness. The Company may redeem the 2021 Notes in whole at any time or in part from time to time, at the option of the Company, subject to a make-whole premium. In addition, upon the occurrence of certain change of control triggering events, the Company may be required to repurchase the 2021 Notes, at a price equal to 101% of their principal amount, plus accrued and unpaid interest to the date of repurchase.
On September 27, 2005, the Company obtained $250 million through a private placement of unsecured senior notes due September 27, 2015 (the "2015 Notes"), to a group of institutional accredited investors. The 2015 Notes were issued in two tranches at par and rank pari passu in right of payment with the Company's other unsecured senior indebtedness. The first tranche has an aggregate principal amount of $169 million, is payable in a single installment on September 27, 2015, and bears interest at a rate of 5.41% per annum from the date of issuance. The second tranche has an aggregate principal amount of $81 million, matures on September 27, 2015, with amortization which commenced on September 27, 2011, and bears interest at a rate of 5.24% per annum from the date of issuance. The second tranche had a required principal payment of $16.2 million on
60
September 27, 2011, and on each September 27 thereafter to and including September 27, 2015. The Company has made all required principal payments from September 2011 through September 2014. Interest on the 2015 Notes is payable semiannually in arrears on March 27 and September 27 of each year. The 2015 Notes contain certain restrictive financial covenants, which include a consolidated debt to consolidated total capitalization ratio, a fixed charge coverage ratio, and a priority debt to consolidated net worth ratio. As of August 30, 2014, the Company was in compliance with all such covenants.
On November 17, 2010, the Company amended the 2015 Notes to remove the subsidiary co-borrower and all subsidiary guarantors.
Credit Facilities
On November 13, 2013, the Company entered into a five-year unsecured revolving credit facility with a syndicate of lenders for borrowings of up to $600 million. The credit facility matures on November 13, 2018, and provides for two, one-year extensions that require lender consent. Any borrowings under the credit facility accrue interest at a variable rate based on short-term market interest rates.
On November 13, 2013, the Company entered into a four-year unsecured revolving credit facility with a syndicate of lenders for borrowings of up to $300 million. The credit facility matures on November 13, 2017, and provides for two, one-year extensions that require lender consent. Any borrowings under the credit facility accrue interest at a variable rate based on short-term market interest rates.
The revolving credit facilities provide the Company the capacity to borrow up to $900 million, less standby letters of credit needed for collateral for its insurance program of $18.7 million as of August 30, 2014. The prior unsecured revolving credit facilities provided the Company the capacity to borrow up to $700 million, less standby letters of credit needed for collateral for its insurance program of $18.8 million as of August 31, 2013.
The Company had no short-term borrowings outstanding under its unsecured revolving credit facilities as of August 30, 2014 or as of August 31, 2013. During fiscal 2014, the Company had no net borrowings and had an average daily outstanding balance of $214.8 million at a weighted-average interest rate of 1.4% under its unsecured revolving credit facilities. This compares to net repayments of $15.0 million and an average daily outstanding balance of $141.5 million at a weighted-average interest rate of 1.5% under the Company's unsecured revolving credit facilities during fiscal 2013.
The Company's unsecured revolving credit facilities contain certain restrictive financial covenants, which include a consolidated debt to consolidated capitalization ratio, a fixed charge coverage ratio, and a priority debt to consolidated net worth ratio. As of August 30, 2014, the Company was in compliance with all such covenants.
8. Build-to-Suit and Sale-Leaseback Transactions
The Company uses build-to-suit and sale-leaseback transactions to construct and lease new stores. In a build-to-suit transaction, an unrelated third-party funds the new store construction and owns the property throughout and upon completion of construction. In a sale-leaseback transaction, the Company funds the new store construction and owns the property throughout and upon completion of construction with the intent to sell the property. Upon completion of the stores' construction in build-to-suit transactions and concurrent with the sale of stores in sale-leaseback transactions, the Company enters into agreements to lease the properties over an initial term of 15 years, with four, five-year fixed renewal options. The Company evaluates each store individually upon certain events during the life of the lease, including individual renewal options. The Company classifies these leases as operating leases, actively uses the leased properties, and considers the leases as normal sale-leasebacks.
During fiscal 2014, the Company completed 356 build-to-suit transactions to support new store growth. Additionally, the Company completed sale-leaseback transactions under which it sold 159 stores to unrelated third-parties for net proceeds of approximately $194.8 million during fiscal 2014. Upon closing of the transactions, the Company realized a gain on the sale of the stores of $28.4 million, of which $1.1 million was recognized immediately and approximately $27.3 million was deferred and will amortize over the initial lease term.
During fiscal 2013, the Company completed 230 build-to-suit transactions. Additionally, the Company completed sale-leaseback transactions under which it sold 256 stores and 29 parcels of land to unrelated third-parties for net proceeds of approximately $345.2 million. Upon closing of the transactions, the Company realized a gain on the sale of the stores of $84.7 million, of which approximately $2.4 million was recognized immediately and approximately $82.3 million was deferred and will amortize over the initial lease term.
61
9. Accrued Liabilities:
Accrued liabilities consisted of the following at the end of fiscal 2014 and fiscal 2013:
(in thousands) | August 30, 2014 | August 31, 2013 | ||||||
Compensation | $ | 89,001 | $ | 101,199 | ||||
Taxes other than income taxes | 86,307 | 95,825 | ||||||
Liabilities for workers' compensation, general, and auto | 52,575 | 52,229 | ||||||
Lease obligations on closed stores - restructuring | 13,327 | — | ||||||
Merger fees accrual | 9,115 | — | ||||||
Other(1) | 84,729 | 86,601 | ||||||
Total accrued liabilities | $ | 335,054 | $ | 335,854 | ||||
(1) | Other accrued liabilities consist primarily of certain store rental accruals, current portion of deferred gain on sale-leaseback transactions, medical accruals, accrued interest, and litigation accruals. |
10. Other Liabilities:
Other liabilities consisted of the following at the end of fiscal 2014 and fiscal 2013:
(in thousands) | August 30, 2014 | August 31, 2013 | ||||||
Liabilities for workers' compensation, general, and auto | $ | 172,327 | $ | 179,930 | ||||
Deferred rent | 73,036 | 63,813 | ||||||
Lease obligations on closed stores - restructuring | 30,362 | — | ||||||
Other(1) | 40,657 | 45,451 | ||||||
Total other liabilities | $ | 316,382 | $ | 289,194 | ||||
(1) | Other liabilities consist primarily of income taxes and deferred compensation. |
11. Income Taxes:
The provisions for income taxes in fiscal 2014, fiscal 2013 and fiscal 2012 were as follows:
52 Weeks Ended | 53 Weeks Ended | 52 Weeks Ended | ||||||||||
(in thousands) | August 30, 2014 | August 31, 2013 | August 25, 2012 | |||||||||
Current: | ||||||||||||
Federal | $ | 141,274 | $ | 216,077 | $ | 228,245 | ||||||
State | 10,460 | 24,927 | 36,709 | |||||||||
Foreign | 641 | 2,425 | 1,065 | |||||||||
152,375 | 243,429 | 266,019 | ||||||||||
Deferred: | ||||||||||||
Federal | (13,277 | ) | 6,780 | (19,648 | ) | |||||||
State | (847 | ) | (3,087 | ) | (4,673 | ) | ||||||
Foreign | — | — | — | |||||||||
(14,124 | ) | 3,693 | (24,321 | ) | ||||||||
Total income taxes | $ | 138,251 | $ | 247,122 | $ | 241,698 | ||||||
The following table summarizes the components of income tax expense in fiscal 2014, fiscal 2013 and fiscal 2012:
62
52 Weeks Ended | 53 Weeks Ended | 52 Weeks Ended | |||||||||||||||||||
August 30, 2014 | August 31, 2013 | August 25, 2012 | |||||||||||||||||||
(in thousands) | Income tax expense | % of pre-tax income | Income tax expense | % of pre-tax income | Income tax expense | % of pre-tax income | |||||||||||||||
Computed federal income tax | $ | 147,964 | 35.0 | % | $ | 241,744 | 35.0 | % | $ | 232,378 | 35.0 | % | |||||||||
State income taxes, net of federal income tax benefit | 7,132 | 1.7 | 19,765 | 2.9 | 17,893 | 2.7 | |||||||||||||||
Tax credits | (10,805 | ) | (2.6 | ) | (12,281 | ) | (1.8 | ) | (9,810 | ) | (1.5 | ) | |||||||||
Foreign rate differences | (21,609 | ) | (5.1 | ) | (5,290 | ) | (0.8 | ) | (2,379 | ) | (0.4 | ) | |||||||||
Uncertain tax positions | (1,820 | ) | (0.4 | ) | 6,783 | 1.0 | 2,493 | 0.4 | |||||||||||||
Valuation allowance | 3,046 | 0.7 | (247 | ) | — | 1,732 | 0.3 | ||||||||||||||
Foreign income subject to U.S. tax | 15,262 | 3.6 | 2,622 | 0.4 | 1,351 | 0.2 | |||||||||||||||
Other | (919 | ) | (0.2 | ) | (5,974 | ) | (0.9 | ) | (1,960 | ) | (0.3 | ) | |||||||||
Actual income tax expense | $ | 138,251 | 32.7 | % | $ | 247,122 | 35.8 | % | $ | 241,698 | 36.4 | % | |||||||||
The tax effects of temporary differences that give rise to significant portions of the deferred tax assets and deferred tax liabilities as of the end of fiscal 2014 and the end of fiscal 2013, were as follows:
(in thousands) | August 30, 2014 | August 31, 2013 | ||||||
Deferred income tax liabilities: | ||||||||
Excess of book over tax basis of property and equipment | $ | 97,710 | $ | 101,865 | ||||
Deferred income tax assets: | ||||||||
Excess of tax over book basis of inventories | $ | 14,073 | $ | 25,436 | ||||
Nondeductible accruals for: | ||||||||
Insurance | 8,820 | 10,824 | ||||||
Compensation | 34,303 | 37,580 | ||||||
Net Operating Losses | 9,696 | 6,266 | ||||||
Deferred rent | 27,893 | 24,398 | ||||||
Litigation charge | 2,702 | 1,789 | ||||||
Restructuring charges | 28,849 | — | ||||||
Other | 10,430 | 12,547 | ||||||
Deferred income tax assets, gross | 136,766 | 118,840 | ||||||
Less: valuation allowance | (8,052 | ) | (5,483 | ) | ||||
Deferred tax assets, net of valuation allowance | $ | 128,714 | $ | 113,357 | ||||
The Company had state net operating loss carryforwards of $175.5 million as of August 30, 2014, and $145.4 million as of August 31, 2013, in various states. These carryforwards expire at different intervals up to fiscal year 2034. Management considers all available evidence in determining the likelihood that a deferred tax asset will not be realized. As a result, the Company increased the valuation allowances related to these state loss carryforwards. In regard to the pending merger with Dollar Tree, the Company does not believe there will be any material limitations on net operating losses.
The Company classifies accrued interest expense and penalties related to uncertain tax positions as a component of income tax expense. Interest and penalties reduced income tax expense by $1.0 million in fiscal 2014, increased income tax expense by $1.4 million in fiscal 2013, and reduced income tax expense by $0.6 million in fiscal 2012. The decrease in fiscal 2014 relates to changes in uncertain tax positions, as compared to changes in uncertain tax positions recorded during fiscal 2013 and decreases in uncertain tax positions recorded during fiscal 2012.
As of August 30, 2014, the Company had a liability related to uncertain tax positions of $24.7 million, including a gross unrecognized tax benefit of $19.8 million and accrued interest and penalties of $4.9 million. The related non-current deferred tax asset balance was $5.6 million as of August 30, 2014. If the Company were to prevail on all unrecognized tax benefits recorded, approximately $19.1 million of unrecognized tax benefits, including penalties and tax effected interest of
63
$4.9 million, would result in income tax benefits in the income statement of a future period. A reconciliation of the beginning and ending amount of total unrecognized tax benefits is as follows:
(in thousands) | Unrecognized Tax Benefit | Interest and Penalties | Total | |||||||||
Balance at August 27, 2011 | $ | 20,194 | $ | 6,077 | $ | 26,271 | ||||||
Increases related to prior year tax positions | 1,147 | 1,668 | 2,815 | |||||||||
Decreases related to prior year tax positions | (3,892 | ) | (1,427 | ) | (5,319 | ) | ||||||
Increases related to current year tax positions | 4,879 | 442 | 5,321 | |||||||||
Settlements during the period | (3,586 | ) | (1,350 | ) | (4,936 | ) | ||||||
Lapse of statute of limitations | (1,229 | ) | (549 | ) | (1,778 | ) | ||||||
Balance at August 25, 2012 | $ | 17,513 | $ | 4,861 | $ | 22,374 | ||||||
Increases related to prior year tax positions | 877 | 999 | 1,876 | |||||||||
Decreases related to prior year tax positions | (997 | ) | (11 | ) | (1,008 | ) | ||||||
Increases related to current year tax positions | 11,012 | 1,752 | 12,764 | |||||||||
Settlements during the period | (2,962 | ) | (1,064 | ) | (4,026 | ) | ||||||
Lapse of statute of limitations | (1,340 | ) | (477 | ) | (1,817 | ) | ||||||
Balance at August 31, 2013 | $ | 24,103 | $ | 6,060 | $ | 30,163 | ||||||
Increases related to prior year tax positions | 753 | 1,334 | 2,087 | |||||||||
Decreases related to prior year tax positions | (3,327 | ) | (209 | ) | (3,536 | ) | ||||||
Increases related to current year tax positions | 2,864 | 618 | 3,482 | |||||||||
Settlements during the period | (1,138 | ) | (802 | ) | (1,940 | ) | ||||||
Lapse of statute of limitations | (3,427 | ) | (2,100 | ) | (5,527 | ) | ||||||
Balance at August 30, 2014 | $ | 19,828 | $ | 4,901 | $ | 24,729 | ||||||
The Company is subject to U.S. federal income tax as well as income tax in multiple foreign, state, and local jurisdictions. As of August 30, 2014, the Company was subject to U.S. federal tax and foreign examinations for fiscal years ending subsequent to 2010. With few exceptions, the Company is subject to state and local income tax examinations for fiscal years ending subsequent to 2010.
The amount of future unrecognized tax positions may be reduced because the statute of limitations has expired or the tax position is resolved with the taxing authority. It is reasonably possible that during the next 12 months the unrecognized tax benefit may be reduced by a range of zero to $4.8 million due to settlements of audits by taxing authorities. Such unrecognized tax benefits relate primarily to state tax positions.
As of August 30, 2014, the Company has not provided tax on its cumulative undistributed earnings of foreign subsidiaries of approximately $35.4 million, because it is the Company's intention to reinvest these earnings indefinitely. The calculation of the unrecognized deferred tax liability related to these earnings is complex and the calculation is not practicable. If earnings were distributed, the Company would be subject to U.S. taxes and withholding taxes payable to various foreign governments. Based on the facts and circumstances at that time, the Company would determine whether a credit for foreign taxes already paid would be available to reduce or offset the U.S. tax liability. The Company anticipates the earnings of foreign subsidiaries will not be repatriated.
12. Employee Benefit Plans:
Incentive compensation plan
The Company has an incentive profit-sharing plan which allows for payments to certain employees and officers at an aggregate annual amount not to exceed 7% of the Company's consolidated income before income taxes and certain incentive compensation. Expenses under the profit-sharing plan were zero in fiscal 2014, $9.4 million in fiscal 2013, and $12.3 million in fiscal 2012.
Compensation deferral plans
The Company has a voluntary compensation deferral plan, under Section 401(k) of the Internal Revenue Code, available to eligible employees. At the discretion of the Board of Directors, the Company makes contributions to the plan which are
64
allocated to participants, and in which they become vested, in accordance with formulas and schedules defined by the plan. In fiscal 2013, the Company increased its match to up to 2.5% of participants' eligible compensation and in the fourth quarter of fiscal 2014, the Company increased its match to up to 4.0% of participant's eligible compensation. Company expenses for contributions to the plan were $8.0 million in fiscal 2014, $6.2 million in fiscal 2013, and $3.2 million in fiscal 2012, and are included in Selling General and Administrative expenses on the Consolidated Statements of Income.
The Company has a deferred compensation plan to provide certain key management employees the ability to defer a portion of their base compensation and bonuses. The plan is an unfunded nonqualified plan. The deferred amounts and earnings thereon are payable to participants, or designated beneficiaries, at either specified future dates, or upon separation from service or death. The Company does not make contributions to this plan or guarantee earnings.
13. Commitments and Contingencies:
Operating leases and other contractual obligations
The majority of the rental expense incurred by the Company relates to its stores and the majority of its stores are leased under agreements that generally have an initial term between five and fifteen years and provide for fixed rentals. Additionally, most of the Company's leases require additional payments based upon a percentage of sales, property taxes, insurance premiums, or common area maintenance charges. Rental expenses on all operating leases, both cancelable and non-cancelable, for fiscal 2014, fiscal 2013 and fiscal 2012 were as follows:
52 Weeks Ended | 53 Weeks Ended | 52 Weeks Ended | ||||||||||
(in thousands) | August 30, 2014 | August 31, 2013 | August 25, 2012 | |||||||||
Minimum rentals, net of sublease rentals(1) | $ | 626,044 | $ | 555,107 | $ | 481,871 | ||||||
Contingent rentals | 7,167 | 9,057 | 8,468 | |||||||||
Total | $ | 633,211 | $ | 564,164 | $ | 490,339 | ||||||
(1) Minimum rentals, net of sublease rentals have increased in fiscal 2014 and fiscal 2013 primarily as a result of the new stores opened during fiscal 2014 and fiscal 2013 and new leases as a result of stores opened under build-to-suit and sale-leaseback transactions.
Aggregate minimum annual rentals under operating leases as of August 30, 2014 are as follows:
(in thousands) | Minimum Rentals | |||
Fiscal 2015 | $ | 589,846 | ||
Fiscal 2016 | 553,859 | |||
Fiscal 2017 | 510,208 | |||
Fiscal 2018 | 460,031 | |||
Fiscal 2019 | 406,167 | |||
Thereafter | 1,718,767 | |||
Total minimum rentals | $ | 4,238,878 | ||
In addition to the minimum and contingent rentals shown above, the Company has obligations related to merchandise letters of credit, construction obligations, and minimum royalty payments. Merchandise letters of credit represent obligations due within the next year to suppliers for merchandise the Company has agreed to purchase. Construction obligations relate primarily to amounts due to developers for new store construction projects, which have yet to be completed. Minimum royalty payments are related to an exclusive agreement to sell certain branded merchandise. At the end of fiscal 2014, these additional obligations were $67.5 million, $41.5 million, and $0.7 million, respectively, and are payable in fiscal 2015.
Additionally, the Company has outstanding standby letters of credit (which are primarily renewed on an annual basis), of which the majority are used as surety for future premium and deductible payments to the Company's workers' compensation and general liability insurance carrier. The following table shows the Company's other commercial commitments as of August 30, 2014:
65
(in thousands) | Total Amounts Committed | |||
Standby letters of credit | $ | 48,695 | ||
Surety bonds | 49,256 | |||
Total | $ | 97,951 | ||
Pending Merger Commitments
The Dollar Tree merger agreement contains provisions that in the event of termination of the Dollar Tree merger agreement, Family Dollar may be required to pay to Dollar Tree its out-of-pocket expenses, not to exceed $90 million, if the merger agreement is terminated by either Dollar Tree or Family Dollar because Family Dollar fails to obtain the required stockholder approval at the Family Dollar stockholders' meeting (as it may be adjourned or postponed). In addition, Family Dollar may be required to pay a termination fee of $305 million, less any payment paid in respect of Dollar Tree's out-of-pocket expenses, under certain circumstances, including a change in the recommendation of the board of directors of Family Dollar or termination of the Dollar Tree merger agreement by Family Dollar to enter into an agreement for a "Company Superior Proposal" (as defined in the Dollar Tree merger agreement). As of August 30, 2014, no amount has been recorded in our Consolidated Financial Statements related to these provisions.
Litigation
The Company is engaged in a number of legal proceedings. The matters or groups of related matters discussed below, if decided adversely to the Company, or settled by the Company, individually or in the aggregate, may result in liability material to the Company's Consolidated Financial Statements.
North Carolina Multi-District Misclassification Litigation
Since 2001, the Company has been involved in a series of cases in which certain store managers ("Store Managers") have alleged they were improperly classified as exempt employees under the Fair Labor Standards Act ("FLSA"). Current and former Store Managers have filed lawsuits alleging the Company violated the FLSA and/or similar state laws, by classifying them as "exempt" employees who are not entitled to overtime compensation. The majority of the complaints also request recovery of overtime pay, liquidated damages, attorneys' fees, and court costs.
In April 2008, a Multi-District Litigation forum ("MDL") was created in the Western District of North Carolina, Charlotte Division ("NC Federal Court") to handle cases alleging FLSA violations against the Company. The first two of the MDL cases were Grace v. Family Dollar Stores, Inc. and Ward v. Family Dollar Stores, Inc., filed in May 2004 and June 2006, respectively. In each of these cases, the court entered orders finding the plaintiffs were not similarly situated and, therefore, neither nationwide notice nor collective treatment under the FLSA was appropriate. Since that time, the NC Federal Court has granted 60 summary judgments ruling Store Managers are properly classified as exempt from overtime.
Presently, there are a total of 10 named plaintiffs and/or opt-ins in the remaining cases in the MDL, for which the NC Federal Court has not decided the class certification or summary judgment issue. The Company cannot reasonably estimate the possible loss or range of loss that may result from these cases.
Wage and Hour Class Action Litigation
The Company is currently a defendant in four additional class action lawsuits in four states alleging Store Managers should be classified as non-exempt employees under various state laws. The plaintiffs in these cases seek recovery of overtime pay, liquidated damages, attorneys' fees, and court costs.
• | Farley, et al. v. Family Dollar Stores of Colorado, Inc., was filed in the United States District Court for the District of Colorado on February 7, 2012, seeking unpaid overtime compensation for a class of current and former Colorado Store Managers. On March 21, 2013, the Court granted the plaintiff's motion for class certification. Class notice was issued in June 2013 and class discovery concluded in January 2014. In May 2014, the parties preliminarily agreed to resolve the litigation for an amount not material to the Consolidated Financial Statements. On July 21, 2014, the Court granted preliminary approval of the settlement. The Court held the final approval hearing on October 24, 2014, and the parties currently await the Court's decision. |
66
• | Hegab v. Family Dollar Stores, Inc., was filed in the United States District Court for the District of New Jersey on March 3, 2011. The plaintiff is seeking unpaid overtime for himself and allegedly similarly situated current and former Store Managers under New Jersey law. The matter was administratively dismissed without prejudice. At the time of dismissal, no class had been certified. On January 14, 2014, the parties preliminarily agreed to resolve the litigation on a claims-made basis for an amount not material to the Consolidated Financial Statements. On June 6, 2014, the parties filed a Joint Motion for Preliminary Approval of the settlement with the Court. The Court preliminarily approved the settlement on October 3, 2014. |
• | Itterly v. Family Dollar Stores of Pennsylvania, Inc., which was formerly pending in the NC Federal Court, was remanded back to the United States District Court for the Eastern District of Pennsylvania on February 8, 2012. The plaintiffs are seeking unpaid overtime for a class of current and former Pennsylvania Store Managers whom the plaintiffs claim are not properly classified as exempt from overtime pay under Pennsylvania law. Discovery closed in June 2012. In August 2013, the Company filed summary judgment requesting the Court rule that Itterly was properly classified as exempt from overtime. The District Court granted the Company's motion on January 30, 2014, and the case is now dismissed. On February 1, 2014, the plaintiffs filed a Notice of Appeal with the Third Circuit Court of Appeals. On August 26, 2014, Plaintiff filed his appellant brief. The Company filed its appellee brief on October 14, 2014. |
• | Premo v. Family Dollar Stores of Massachusetts, Inc., was filed in Worcester County Superior Court in the State of Massachusetts for alleged violations of the Massachusetts overtime law on April 26, 2013. The plaintiffs are seeking unpaid overtime for a class of current and former Massachusetts Store Managers whom plaintiffs claim are not properly classified as exempt from overtime under Massachusetts law. The Company removed the case to federal district court in Massachusetts on May 28, 2013. The plaintiffs challenged the removal to federal court. On March 28, 2014, the court remanded the claim back to state court. On April 7, 2014, the Company filed an interlocutory petition for appellate relief from the remand decision to the United States Court of Appeals for the 1st Circuit and awaits the appellate court's ruling. In the interim, the Company filed its answer to the lawsuit on May 13, 2014. The Company currently awaits the Court's ruling on its motion. |
Considering, among other factors, that the Company has obtained multiple decisions ruling its Store Managers are properly classified as exempt from overtime, the Company cannot reasonably estimate the possible loss or range of loss that may result from these cases, except for Hegab and Farley, which are subject to preliminary settlements.
Gender Pay Litigation
Luanna Scott, et al. v. Family Dollar Stores, Inc.
On October 14, 2008, a complaint was filed in the U.S. District Court in Birmingham, Alabama captioned Scott, et al. v. Family Dollar Stores, Inc. alleging discriminatory pay practices with respect to the Company's female Store Managers. This case was pled as a putative class action or collective action under applicable statutes on behalf of all Family Dollar female Store Managers. The plaintiffs seek recovery of back pay, compensatory and punitive money damages, recovery of attorneys' fees, and equitable relief. The case was transferred to the United States District Court for the Western District of North Carolina in November 2008.
Presently, there are 48 named plaintiffs in the Scott case. On January 13, 2012, the trial court granted the Company's Motion to Strike the class allegations asserted in the complaint based in part upon the United States Supreme Court's ruling in Dukes v. Wal-Mart. The plaintiffs filed an appeal of the Court's dismissal of the class allegations to the United States Court of Appeals for the Fourth Circuit. On October 16, 2013, the Fourth Circuit Court of Appeals partially reversed the trial court's ruling. While the Fourth Circuit agreed the original Complaint should not proceed as a class action, it remanded the case and instructed the trial court to allow the amendment of the complaint, and then consider, based upon the amended complaint, whether the case should proceed as a class action. On November 14, 2013, the Fourth Circuit denied further en banc review of the decision. On January 24, 2014, the Company filed a Petition for Writ of Certiorari to the United States Supreme Court. On June 30, 2014 the United States Supreme Court denied further review of the Fourth Circuit's decision. The case is now back with the district court. On September 8, 2014, the district court entered a new Pretrial Order and Scheduling Plan and the parties will proceed with limited discovery pursuant to those Orders.
The Company has tendered the matter to its Employment Practices Liability Insurance ("EPLI") carrier for coverage under its EPLI policy. At this time, the Company expects the EPLI carrier will participate in any resolution of the case. The Company has exceeded its insurance retention and expects any additional legal fees and settlements will be paid by the EPLI carrier. No reserve is appropriate due to the status of the case.
67
Shareholder Litigation
Three putative class action lawsuits have been filed against Family Dollar, its directors, Dollar Tree and merger sub in the Delaware Court of Chancery: Shiva Y. Stein v. Family Dollar Stores, Inc., et al., C.A. No. 9985, filed on July 31, 2014, Darrell Wickert v. Family Dollar Stores, Inc., et al., C.A. No. 10025, filed on August 11, 2014, and Stuart Friedman v. Family Dollar Stores, Inc., et al., C.A. No. 10080, filed on September 3, 2014. On August 26, 2014, the Stein and Wickert actions were consolidated under the caption In re Family Dollar Stores, Inc. Stockholder, Litig., C.A. No. 9985-CB. On September 11, 2014, all three actions were consolidated under the caption In re Family Dollar Stores, Inc. Stockholder Litig., C.A. No. 9985-CB.
Each of the three actions has been brought on behalf of a putative class of Family Dollar's stockholders, and each alleges generally that the members of the Family Dollar board breached their fiduciary duties in connection with the merger by, among other things, carrying out a process that the plaintiff alleges did not ensure adequate and fair consideration to Family Dollar's stockholders. The plaintiffs further allege that Family Dollar and Dollar Tree aided and abetted the individual defendants' breaches of their fiduciary duties. The plaintiffs seek equitable relief to enjoin consummation of the merger, rescission of the merger and/or rescissory damages, and attorneys' fees and costs.
On August 28, 2014, the plaintiffs in the consolidated action filed motions for expedited proceedings and for a preliminary injunction enjoining the acquisition. On September 3, 2014, the plaintiffs in the consolidated action filed a motion for a temporary restraining order to require Family Dollar to terminate its rights agreement and to direct the Family Dollar board to deem the terms of Dollar General's proposal sufficient to warrant entering into negotiations with Dollar General under the terms of the Dollar Tree merger agreement. At a hearing on September 10, 2014, the Delaware Court of Chancery concluded that the temporary restraining order application did not merit scheduling a hearing to consider such relief, and declined to do so. At the same hearing, the Delaware Court of Chancery declined to then schedule a hearing on the plaintiffs' motion for a preliminary injunction, directed the parties to commence document discovery and denied the plaintiffs' request to commence the taking of depositions. The Company believes these lawsuits are without merit and intends to vigorously defend the claims in these actions. Due to the preliminary status, the Company cannot reasonably estimate the possible loss or range of loss that may result from these lawsuits.
Other Litigation
Winn-Dixie Stores, Inc., et al. v. Family Dollar Stores of Florida, Inc.
On March 5, 2014, the Company was served with a lawsuit entitled Winn-Dixie Stores, Inc., et al. v. Family Dollar Stores of Florida, Inc. in the Circuit Court for the Eleventh Judicial Circuit, in and for Miami-Dade County, Florida (the "Circuit Court"). In this lawsuit, Winn-Dixie Stores, Inc. ("Winn-Dixie") alleges that 57 Family Dollar stores are currently, or have previously been, co-located in a shopping center with a Winn-Dixie store and are violating, or have violated, certain restrictive covenants Winn-Dixie contends are binding on the occupants of the shopping centers. Winn-Dixie seeks damages and injunctive relief limiting the sale of food and other items sold in the Company's stores at issue in the lawsuit.
This case follows similar actions brought by Winn-Dixie against Dollar General Corporation, Dollar Tree, Inc., and Big Lots, Inc. The case against the Company is in the initial stages of litigation and the Company is evaluating Winn-Dixie's claims. The Company previously filed and prevailed on a Motion to Dismiss Winn-Dixie's Amended Complaint. Winn-Dixie filed a Second Amended Complaint on September 12, 2014. The Company is in the process of evaluating the Second Amended Complaint. Winn-Dixie has also filed a Motion for Temporary Injunction seeking to limit the Company's sale of food and other items in the stores at issue. The Circuit Court has not set a hearing date for the Motion for Temporary Injunction.
This case has been assigned a trial date of January 4, 2016. Due to the preliminary status, the Company cannot reasonably estimate the possible loss or range of loss that may result from this case.
Reginald Moore, et al. v. Family Dollar Stores, Inc.
On August 13, 2014, the Company was served with a putative class action petition entitled Reginald Moore, et al. v. Family Dollar Stores, Inc. in the Circuit Court of the City of St. Louis, Missouri. Mr. Moore contends that he, and others similarly situated, received SMS text message advertisements from the Company, without providing express written consent in violation of the Telephone Consumer Protection Act ("TCPA"). Mr. Moore has requested that the court enter an order certifying the action as a class action, and appointing him as representative of the class. Mr. Moore further seeks judgment in favor of himself, and the proposed class, for all damages available under the TCPA, including statutory damages of $500 per violation, or $1,500 per violation if the Company willfully violated the TCPA.
68
A Notice of Removal was filed on September 9, 2014, along with a Disclosure of Corporate Interest to remove the case from the Circuit Court of the City of St. Louis, Missouri, to the United States District Court for the Eastern District of Missouri, Eastern Division.
The case against the Company is in the initial stages of litigation and the Company is working to evaluate the allegations contained in the class action petition. Due to the preliminary status, the Company cannot reasonably estimate the possible loss or range of loss that may result from this case.
Other Matters
The Company is involved in numerous other legal proceedings and claims incidental to its business, including litigation related to alleged failures to comply with various state and federal employment laws, some of which are, or may be pled as class or collective actions, and litigation related to alleged personal or property injury damage, as to which the Company carries insurance coverage and/or has established accrued liabilities as set forth in the Company's Consolidated Financial Statements. While the ultimate outcome cannot be determined, the Company currently believes these proceedings and claims, both individually and in the aggregate, are not expected to have a material impact on the Company's Consolidated Financial Statements. However, the outcome of any litigation is inherently uncertain and, if decided adversely to the Company, or, if the Company determines settlement of such actions is appropriate, the Company may be subject to liability material to the Company's Consolidated Financial Statements.
14. Stock-Based Compensation:
The Family Dollar Stores, Inc. 2006 Incentive Plan (the "2006 Plan") permits the granting of a variety of compensatory award types. The Company currently grants non-qualified stock options and performance share rights under the 2006 Plan. Shares issued related to stock options and performance share rights represent new issuances of common stock. A total of 10.2 million common shares are reserved and available for issuance under the 2006 Plan, plus any shares awarded under the Company's previous plan (1989 Non-Qualified Stock Option Plan) that expired or were canceled or forfeited after the adoption of the 2006 Plan. As of August 30, 2014, there were 8.2 million shares remaining available for grant under the 2006 Plan. The Company also issues shares under the 2006 Plan in connection with director compensation. These shares are currently issued out of treasury stock and are not material.
The Company's results for fiscal 2014, fiscal 2013, and fiscal 2012 include stock-based compensation expense of $15.4 million, $16.3 million, and $15.9 million, respectively. These amounts are included within Selling, general and administrative expenses on the Consolidated Statements of Income. Tax benefits recognized in fiscal 2014, fiscal 2013, and fiscal 2012 for stock-based compensation totaled $5.9 million, $6.2 million, and $5.9 million, respectively.
Stock Options
The Company grants stock options to key employees at prices not less than the fair market value of the Company's common stock on the grant date. The Company's practice for a number of years has been to make a single annual grant to all employees participating in the stock option program and generally to make other grants only in connection with employment or promotions. Options expire five years from the grant date and are exercisable to the extent of 40% after the second anniversary of the grant and an additional 30% at each of the following two anniversary dates on a cumulative basis. Compensation cost is recognized on a straight-line basis, net of estimated forfeitures, over the requisite service period. The Company uses the Black-Scholes option-pricing model to estimate the grant-date fair value of each option. The fair values of options granted were estimated using the following weighted-average assumptions:
Years Ended | |||||||||
August 30, 2014 | August 31, 2013 | August 25, 2012 | |||||||
Expected dividend yield | 1.84 | % | 1.41 | % | 1.56 | % | |||
Expected stock price volatility | 27.6 | % | 33.2 | % | 34.50 | % | |||
Weighted average risk-free interest rate | 1.26 | % | 0.58 | % | 0.74 | % | |||
Expected life of options (years) | 4.48 | 4.39 | 4.39 | ||||||
The expected dividend yield is based on the projected annual dividend payment per share divided by the stock price on the grant date. Expected stock price volatility is derived from an analysis of the historical and implied volatility of the Company's
69
publicly traded stock. The risk-free interest rate is based on the U.S. Treasury rates on the grant date with maturity dates approximating the expected life of the option on the grant date. The expected life of the options is based on an analysis of historical and expected future exercise behavior, as well as certain demographic characteristics. These assumptions are evaluated and revised for future grants, as necessary, to reflect market conditions and experience. There were no significant changes made to the methodology used to determine the assumptions during fiscal 2014. The weighted-average grant-date fair value of stock options granted was $13.93 during fiscal 2014, $16.47 during fiscal 2013 and $13.10 during fiscal 2012.
The following table summarizes the transactions under the stock option plans during fiscal 2014:
Options Outstanding | Weighted- Average Exercise Price | Weighted-Average Remaining Contractual Life | Aggregate Intrinsic Value | ||||||||||
(in thousands) | (in dollars) | (in years) | (in thousands) | ||||||||||
Balance at August 31, 2013 | 1,664 | $ | 50.71 | ||||||||||
Granted | 684 | 68.66 | |||||||||||
Exercised | (523 | ) | 36.61 | ||||||||||
Forfeited | (251 | ) | 62.19 | ||||||||||
Expired | (2 | ) | 29.37 | ||||||||||
Balance at August 30, 2014 | 1,572 | $ | 61.38 | 3.01 | $ | 28,999 | |||||||
Exercisable at August 30, 2014 | 203 | $ | 46.64 | 1.40 | $ | 6,733 | |||||||
The total intrinsic value of stock options exercised was $16.9 million during fiscal 2014, $30.2 million during fiscal 2013, and $28.7 million during fiscal 2012. As of August 30, 2014, there was approximately $11.0 million of unrecognized compensation cost related to outstanding stock options. The unrecognized compensation cost will be recognized over a weighted-average period of 2.6 years.
Performance Share Rights
The Company grants performance share rights to key employees on an annual basis and in connection with employment or promotion. Performance share rights give employees the right to receive shares of the Company's common stock at a future date based on the Company's performance relative to a peer group. Performance is measured based on two pre-tax metrics: Return on Equity and Income Growth. The Leadership Development and Compensation Committee of the Board of Directors establishes the peer group and performance metrics. The performance share rights vest at the end of the performance period (generally 3 years) and the shares are issued shortly thereafter. The actual number of shares issued can range from 0% to 200% of the employee's target award depending on the Company's performance relative to the peer group.
The Company's performance share rights have a service condition and performance condition. The service condition is an explicit requisite service period that is known at grant date and is generally three years. The performance condition is the Company's performance against its peer group. In accordance with ASC 718, the Company values the performance share rights at the grant date based on the most probable outcome of payout and the most probable outcome is re-evaluated in each reporting period. As a result, the Company adjusts compensation cost throughout the term of the award to reflect its estimate of the most probable payout of shares. Upon vesting, the appropriate number of shares are issued and compensation cost reflects the total grant date fair value of those shares.
The following table summarizes the transactions under the performance share rights program during fiscal 2014:
(in thousands, except per share amounts) | Performance Share Rights Outstanding | Weighted Average Grant-Date Fair Value | |||||
Nonvested—August 31, 2013 | 421 | $ | 54.26 | ||||
Granted | 209 | 65.08 | |||||
Vested | (179 | ) | 46.84 | ||||
Cancellations | (77 | ) | 58.43 | ||||
Adjustments | 44 | N/A | |||||
Nonvested—August 30, 2014 | 418 | $ | 61.01 | ||||
70
The grant-date fair value of the performance share rights is based on the stock price on the grant date. The weighted-average grant-date fair value of performance share rights granted was $65.08 during fiscal 2014, $64.34 during fiscal 2013, and $52.42 during fiscal 2012. Compensation cost is recognized on a straight-line basis, net of estimated forfeitures, over the requisite service period and adjusted quarterly to reflect the ultimate number of shares expected to be issued. The performance adjustments of performance share rights outstanding in the table above represent the performance adjustment for shares vested during the period. The total fair value of performance share rights vested was $12.8 million during fiscal 2014, $16.4 million during fiscal 2013, and $22.4 million during fiscal 2012. As of August 30, 2014, there was approximately $10.8 million of unrecognized compensation cost related to outstanding performance share rights, based on the Company's most recent performance analysis. The unrecognized compensation cost will be recognized over a weighted-average period of 1.5 years.
15. Shareholders' Equity:
Stock Repurchases
During fiscal 2014, the Company purchased a total of 1.8 million shares of its common stock at a cost of $125.0 million. All shares are purchased pursuant to share repurchase authorizations approved by the Board of Directors. $70.8 million of the $125.0 million repurchases were from the Board grant announced on September 28, 2011, which depleted this share repurchase authorization. The remaining $54.2 million of repurchases were from the Board grant announced on January 17, 2013. A summary of the share repurchase activity for fiscal 2014 is as follows:
(in thousands) | ||||||||||||||||
Authorization Announced | Authorized Amount | Repurchases through Fiscal 2013 | Repurchases during Fiscal 2014 | Remaining Repurchase Authorization | ||||||||||||
September 28, 2011 | $ | 250,000 | $ | 179,209 | $ | 70,791 | $ | — | ||||||||
January 17, 2013 | 300,000 | — | 54,220 | 245,780 | ||||||||||||
Total | $ | 550,000 | $ | 179,209 | $ | 125,011 | $ | 245,780 | ||||||||
During fiscal 2013, the Company purchased a total of 1.2 million shares of its common stock at a cost of $75.0 million, all of which were purchased on the open market.
During fiscal 2012, the Company purchased a total of 3.2 million shares of its common stock at a cost of $191.6 million, all of which were purchased on the open market.
All shares were purchased pursuant to share repurchase authorizations approved by the Board of Directors. On September 28, 2011, the Company announced the Board of Directors authorized the Company to purchase up to $250 million of the Company's outstanding common stock. This authorization was depleted with shares repurchased during fiscal 2014. On January 17, 2013, the Company announced the Board of Directors authorized the Company to purchase up to an additional $300 million of the Company's outstanding common stock.
As of August 30, 2014, the Company had $245.8 million remaining under the current share repurchase authorization. There is no expiration date related to the active share repurchase authorization. Shares purchased under the share repurchase authorizations are generally held in treasury or are canceled and returned to the status of authorized but unissued shares.
Retirement of Treasury Shares
During fiscal 2012, the Company retired 29.4 million shares of its common stock held in treasury. The shares were returned to the status of authorized but unissued shares. As a result, the treasury stock balance decreased by approximately $1.2 billion. As a part of the retirement, the Company reduced its Common Stock, Capital in Excess of Par, and Retained Earnings balances by approximately $2.9 million, $60.1 million, and $1.1 billion, respectively. Refer to Note 1 for the Company's accounting policy for retirements of treasury shares.
Stockholders' Rights Plan
On June 8, 2014, the Company adopted a stockholders' rights plan whereby the Board of Directors authorized and declared a dividend distribution of one right for each outstanding share of common stock of the Company to the stockholders of record at the close of business on June 19, 2014. The rights are not presently exercisable and remain attached to the shares of common stock until the occurrence of certain triggering events. The rights will expire on June 8, 2015, unless exercised, redeemed or
71
exchanged prior that time. The Board of Directors may terminate the rights plan before the expiration date or extend the expiration date.
Dividends
During fiscal 2014, the Company paid cash dividends of $1.14 per share for a total of $130.1 million. During fiscal 2013, the Company paid cash dividends of $0.94 per share for a total of $108.3 million. During fiscal 2012, the Company paid cash dividends of $0.78 per share for a total of $91.4 million.
16. Net Income Per Common Share:
Basic net income per common share is computed by dividing net income by the weighted average number of shares outstanding during each period. Diluted net income per common share gives effect to all securities representing potential common shares that were dilutive and outstanding during the period. In the calculation of diluted net income per common share, the denominator includes the number of additional common shares that would have been outstanding if the Company's outstanding dilutive stock options and performance share rights had been exercised, as determined by the treasury stock method.
During the second quarter of fiscal 2014, the Company instituted an Employee Stock Purchase Plan which allows employees to purchase Company shares at a discount. Shares are purchased on a semi-annual basis with the Company's expense equal to 15% of the closing price on the date of purchase. The share-based payment expense is recognized on a straight-line basis over the six-month offering period. During the fourth quarter of fiscal 2014, a semi-annual share purchase occurred and these shares are included in basic net income per common share. As of August 30, 2014, the incremental potential shares that would be issuable, if the reporting date were the end of the offering period, were not material and were included in diluted net income per common share.
Certain stock options and performance share rights, which have been summarized in the table below, were excluded from the calculation of diluted net income per common share because their effects were antidilutive.
52 Weeks Ended | 53 Weeks Ended | 52 Weeks Ended | |||||||
(in thousands) | August 30, 2014 | August 31, 2013 | August 25, 2012 | ||||||
Antidilutive shares | 966 | 486 | 291 | ||||||
The following table sets forth the computation of basic and diluted net income per common share:
52 Weeks Ended | 53 Weeks Ended | 52 Weeks Ended | ||||||||||
(in thousands, except per share amounts) | August 30, 2014 | August 31, 2013 | August 25, 2012 | |||||||||
Basic Net Income Per Share: | ||||||||||||
Net income | $ | 284,503 | $ | 443,575 | $ | 422,240 | ||||||
Weighted average number of shares outstanding | 114,035 | 115,252 | 117,097 | |||||||||
Net income per common share—basic | $ | 2.49 | $ | 3.85 | $ | 3.61 | ||||||
Diluted Net Income Per Share: | ||||||||||||
Net income | $ | 284,503 | $ | 443,575 | $ | 422,240 | ||||||
Weighted average number of shares outstanding | 114,035 | 115,252 | 117,097 | |||||||||
Effect of dilutive securities | 386 | 553 | 961 | |||||||||
Weighted average shares—diluted | 114,421 | 115,805 | 118,058 | |||||||||
Net income per common share—diluted | $ | 2.49 | $ | 3.83 | $ | 3.58 | ||||||
17. Segment Information:
The Company operates a chain of more than 8,000 general merchandise retail discount stores in 46 states, serving the basic needs of customers primarily in the low- and middle-income brackets. The stores are supported by 11 distribution centers and one Store Support Center. All stores operate under the Family Dollar name and are substantially the same in terms of size,
72
merchandise, customers, distribution, and operations. The Company has no franchised locations or other lines of business. All the Company's operations are located in the United States with the exception of certain sourcing entities located in Asia and Europe. The foreign operations solely support domestic operations and are not material. The Company manages the business on the basis of one operating segment and therefore, has only one reportable segment. The following table presents net sales by classes of similar products.
52 Weeks Ended | 53 Weeks Ended | 52 Weeks Ended | ||||||||||
(in thousands) | August 30, 2014 | August 31, 2013 | August 25, 2012 | |||||||||
Classes of similar products: | ||||||||||||
Consumables | $ | 7,703,549 | $ | 7,523,289 | $ | 6,436,719 | ||||||
Home Products | 1,003,685 | 1,053,670 | 1,067,541 | |||||||||
Apparel and Accessories | 767,608 | 785,384 | 822,839 | |||||||||
Seasonal and Electronics | 1,014,488 | 1,029,114 | 1,003,906 | |||||||||
Net Sales | $ | 10,489,330 | $ | 10,391,457 | $ | 9,331,005 | ||||||
The following table describes the Company's product categories in more detail:
Consumables | Batteries |
Diapers | |
Food | |
Hardware and automotive supplies | |
Health and beauty aids | |
Household chemicals | |
Paper products | |
Pet food and supplies | |
Tobacco | |
Home Products | Domestics, including blankets, sheets and towels |
Giftware | |
Home décor | |
Housewares | |
Apparel and Accessories | Boys' and girls' clothing |
Fashion accessories | |
Infants' clothing | |
Men's clothing | |
Shoes | |
Women's clothing | |
Seasonal and Electronics | Personal electronics, including pre-paid cellular phones and services |
Seasonal goods | |
Stationery and school supplies | |
Toys | |
18. Unaudited Summaries of Quarterly Results:
73
13 Weeks Ended | 13 Weeks Ended | 13 Weeks Ended | 13 Weeks Ended | |||||||||||||
(in thousands, except per share amounts) | November 30, 2013 | March 1, 2014(2) | May 31, 2014(4) | August 31, 2014(3)(5) | ||||||||||||
Fiscal 2014 | ||||||||||||||||
Net sales | $ | 2,499,691 | $ | 2,716,621 | $ | 2,658,964 | $ | 2,614,054 | ||||||||
Gross profit(1) | 856,841 | 902,295 | 910,853 | 861,297 | ||||||||||||
Net income | 78,027 | 90,869 | 81,147 | 34,460 | ||||||||||||
Diluted net income per common share(1) | $ | 0.68 | $ | 0.80 | $ | 0.71 | $ | 0.30 | ||||||||
Fiscal 2013 | ||||||||||||||||
Net sales | $ | 2,421,688 | $ | 2,893,997 | $ | 2,573,506 | $ | 2,502,266 | ||||||||
Gross profit | 826,794 | 967,050 | 892,458 | 868,443 | ||||||||||||
Net income | 80,279 | 140,145 | 120,938 | 102,213 | ||||||||||||
Diluted net income per common share(1) | $ | 0.69 | $ | 1.21 | $ | 1.05 | $ | 0.88 | ||||||||
(1) | The sum of the quarterly figures may not equal the annual figures due to rounding. |
(2) | The second quarter of fiscal 2014 included 13 weeks, as compared to 14 weeks in the second quarter of fiscal 2013. The extra week in the second quarter of fiscal 2013 contributed approximately $189 million in net sales and $0.07 of diluted net income per common share. |
(3) | The fourth quarter of fiscal 2013 includes a $5.0 million favorable accounting adjustment to Gross profit related to certain vendor allowances. |
(4) | The third quarter of fiscal 2014 includes $24.5 million of restructuring charges, of which $1.5 million is classified in Cost of sales - restructuring and $23.0 million is classified in Restructuring on the Consolidated Statement of Income. A summary of restructuring charges is shown below. |
(5) | The fourth quarter of fiscal 2014 includes $65.6 million of restructuring charges, of which $10.4 million is classified in Cost of sales - restructuring and $55.2 million is classified in Restructuring on the Consolidated Statement of Income. A summary of restructuring charges is shown below. Additionally, $9.4 million of fees related to the pending merger with Dollar Tree are included in the fourth quarter of fiscal 2014. |
Restructuring Charges
(in thousands) | Classification of Charge | 13 Weeks Ended | 13 Weeks Ended | 52 Weeks Ended | |||||||||
Charge | May 31, 2014 | August 30, 2014 | August 30, 2014 | ||||||||||
Inventory write-downs | Non-cash | $ | 1,486 | $ | 10,444 | $ | 11,930 | ||||||
Cost of sales - restructuring | 1,486 | 10,444 | 11,930 | ||||||||||
Property and equipment impairments | Non-cash | 19,041 | 884 | 19,925 | |||||||||
Employee termination benefits | Cash | 3,842 | — | 3,842 | |||||||||
Lease obligations | Cash | — | 46,142 | 46,142 | |||||||||
Other | Cash | 113 | 8,158 | 8,271 | |||||||||
Restructuring | 22,996 | 55,184 | 78,180 | ||||||||||
Total restructuring charges | $ | 24,482 | $ | 65,628 | $ | 90,110 | |||||||
19. Related Party Transactions:
There were no material related party transactions during fiscal 2014, fiscal 2013 or fiscal 2012.
74
ITEM 9. CHANGES IN AND DISAGREEMENTS WITH ACCOUNTANTS ON ACCOUNTING AND FINANCIAL DISCLOSURE
None noted.
ITEM 9A. CONTROLS AND PROCEDURES
Disclosure Controls and Procedures
We maintain disclosure controls and procedures designed to provide reasonable assurance that information required to be disclosed in our periodic reports to the Securities and Exchange Commission ("SEC") is recorded, processed, summarized, and reported within the time periods specified in the SEC's rules and forms and such information is accumulated and communicated to management, including our Chief Executive Officer and Chief Financial Officer, as appropriate to allow timely decisions regarding required disclosures.
We evaluated the design and operating effectiveness of our disclosure controls and procedures as of August 30, 2014. This evaluation was performed under the supervision and with the participation of management, including our Chief Executive Officer and Chief Financial Officer. Based on this evaluation, the Chief Executive Officer and Chief Financial Officer concluded our disclosure controls and procedures were effective as of August 30, 2014.
Management's Report on Internal Control Over Financial Reporting
Management is responsible for establishing and maintaining adequate internal control over financial reporting for the Company. Internal control over financial reporting is a process designed to provide reasonable assurance regarding the reliability of financial reporting and the preparation of financial statements for external purposes in accordance with generally accepted accounting principles. Internal control over financial reporting includes those policies and procedures that:
i. | Pertain to the maintenance of records that in reasonable detail accurately and fairly reflect the transactions and dispositions of the assets of the Company; |
ii. | Provide reasonable assurance that transactions are recorded as necessary to permit preparation of financial statements in accordance with generally accepted accounting principles, and that receipts and expenditures of the Company are made only in accordance with authorizations of management and directors of the Company; and |
iii. | Provide reasonable assurance regarding prevention or timely detection of unauthorized acquisition, use, or disposition of the Company's assets that could have a material effect on the financial statements. |
Because of its inherent limitations, internal control over financial reporting may not prevent or detect misstatements. Also, projections of any evaluation of effectiveness to future periods are subject to the risk that controls may become inadequate because of changes in conditions or that the degree of compliance with the policies or procedures may deteriorate.
Management, with the participation of the principal executive officer and principal financial officer, conducted an evaluation of the effectiveness of the Company's internal control over financial reporting based on the framework in Internal Control—Integrated Framework [1992] issued by the Committee of Sponsoring Organizations of the Treadway Commission (COSO). Based on this evaluation, management concluded the Company's internal control over financial reporting was effective as of August 30, 2014.
PricewaterhouseCoopers LLP, the independent registered public accounting firm that audited the Consolidated Financial Statements included in this Report, has also audited the effectiveness of the Company's internal control over financial reporting as of August 30, 2014, as stated in their attestation report which is included under Item 8 of this Report.
Attestation Report of the Registered Public Accounting Firm
Included in Item 8 of this Report.
Changes in Internal Control over Financial Reporting
There were no changes in the Company's internal control over financial reporting during the Company's fourth fiscal quarter that have materially affected, or are reasonably likely to materially affect, the Company's internal control over financial reporting.
75
ITEM 9B. OTHER INFORMATION
None noted.
76
PART III
ITEM 10. DIRECTORS, EXECUTIVE OFFICERS AND CORPORATE GOVERNANCE
Executive Officers
The section entitled "Executive Officers of the Company" in Part I of this Report is incorporated by reference herein.
Directors
Following are the biographies for our directors, including information concerning the particular experience, qualifications, attributes, or skills that led the Nominating/Corporate Governance Committee and the Board to conclude that the nominee should serve on the Board. The Board of Directors has determined that each of the directors, other than Mr. Levine, is an independent director within the meaning of the NYSE listing standards and the categorical independence standards adopted by the Board, as set forth in our Corporate Governance Guidelines.
Biography | Qualifications to Serve on the Board of Directors | ||
 | Mark R. Bernstein, age 84, has served as a director of the Company since 1980. He is Of Counsel with the law firm of Parker, Poe, Adams & Bernstein L.L.P. Prior to his January 2002 retirement, he was Chairman of the law firm, Chairman of the Corporate Group and a partner in the firm. Mr. Bernstein previously served as a director of Rauch Industries, Inc., a manufacturer of Christmas ornaments, for more than a decade until its sale in 1996 and as a director of National Welders Supply Company, Inc., a welding gas distributor, for more than three decades until its sale in 2008. Mr. Bernstein also served as chairman of the North Carolina Economic Development Board from 1998 to 2000. Mr. Bernstein served as the Lead Director of our Board of Directors from 2004 to January 2013. Mr. Bernstein serves on our Nominating/Corporate Governance Committee. | Mr. Bernstein's qualifications to serve on the Board include his extensive legal and transactional experience as a corporate lawyer, his diverse and valuable financial and leadership experience gained as a director on several public and private corporate and non-profit boards in a variety of industries and fields, and his deep understanding of the Company's history and business. | |
 | Pamela L. Davies, age 57, has served as a director of the Company since 2009. Dr. Davies has been the president of Queens University of Charlotte since July 2002. Prior to assuming that role, Dr. Davies served as the Dean of the McColl School of Business at Queens University of Charlotte from 2000 to 2002 and the LeBow College of Business at Drexel University from 1997 to 2000. Her professional specialization is in the field of strategic planning with a particular emphasis on competitive and marketing strategy. Dr. Davies has also been a director of Sonoco Products Company since 2004 and previously served on the Board of Directors of C&D Technologies, Inc. from 1998 to 2010 and Charming Shoppes, Inc. from 1998 to June 2009. Dr. Davies serves as the Chairman of our Nominating/Corporate Governance Committee. | Dr. Davies' qualifications to serve on the Board include her extensive leadership experience and knowledge of strategic planning and marketing, as well as the valuable financial and industry experience gained as a director on several public company boards, including in the retail industry. | |
77
 | Sharon Allred Decker, age 57, has served as a director of the Company since 1999. Mrs. Decker has served as the Secretary of the North Carolina Department of Commerce since January 2013. She has been the Chief Executive Officer of The Tapestry Group, LLC, a faith based, non-profit consulting and communications firm, since September 2004. From April 2003 to August 2004, she was President of The Tanner Companies, a manufacturer and retailer of apparel. From August 1999 to March 2003, she was President of Doncaster, a division of The Tanner Companies. Doncaster is a direct sales organization selling a high-end line of women's apparel. Mrs. Decker has also been a director of Coca-Cola Bottling Co. Consolidated since 2001. She was a director of SCANA Corporation from 2005 to 2013. Mrs. Decker serves on our Leadership Development and Compensation Committee and our Nominating/Corporate Governance Committee. | Mrs. Decker's qualifications to serve on the Board include her executive leadership skills and understanding of strategic, operational and marketing issues facing large retail companies gained through her experience as an executive of retail industry companies. In addition, through her experience as a director on public and private company boards, she brings valuable financial and strategic experience to the Board. | |
 | Edward C. Dolby, age 69, has served as a director of the Company since 2003. He has been the President of The Edward C. Dolby Strategic Consulting Group, LLC since September 2002, when he established the company to engage in business consulting. Prior to his retirement in December 2001, Mr. Dolby was employed by Bank of America Corporation for 32 years, where his positions included President of the North Carolina and South Carolina Consumer and Commercial Bank. In addition, Mr. Dolby chaired Bank of America's Multicultural Marketing Leadership team and was an executive member of Bank of America's Consumer Bank Forum. Mr. Dolby was also a member of Bank of America's General Bank Executive Management Committee. Mr. Dolby serves on our Audit Committee and our Leadership Development and Compensation Committee. | Mr. Dolby's qualifications to serve on the Board include his financial, management and strategic acumen gained through his leadership roles in the banking and financial services industry coupled with his extensive retail banking background. His retail expertise augments his director qualifications. | |
 | Glenn A. Eisenberg, age 53, has served as a director of the Company since 2002. He is the Executive Vice President and Chief Financial Officer of Laboratory Corporation of America (LabCorp), a medical testing company, a position he has held since June 16, 2014. From January 2002 to March 2014, Mr. Eisenberg served as Executive Vice President--Finance and Administration of The Timken Company, an international manufacturer of highly engineered bearings and alloy steels and a provider of related products and services. From 1990 to 2001, Mr. Eisenberg was employed by United Dominion Industries, an international manufacturer of proprietary engineered products, where he held various positions, including President and Chief Operating Officer from December 1999 to May 2001. Mr. Eisenberg has also been a director of Alpha Natural Resources, Inc. since 2005. At Alpha Natural Resources, Mr. Eisenberg serves as its lead director and as Chairman of the Nominating and Corporate Governance Committee. Mr. Eisenberg serves as Chairman of our Audit Committee. | Mr. Eisenberg's qualifications to serve on the Board include his extensive global management, operational and financial knowledge and skills gained through his service as Executive Vice President—Finance and Administration of The Timken Company and in other senior executive capacities of global manufacturing firms. In addition, through his service as lead director and chairman of the committee of another public company, he brings valuable corporate governance and risk oversight experience. Further, the Board of Directors has determined that Mr. Eisenberg is an "audit committee financial expert," as defined by applicable rules of the SEC. | |
78
 | Edward P. Garden, age 53, has served as a director of the Company since September 2011. He has been Chief Investment Officer and a founding partner of Trian Fund Management, L.P. since November 2005. In addition, Mr. Garden has served as a member of the board of directors of The Wendy's Company since December 2004. From December 2004 to June 2007, Mr. Garden served as Vice Chairman and a director of Triarc, where he was also head of corporate development since August 2003. Prior to joining Triarc, Mr. Garden was a Managing Director of Credit Suisse First Boston, where he had served as a senior investment banker in the Financial Sponsors Group since 1999. From 1994 to 1999, he was a managing director at BT Alex Brown, where he was a senior member of the Financial Sponsors Group and, prior to that, Co-Head of Equity Capital Markets. From 1990 to 1994, Mr. Garden was Chief Executive Officer of All-American Brush Mfg. Corp. and prior to that was a Vice President at Drexel Burnham Lambert on the equity capital markets/syndicate desk. Mr. Garden serves on our Leadership Development and Compensation Committee. | Mr. Garden's qualifications to serve on the Board include his service as a director and senior executive of several public companies, his management of relationships with several large private equity firms, and his more than 25 years of experience in strategic advising, financing, operating, and investing in companies. During the past several years, Mr. Garden, as Chief Investment Officer of Trian Fund Management, L.P., has worked with management teams and boards of directors to implement operational improvements. Prior to that, Mr. Garden worked with financial sponsors, executing financings through the issuance of bank debt, corporate bonds and equity capital, and providing strategic advisory services. Mr. Garden has strong operating experience and a network of relationships with institutional investors and investment banking/capital markets advisors that he can utilize for the Company's benefit. | |
 | Howard R. Levine, age 55, has served as a director of the Company since 1997 and is our Chairman of the Board and Chief Executive Officer. He was employed by Family Dollar in various capacities in the Merchandising Department from 1981 to 1987, including employment as Senior Vice President—Merchandising and Advertising. From 1988 to 1992, Mr. Levine was President of Best Price Clothing Stores, Inc., a chain of ladies' apparel stores. From 1992 to April 1996, he was self-employed as an investment manager. He rejoined Family Dollar in April 1996, and was appointed Vice President-General Merchandise Manager: Softlines in April 1996; Senior Vice President-Merchandising and Advertising in September 1996; President and Chief Operating Officer in April 1997; Chief Executive Officer in August 1998; and Chairman of the Board in January 2003. Mr. Levine is the son of Leon Levine, the founder and former Chairman of the Board of the Company. Mr. Levine is the sole member of our Equity Award Committee. | Mr. Levine has extensive executive leadership experience in the retail industry, especially with small box retailers. As the Company's Chief Executive Officer for more than 15 years, Mr. Levine brings to the Board an in-depth understanding of all aspects of the Company, including its customers, operations and key business drivers. The Board of Directors believes that this experience and understanding, combined with more than 23 years of working for the Company in various capacities in store operations, distribution and merchandising, give him the qualifications, attributes and skills to serve as a director for the Company. | |
 | George R. Mahoney, Jr., age 71, has served as a director of the Company since 1987. He was employed by Family Dollar as General Counsel in 1976, as Vice President, General Counsel and Secretary from 1977 to 1984, as Senior Vice President, General Counsel and Secretary from 1984 to 1991 and as Executive Vice President, General Counsel and Secretary from 1991 until his retirement in May 2005. Mr. Mahoney serves on our Audit Committee. | Mr. Mahoney's qualifications to serve on the Board include his extensive experience in the areas of corporate law, finance, investor relations and human resources and his in-depth familiarity with the Company's history and business. | |
79
 | James G. Martin, age 78, has served as a director of the Company since 1996. He was employed by McGuireWoods Consulting as a Senior Advisor from July 2008 until his retirement in October 2011. He was employed by Carolinas HealthCare System in various executive roles, including Corporate Vice President, from January 1993 through March 2008. He served as Governor of the State of North Carolina from 1985 to 1993 and was a member of the United States House of Representatives, representing the Ninth District of North Carolina, from 1973 until 1984. Dr. Martin was a director of Palomar Medical Technologies, Inc. from 1997 until April 2013, a director of DesignLine Corporation from 2009 until 2012, and he was a Trustee of the North Carolina Capital Management Trust from 2000 until 2010. Dr. Martin was a director of aaiPharma Inc. from 1999 to 2007 and a director of Duke Energy Corporation from 1994 to 2006. Dr. Martin serves as Chairman of our Leadership Development and Compensation Committee. | Dr. Martin's qualifications to serve on the Board include his extensive leadership experience in both political and corporate settings, including his executive role as Governor of the State of North Carolina. In addition, Dr. Martin has developed valuable and diverse strategic and financial knowledge through his experience as a director on several public corporate and non-profit boards, including his experience as chairman of several committees of such boards. | |
 | Harvey Morgan, age 72, has served as a director of the Company since 2007. Mr. Morgan retired in December 2012 after serving for eight years as Managing Director with Bentley Associates, L.P., an investment banking firm. He has more than 40 years of investment banking experience with an emphasis in strategic advisory services, mergers and acquisitions, private placements and underwritings. From 2001 to 2004, he was a Principal of Shattuck Hammond Partners. Mr. Morgan also served as a director of Cybex International, Inc., from 2003 until 2013, a director of Burlington Coat Factory Warehouse Corporation from 1983 to 2005 and has also been a director of Cryolife, Inc. since 2008 and serves as chair of its Audit Committee. Mr. Morgan serves on our Audit Committee and Nominating/Corporate Governance Committee. | Mr. Morgan's qualifications to serve on the Board include his strategic and financial acumen developed through decades of experience in the investment banking industry, as well as his leadership and corporate governance experience gained as a director of public company boards, including in the retail industry. In addition, the Board of Directors has determined that Mr. Morgan is an "audit committee financial expert," as defined by applicable SEC rules. | |
 | Dale C. Pond, age 68, has served as a director of the Company since 2006. He retired in June 2005 as Senior Executive Vice President—Merchandising/Marketing after serving 12 years with Lowe's Companies, Inc., a home improvement retailer. Prior to joining Lowe's, he held a series of senior management positions at several retailers and home improvement companies including HQ/HomeQuarters Warehouse, Montgomery Ward and Payless Cashways, Inc. Mr. Pond has also been a director of Bassett Furniture Industries Inc. since 2002, where he serves as the Chairman of the Organization, Compensation and Nominating Committee. Mr. Pond served as a director of Scripps Networks Interactive, Inc., from 2008 until May 2012. Mr. Pond has served as the Lead Director of our Board of Directors since January 2013. | Mr. Pond's qualifications to serve on the Board include his demonstrated leadership and knowledge of financial, operational and strategic issues facing large retail companies gained through his executive leadership experience in the retail industry. In addition, through his years of service on the boards of several large companies, including as the chairman of the compensation and nominating committee of another public company, Mr. Pond is able to provide diverse and valuable finance, strategic and corporate governance experience to the Board. | |
SECTION 16(a) BENEFICIAL OWNERSHIP REPORTING COMPLIANCE
Section 16(a) of the Exchange Act requires our directors and executive officers and persons who own more than ten percent of our common stock (collectively, "Reporting Persons") to file with the SEC and NYSE initial reports of ownership and reports of changes in ownership of our common stock and to furnish us with copies of such reports. To our knowledge, which is based solely on a review of the copies of such reports furnished to us and written representations from Reporting Persons that no other reports were required, all Reporting Persons complied on a timely basis with all applicable filing requirements during
80
fiscal 2014, except that a Form 3 for Jason S. Reiser inadvertently omitted his stock option holdings, and was subsequently amended.
CODE OF ETHICS
We have adopted a code of ethics, the Code of Ethics for the Chief Executive Officer and Senior Financial Officers (the "CEO and Senior Financial Officers Code"), that applies to our principal executive officer, principal financial officer and other senior accounting officers. The CEO and Senior Financial Officers Code is posted on our website along with our Code of Business Conduct, which applies to all officers and Team Members, including the officers mentioned above. The Internet address for our website is www.familydollar.com, and the CEO and Senior Financial Officers Code of Business Conduct may be found from our main website page by clicking first on "Investor Relations," next on "Corporate Governance," and then on "Codes of Business Conduct and Ethics." We intend to satisfy any disclosure requirement under Item 5.05 of Form 8-K by posting to our website any amendment to or waiver of the CEO and Senior Financial Officers Code or Code of Business Conduct granted to our principal executive officer, principal financial officer, or other senior accounting officers.
AUDIT COMMITTEE
Pursuant to our Bylaws, the Board of Directors has established a standing Audit Committee composed of Messrs. Eisenberg (Chair), Dolby, Mahoney and Morgan. The Board of Directors has designated each of Messrs. Eisenberg and Morgan as an "audit committee financial expert," as defined by applicable SEC rules.
81
ITEM 11. EXECUTIVE COMPENSATION
DIRECTOR COMPENSATION
The Leadership Development and Compensation Committee annually reviews the Board's compensation structure, including a comparison of the compensation paid by the Company to its directors with the compensation paid by companies included in the peer group established pursuant to the Company's performance share rights program. For a discussion of this peer group, see "How does the Company select its peer group for the PSR program?" under the heading "Compensation Discussion and Analysis" in Part III of this Report. Based on this information and other factors such as Company performance, director recruitment and current director compensation, the Leadership Development and Compensation Committee makes recommendations to the Board for adjustments, where appropriate, in director compensation. Director compensation for fiscal 2014 was based on retainer amounts and meeting fees established in September 2013 as well as an annual directors' equity award of $90,000 set in September 2013, following advice from Hay Group, Inc., a compensation consultant to the Company and to the Leadership Development and Compensation Committee. The Leadership Development and Compensation Committee has determined that a mix of cash and equity compensation is appropriate for the directors, as further discussed below. Mr. Levine does not receive compensation for his services as a director or Chairman of the Board.
In fiscal 2014, the Company's directors (other than Mr. Levine) received an annual retainer of $60,000. The Chairman of each of the Nominating/Corporate Governance Committee and the Leadership Development and Compensation Committee received an additional annual retainer of $15,000, and the Chairman of the Audit Committee received an additional annual retainer of $20,000. Our Lead Director was paid an additional annual retainer of $15,000. All retainers are paid quarterly in arrears with a pro-rata portion paid for any partial quarter served. In addition, non-management directors were paid $1,500 for each meeting of the Board attended starting with the seventh meeting in the fiscal year and $1,000 for each committee meeting attended.
In addition to cash retainers and meeting fees, each of the non-management directors received an annual grant of our common stock in the amount of 1,389 shares with a value of $90,022 made on the day of the 2014 Annual Meeting in accordance with the terms of the Family Dollar Stores, Inc. 2006 Incentive Plan Directors' Share Awards Guidelines (the "Directors' Share Awards Guidelines"), which were adopted pursuant to the Family Dollar Stores, Inc. 2006 Incentive Plan (the "2006 Plan"). The grants were made upon the directors' re-election in January 2014. The Board of Directors believes the payment of a portion of the directors' fees in the form of an annual grant of shares of our common stock supports the alignment of the directors' interests with the interests of our stockholders. During the first five years of appointment to the Board of Directors, non-management directors are required to maintain a level of equity interest in Family Dollar equal to at least one-half of the cumulative number of shares of our common stock awarded for their service as directors since August 2005. Thereafter, a non-management director shall be required to maintain a level of equity interest equal to at least the greater of (i) one-half of such cumulative number of shares, or (ii) shares equal in value to three times the annual cash retainer for the director then in effect, excluding fees paid for committee chair of a committee or lead director service. We encourage, but do not require, that directors maintain an equity interest in Family Dollar in excess of such minimum amounts. Currently, all of our directors are in compliance with these minimum requirements.
We reimburse directors for all reasonable expenses incurred by them in connection with attendance at any meeting of the Board or its committees and for travel and other expenses incurred in connection with their duties as directors, which are not included in the table below.
82
The following table summarizes compensation we paid to non-employee directors in fiscal 2014.
Name | Fees Earned or Paid in Cash ($) | Stock Awards ($)(1) | Total ($) | |
Mark R. Bernstein | 80,000 | 90,022 | 170,022 | |
Pamela L. Davies | 95,000 | 90,022 | 185,022 | |
Sharon Allred Decker | 90,000 | 90,022 | 180,022 | |
Edward C. Dolby | 90,000 | 90,022 | 180,022 | |
Glenn A. Eisenberg | 111,000 | 90,022 | 201,022 | |
Edward P. Garden | 90,000 | 90,022 | 180,022 | |
George R. Mahoney, Jr. | 90,000 | 90,022 | 180,022 | |
James G. Martin | 100,000 | 90,022 | 190,022 | |
Harvey Morgan | 96,000 | 90,022 | 186,022 | |
Dale C. Pond | 90,000 | 90,022 | 180,022 | |
(1) | The amounts shown in this column indicate, for each director, the aggregate grant date fair value of stock awards granted in fiscal 2014, computed in accordance with Financial Accounting Standards Board Accounting Standards Codification Topic 718 Compensation-Stock Compensation ("FASB ASC Topic 718"). For the total number of shares of common stock held by each non-employee director as of October 15, 2014, see "Ownership of the Company's Securities" in Part III of this Report. |
COMPENSATION DISCUSSION AND ANALYSIS
Overview
This section sets forth the compensation programs and elements of compensation for our named executive officers ("NEOs"). Specifically, this Compensation Discussion and Analysis describes the objectives and features of our executive compensation programs, explains how we design our executive compensation programs and the reasons for such design, and shows how we allocate executive compensation to ensure that executives' interests are aligned with those of our stockholders. In fiscal 2014, our NEOs were:
• | Howard R. Levine - Chairman and Chief Executive Officer; |
• | Michael K. Bloom - President and Chief Operating Officer, until January 8, 2014; |
• | Mary A. Winston - Executive Vice President, Chief Financial Officer; |
• | Barry W. Sullivan - Executive Vice President, Store Operations; |
• | James C. Snyder, Jr. - Senior Vice President, General Counsel and Secretary; and |
• | Jason S. Reiser - Executive Vice President, Chief Merchandising Officer. |
Mr. Bloom separated from the Company on January 8, 2014.
Compensation for our NEOs and our Section 16 officers is reviewed and approved by the Leadership Development and Compensation Committee on an annual basis. The Leadership Development and Compensation Committee is also advised by management as to the compensation for all officers at the level of Senior Vice President. The Leadership Development and Compensation Committee approves our short-term and long-term compensation plans, as described below, which form the basis for all officer compensation packages.
83
Compensation Practices Highlights
Our compensation program is designed to drive and reward outstanding performance that benefits our stockholders. The Leadership Development and Compensation Committee has implemented compensation practices with this goal in mind, including:
• | a mix of cash and equity compensation and short-term and long-term compensation; |
• | a mix of performance measures in determining incentive compensation (including Company performance and comparison against peer group performance); |
• | a clawback policy applicable to annual cash bonuses; |
• | executive stock ownership requirements; |
• | no stock option repricings; |
• | "double trigger" equity vesting upon a change in control and termination without cause or for good reason unless the equity is not assumed by the acquirer or the employee is terminated without cause; and |
• | no golden parachute excise tax gross-ups. |
2014 Stockholder Vote on Executive Compensation
At the 2014 Annual Meeting of Stockholders, stockholders voted to approve, on a non-binding advisory basis, the compensation of the Company's named executive officers as described in the 2014 Proxy Statement, with 96.3% of the votes cast voting to approve the compensation. The Leadership Development and Compensation Committee was aware of the stockholders' prior approval of our executive compensation structure in its ongoing discussions about our compensation policies and structures. In addition, at the 2012 Annual Meeting, our stockholders expressed a preference that advisory votes on executive compensation occur every year, as recommended by our Board, a practice the Board has decided to implement.
Summary of Fiscal 2014
Refer to Part II, Item 7 of this Report for discussion of the Company's results for fiscal 2014.
Compensation Program Objectives and Components
Our compensation philosophy and the material elements of our executive compensation program did not change from fiscal 2013 to fiscal 2014. Although we make minor adjustments to our compensation programs from year to year, we believe consistency in our compensation philosophy and administration is an important attribute of our compensation program. We have not made significant adjustments to our compensation program since fiscal 2006 when we adopted our performance share rights program (as further described below) and our stockholders approved the Family Dollar Stores, Inc. 2006 Incentive Plan (the "2006 Plan" as further described below) at the 2006 Annual Meeting of Stockholders. At our 2011 Annual Meeting of Stockholders, our stockholders re-approved the performance measures for performance-based awards under the 2006 Plan. We have made some changes recently to our executive compensation program as described below in "NEO Compensation for Fiscal 2015."
What are the primary objectives of the Company's executive compensation programs?
The primary objectives of our executive compensation programs are to:
• | provide compensation packages competitive with those offered by our peers in the retail sector. By offering competitive compensation packages, we are better able to attract and retain talented executives who are capable of carrying out the objectives, goals and strategic initiatives established by the Board and executive management; |
• | align interests of our executives with those of stockholders by keeping a significant portion of NEO compensation "at risk" and linked to both our short-term and long-term financial success; and |
• | provide a total compensation program that drives individual contributions to our business results through a "pay-for-performance" compensation system. |
84
What elements of compensation does the Company provide to executives to meet the objectives of its compensation programs?
We provide the following forms of compensation to our NEOs in fiscal 2014:
• | base salary; |
• | annual cash bonus; |
• | performance-based share awards; |
• | stock options; |
• | select perquisites; |
• | severance and change in control benefits; |
• | 401(k) savings and deferred compensation plans; and |
• | health, life and disability insurance programs. |
85
Executive Compensation Program Design
What role do compensation consultants play in designing the Company's compensation programs?
The Leadership Development and Compensation Committee's goal is to establish total NEO compensation that promotes the objectives discussed above, and in particular at a level which is competitive enough to enable us to attract and retain talented executives. To assist with this analysis, the Leadership Development and Compensation Committee has engaged Hay Group, Inc. ("Hay Group") to analyze the appropriate level of compensation for each NEO's position and to provide appropriate "benchmarking" data (as discussed in greater detail below). For each NEO, Hay Group reviews the responsibilities assigned to his or her position, the knowledge and skills necessary to perform his or her job function, the importance of his or her role to the organization, and the scope of his or her business function. As part of its evaluation, Hay Group periodically interviews certain executives, reviews our organizational structure, and relies upon its collective retail consulting experience. Hay Group uses all of this information to analyze retail compensation market data and to ensure that each NEO's position is compared to the appropriate benchmarking data.
Hay Group also provides the Leadership Development and Compensation Committee with materials describing compensation trends in the retail industry and general "best practices." This allows the Leadership Development and Compensation Committee to review our pay practices against our peers in the U.S. marketplace (as described in more detail below). The total amount of fees paid to Hay Group for services to the Leadership Development and Compensation Committee for fiscal 2014 was approximately $122,213. In addition, the Leadership Development and Compensation Committee reimburses Hay Group for reasonable travel and business expenses. Hay Group received other fees from the Company for fiscal 2014 of approximately $75,818 for providing the Company with information on retail industry general compensation trends, stock option valuation services, benchmarking evaluations, and market updates for non-executive Team Members in our domestic and global locations. Additionally, in fiscal 2014, Hay Group provided consultation to Family Dollar on matters related to the pending merger with Dollar Tree in the amount of $22,026. The decision to engage Hay Group for services other than those provided to the Leadership Development and Compensation Committee was made by management and was reviewed and approved by the Leadership Development and Compensation Committee.
Additionally, the Leadership Development and Compensation Committee retained a second independent consultant, Steven Hall & Partners, to review compensation materials prepared by management and Hay Group. Steven Hall & Partners reviews recommended compensation amounts and levels and further advises the Leadership Development and Compensation Committee on compensation matters, including executive compensation trends and best practices. Unlike Hay Group, Steven Hall & Partners does not provide other advice or services to the Company and is hired by and takes direction solely from the Leadership Development and Compensation Committee.
The Leadership Development and Compensation Committee has reviewed the independence of Hay Group and Steven Hall & Partners in light of the independence factors of the NYSE listing standards. Neither the Company nor the Leadership Development and Compensation Committee believe that the work of Hay Group or Steven Hall & Partners in fiscal 2014 raised any conflict of interest. The Leadership Development and Compensation Committee's Charter grants it sole authority to select, retain and terminate compensation consultants, legal counsel and other advisors.
What role does management play in designing the Company's compensation programs?
The annual compensation review process for all corporate Team Members, including our NEOs, occurs at the end of each fiscal year. At that time, the CEO discusses the performance of each of the other NEOs with the Leadership Development and Compensation Committee. The Leadership Development and Compensation Committee receives the CEO's recommendations on the appropriate compensation packages for each NEO, together with benchmarking data for each NEO. The Leadership Development and Compensation Committee also considers "tally sheets" (described in more detail below) prepared by our Human Resources department.
As to the CEO's compensation, the CEO submits a self-evaluation to the Board, and each director completes an evaluation of the CEO. The evaluation results are compiled by the Lead Director and the Chair of the Leadership Development and Compensation Committee. The results are presented to the independent members of the Board and discussed during an executive session. The Leadership Development and Compensation Committee meets separately with Hay Group and then with Steven Hall & Partners to discuss the CEO's compensation package. The Chairman of the Leadership Development and Compensation Committee and the Lead Director then meet with the CEO to discuss his performance evaluation, compensation package and related market data.
What information is included in the "tally sheets" reviewed by the Leadership Development and Compensation Committee?
86
Tally sheets describe the total dollar value of each NEO's annual compensation for the past three years. The total dollar value includes salary, short-term and long-term incentive compensation (collectively "Total Direct Compensation"), and the costs we incur to provide various health and insurance benefits and perquisites to our NEOs. The tally sheets also describe each NEO's accumulated realized and unrealized stock option gains, any stock awards made under our performance share rights program, and the amounts our NEOs will receive if they leave the Company under various circumstances, such as retirement or termination in connection with a change in control. The Leadership Development and Compensation Committee's annual review of tally sheets helps the Leadership Development and Compensation Committee oversee the design of our executive compensation program by providing a more complete picture of the current and historical compensation of each NEO.
How does the Company use benchmarking data to help establish NEO Compensation?
Because one of our primary compensation objectives is to provide compensation packages competitive with those of our peers in the retail sector, benchmarking data is vital to help us establish NEO compensation.
Hay Group compares the pay levels of our NEOs to positions of similar responsibility and job scope at U.S. companies contained in Hay Group's All Retail Industry Database (the "Hay Retail Industry Database"). The Hay Retail Industry Database contains information on over 100 U.S. retail companies, including most of our direct competitors. The Hay Retail Industry Database is recognized as a leading compensation survey for the retail sector and contains a broad representation of the retail sector's pay practices. The list of companies that comprised the Hay Retail Industry Database when we established fiscal 2014 compensation packages for our NEOs is set forth in Appendix A located at the end of Item 11 in Part III of this Report.
Once Hay Group identifies positions comparable to those of our NEOs at companies within the Hay Retail Industry Database, it provides the Leadership Development and Compensation Committee with information about the total compensation packages for those comparable positions at other retail companies, as well as benchmarking data for each component of executive compensation. Hay Group also analyzes the mix of pay offered to our NEOs, comparing fixed and variable pay as well as short-term and long-term incentives. The CEO provides recommendations to the Leadership Development and Compensation Committee regarding NEO compensation, and the Leadership Development and Compensation Committee then determines base salary and target levels of annual short-term and long-term incentive awards for our NEOs after considering these recommendations together with the benchmarking data provided by Hay Group.
The Total Direct Compensation offered to each NEO, as well as the components of Total Direct Compensation, vary as a result of the differing job scopes and complexity of each role. These differences in job responsibilities are reflected in the compensation survey data for the retail industry provided by the Hay Group reviewed annually by the Leadership Development and Compensation Committee.
How does the Leadership Development and Compensation Committee determine the amounts of specific compensation elements?
We do not utilize a formula or pre-set methodology to allocate NEO compensation among the elements of Total Direct Compensation. However, the Leadership Development and Compensation Committee has generally targeted the Total Direct Compensation level of each NEO near the 50th percentile for similar positions at retail companies in the Hay Retail Industry Database and generally sets base salaries at or near the 50th percentile.
To determine the proper mix of compensation elements, the Leadership Development and Compensation Committee considers a number of subjective factors, including:
• | Current market practices. We compare both Total Direct Compensation and each element of our executives' compensation packages against the Hay Retail Industry Database, paying special attention to the compensation practices of our most direct competitors. We rely on our compensation consultants and our Human Resources managers to provide information about the compensation practices of our peers. We also look at our recent successes or failures in recruiting and retaining executives to help us establish compensation levels. |
• | Personal performance. We consider the recommendations of our CEO regarding the compensation of the other NEOs, including individual performance ratings and experience of the NEO, along with the CEO's view on compensation matters, when making compensation decisions at the end of each fiscal year. The Leadership Development and Compensation Committee has not established specific qualitative or quantitative guidelines, other than goals for overall Company performance pursuant to the incentive programs, to measure the personal performance of any NEO, with the exception of Mr. Snyder's Target Bonus opportunity, which may increase or decrease based on his individual performance rating, as described in the "Description of Plan Based Awards" section, elsewhere in this Annual Report. |
87
However, the Leadership Development and Compensation Committee may consider subjective personal performance criteria when establishing NEO compensation.
• | Balance. Our compensation program is intended to be balanced. We recognize the need to provide sufficient guaranteed short-term income to executives through base salary and benefits and also the need to balance that income with at-risk, performance-based short-term and longer-term financial rewards which promote achievement of our goals. Further, we believe that as an individual's level of responsibility and ability to contribute to our financial success increases, that individual's total compensation also should increase. Likewise, as an individual's total compensation increases, we believe the ratio of both equity to non-equity compensation and performance-based compensation to total compensation also should increase. |
• | Compensation best practices. We believe compensation decisions should be reasonable, understandable, responsible, and tied to the best interests of our stockholders. Therefore, we continuously monitor developments in executive compensation "best practices" to help us achieve our compensation objectives. |
The Leadership Development and Compensation Committee does not consider an executive's total equity ownership or gains from prior equity incentive awards in determining Total Direct Compensation.
88
Elements of Executive Compensation
What are the elements of the Company's executive compensation?
The compensation packages for our executives, including our NEOs, consist of base salary and short-term and long-term incentive programs which are designed to ensure that a substantial portion of an executive's compensation package is based on "pay for performance." As described below, the short-term incentive program provides for payment of an annual cash bonus if we achieve certain pre-tax earnings goals, while the long-term incentive programs provide for the issuance of stock awards (Performance Share Rights and stock options, as further discussed below) which vest or are earned over multi-year periods and the value of which is dependent upon our performance, including our market stock price. These programs are implemented pursuant to the terms of the stockholder approved 2006 Plan.
How does the Company set base salaries for its NEOs?
Initially upon hire or promotion, and then on an annual basis thereafter, the Leadership Development and Compensation Committee considers whether and to what extent adjustments to each NEO's base salary should be made. We determine the base salary ranges for our NEOs primarily by reviewing compensation surveys provided by Hay Group and the Leadership Development and Compensation Committee's consultants. Generally, we target our NEOs' base salaries at the 50th percentile of companies in the Hay Retail Industry Database. The Leadership Development and Compensation Committee believes that setting salaries lower than the median would prevent us from attracting and retaining top quality executive talent, while setting salaries at a higher level may over-compensate executives without regard to individual or company performance.
Once we determine the appropriate compensation ranges for our executives, we establish the specific salary for each NEO. To determine individual salaries, we consider each NEO's experience, his or her tenure with Family Dollar, his or her pay in comparison to our other officers, competitive information provided by the Leadership Development and Compensation Committee's consultants, and the NEO's contribution to our objectives. We also consider our operating performance and the NEO's specific contributions to our performance, when setting executive salaries.
The base salaries paid to our NEOs in fiscal 2014 are contained in the Summary Compensation Table in this Annual Report. Information with respect to our NEOs' fiscal 2015 compensation, including base salary levels, is set forth under the heading "NEO Compensation for Fiscal 2015" later in this discussion.
Analysis of fiscal 2014 NEO base salaries
We adjusted the base salaries paid to each NEO effective as of October 27, 2013, to reflect market conditions and in accordance with our practice described above. All salary adjustments also took into account the contributions of each NEO throughout fiscal 2013 as well the Company's overall performance.
• | Mr. Levine's base salary was increased by 4.6% in recognition of his role as Chief Executive Officer and to keep his base salary within an acceptable range of the Leadership Development and Compensation Committee's 50th percentile target in respect of similar positions at retail companies in the Hay Retail Industry Database for base salary. This adjustment was also made to maintain the Leadership Development and Compensation Committee's desired balance between base salary and long-term equity compensation. |
• | Mr. Bloom received a 5.7% increase to his base salary that positioned him within the Leadership Development and Compensation Committee's 50th percentile target in respect of similar positions at retail companies in the Hay Retail Industry Database for base salary. |
• | Ms. Winston's base salary was increased by 4.1% to maintain a competitive salary in her role as Executive Vice President, Chief Financial Officer in comparison to base salary for similar positions at retail companies in the Hay Retail Industry Database. |
• | Mr. Sullivan received an increase to his base salary of 4.8% that positioned his base salary within an acceptable range of the 50th percentile for similar positions at retail companies in the Hay Retail Industry Database. |
• | Mr. Snyder's base salary increase of 5.1% was in recognition for his contributions in fiscal 2013 and to maintain the Leadership Development and Compensation Committee's target for his base salary in respect of similar positions at retail companies in the Hay Retail Industry Database. |
• | Mr. Reiser received an increase of 6.7% in recognition of his promotion to the role of Executive Vice President, Chief Merchandising Officer. His increase put him within acceptable range of the 50th percentile for similar positions within the Hay Retail Industry Database. |
89
In fiscal 2014, the base salary for each NEO was at approximately the 50th percentile for similar positions at retail companies in the Hay Retail Industry Database.
Why does the Company award an annual cash bonus to executives, and how does the Company determine the amount of the annual cash bonus?
Pursuant to the Guidelines for Annual Cash Bonus Awards established under the 2006 Plan (the "Cash Bonus Award Guidelines"), we provide short-term annual cash incentive awards, in the form of an annual cash bonus to NEOs to drive our short-term performance goals for annual pre-tax earnings (i.e., income prior to the deduction of income taxes), as adjusted pursuant to the Cash Bonus Award Guidelines. The short-term incentive performance goals are derived from our strategic planning process. We use the procedures described above under the heading "Executive Compensation Program Design" to determine the appropriate annual target bonus for each executive. In addition, we may award one-time bonuses from time to time in order to assist in our recruitment or retention of executive officers.
For NEOs, annual target bonuses currently range from 40% to 120% of his or her annual base salary (the "Target Bonus"). Consistent with our pay-for-performance philosophy, we believe exemplary Company performance should be rewarded. Therefore, senior executives who have the most opportunity to impact our operating initiatives have a larger potential bonus than other participants in the program, so that their compensation is more closely tied to the achievement of our earnings goals. This provides our senior executives, including the NEOs, with powerful incentives to ensure we meet our performance goals. Annual bonus opportunities have a maximum payout equal to two times the Target Bonus.
Information regarding the annual cash bonus actually paid to our NEOs for fiscal 2014, fiscal 2013 and fiscal 2012 performance can be found in the Summary Compensation Table in this Report.
For fiscal 2014, Target Bonuses under the Cash Bonus Award Guidelines approved by the Leadership Development and Compensation Committee for the NEOs were as follows:
Name | Target Bonus |
Howard R. Levine | 120% of base salary |
Michael K. Bloom | 75% of base salary |
Mary A. Winston | 55% of base salary |
Barry W. Sullivan | 55% of base salary |
James C. Snyder, Jr. | 40% of base salary |
Jason S. Reiser | 55% of base salary |
Analysis of Fiscal 2014 Target Bonuses
The Target Bonus for each of our NEOs for fiscal 2014 either approximated the 50th percentile goal or was slightly below the 50th percentile for similar positions at retail companies in the Hay Retail Industry Database. However, as discussed below, no payout was made to any of our NEOs under the Cash Bonus Award Guidelines for fiscal 2014. Therefore, the actual short-term incentive component of the total compensation package for our NEOs was significantly below the median for retail companies in the Hay Retail Industry Database.
Analysis of Establishment of Pre-Tax Earnings Goal
Annual cash bonus awards are an important part of our compensation structure. The Leadership Development and Compensation Committee believes that establishing a target goal that requires a level of performance consistent with our earnings goal aligns the interests of our NEOs with those of our stockholders. The Leadership Development and Compensation Committee considers the Company's historical financial position, the economic environment, the financial performance of our competitors, and management's proposed fiscal financial plan when establishing performance targets based on financial goals. These targets are meant to ensure that our executives' total cash compensation is consistent with officers of our peer companies, if the Company's financial performance is consistent with those peers. For fiscal 2014, our pre-tax earnings target goal (as adjusted in accordance with the terms of the Cash Bonus Award Guidelines) was $744.9 million. As reflected in the chart below, our actual adjusted pre-tax earnings of $522.3 million for fiscal 2014 was below our minimum threshold for payout, resulting in a payout of 0% of each NEO's Target Bonus. See the table and discussion under the heading "Cash Bonus Awards" in this Report for more information on the calculation of bonus awards and minimum and maximum payout amounts.
90
The following chart sets forth the percentage of Target Bonus payout in relation to our pre-tax earnings target goals over the last ten fiscal years:
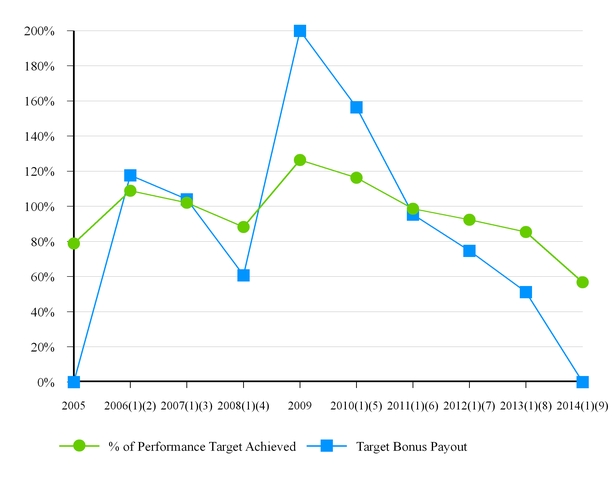
(1) | Pursuant to the 2006 Plan, the Leadership Development and Compensation Committee will adjust the calculation of pre-tax earnings under the Cash Bonus Award Guidelines to exclude unusual, non-recurring or other extraordinary items that may positively or negatively impact our pre-tax earnings. |
(2) | Excludes the impact of a $45 million litigation charge and a $10.5 million charge related to stock option expenses. See Notes 8 and 10 to the Consolidated Financial Statements in our fiscal 2006 Annual Report for a description of these charges. |
(3) | Excludes the impact of approximately $22 million in expenses and settlement costs related to our stockholder derivative litigation. See Note 8 to the Consolidated Financial Statements in our fiscal 2007 Annual Report, Note 10 to the Consolidated Financial Statements in our fiscal 2006 Annual Report, and our Current Report on Form 8-K filed with the SEC on June 26, 2007, for a description of this litigation and the related settlement. |
(4) | Excludes approximately $420,000 in expenses related to our stockholder derivative litigation and related matters. See Note 8 to the Consolidated Financial Statements in our fiscal 2007 Annual Report, Note 10 to the Consolidated Financial Statements in our fiscal 2006 Annual Report, and our Current Report on Form 8-K filed with the SEC on June 26, 2007, for a description of this litigation and the related settlement. |
(5) | Excludes an $8.5 million positive net impact related to a favorable insurance settlement. |
(6) | Excludes approximately $8.8 million in interest expense related to our issuance of public debt in January 2011. |
(7) | Excludes an $11.5 million litigation charge and approximately $3.3 million in legal fees. See Note 11 to the Consolidated Financial Statements in our fiscal 2012 Annual Report for a description of the litigation charge. |
91
(8) | Excludes a $3.0 million net impact related to accounting adjustments and litigation. See Note 12 to the Consolidated Financial Statements in our fiscal 2013 Annual Report for a description of our litigation. |
(9) | Excludes a $99.5 million restructuring and merger costs charge. See Note 2 to the Consolidated Financial Statements in this Annual Report for a description of those costs. |
Why does the Company provide long-term incentive awards to executives, and how does the Company determine the amount of those awards?
We believe a large portion of each NEO's compensation should be both performance-based and in the form of equity awards. Our long-term incentive awards are designed to align the interests of our executives with those of our stockholders. We currently provide two types of long-term incentive compensation: stock options and performance share rights ("PSRs"). PSR awards give recipients the right to be issued shares of our common stock, if we perform at a certain level as compared to a selected peer group of companies (the "Performance Peer Group") over the relevant performance period. These awards are made under the 2006 Plan. In fiscal 2014, we did not grant any restricted stock or restricted stock units that vest solely on the basis of service-based holding periods.
We use the procedures described above under the heading "Executive Compensation Program Design" to determine the appropriate total dollar value of long-term equity incentive compensation to award each NEO. We review this dollar value each year against the benchmarking data provided by Hay Group and may change it based on that benchmarking data, the NEO's performance, market conditions or each NEO's mix of total compensation. Once we establish the appropriate dollar value of long-term equity incentive compensation to be granted to each NEO in a particular fiscal year, it is divided equally between stock options and PSRs, using the value of an award of PSRs if performance were to be achieved at target.
Option and PSR awards are denominated in shares. The number of shares awarded is determined by dividing the total dollar value of long-term incentive compensation to be awarded to each NEO by a dollar value derived from the grant date fair value of our stock options and PSRs, each calculated in accordance with FASB ASC Topic 718.
Analysis of Long-Term Incentive Compensation
The target dollar value of the long-term incentive compensation granted to each NEO in fiscal 2014 was greater than the dollar value of the long-term incentive compensation granted to each NEO in fiscal 2013, with the exception of grants made to Ms. Winston and Mr. Sullivan, who received the same dollar value of the long-term incentive compensation granted to them in fiscal 2013. The increases made to the long-term incentive values for all other NEOs were in response to changing long-term incentive values in the marketplace and to be within acceptable range of the 50th percentile for similar positions at retail companies in the Hay Retail Industry Database.
We believe equally balancing long-term equity incentive compensation awards between stock options and PSRs results in long-term compensation that drives Company performance both in the stock market and against our Performance Peer Group. This mix of stock options and PSRs also reduces our historical dependence on stock options and supports our ongoing management of stockholder dilution by delivering the same value to executives using fewer shares. Assigning a dollar value to these grants helps the executive officers understand the true value of their equity compensation and also helps us to manage our compensation costs for each executive officer.
In fiscal 2014, the targeted performance-based long-term equity portion of each NEO's compensation was slightly above the 50th percentile for similar positions at retail companies in the Hay Retail Industry Database, with the exception of Mr. Levine. Mr. Levine's targeted performance-based long-term equity compensation was slightly below the 50th percentile for similar positions at retail companies in the Hay Retail Industry Database.
Information regarding the grant date fair value and the number of stock options and PSRs granted to our NEOs in fiscal 2014 can be found in the 2014 Grants of Plan-Based Awards Table in this Report. Information regarding each NEO's fiscal 2015 compensation, including their long-term equity incentive compensation granted, is set forth under the heading "NEO Compensation for Fiscal 2015" later in this discussion.
What is the purpose of the PSR program?
We believe the PSR program focuses our executives on financial performance factors critical to driving long-term value for our stockholders, while also recognizing the potential to achieve such performance is, in part, subject to various macroeconomic and other factors beyond the control of our officers. We believe measuring our performance in terms of pre-tax income growth
92
and average annual return on equity against other retail companies provides a pay-for-performance system that is appropriately competitive and rewarding. The awards of common stock under the PSR program reward our officers if our performance relative to the Performance Peer Group meets certain hurdles. While this program provides our executives with an opportunity to realize financial benefits anytime we outperform our competitors, it is especially impactful to our executives during periods when their stock options may have diminished in value as a result of factors affecting the equity markets or the entire retail channel. For a complete description of the terms of our PSR program, see the description of the program following the "2014 Grants of Plan-Based Awards" table in this Report.
How does the Company select its peer group for the PSR program?
The Leadership Development and Compensation Committee reviews and approves the Performance Peer Group annually, making adjustments as appropriate. Each year, Hay Group provides data on the Performance Peer Group companies to the Leadership Development and Compensation Committee. This data includes financial data as well as publicly-announced retail strategies for each company. Generally, members of the Performance Peer Group must:
• | be a retailer based in the United States and have equity that is publicly traded; |
• | have a customer base that is similar to that of the Company; |
• | have overlapping merchandise lines with the Company; and/or |
• | maintain a similar focus on real estate management. |
For the fiscal 2012 - 2014 performance period, our Performance Peer Group included the following companies: 99 Cent Only Stores, Advance Auto Parts Inc., Big Lots, Inc., Casey's General Stores, Inc., The Cato Corporation, Collective Brands, Inc., Dollar General Corporation, Dollar Tree Inc., Duckwall-ALCO Stores, Inc., Fred's Inc., Kohl's Corporation, Ross Stores, Inc., SuperValu Inc., Target Corporation, The Pantry, Inc., Walgreen Company and Wal-Mart Stores, Inc.
In September 2012, 99 Cent Only Stores and Collective Brands were removed from the Performance Peer Group as originally established for the foregoing performance period as they are no longer public companies.
For the fiscal 2013 - 2015 performance period, our Performance Peer Group includes the following companies: Advance Auto Parts Inc., Big Lots, Inc., Casey's General Stores, Inc., The Cato Corporation, Dollar General Corporation, Dollar Tree Inc., Duckwall-ALCO Stores, Inc., Fred's Inc., Kohl's Corporation, Ross Stores, Inc., SuperValu Inc., Target Corporation, The Pantry, Inc., Walgreen Company and Wal-Mart Stores, Inc.
In the fall of 2013, the Leadership Development and Compensation Committee reviewed recommendations from management and Hay Group for additional peer group companies that meet the criteria listed above and approved the addition of AutoZone and PetSmart to the Performance Peer Group.
For the fiscal 2014 - 2016 performance period, our Performance Peer Group includes the following companies: Advance Auto Parts Inc., ALCO Stores, Inc., Autozone, Inc. Big Lots, Inc., Casey's General Stores, Inc., The Cato Corporation, Dollar General Corporation, Dollar Tree Inc., Fred's Inc., Kohl's Corporation, PetSmart, Inc., Ross Stores, Inc., SuperValu Inc., Target Corporation, The Pantry, Inc., Walgreen Company and Wal-Mart Stores, Inc.
Why does the Company choose to make long-term equity incentive awards in the form of stock options?
Stock options are designed to reward NEOs for building long-term stockholder value, as represented by the price of our common stock. We award stock options because they provide value to our executives only if the price of our common stock appreciates from the grant date and the exercise date and the executive remains employed by the Company until the stock option vests (subject to certain retirement provisions, as further described below). Accordingly, stock option awards help us achieve the primary goals of our executive compensation program: to assist our retention efforts by encouraging our executives to remain employed by the Company for the full term of the stock option and to align the interests of our NEOs directly with the interests of our stockholders. For a description of the terms of our stock option program and awards, see the description of the program following the "2014 Grants of Plan-Based Awards" table in Part III of this Report.
When does the Company issue equity awards?
We have adopted a policy of making equity awards on pre-established dates to avoid any concern that grant dates have been selected based upon the release of material information about the Company. Annual equity awards for all eligible participants in our equity plans, including our NEOs, are presented to the Leadership Development and Compensation Committee for approval at a Leadership Development and Compensation Committee meeting scheduled for the first Tuesday after our fiscal
93
year-end earnings release. Equity awards are occasionally given to Team Members throughout the year in connection with new hires and/or promotions. For newly hired or promoted officers at or above the level of Vice President, equity awards are approved quarterly by the Leadership Development and Compensation Committee at a meeting held on the second Tuesday of the first month of each fiscal quarter. For newly hired or promoted Team Members below the level of Vice President, equity awards are approved by the Equity Award Committee on the first Tuesday following the Company's quarterly earnings release, or on the second Tuesday of each month of the National Retail Federation Retail Sales and Reporting and Merchandising Calendar, if the Company has not issued a quarterly earnings release in the week prior to the issuance of the award. The exercise price for all stock options is determined by the closing price of our common stock on the date the option grant is approved. The grant date for all equity awards is the date the awards are approved by the Leadership Development and Compensation Committee or the Equity Award Committee.
What perquisites does the Company offer to its executives?
NEOs (along with selected other executives) are offered executive supplemental disability insurance coverage and group disability insurance coverage paid for by the Company. In addition, selected executives, including NEOs, are provided the opportunity to have financial planning consultation with an outside investment adviser.
Pursuant to his employment agreement, Mr. Levine also is offered non-exclusive personal use of the Company's aircraft, subject to certain limits established by the Leadership Development and Compensation Committee each year and is provided with personal umbrella liability insurance coverage. For fiscal 2014, the Board approved Mr. Levine's personal use of the Company's aircraft for up to 70 hours, of which Mr. Levine used approximately 15.6 hours. Mr. Levine's personal use of the Company's aircraft is reviewed annually by the Leadership Development and Compensation Committee and is considered by the Leadership Development and Compensation Committee in setting Mr. Levine's Total Direct Compensation each year.
In fiscal 2014, the Leadership Development and Compensation Committee approved Mr. Bloom's non-exclusive personal use of the Company's aircraft for a maximum of up to 25 hours for fiscal 2014. Mr. Bloom's actual use of the Company's aircraft in fiscal 2014 totaled 1.5 hours.
We believe the perquisites offered by the Company are minimal in cost and necessary to attract and retain talented executives, as many of our competitors offer similar benefits. With the exception of Mr. Levine's use of the Company's aircraft, we do not offer NEOs any perquisites other than those benefits generally available to all of our Team Members, except as further described above and in Note 4 to the "Summary Compensation Table" in this Report.
Does the Company provide employment contracts to NEOs?
We currently have an employment agreement with Howard R. Levine, Chief Executive Officer and Chairman of the Board. Under his employment agreement, Mr. Levine is entitled to certain compensation and benefits and agrees to certain non-competition and other restrictive covenants. Presently, we do not have employment agreements with any other current executive officers. We have severance agreements with other executive officers, including the other NEOs, which contain non-competition and other restrictive covenants. Mr. Bloom, our former President and Chief Operating Officer, also has an employment agreement under which he became entitled to certain severance payments and benefits upon his separation from the Company and pursuant to which he is subject to certain post-employment restrictive covenants. For more information, see "Employment and Severance Agreements" and "Potential Payments upon Termination or Change in Control" in this Report.
Why does the Company offer severance benefits to its executives?
The Company believes it is necessary to offer severance benefits to our NEOs for several reasons. First, similarly-situated companies provide severance benefits to their executives, so providing these severance benefits is necessary for us to remain competitive and to attract and retain talented executives. Second, we believe it is in our best interest to ensure our executives will remain dedicated to the Company even if there is a threat or occurrence of a change in control and to reduce any distractions to our executives that might be caused by the uncertainties and risks created by a pending or threatened change in control. Finally, the Leadership Development and Compensation Committee determined it would be in our best interest to enter into severance agreements with our officers at the Vice President level and above, other than Mr. Levine who has an employment agreement, in consideration for such officers agreeing to be bound by certain non-compete, non-solicitation, non-disparagement and confidentiality provisions not previously applicable to them. We believe the non-compete and other covenants contained in these agreements are important tools in protecting the Company's future growth and prospects. In establishing these arrangements, the Leadership Development and Compensation Committee also considered the fact that the Company does not provide pension, supplemental executive retention plans, or any above-market or preferential earnings to its NEOs through the Company's deferred compensation plans.
94
The aforementioned employment and severance agreements with executives, as well as incentive opportunities under the 2006 Plan, require us to provide compensation or other benefits to NEOs when those individuals are terminated under certain circumstances or if there is a change in control of the Company. The type and amount of these payments vary by executive level and the reason for the termination. For a description of the terms of these arrangements, See "Employment and Severance Agreements" and "Potential Payments Upon Termination or Change in Control" in this Report.
The Leadership Development and Compensation Committee will periodically review these agreements to ensure that these purposes are being achieved and that the payments under such agreements are appropriate.
What type of retirement benefits does the Company provide to its executives?
Incentive Plan Retirement Provisions
The 2006 Plan contains provisions that allow eligible retirees to continue to exercise stock options after the date of their retirement. Specifically, these provisions provide that stock options held by qualifying retirees at the time of their retirement shall continue to vest and be exercisable until their expiration date in accordance with the terms of the 2006 Plan. In order to take advantage of this benefit, a participant must: (a) voluntarily terminate his or her employment, (b) at age sixty years or older, and (c) after a minimum of ten years of service to the Company. Additionally, retirees must agree to abide by certain non-competition and non-solicitation provisions for the term of the stock options.
Deferred Compensation Plan
The Family Dollar Compensation Deferral Plan (the "Deferred Compensation Plan") allows certain Team Members, including NEOs, to elect to defer receipt of up to 50% of their base salary and up to 75% of their bonus payments. The Company does not fund, make any contributions to, or provide any interest rate subsidy for the Deferred Compensation Plan. We provide this benefit to attract and retain talented executives, as most of our competitors provide a similar benefit to their executive officers. For a description of the material terms of the Deferred Compensation Plan, see "2014 Non-Qualified Deferred Compensation" in this Report.
401(k) Plan
We offer a 401(k) savings plan for all eligible Team Members, including the NEOs. For all of 2014, the Company provided a matching contribution to participant contributions. In July 2014, the Company enhanced the matching contribution to the following formula: The Company will provide a 100% match to the participant's first 3% of base salary and bonus contributions and a 50% match to the participant's next 2% of base salary and bonus contributions for a maximum Company contribution of 4% of base salary and bonus pay, subject to limits established by the plan and the Internal Revenue Code of 1986, as amended (the "Code").
Other Executive Officer Compensation Matters
Does the Company have stock ownership guidelines for its executives?
Yes, we have stock ownership guidelines for our NEOs and all other executives who hold the position of Vice President or above. Under the guidelines, those officers are required to achieve and maintain ownership of our common stock in an amount equal to a multiple of their annual base salary, as set forth below. An officer must achieve his or her required ownership requirement within six years of his or her promotion to his or her current officer level. Until an executive achieves those ownership goals, he or she is required to retain 25% of the net value (after the exercise price of any options and after applicable taxes) of any equity award in the Company's common stock. Our stock ownership guidelines provide for the following ownership levels:
Position | Stock Ownership Guidelines Multiple |
Chief Executive Officer | 6x annual base salary |
Executive Vice Presidents, Chief Financial Officer, Chief Operating Officer or President | 3x annual base salary |
Senior Vice Presidents | 2x annual base salary |
Vice Presidents | 1x annual base salary |
95
The following forms of equity interests are considered to determine whether an officer has satisfied the stock ownership requirements, based upon the highest market price of the Company's common stock within the past two years:
• | Stock owned directly by the officer, his or her spouse and/or children in his or her household; |
• | Stock held by the officer in the Company's Employee Stock Purchase Plan or other benefit plans; |
• | Stock held in trust for the benefit of the officer and/or his or her immediate family, which is considered to be beneficially owned by the officer; and |
• | The after-tax net value of vested unexercised stock options. To determine the after-tax net value under our stock ownership guidelines, we calculate the difference between the exercise price and the value of the stock, less taxes withheld at an assumed rate of 25%. |
These requirements ensure the interests of our executives and our stockholders are aligned and reduce incentives for excessive short-term risk taking. The Leadership Development and Compensation Committee annually reviews actual stock ownership of each of our executives and periodically reviews the ownership guidelines.
Does the Company have policies regarding transactions by officers in the Company's stock?
Yes, the Company has established an "insider trading" compliance policy that requires our directors, NEOs and certain other officers to obtain pre-clearance from our General Counsel for any transaction in the Company's common stock. The Company also publishes information on appropriate time periods for stock transactions and prohibits hedging transactions, short sales of the Company's common stock or the engagement of any trading in publicly-traded puts, calls, warrants, options or similar instruments relating to our common stock. In addition, prior written consent is required before pledging the Company's common stock.
Does the Company consider the tax consequences of executive compensation when designing compensation packages?
Yes. Among other things, the Company considers the following:
• | Deductibility. Section 162(m) of the Code ("Section 162(m)") provides that publicly held companies may not deduct compensation in excess of $1 million paid to the CEO or any of the three other highest paid executive officers (other than the CFO) in any taxable year if that income is not "performance-based," as defined in Section 162(m). Our stockholders have approved the 2006 Plan, which was designed to preserve the future deductibility of incentive compensation paid under the plan. We consider Section 162(m) when determining executive compensation packages, and we believe that all applicable executive officer incentive compensation paid in fiscal 2014 met the deductibility requirements of Section 162(m). |
• | FASB ASC Topic 718. We began accounting for share-based payments, including stock options and PSRs, pursuant to FASB ASC Topic 718 on August 28, 2005. |
• | Section 409A of the Code ("Section 409A"). All awards issued under the 2006 Plan are intended either not to be subject to or otherwise to comply with Section 409A. |
How does the Company establish compensation for other executive officers who are not NEOs?
Our CEO, with the assistance of other executive officers, reviews compensation materials to determine the compensation packages of Executive and Senior Vice Presidents who are not NEOs. These materials are similar to those reviewed by management and the Leadership Development and Compensation Committee when setting compensation for the NEOs. The CEO reviews proposed compensation packages with the Leadership Development and Compensation Committee and obtains approval for all equity grants made to officers at the level of Vice President or above. In addition, the Leadership Development and Compensation Committee approves compensation packages for any officers who are considered "executive officers" for purposes of Section 16 of the Securities Exchange Act of 1934, as amended (the "Exchange Act").
Do the Company's compensation programs reward or encourage executives to take excessive risks?
The design of our compensation programs encourages all Team Members, including NEOs to remain focused on both the short-term and long-term operational and financial goals of the Company. Because our compensation program is balanced and intended to drive our major operating initiatives as they change from time to time, our Team Members do not have an incentive to engage in risky behavior to achieve short-term financial results. Moreover, payouts under both annual cash bonuses and PSRs are capped at 200% of the target incentive opportunity. We do not believe the design of our compensation program
96
encourages our Team Members, including NEOs, to take risks that are new, unique or discrete from those associated with our overall business.
Does the Company have a "clawback" policy?
In the event we restate our financial results due to material non-compliance by the Company with any financial reporting requirements of the federal securities laws, as a result of intentional misconduct (as determined by the independent members of the Board under the Cash Bonus Award Guidelines), our executive officers are required to reimburse the Company the difference between (x) the amount of any cash bonus paid to the executive officer within the twelve months preceding such restatement and (y) the amount of the bonus such executive officer would have received had the amount of the bonus been calculated based on the restated financial statements.
Does the Company have any other equity plans?
We adopted, and our stockholders approved, a tax-qualified employee stock purchase plan in which all Team Members (including our named executive officers other than Mr. Levine) are eligible to participate, effective January 1, 2014 (the "Employee Stock Purchase Plan"). For further information regarding the plan, please see Note 16 of this Report.
NEO Compensation for Fiscal 2015
As reported in our Current Report on Form 8-K filed with the SEC on October 16, 2014, the Leadership Development and Compensation Committee approved fiscal 2015 compensation packages for our current senior executives at its meeting on October 14, 2014, as follows:
Name | Fiscal 2015 | Target Bonus Percentage of Base Salary | Stock Options | Restricted Stock Units (RSUs) for Fiscal 2015 - Fiscal 2017 Period | |||
Base Salary(1) | |||||||
Howard R. Levine | $1,185,000 | 120 | % | 78,095 | 26,648 | ||
Mary A. Winston | $520,000 | 55 | % | 10,280 | 3,507 | ||
Barry W. Sullivan | $455,000 | 55 | % | 8,225 | 2,806 | ||
James C. Snyder, Jr. | $435,000 | 40 | % | 4,935 | 1,684 | ||
Jason S. Reiser | $420,000 | 55 | % | 8,225 | 2,806 | ||
(1) Increases to base salaries were effective October 26, 2014.
In considering the establishment of fiscal 2015 compensation packages for the NEOs, the Leadership Development and Compensation Committee followed the process described above under "Executive Compensation Program Design" and "Elements of Executive Compensation." However, given the pending merger with Dollar Tree, the Leadership Development and Compensation Committee determined to grant service-based restricted stock units ("RSUs") in lieu of Performance Share Rights. It believes the RSUs will align Team Members to shareholders, provide necessary retention and focus Team Members on maintaining the Company's course during the pre-closing period. In order to protect the Company in the event the merger does not close, the RSUs continue to have the long-term drive of the Performance Shares Units by vesting 100% on the third anniversary of the grant date, subject to continued employment. In addition, in order to align the Company with market practice, the Leadership Development and Compensation Committee determined that options granted in fiscal 2015 will have a term of ten rather than five years.
The Target Bonuses set forth above for fiscal 2015 were maintained at the same level as those set for fiscal 2014. The dollar value of long-term incentive compensation for each of the NEOs was maintained at the same level as the previous year. The dollar value of long-term incentive compensation is divided equally among RSUs and stock options. For a further discussion of the Company's philosophy and process for establishing the Target Bonus and long-term incentive compensation levels, see the discussion of these matters set forth above.
As described in our Current Report on Form 8-K filed with the SEC on October 7, 2014, the Leadership and Development Compensation Committee also granted cash retention awards to certain eligible Team Members, including Ms. Winston ($200,000) and Messrs. Sullivan ($200,000), Snyder ($150,000) and Reiser ($200,000), but not Mr. Levine, on October 1, 2014. The awards will be earned on December 1, 2015, subject to continued employment through that date and certain performance conditions, or upon earlier termination of employment without cause (as set forth in the retention award program).
97
Summary
The CEO, the Company's Human Resources department and the Leadership Development and Compensation Committee, with advice from its consultants, have reviewed all components of each NEO's compensation, including base salary, Target Bonus and long-term equity incentive compensation. We have determined the compensation packages awarded to our NEOs are consistent with our goals to provide compensation competitive with the compensation offered to similar positions at retail companies in the Hay Retail Industry Database, to drive the Company's financial performance, and to align the interests of our NEOs with our stockholders. Accordingly, we believe our compensation programs are reasonable, competitive and not excessive.
COMPENSATION COMMITTEE REPORT
The Leadership Development and Compensation Committee of the Board of Directors has reviewed and discussed the above section titled "Compensation Discussion and Analysis" with management, and, based on such review and discussions, recommended that the section be included in this Annual Report on Form 10-K for fiscal 2014.
This report is submitted by James G. Martin, Chairman, Sharon Allred Decker, Edward C. Dolby, and Edward P. Garden as the members of the Leadership Development and Compensation Committee.
98
2014 SUMMARY COMPENSATION TABLE
The following table sets forth information concerning the compensation earned during fiscal 2014, fiscal 2013 and fiscal 2012 by the NEOs to the extent required by SEC regulations.
Name and Principal Position | Year | Salary ($)(1) | Bonus ($) | Stock Awards ($)(2) | Option Awards ($)(3) | Non-Equity Incentive Plan Compensation ($)(1) | All Other Compensation ($)(4) | Total ($) | |||||||||
Howard R. Levine | 2014 | 1,142,299 | — | 2,129,973 | 1,613,660 | — | (5) | 51,475 | (6) | 4,937,407 | |||||||
Chairman of the Board and Chief Executive Officer | 2013 | 1,115,046 | — | 1,953,291 | 1,650,621 | 686,336 | (7) | 47,283 | 5,452,577 | ||||||||
2012 | 1,051,346 | — | 1,721,723 | 1,464,998 | 942,006 | (8) | 47,175 | 5,227,248 | |||||||||
Michael K. Bloom | 2014 | 258,538 | — | 728,691 | 552,081 | — | (5) | 545,422 | (9) | 2,084,732 | |||||||
Former President and Chief Operating Officer* | 2013 | 707,403 | — | 725,502 | 613,121 | 272,017 | (7) | 113,361 | 2,431,404 | ||||||||
2012 | 598,365 | — | 1,951,317 | 585,986 | 335,085 | (8) | 100,155 | 3,570,908 | |||||||||
Mary A. Winston | 2014 | 501,919 | — | 280,298 | 212,344 | — | (5) | 47,915 | (10) | 1,042,476 | |||||||
Executive Vice President - Chief Financial Officer | 2013 | 492,959 | — | 279,071 | 235,803 | 131,071 | (7) | 160,325 | 1,299,229 | ||||||||
2012 | 155,289 | 115,000 | 478,170 | 208,706 | 85,408 | (8) | 49,679 | 1,092,252 | |||||||||
Barry W. Sullivan(11) | 2014 | 437,924 | — | 224,266 | 169,903 | — | (5) | 19,703 | 851,796 | ||||||||
Executive Vice President - Store Operations | 2013 | 425,095 | — | 223,284 | 188,659 | 119,635 | (7) | 8,992 | 965,665 | ||||||||
2012 | — | — | — | — | — | — | — | ||||||||||
James C. Snyder, Jr.(11) | 2014 | 411,922 | — | 134,532 | 101,928 | — | (5) | 10,991 | 659,373 | ||||||||
Senior Vice President - General Counsel and Secretary | 2013 | 400,437 | — | 122,786 | 103,750 | 87,229 | (7) | 13,441 | 727,643 | ||||||||
2012 | — | — | — | — | — | — | — | ||||||||||
Jason S. Reiser(12) | 2014 | 387,209 | — | 542,337 | 236,555 | — | (5) | 83,855 | (13) | 1,249,956 | |||||||
Executive Vice President - Chief Merchandising Officer | 2013 | — | — | — | — | — | — | — | |||||||||
2012 | — | — | — | — | — | — | — | ||||||||||
*Mr. Bloom separated from the Company on January 8, 2014.
(1) | Includes amounts deferred by certain of the NEOs pursuant to the Deferred Compensation Plan. See "2014 Non-Qualified Deferred Compensation" in this Annual Report. |
(2) | The amounts shown in this column indicate the aggregate grant date fair value of PSRs awarded in fiscal 2014, fiscal 2013 and fiscal 2012 computed in accordance with FASB ASC Topic 718, based upon the probable outcome of their performance conditions but excluding the effect of estimated forfeitures. See Note 12 to the Consolidated Financial Statements included in our fiscal 2012 Annual Report, Note 13 to the Consolidated Financial Statements included in our fiscal 2013 Annual Report and Note 14 to the Consolidated Financial Statements included in Part II of this Report for a discussion of the relevant assumptions made in these valuations. For a description of the PSR awards granted to our NEOs in fiscal 2014, see the discussion under "2014 Grants of Plan-Based Awards" in this Annual Report. The value of PSRs awarded to our NEOs at the grant date assuming that the maximum level would be achieved for each fiscal year is as follows: |
99
Name | 2014 ($) | 2013 ($) | 2012 ($) | ||||||
Howard R. Levine | 4,259,945 | 3,906,581 | 3,443,445 | ||||||
Michael K. Bloom | 1,457,382 | 1,451,004 | 3,902,633 | ||||||
Mary A. Winston | 560,595 | 558,141 | 956,340 | ||||||
Barry W. Sullivan | 448,531 | 446,567 | — | ||||||
James C. Snyder, Jr. | 269,064 | 245,571 | — | ||||||
Jason S. Reiser | 1,084,674 | — | — | ||||||
(3) | The amounts shown in this column indicate the aggregate grant date fair value for stock option awards in fiscal 2014, 2013 and 2012 computed in accordance with FASB ASC Topic 718. See Note 12 to the Consolidated Financial Statements included in our fiscal 2012 Annual Report, Note 13 to the Consolidated Financial Statements included in our fiscal 2013 Annual Report and Note 13 to the Consolidated Financial Statements included in our fiscal 2014 Annual Report for a discussion of the relevant assumptions made in these valuations. For a description of the stock option awards granted to our NEOs in fiscal 2014, see the discussion under "2014 Grants of Plan-Based Awards" in this Report. |
(4) | All Other Compensation for fiscal 2014 includes insurance premiums paid in the following amounts: (i) $33 for short-term disability insurance coverage for each NEO, except Mr. Bloom, who received $14 for short-term disability coverage; and (ii) $2,830 for personal umbrella liability insurance coverage for Mr. Levine only. This column also includes our contributions to the 401(k) plan, long-term disability insurance coverage, executive supplemental disability insurance coverage, and term life insurance coverage for each NEO, as follows: |
Name | 401(k) ($) | Long-Term Disability ($) | Executive Supplemental Disability ($) | Term Life Insurance (including Accidental Death and Dismemberment) ($) | ||||
Howard R. Levine | 6,500 | 1,660 | 4,589 | 1,080 | ||||
Michael K. Bloom | 1,423 | 820 | 1,723 | 450 | ||||
Mary A. Winston | 6,538 | 1,660 | 4,134 | 1,072 | ||||
Barry W. Sullivan | 12,997 | 1,660 | 4,070 | 942 | ||||
James C. Snyder, Jr. | 4,389 | 1,660 | 4,022 | 886 | ||||
Jason S. Reiser | 9,703 | 1,660 | 1,916 | 833 | ||||
All such amounts were determined by reference to the cash costs we paid for the item.
(5) | Represents amounts earned under the Cash Bonus Awards Guidelines for performance in fiscal 2014. Our fiscal 2014 pre-tax earnings (as adjusted) failed to meet the minimum threshold, which resulted in payment of 0% of Target Bonus for fiscal 2014. |
(6) | Includes the incremental cost to the Company of Mr. Levine's personal use of Family Dollar aircraft which amounted to $34,782 in fiscal 2014. We determine the incremental cost of Mr. Levine's personal use of the Company's aircraft by multiplying the total of Mr. Levine's personal flight hours in a fiscal year (including "dead head" hours), by the per hour incremental cost of all Family Dollar aircraft for the same fiscal year. The incremental aircraft cost per hour is determined by adding the cost of fuel, repairs, supplies, crew travel and meals, landing, and trip-related hangar and parking costs, and then dividing that figure by the total annual flight hours for all Family Dollar aircraft. |
(7) | Represents amounts earned under the Cash Bonus Awards Guidelines for performance in fiscal 2013 but paid in fiscal 2014. Our fiscal 2013 pre-tax earnings (as adjusted) fell short of our target goal by 14.6%, resulting in a payment of 51.3% of Target Bonus. |
(8) | Represents amounts earned under the Cash Bonus Awards Guidelines for performance in fiscal 2012 but paid in fiscal 2013. Our fiscal 2012 pre-tax earnings (as adjusted) fell short of our target goal by 7.6%, resulting in a payment of 74.7% of Target Bonus. |
(9) | Includes both the value of Mr. Bloom's personal use of the Company's aircraft in fiscal 2014 and the severance payments made to Mr. Bloom, per the terms of his employment agreement. His personal use of the Family Dollar aircraft totaled |
100
$3,069. The value of his personal use of the Company's aircraft was calculated using the same methodology for Mr. Levine's use. (See above footnote 6). In connection with his separation from the Company, Mr. Bloom received certain severance payments in fiscal 2014, including salary totaling $537,923.
(10) | Includes relocation benefit payments made to Ms. Winston. In fiscal 2014, her relocation benefit totaled $34,478. |
(11) | Only fiscal 2013 and fiscal 2014 compensation information for Mr. Sullivan and Mr. Snyder is represented, since both officers became NEOs in fiscal 2013. Pursuant to SEC guidance, we have not included compensation information for Mr. Sullivan or Mr. Snyder prior to fiscal 2013. |
(12) | Mr. Reiser was promoted to the position of Executive Vice President and Chief Merchandising Officer in January 2014. Pursuant to SEC guidance, we have not included information regarding Mr. Reiser's compensation prior to fiscal 2014. |
(13) | Includes relocation benefit payments made to Mr. Reiser in fiscal 2014 totaling $69,711 and includes a tax gross up on those relocation benefits of $6,247. |
2014 GRANTS OF PLAN-BASED AWARDS
The following table sets forth information concerning grants of plan-based awards made to our NEOs during fiscal 2014.
Estimated Future Payouts Under Non-Equity Incentive Plan Awards | Estimated Future Payouts Under Equity Incentive Plan Awards | All Other Option Awards: Securities Underlying Options (#) | Exercise or Base Price of Option Awards ($/Share) | Grant Date Fair Value of Stock and Option Awards ($)(5) | ||||||||||||||||||
Name | Plan | Grant Date(4) | Threshold ($) | Target ($) | Maximum ($) | Threshold (#) | Target (#) | Maximum (#) | ||||||||||||||
Howard R. Levine | (1) | 10/15/2013 | 690,000 | 1,380,000 | 2,760,000 | |||||||||||||||||
(2) | 10/15/2013 | 7,727 | 30,905 | 61,810 | 2,129,973 | |||||||||||||||||
(3) | 10/15/2013 | 115,015 | $ | 68.92 | 1,613,660 | |||||||||||||||||
Michael K. Bloom(6) | (1) | 10/15/2013 | 277,500 | 555,000 | 1,110,000 | |||||||||||||||||
(2) | 10/15/2013 | 2,644 | 10,573 | 21,146 | 728,691 | |||||||||||||||||
(3) | 10/15/2013 | 39,350 | $ | 68.92 | 552,081 | |||||||||||||||||
Mary A. Winston | (1) | 10/15/2013 | 138,875 | 277,750 | 555,500 | |||||||||||||||||
(2) | 10/15/2013 | 1,017 | 4,067 | 8,134 | 280,298 | |||||||||||||||||
(3) | 10/15/2013 | 15,135 | $ | 68.92 | 212,344 | |||||||||||||||||
Barry W. Sullivan | (1) | 10/15/2013 | 121,000 | 242,000 | 484,000 | |||||||||||||||||
(2) | 10/15/2013 | 814 | 3,254 | 6,508 | 224,266 | |||||||||||||||||
(3) | 10/15/2013 | 12,110 | $ | 68.92 | 169,903 | |||||||||||||||||
James C. Snyder, Jr. | (1) | 10/15/2013 | 78,020 | 166,000 | 378,480 | |||||||||||||||||
(2) | 10/15/2013 | 488 | 1,952 | 3,904 | 134,532 | |||||||||||||||||
(3) | 10/15/2013 | 7,265 | $ | 68.92 | 101,928 | |||||||||||||||||
Jason S. Reiser | (1) | 10/15/2013 | 110,000 | 220,000 | 440,000 | |||||||||||||||||
(2) | 09/10/2013 | 867 | 3,466 | 6,932 | 251,354 | |||||||||||||||||
(2) | 10/15/2013 | 448 | 1,790 | 3,580 | 123,367 | |||||||||||||||||
(2) | 03/11/2014 | 675 | 2,700 | 5,400 | 167,616 | |||||||||||||||||
(3) | 09/10/2013 | 5,505 | $ | 72.52 | 84,392 | |||||||||||||||||
(3) | 10/15/2013 | 6,660 | $ | 68.92 | 93,440 | |||||||||||||||||
(3) | 03/11/2014 | 4,985 | $ | 62.08 | 58,723 | |||||||||||||||||
101
(1) | Represents threshold, target and maximum payout levels based on Company performance pursuant to fiscal 2014 awards granted under the Cash Bonus Awards Guidelines. The actual amount earned by each NEO for fiscal 2014 was $0. For more information regarding the Cash Bonus Awards Guidelines, see the discussion in "Compensation Discussion and Analysis" in Part III of this Report and the description following this table. |
(2) | Represents threshold, target and maximum payout levels pursuant to three-year PSR awards for the fiscal 2014 - 2016 performance period. These awards were granted pursuant to the 2006 Plan in fiscal 2014. For Mr. Reiser, the threshold, target and maximum payout levels listed for award dates September 10, 2013 and March 11, 2014, are inclusive of three-year PSR new hire and promotional awards granted in fiscal 2014 for the fiscal 2013 - 2015 and fiscal 2014 - 2016 performance periods. |
(3) | Represents stock option awards granted pursuant to the 2006 Plan in fiscal 2014. |
(4) | In each case, the grant date is the same as the Leadership Development and Compensation Committee approval date. |
(5) | The amounts shown in this column indicate the grant date fair value of PSRs and option awards computed in accordance with FASB ASC Topic 718, in the case of the PSRs, based upon the probable outcome of their performance conditions but excluding the effects of estimated forfeitures. See Note 14 to the Consolidated Financial Statements included in Part II of this Report for a discussion of the relevant assumptions made in these valuations. |
(6) | Both the non-equity incentive plan award and the equity incentive plan award thresholds, targets and maximums for Mr. Bloom represent amounts for the full 2014 fiscal year. Pursuant to the provisions of his employment agreement, Mr. Bloom received a portion of these awards pro-rated as of his last date of employment with the Company. |
Description of Plan-Based Awards
All plan-based awards granted in fiscal 2014 and reported in the 2014 Grants of Plan-Based Awards table were granted under and subject to the terms of the 2006 Plan. The 2006 Plan is administered by the Leadership Development and Compensation Committee or, at the discretion of the Board, the 2006 Plan may from time to time be administered by the Board. The Leadership Development and Compensation Committee has, with certain limitations, the exclusive power to, among other things, establish the design of awards; determine performance measures; grant awards; designate participants; determine the type or types of awards to be granted to each participant; and to set the terms and conditions of any award granted under the 2006 Plan. To the extent permitted by applicable law, the Leadership Development and Compensation Committee may delegate its authority to any individual or committee of individuals.
Cash Bonus Awards. Under the Cash Bonus Award Guidelines, NEOs are eligible to receive an annual cash bonus equal to a percentage of their base salary. The percentage of the Target Bonus actually paid is determined by our achievement of pre-tax earnings goals, as established by the Leadership Development and Compensation Committee. The Cash Bonus Award Guidelines are designed so that bonuses are increased if we exceed our earnings goals and decreased if we miss our earnings goals.
As illustrated in the following chart, the potential bonus is increased by 3.33% for each 1% by which the goal is exceeded, up to a maximum of 50% additional bonus if we exceed our earnings goals by 15%. Thereafter, the bonus will increase by 5% for each 1% by which the goal is exceeded up to a cap of 200% of bonus award. Conversely, if we do not meet our pre-tax earnings goals, the potential bonus is decreased by 3.33% for each 1% by which the goal is missed, with no bonuses paid at all if pre-tax earnings are below 85% of the stated goal. Additionally, the Cash Bonus Awards Guidelines establish a cap of 7% of our annual net profits before deduction of certain incentive compensation on the total cash bonus paid to all participating Team Members in any year.
Company Pre-Tax Earnings Performance (as % of Goal) | Bonus Award (as % of Target Bonus Opportunity) | |
125% | 200% | |
115% | 150% | |
100% | 100% | |
85% | 50% | |
<85% | —% | |
102
Mr. Snyder's individual performance rating may increase or decrease his potential bonus; all other NEOs are paid a Target Bonus based solely on the Company's performance. As part of our overall pay for performance philosophy, positions at or below the level of Senior Vice President have a portion of their Target Bonus payment tied to individual performance. This plan design encourages alignment of individual and Company performance with financial rewards. Mr. Snyder's entire bonus payment is affected by Company performance, with an amount equal to 20% of his bonus being impacted by individual performance. The individual performance factor will apply to that portion of the bonus opportunity with a multiplier of 0.7 to 1.7, based on his individual annual performance rating.
Stock Options. All stock option awards made in fiscal 2014 were made under our 2006 Non-Qualified Stock Option Grant Program, which was adopted pursuant to the 2006 Plan. All stock option awards have the following terms:
• | The exercise price for each option is the closing price of a share of Family Dollar common stock on the date the option grant is approved. |
• | Options have a term of five years, and no portion of the option award can be exercised for at least two years from the date of the grant. |
• | Options become vested and exercisable in cumulative installments of 40% of the number of shares of Family Dollar common stock subject to the option two years following the date of grant, 70% three years following the date of grant, and 100% four years following the date of grant. This vesting schedule encourages executives to remain employed by the Company and helps to ensure an appropriate link to stockholder total return. |
• | Grants do not include reload provisions, and repricing of options is prohibited without stockholder approval. |
Performance Share Rights. PSRs are awarded under the terms of the 2006 Incentive Plan Guidelines for Long-Term Incentive Performance Share Rights Awards (the "PSR Guidelines"), which were adopted pursuant to the 2006 Plan. PSR awards give Team Members the right to be issued shares of our common stock, if we perform at a certain level as compared to the Performance Peer Group over the relevant performance period. Our performance is determined by analyzing our pre-tax net income growth ("earnings growth") and average annual return on equity ("ROE"), each of which are given equal weight. For purposes of the PSRs, ROE is calculated by dividing the Company's pre-tax net income for the relevant fiscal year by the average stockholders' equity. The PSRs granted in fiscal 2014 cover a three-year performance period.
Each Team Member who receives PSRs is assigned a "target" number of shares. These shares are actually awarded to the Team Member at the end of the performance period if we are at the 50th percentile as compared to our Performance Peer Group, for three-year earnings growth and ROE. If our performance is above or below the 50th percentile, the number of shares is adjusted upward or downward from the target, as appropriate. Team Members do not receive any shares if our performance is below the 30th percentile. Team Members can receive up to a maximum of twice the "target" award if our relative performance is above the 90th percentile. The percentage of the "target" award received for various performance levels is summarized below (with linear interpolation between the stated thresholds):
Performance Against Selected Peer Group | Percent of Award Adjustment (to Target Award) | |
90th Percentile | 200% | |
75th Percentile | 150% | |
50th Percentile | 100% | |
40th Percentile | 75% | |
30th Percentile | 25% | |
<30th Percentile | —% | |
103
For a list of the companies that comprise our Performance Peer Group, see the discussion in "Compensation Discussion and Analysis" of this Report.
EMPLOYMENT AND SEVERANCE AGREEMENTS
Employment Agreements. The Company entered into an employment agreement (the "Employment Agreement") with the Chairman of the Board and CEO, Howard R. Levine effective December 28, 2012. The Employment Agreement provided for a base salary, subject to annual review by the Board, eligibility to participate in the Company's annual cash bonus plan pursuant to our Cash Bonus Award Guidelines, and participation in the Company's benefit plans. Additionally, the Employment Agreement includes the right to participate in the Company's long-term incentive plans and arrangements for its senior executives and the non-exclusive personal use of the Company's aircraft by Mr. Levine, his family and/or guests, subject to limitations and conditions established by the Leadership Development and Compensation Committee from time to time in consultation with Mr. Levine. The Leadership Development and Compensation Committee has presently limited Mr. Levine's personal usage of the aircraft to no more than 70 hours for fiscal 2015.
The Employment Agreement provides that, in the event of termination of employment by the Company without Cause or by Mr. Levine for Good Reason, prior to a Change in Control (in each case, as such terms are defined in the Employment Agreement), Mr. Levine is entitled to receive (i) severance payments equal to his monthly base salary at the time of termination for a period of thirty (30) months for Mr. Levine, payable in accordance with the Company's payroll practices, (ii) any earned but unpaid annual cash bonus payable under the Cash Bonus Award Guidelines for the fiscal year immediately preceding the year of termination, payable at the time the annual cash bonus would otherwise be paid, (iii) a pro-rata payment of the annual cash bonus payable under the Cash Bonus Award Guidelines for the fiscal year in which termination occurs based on actual Company performance, payable at the time the annual cash bonus would otherwise be paid and (iv) subsidized COBRA benefits. Generally, the salary continuation payments to Mr. Levine will be offset against any compensation received by Mr. Levine following the first anniversary of his termination of employment. In the event of termination of employment due to death or Disability (as defined in the Employment Agreement), Mr. Levine, or his estate, as applicable, will be entitled to receive the payments described in (i) through (iv) above, subject to reduction of any amounts received pursuant to certain certain life insurance benefits paid for by the Company.
The Employment Agreement also provides that, in the event of a termination of employment without Cause or for Good Reason within twenty-four (24) months following a Change in Control (as such terms are defined in the Employment Agreement), Mr. Levine will receive a lump sum severance payment equal to thirty-six (36) times the sum of (a) his highest monthly base salary during the period beginning immediately prior to the Change in Control through his termination of employment and (b) the monthly equivalent of the average of the annual cash bonus award paid in the preceding three fiscal years under the applicable Cash Bonus Award Guidelines. The Company will also provide the executive with subsidized COBRA benefits. Mr. Levine is also entitled to the payments described herein, in the event his employment is terminated within twenty-four (24) months following a Change in Control due to his death or Disability (as defined in his Employment Agreement).
The Company entered into an employment agreement with our former President and Chief Operating Officer, Michael K. Bloom, effective September 26, 2011. Upon his separation from the Company on January 8, 2014, pursuant to his agreement he became entitled to receive (i) severance payments equal to his monthly base salary at the time of termination for a period of twenty-four (24) months, payable in accordance with the Company's payroll practices, (ii) any earned but unpaid annual cash bonus payable under the Cash Bonus Award Guidelines for the fiscal year immediately preceding the year of termination, payable at the time the annual cash bonus would otherwise be paid, (iii) a pro-rata payment of the annual cash bonus payable under the Cash Bonus Award Guidelines for the fiscal year in which termination occurs based on actual Company performance, payable at the time the annual cash bonus would otherwise be paid and (iv) subsidized COBRA benefits. Generally, the payments set forth in (i)-(iii) above will be offset against any compensation received by Mr. Bloom during the twenty-four (24) month period following his separation from the Company. See "Potential Payments upon Termination or Change in Control" for further information regarding the terms of Mr. Bloom's departure.
None of our other current NEOs have entered into employment agreements with the Company.
Severance Agreements. In October 2012, the Leadership Development and Compensation Committee approved new severance agreements between the Company and the Executive and Senior Vice Presidents of the Company (the "2012 Severance Agreements"), including each of the NEOs, other than Messrs. Levine and Bloom and Ms. Winston, as described further below. The 2012 Severance Agreements provide that, in the event of termination of employment by the Company without Cause or due to death or Disability (as such terms are defined in the 2012 Severance Agreements), the Executive Vice Presidents and
104
Senior Vice Presidents shall be entitled to receive (i) severance payments equal to twenty-four (24) months (or in the case of Senior Vice Presidents, twelve (12) months) of their base salary in effect as of the termination date, payable in equal installments in accordance with the Company's payroll practices, (ii) any earned but unpaid annual cash bonus payable under the Cash Bonus Award Guidelines for the fiscal year immediately preceding the year of termination, payable at the time the annual cash bonus would otherwise be paid, (iii) a pro-rata payment of the annual cash bonus payable under the Cash Bonus Award Guidelines for the fiscal year in which termination occurs, payable at the time the annual cash bonus would otherwise be paid and (iv) subsidized COBRA benefits. The severance payments described in (i)-(iv) will be reduced by any compensation received by the executive for services rendered to a third-party (other than service on a board of directors) and by any disability or life insurance benefits paid for by the Company.
In the event of a Change in Control (as defined in the 2012 Severance Agreements) of the Company and a termination of employment by the Company without Cause, by the executive for Good Reason or due to death or Disability within twenty-four (24) months following such Change in Control (in each case, as such terms are defined in the 2012 Severance Agreements), Executive Vice Presidents and Senior Vice Presidents shall be entitled to receive a lump sum severance payment equal to two times (one and one-half times for Senior Vice Presidents) the sum of (x) their highest annual base salary during the period beginning immediately prior to the Change in Control through their termination of employment and (y) the average of the annual cash bonuses paid in the preceding three fiscal years under the applicable Cash Bonus Award Guidelines. The Company will also provide the executives with subsidized COBRA benefits.
The Company has also entered into a severance agreement with Ms. Winston (together with the 2012 Severance Agreements, the "Severance Agreements") which is generally under the same terms and provides for the same benefits as provided to Executive Vice Presidents under the 2012 Severance Agreements.
Release of Claims, Non-Compete and Other Covenants. In order to receive any severance benefits set forth in the Employment Agreement or Severance Agreements, the NEOs must execute a general release of claims against the Company. The Employment Agreement and Severance Agreements contain confidentiality and non-disparagement provisions and agreements to provide future assistance to the Company regarding certain matters. In addition, for a period of one year following termination of employment, the NEOs shall be subject to covenants not to compete and not to solicit the Company's Team Members. If the NEOs violate any of these restrictive covenants, he or she will immediately forfeit any unpaid severance payments and any right to any further continuation of benefits.
Tax Provisions. In connection with the adoption of the Employment Agreement and Severance Agreements, the Company adopted, and affected officers have agreed to the application of, a policy with respect to severance payments made following a Change in Control. Pursuant to that policy, if the payments to be made to an officer are "parachute payments" pursuant to Section 280G of the Code and are subject to the excise tax imposed under Section 4999 of the Code, then the severance benefit will be either: (i) the amount the executive would receive with no adjustment to the severance benefit; or (ii) the severance benefit reduced to the extent that would result in no portion of the severance benefit being subject to excise tax, whichever of the foregoing amounts, taking into account the applicable federal, state and local income taxes and the excise tax, results in the receipt of the greater after-tax amount of severance payments, notwithstanding that all or some portion of such severance payment may be taxable under Section 4999 of the Code. This provision benefits the Company by reducing the amount of payments that otherwise could be subject to the provisions of Section 280G of the Code which would limit the ability of the Company to take tax deductions with respect to such payments. In addition, the timing and form of the severance payments payable under the Employment Agreement and the Severance Agreements are subject to adjustment in order to avoid the imposition of Section 409A of the Code and Mr. Levine is entitled to an additional payment in the event the imposition of Section 409A of the Code results in an additional tax becoming due on any payments due to him pursuant to his Employment Agreement.
See also "Compensation Discussion and Analysis" for a discussion of the company's philosophy regarding the adoption of severance provisions and "Potential Payments upon Termination or Change in Control" for additional information regarding our Employment Agreement and Severance Agreements.
105
2014 OUTSTANDING EQUITY AWARDS AT FISCAL YEAR END
The following table sets forth information concerning option awards and stock awards held by our NEOs as of August 30, 2014.
Option Awards | Stock Awards | ||||||||||||||
Name | Number of Securities Underlying Unexercised Options (#) Exercisable(1) | Number of Securities Underlying Unexercised Options (#) Unexercisable(1) | Option Exercise Price ($) | Option/Stock Award Grant Date(1) | Option Expiration Date(1) | Equity Incentive Plan Awards: Number of Unearned Shares, Units or Other Rights That Have Not Vested (#) | Equity Incentive Plan Awards: Market or Payout Value of Unearned Shares, Units or Other Rights That Have Not Vested ($)(2) | ||||||||
Howard R. Levine | 72,555 | 31,095 | 46.11 | 10/12/2010 | 10/12/2015 | — | — | ||||||||
45,216 | 67,824 | 51.49 | 10/4/2011 | 10/4/2016 | 42,634 | (3) | 3,403,472 | ||||||||
— | 99,435 | 67.95 | 10/9/2012 | 10/9/2017 | 33,777 | (4) | 2,696,418 | ||||||||
— | 115,015 | 68.92 | 10/15/2013 | 10/15/2018 | 22,252 | (5) | 1,776,377 | ||||||||
Michael K. Bloom | — | — | 10/4/2011 | 25,189 | (6) | 2,010,838 | |||||||||
— | — | 10/9/2012 | 5,925 | (4) | 472,993 | ||||||||||
— | — | 10/15/2013 | 1,058 | (5) | 84,460 | ||||||||||
Mary A. Winston | 4,848 | 7,272 | 67.50 | 6/5/2012 | 6/5/2017 | 6,491 | (7) | 518,177 | |||||||
— | 14,205 | 67.95 | 10/9/2012 | 10/9/2017 | 4,826 | (4) | 385,260 | ||||||||
— | 15,135 | 68.92 | 10/15/2013 | 10/15/2018 | 2,929 | (5) | 233,822 | ||||||||
Barry W. Sullivan | — | 3,732 | 46.11 | 10/12/2010 | 10/12/2015 | — | — | ||||||||
— | 9,045 | 51.49 | 10/4/2011 | 10/4/2016 | 5,686 | (3) | 453,913 | ||||||||
— | 11,365 | 67.95 | 10/9/2012 | 10/9/2017 | 3,862 | (4) | 308,303 | ||||||||
— | 12,110 | 68.92 | 10/15/2013 | 10/15/2018 | 2,343 | (5) | 187,042 | ||||||||
James C. Snyder, Jr. | 13,795 | — | 28.11 | 10/13/2009 | 10/13/2014 | — | — | ||||||||
5,807 | 2,488 | 46.11 | 10/12/2010 | 10/12/2015 | — | — | |||||||||
3,166 | 4,749 | 51.49 | 10/4/2011 | 10/4/2016 | 2,985 | (3) | 238,293 | ||||||||
— | 6,250 | 67.95 | 10/9/2012 | 10/9/2017 | 2,124 | (4) | 169,559 | ||||||||
— | 7,265 | 68.92 | 10/15/2013 | 10/15/2018 | 1,406 | (5) | 112,241 | ||||||||
Jason S. Reiser | — | 5,505 | 72.52 | 9/10/2013 | 9/10/2018 | 4,190 | (8) | 334,488 | |||||||
— | 6,660 | 68.92 | 10/15/2013 | 10/15/2018 | 1,289 | (8) | 102,901 | ||||||||
— | 4,985 | 62.08 | 3/11/2014 | 3/11/2019 | 2,554 | (8) | 203,886 | ||||||||
(1) | Options granted under the 2006 Plan vest in increments of 40% on the second anniversary of the grant date and an additional 30% on each of the third and fourth anniversaries of the grant date, and expire on the fifth anniversary of the grant date. For a description of the option terms, see "Description of Plan-Based Awards-Stock Options" in this Report. Unless otherwise noted, option grants were made in accordance with the annual grant process. The grant date listed for each award is also applicable to the respective stock awards listed under the column "Equity Incentive Plan Awards: Number of Unearned Shares, Units or Other Rights That Have Not Vested" in this table. |
(2) | Reflects value of outstanding awards of PSRs by reference to the closing price of Family Dollar common stock on the last trading day in fiscal 2014 (August 29, 2014) of $79.83 per share. |
106
(3) | Represents PSRs awarded in fiscal 2012 under a three-year performance period (fiscal 2012 to fiscal 2014). PSRs are earned and convert to the right to receive shares of Family Dollar common stock based on our average ROE and earnings growth rate relative to the Performance Peer Group over the performance period. The number of shares reflects actual achievement against the performance goals for the three-year performance period at the 64th percentile in relation to our peer group for earnings growth and ROE, resulting in an award of 127.5% of the target PSR award. |
(4) | Represents PSRs awarded in fiscal 2013 under a three-year performance period (fiscal 2013 to fiscal 2015). The number of shares reflected assumes participation by the officer through the end of the performance period and achievement against the performance goals equivalent to actual fiscal 2013 and fiscal 2014 performance at approximately the 59th percentile in relation to our peer group for earnings growth and ROE. This level of performance, if sustained for the full three-year performance period, would result in an award of 117.5% of the target PSR award. However, for Mr. Bloom, the number of PSRs shown is not based on the original amount awarded; rather it is based on prorated awards as of his last date of employment. |
(5) | Represents PSRs awarded in fiscal 2014 under a three-year performance period (fiscal 2014 to fiscal 2016). The number of shares reflected assumes participation by the officer through the end of the performance period and achievement against the performance goals equivalent to actual fiscal 2014 performance at approximately the 39th percentile in relation to our peer group for earnings growth and ROE. This level of performance, if sustained for the full three-year performance period, would result in an award of 72.0% of the target PSR award. However, for Mr. Bloom, the number of PSRs shown is not based on the original amount awarded; rather it is based on prorated awards as of his last date of employment. |
(6) | For new hires and promotions, a prorated PSR award is provided for each outstanding performance period, except for performance periods that will lapse within six months of the hire or promotion date. Mr. Bloom's total shares represent the PSRs awarded to him on October 4, 2011, including an annual award of 11,450 shares and a one-time award of 13,739 shares for fiscal 2012-2014 given as part of his new hire offer. The number of shares listed for the fiscal 2012-2014 performance period reflects actual or prospective achievement against the performance goals for the three-year performance period as noted in footnote 3 and is based on prorated awards as of Mr. Bloom's last date of employment. |
(7) | For new hires and promotions, a prorated PSR award is provided for each outstanding performance period, except for performance periods that will lapse within six months of the hire or promotion date. Ms. Winston's total shares represent the aggregate of PSRs awarded to her on June 5, 2012, including and an annual award of 2,154 shares and a one-time award of 4,337 shares for fiscal 2012-2014 given as part of her new hire offer. The number of shares listed for each performance period reflects actual or prospective achievement against the performance goals for the three-year performance period as noted in footnotes 3, 4 and 5. |
(8) | Mr. Reiser received PSRs upon hire, through the annual award process and as part of his promotion to Executive Vice President, Chief Merchandising Officer. Of his 8,033 total PSRs represented, 1,925 relate to fiscal 2012-2014, 3,782 related to fiscal 2013-2015 and 2,326 relate to 2014-2016. The number of shares listed for each performance period reflects actual or prospective achievement against the performance goals for the three-year performance period as noted in footnotes 3, 4 and 5. |
2014 OPTION EXERCISES AND STOCK VESTED
The following table sets forth stock option exercises by our NEOs in fiscal 2014 and stock awards vested in fiscal 2014.
Option Awards | Stock Awards | ||||||||||
Name | Number of Shares Acquired on Exercise (#) | Value Realized on Exercise ($) | Number of Shares Acquired on Vesting (#)(1) | Value Realized on Vesting ($)(2) | |||||||
Howard R. Levine | 172,415 | (3) | 7,172,964 | 49,828 | 3,434,146 | ||||||
Michael K. Bloom | 18,086 | (4) | 244,705 | 14,268 | 983,351 | ||||||
Mary A. Winston | — | — | 3,191 | 219,924 | |||||||
Barry W. Sullivan | 15,762 | (5) | 441,923 | 5,980 | 412,142 | ||||||
James C. Snyder, Jr. | — | — | 3,988 | 274,853 | |||||||
Jason S. Reiser | — | — | — | — | |||||||
107
(1) | Represents shares issued in fiscal 2014 under the PSR program for the fiscal 2011 - 2013 performance period. Because we performed at the 78th percentile compared to our Performance Peer Group for earnings growth and ROE, our NEOs earned 160.0% of the target number of PSRs pursuant to the three-year PSR award made for the fiscal 2011 - 2013 performance period (for more information on our Performance Peer Group, see "How does the Company select its peer group for the PSR program" in the "Compensation Discussion and Analysis" section in this Report). |
Our Performance Peer Group for the fiscal 2011 - 2013 performance period consisted of the following companies: Advance Auto Parts Inc., Big Lots, Inc., Casey's General Stores, Inc., The Cato Corporation, Dollar General Corporation, Dollar Tree Inc., Duckwall-ALCO Stores, Inc., Fred's Inc., Kohl's Corporation, Ross Stores Inc., SuperValu Inc., Target Corporation, The Pantry, Inc., Walgreen Company and Wal-Mart Stores, Inc.
(2) | Determined by reference to the closing price of Family Dollar common stock on October 15, 2013, the date such shares were issued. The closing price on such date was $68.92. |
(3) | The options exercised by Mr. Levine had an exercise price of $28.11 per share and were granted on October 13, 2009. |
(4) | The options exercised by Mr. Bloom had an exercise price of $51.49 per share and were granted on October 4, 2011. |
(5) | 6,000 of the options exercised by Mr. Sullivan had an exercise price of $28.11 per share; 3,732 of the options exercised by Mr. Sullivan had an exercise price of $46.11 per share; and 6,030 of the options exercised by Mr. Sullivan had an exercise price of $51.49 per share. These options were granted on October 13, 2009, October 12, 2010, and October 4, 2011, respectively. |
2014 NON-QUALIFIED DEFERRED COMPENSATION
The Deferred Compensation Plan allows certain Team Members, including NEOs, to elect to defer receipt of up to 50% of their base salary and up to 75% of their bonus payments. The Company does not fund, make any contributions to, or provide any interest rate subsidy for the Deferred Compensation Plan. In general, participants in the Deferred Compensation Plan receive payments following separation from service, provided the participant may elect to receive payments on the earlier of a date certain or separation from service. The benefit participants may elect to receive payments in either a lump sum payment or in annual installments over five or ten years. Payments under the plan begin as soon as administratively feasible six months after a Team Member's separation from service, unless a Team Member has elected to receive payments prior to separation from service in a specified year. Participants may elect to accrue a return on the deferred compensation by electing certain hypothetical investments that are similar to those offered under our 401(k) benefit plan for all eligible Team Members.
The following table shows information about the participation by each NEO in our Deferred Compensation Plan.
Fiscal 2014 | Fiscal 2014 | Fiscal 2014 | Fiscal 2014 | |||||
Name | Executive Contributions ($)(1) | Aggregate Earnings ($)(2) | Aggregate Distributions ($) | Aggregate Balance at Fiscal Year End ($)(3)(4) | ||||
Howard R. Levine | 91,384 | 252,326 | — | 2,062,769 | ||||
Michael K. Bloom | 27,769 | 22,381 | 170,008 | 4,117 | ||||
Mary A. Winston | 65,536 | 6,247 | — | 71,783 | ||||
Barry W. Sullivan | 199,092 | 169,465 | — | 1,582,478 | ||||
James C. Snyder, Jr. | — | — | — | — | ||||
Jason S. Reiser | 5,359 | 245 | — | 5,604 | ||||
(1) | Reflects amounts of salary deferrals which are also reported as compensation for fiscal 2014 in the Summary Compensation Table and deferrals of non-equity incentive plan compensation reported as compensation for fiscal 2013 in the 2013 Summary Compensation Table in the following amounts: |
108
Salary ($) | Non-Equity Incentive Plan Compensation ($) 2013 | |||
(Deferred in Fiscal 2014) | ||||
Name | (Deferred in Fiscal 2014) | |||
Howard R. Levine | 57,067 | 34,317 | ||
Michael K. Bloom | 27,769 | — | ||
Mary A. Winston | — | 65,536 | ||
Barry W. Sullivan | 109,366 | 89,726 | ||
James C. Snyder, Jr. | — | — | ||
Jason S. Reiser | 5,359 | — | ||
The table does not include the following non-equity incentive plan compensation amounts deferred in fiscal 2014 to be paid in fiscal 2015. These amounts are reported as compensation for fiscal 2014 in the Summary Compensation Table:
Non-Equity Incentive Plan Compensation ($) 2014 | |||
Name | (Deferred in Fiscal 2015) | ||
Howard R. Levine | — | ||
Michael K. Bloom | — | ||
Mary A. Winston | — | ||
Barry W. Sullivan | — | ||
James C. Snyder, Jr. | — | ||
Jason S. Reiser | — | ||
(2) | We do not provide above-market earnings on amounts deferred under the Deferred Compensation Plan. Therefore, pursuant to SEC regulations, these amounts are not reported in the Summary Compensation Table. |
(3) | This amount includes executive contributions and earnings relating to (i) salary deferrals made in fiscal 2014 and in prior fiscal years and (ii) bonus deferrals for bonuses earned in fiscal 2013 and paid in fiscal 2014 and bonuses earned and paid in prior fiscal years. This amount does not include deferrals with respect to fiscal 2014 bonuses to be paid in fiscal 2015. |
(4) | Of this amount, $1,274,935 for Mr. Levine and $226,359 for Mr. Sullivan was reported as compensation in the Summary Compensation Table for previous fiscal years. |
POTENTIAL PAYMENTS UPON TERMINATION OR CHANGE IN CONTROL
We have entered into employment and severance agreements and maintain incentive plans that will require us to provide compensation or other benefits to our NEOs in connection with certain events related to a termination of employment or change in control of the Company. Capitalized terms used in the following descriptions have the definitions set forth in the Employment Agreement and Severance Agreements or in the 2006 Plan.
Employment and Severance Agreements
As described in the "Employment and Severance Agreements" section in this Report the Leadership Development and Compensation Committee approved the Employment Agreement and Severance Agreements for certain executives, including our current NEOs. Generally, under the Employment Agreement and Severance Agreements, upon a termination of employment without Cause, death or Disability, our NEOs would become entitled to receive certain severance benefits, including salary continuation payments equal to a multiple of their monthly base salary, any earned but unpaid annual cash bonus for the fiscal year preceding the year of termination, a pro-rata payment of the annual cash bonus pursuant to our Cash Bonus Awards Guidelines for the fiscal year in which termination occurs and subsidized COBRA continuation coverage for up to eighteen (18) months following their termination of employment. Generally, the Employment Agreement and Severance Agreements also provide that, in the event of a termination of employment without Cause or for Good Reason within twenty-four (24) months following a Change in Control, the NEOs are entitled to a lump sum severance payment equal to a multiple of the sum of their highest annual base salary during the period beginning immediately prior to the Change in Control through the termination of employment and the average of the annual cash bonuses paid in the preceding three fiscal years under the Cash
109
Bonus Award Guidelines. The Company will also continue to provide health benefits for the executive and his or her dependents for up to eighteen (18) months after termination. The Company's obligation to provide the severance benefits described above to any NEO are contingent on the NEO's compliance with certain non-competition, non-solicitation and confidentiality covenants contained in the Employment Agreement or Severance Agreements, respectively, and execution of a general release of claims against the Company. (For more information on our employment and severance agreements with our NEOs, see the "Employment and Severance Agreements" section in this Report).
2006 Plan
Under the 2006 Plan, in the event of a "Change in Control," (as defined under the 2006 Plan) if (i) the acquiring company does not assume the outstanding awards under the 2006 Plan, or (ii) the acquiring company does assume the outstanding awards, and a participating Team Member is terminated from employment without "Cause" or the participant resigns for "Good Reason," within two years following the Change in Control (as such terms are defined under the 2006 Plan) then:
• | outstanding options would immediately vest upon the Change in Control or the date of termination of employment, as applicable, and remain exercisable for the duration of their term; and |
• | the target payout opportunities attainable under the annual cash bonus and PSRs outstanding at the time of the Change in Control or the date of termination of employment, as applicable, would be deemed to have been fully earned as of the effective date of the Change in Control or termination of employment, as applicable, based upon the greater of (i) an assumed achievement of all relevant performance goals at the "target" level, or (ii) the actual level of achievement of all relevant performance goals as of Family Dollar's fiscal quarter end preceding such Change in Control. With respect to the annual cash bonus and PSRs, participants would be paid a prorated award based upon the length of the performance period that has elapsed prior to the date of the Change in Control or termination of employment within two years following a Change in Control. |
In addition, under the 2006 Plan the Leadership Development and Compensation Committee has the discretion to accelerate vesting of awards in connection with a Change in Control or termination of employment and to cancel or adjust awards in the event of certain corporate transactions. Under the 2006 Plan, if a participant's employment is terminated as a result of death, Disability, Retirement, or by the Company without Cause, any outstanding awards of PSRs will be paid out based on the Company's performance for (A) the fiscal year in which the date of termination occurs plus (B) each completed fiscal year during the applicable performance period immediately preceding the date of termination. The number of shares of Family Dollar common stock awarded pursuant to the PSRs will be issued on a pro-rata basis based on the number of months the participant worked during the applicable performance period. In the event a participant's employment is terminated prior to the issuance of shares of Family Dollar common stock in respect of any award of PSRs, either by the Company for Cause or due to any reason other than those described above, any outstanding award of PSRs will immediately be forfeited.
Non-Qualified Deferred Compensation
In the event of a termination of employment of any officer who participates in the Company's Deferred Compensation Plan, payments under the plan will begin as soon as administratively feasible six months after such termination of employment. There is no provision for increased benefits in the event of termination of employment with the Company.
Estimated Post-Employment Compensation and Benefits
The following table sets forth the estimated post-employment compensation and benefits that would have been payable to each of our current NEOs upon a separation from service under various circumstances or a change in control of the Company in accordance with their respective employment agreements and severance agreements and under our various incentive plans. Payments pursuant to the Deferred Compensation Plan are not included in the table (see "2014 Non-Qualified Deferred Compensation," in this Report). No payments, other than payments of accrued and unpaid base salary and vacation and non-qualified deferred compensation, are made to any NEO in the event of termination for Cause. The amounts payable are calculated based on the assumption that each covered circumstance under such arrangements occurred on August 30, 2014, the end of fiscal 2014, as required by the SEC disclosure rules, and do not address the potential effect of the pending Dollar Tree merger.
110
Name | Benefits and Payments | Voluntary Departure ($) | Termination by the Company without Cause ($) | Change in Control ($) | Medical Disability ($) | Death ($)(3) | |||||
Howard R. Levine | Severance Pay(1)(2) | — | 2,875,000 | 5,078,342 | 2,875,000 | 1,875,000 | |||||
Performance Share Rights(4) | — | 5,793,263 | 6,023,493 | 5,793,263 | 5,793,263 | ||||||
Stock Options(5) | 3,727,976 | 3,727,976 | 9,134,734 | 9,134,734 | 9,134,734 | ||||||
Benefit Continuations(6) | — | 13,551 | 13,551 | 13,551 | — | ||||||
Total | 3,727,976 | 12,409,790 | 20,250,120 | 17,816,548 | 16,802,997 | ||||||
Mary A. Winston | Severance Pay(1)(2) | — | 1,010,000 | 1,154,319 | 1,010,000 | 10,000 | |||||
Performance Share Rights(4) | — | 853,144 | 883,400 | 853,144 | 853,144 | ||||||
Stock Options(5) | 59,775 | 59,775 | 483,318 | 483,318 | 483,318 | ||||||
Benefit Continuations(6) | — | 13,335 | 13,335 | 13,335 | — | ||||||
Total | 59,775 | 1,936,254 | 2,534,372 | 2,359,797 | 1,346,462 | ||||||
Barry W. Sullivan | Severance Pay(1)(2) | — | 880,000 | 1,066,691 | 880,000 | — | |||||
Performance Share Rights(4) | — | 721,902 | 746,090 | 721,902 | 721,902 | ||||||
Stock Options(5) | — | — | 649,314 | 649,314 | 649,314 | ||||||
Benefit Continuations(6) | — | 15,351 | 15,351 | 15,351 | — | ||||||
Total | — | 1,617,253 | 2,477,446 | 2,266,567 | 1,371,216 | ||||||
James C. Snyder, Jr. | Severance Pay(1)(2) | — | 415,000 | 725,632 | 415,000 | — | |||||
Performance Share Rights(4) | — | 388,722 | 403,301 | 388,772 | 388,772 | ||||||
Stock Options(5) | 999,013 | 999,013 | 1,371,006 | 1,371,006 | 1,371,006 | ||||||
Benefit Continuations(6) | — | 6,106 | 9,159 | 6,106 | — | ||||||
Total | 999,013 | 1,808,841 | 2,509,098 | 2,180,884 | 1,759,778 | ||||||
Jason S. Reiser | Severance Pay(1)(2) | — | 800,000 | 800,000 | 800,000 | — | |||||
Performance Share Rights(4) | — | 417,192 | 441,221 | 417,192 | 417,192 | ||||||
Stock Options(5) | — | — | 201,387 | 201,387 | 201,387 | ||||||
Benefit Continuations(6) | — | 13,335 | 13,335 | 13,335 | — | ||||||
Total | — | 1,230,527 | 1,455,943 | 1,431,914 | 618,579 | ||||||
(1) | Represents severance payable in an amount equal to a multiple, as set forth below, of the NEO's fiscal 2014 annual base salary, plus the amount of the pro rata bonus (assuming a termination date of August 30, 2014, 100%) payable to the NEO under the Cash Bonus Award Guidelines: |
Multiple Applicable on Termination without Cause, or due to Disability or death, prior to a Change in Control | |||
Howard R. Levine | 2.5 | ||
Mary A. Winston | 2 | ||
Barry W. Sullivan | 2 | ||
James C. Snyder, Jr. | 1 | ||
Jason S. Reiser | 2 | ||
111
(2) | Represents severance payable in the event of a qualifying termination following a Change in Control, equal to a multiple, as set forth below, of the sum of the NEO's fiscal 2014 base annual salary plus the average annual cash bonus actually paid under the Cash Bonus Award Guidelines in the preceding fiscal three years: |
Multiple Applicable on Qualifying Termination After a Change in Control | |||
Howard R. Levine | 3 | ||
Mary A. Winston | 2 | ||
Barry W. Sullivan | 2 | ||
James C. Snyder, Jr. | 1.5 | ||
Jason S. Reiser | 2 | ||
(3) | The amount payable in the event of death has been reduced by life insurance proceeds payable upon the death of each NEO pursuant to life insurance policies provided as part of the Company's benefit program, up a maximum of $1,000,000. |
(4) | In the event of any termination of employment described above, except in connection with a Change in Control, all outstanding awards of PSRs are paid on a pro-rata basis as of the date of the participant's termination without Cause, or due to the participant's Retirement, Disability or death, based on actual Company performance in the fiscal year of termination and any prior completed fiscal years in the performance period. Under the 2006 Plan, the executive would receive the amounts set forth under the column "Change in Control" only if: (a) the awards are not assumed by the surviving entity, or (b) the awards are assumed by the surviving entity, but the executive is terminated within two years of the Change in Control without Cause or for Good Reason. The payouts of the outstanding awards of PSRs on a Change in Control are determined based on the greater of (a) an assumed achievement of all relevant performance goals at the "target" level, or (b) the actual level of achievement of all relevant performance goals against the target level, as of Family Dollar's fiscal quarter end preceding the date of Change in Control. The amounts set forth above are based upon the closing price of Family Dollar common stock as of August 29, 2014, the last trading day of the year, of $79.83 per share, multiplied by the number of shares of Family Dollar common stock to be awarded, adjusted for performance as set forth below: |
• | For the fiscal 2012 - 2014 three-year performance period, we assumed an award equivalent to 127.5% of the target number of PSRs awarded to each in NEO in fiscal 2012, based on actual performance against the fiscal 2012 - 2014 Performance Peer Group through fiscal 2014. |
• | For the fiscal 2013 - 2015 three-year performance period, we assumed an award equivalent to 117.5% of the target number of PSRs awarded to each in NEO in fiscal 2013, based on actual performance against the fiscal 2013 - 2015 Performance Peer Group through fiscal 2014. |
• | For the fiscal 2014 - 2016 three-year performance period, we assumed an award equivalent to 72% of the target number of PSRs awarded to each in NEO in fiscal 2014, based on actual performance against the fiscal 2014 - 2016 Performance Peer Group through fiscal 2014. Under the Change in Control scenario, we have assumed a 100% performance achievement, as it is the greater of "target" level and actual achievement during the relevant performance period. |
(5) | As discussed above, stock options granted pursuant to the 2006 Plan accelerate and vest in full upon termination due to death and Disability, and would continue to vest and be exercisable through the expiration of their term in connection with a termination by the executive due to his or her Qualifying Retirement (as defined under the 2006 Plan Non-Qualified Stock Option Grant Program). Under the 2006 Plan, all stock options would vest in full and the executive would receive the amounts set forth under the column "Change in Control" only if: (a) the awards are not assumed by the surviving entity, or (b) the awards are assumed by the surviving entity, but the executive is terminated within two years of the Change in Control. The amounts set forth above are based upon the excess of the closing price of Family Dollar common stock as of August 29, 2014, the last trading day of the year, of $79.83 per share over the exercise price of the option and on the termination reasons as set forth below: |
• | In the event of the termination of an executive's employment due to voluntary departure (other than a Qualifying Retirement) or by the Company without Cause, the executive would be entitled to exercise stock options that were vested on or before the date of termination for a period of ninety (90) days following the executive's date of termination and all unvested stock options would be immediately forfeited as of the executive's termination date. |
• | In the event of the termination of an executive's employment due to death or Disability, or in connection with a Change in Control, all outstanding stock options would immediately vest in full on the date of the executive's termination within two years following a Change in Control (if the outstanding options were assumed by the |
112
surviving entity on the date of the Change in Control) or on the date of a Change in Control, if the outstanding awards were not assumed by the surviving entity in the event of a Change of Control.
(6) | Reflects the incremental cost to the Company of the extension of health benefits following a termination without Cause or due to death or Disability or a qualifying termination following a Change in Control. These benefits would be extended for up to eighteen months in any of these events for all of the NEOs. |
Actual Post-Employment Compensation and Benefits
The following table sets forth the actual post-employment compensation and benefits that were payable to Mr. Bloom upon his separation from the Company in accordance with his employment agreement and under our various incentive plans. Payments pursuant to the Deferred Compensation Plan are not included in the table (see "2014 Non-Qualified Deferred Compensation," above). Mr. Bloom's payments and benefits are subject to his compliance with certain non-competition, non-solicitation and confidentiality covenants contained in his employment agreement and his execution of a general release of claims against the Company. In addition, his severance payments will be offset against any compensation received by Mr. Bloom during the twenty-four (24) month period following his separation from the Company.
Michael K. Bloom ($)(1) | |||
Severance Pay | 1,480,000 | ||
Performance Share Rights | 2,476,279 | ||
Stock Options | — | ||
Benefit Continuations | 12,039 | ||
Total | 3,968,318 | ||
(1) | Mr. Bloom's employment with the Company ended on January 8, 2014. His employment agreement provided him with continuation of certain compensation and benefits as described above in the "Employment and Severance Agreements" section in this Report. Under the 2006 Plan, Mr. Bloom received pro-rata payouts of all outstanding awards of PSRs on October 14, 2014 (the date the PSRs were paid out for the fiscal 2012-2014 performance period) based on actual Company performance during fiscal 2014 and the prior completed fiscal years in the applicable performance periods, pro-rated for the period of his employment during the applicable performance periods. The PSR amount set forth above in respect of the number of shares of Family Dollar common stock issued in connection with the payout of Mr. Bloom's outstanding awards of PSRs is based upon the closing price of Family Dollar common stock as of the payment date of $76.97 per share. |
113
APPENDIX A
Hay Retail Industry Database
7-Eleven | DSW | Perry Ellis International |
Abercrombie & Fitch | Express | PETCO |
Ace Hardware | Family Dollar Stores | PetSmart |
Advance Auto Parts | FedEx - Office & Print Services | Pier 1 Imports |
Aeropostale | Ferragamo USA | PVH Corporation |
Ahold USA | Fifth & Pacific Companies | QVC |
Alex Lee | Finish Line | Ralph Lauren |
Amazon.com | Foot Locker | Rent-A-Center |
American Eagle Outfitters | Fossil | Richemont North America |
Andersons | Gap | Ritchie Bros. Auctioneers |
Ann, Inc. | GNC | Rite Aid |
Apple | Harris Teeter | Ross Stores |
Ascena Retail Group | Helzberg Diamonds | rue 21 |
AutoZone | Hermes International | Safeway |
Bare Escentuals | h.h. gregg | Saks |
Bebe Stores | The Home Depot | Sears |
Belk | Hot Topic | ShopKo |
Best Buy | Hudson's Bay Co. - Lord & Taylor | Sonic Automotive |
Big Lots | Hugo Boss USA | The Sports Authority |
BJ's Wholesale Club | J.C. Penney | Stage Stores |
Body Central | J. Crew | Staples |
Bon-Ton Stores | Jewelry Television | SUPERVALU |
Brooks Brothers | Kenneth Cole | Swarovski (D.) & Co. |
Brookstone | Knowledge Learning | Talbots |
Burberry | Kohl's | Target |
Burlington Coat Factory | L.L. Bean | The Kroger Company |
Cabela's | Limited Brands | Tiffany & Co. |
Carolina Herrera | Limited Stores | TJX Companies |
Carter's | Lowe's | Tory Burch |
CBRL Group | LVMH Moet Hennessy Louis Vuitton | Toys ‘R' Us |
Chanel | Macy's | Tractor Supply |
Charlotte Russe | Meijer | Tumi |
Charming Shoppes | Michaels Stores | Ulta Salon, Cosmetics & Fragrence |
Chico's | Movado Group | United Natural Foods |
Children's Place | Neiman Marcus | Vera Bradley |
Coach | NET-A-PORTER | Walgreens |
Collective Brands | New York & Company | Walmart |
Costco Wholesale | Nike | Walt Disney Co. - Disney Stores |
Crate and Barrel | Nordstrom | WaWa |
CVS/Caremark | Office Depot | Wegmans Food Markets |
Destination Maternity | OfficeMax | Williams-Sonoma |
Dick's Sporting Goods | One Kings Lane | Winn-Dixie Stores |
Dollar General | The Pantry | Zale |
Dollar Tree | Park Place Dealerships | |
114
ITEM 12. SECURITY OWNERSHIP OF CERTAIN BENEFICIAL OWNERS AND MANAGEMENT AND RELATED STOCKHOLDER MATTERS
EQUITY COMPENSATION PLAN INFORMATION
The following table provides information with respect to the shares of our common stock that may be issued under the 2006 Plan, which is the only equity compensation plan we currently maintain, as of August 30, 2014.
Plan Category | Number of Securities to be Issued Upon Exercise of Outstanding Options, Warrants and Rights(1) | Weighted Average Exercise Price of Outstanding Options, Warrants and Rights (per share)(2) | Number of Securities Remaining Available for Future Issuance(3) | ||
Equity Compensation Plans Approved by Stockholders | 1,990,407 | $61.38 | 9,183,721 | ||
(1) | Consists of shares issuable upon exercise of options and the award of common stock pursuant to PSRs based on "target" performance granted under the 2006 Plan. |
(2) | The weighted average exercise price is for options only and does not account for PSRs. |
(3) | Consists of shares available for awards of options and other stock-based awards under the 2006 Plan (8,200,074) and shares available for issuance under the Employee Stock Purchase Plan (983,647). |
OWNERSHIP OF THE COMPANY'S SECURITIES
The following table sets forth, for each of our directors and director nominees, each of our NEOs, and all of our current executive officers, directors and director nominees as a group, the number of shares of our common stock beneficially owned and the percent of our common stock so owned, all as of October 23, 2014, unless otherwise noted, and based on 114,225,777 shares outstanding as of that date:
Name | Amount and Nature of Beneficial Ownership(1) | Percent of Common Stock | |||
Mark R. Bernstein | 31,058 | (2) | * | ||
Pamela L. Davies | 6,508 | * | |||
Sharon Allred Decker | 7,439 | (3) | * | ||
Edward C. Dolby | 14,476 | * | |||
Glenn A. Eisenberg | 14,076 | * | |||
Edward P. Garden | 8,366,386 | (4) | 7.32 | % | |
Howard R. Levine | 8,877,682 | (5) | 7.77 | % | |
George R. Mahoney, Jr. | 340,394 | * | |||
James G. Martin | 13,358 | * | |||
Harvey Morgan | 6,102 | (6) | * | ||
Dale C. Pond | 11,946 | * | |||
Michael K. Bloom | 13,897 | (7) | * | ||
Mary A. Winston | 17,087 | * | |||
Barry W. Sullivan | 39,034 | * | |||
James C. Snyder, Jr. | 29,562 | * | |||
Jason S. Reiser | 1,299 | * | |||
All Executive Officers, Directors and Director Nominees of the Company as a Group (16 persons) | 17,790,304 | 15.57 | % | ||
* Less than one percent | |||||
115
(1) | All shares are held with sole voting and investment power. These numbers include shares for which the following persons have the right to acquire beneficial ownership, as of October 23, 2014, or within 60 days thereafter, pursuant to the exercise of stock options: (i) Mr. Levine 118,902 shares; (ii) Ms. Winston 10,530 shares; (iii) Mr. Sullivan 4,546 shares; (iv) Mr. Snyder 16,336 shares and (v) all executive officers and directors as a group 152,814 shares. Does not include shares that may be issued in respect of outstanding Family Dollar performance share right awards; see the "2014 Outstanding Equity Awards at Fiscal Year End" table for information regarding the potential award of common stock pursuant to the PSRs. |
(2) | This number includes 15,075 shares previously owned by Mr. Bernstein's wife's estate. Mr. Bernstein no longer disclaims beneficial ownership of these shares. |
(3) | This number includes 2,843 shares which are currently pledged. |
(4) | Mr. Garden is deemed to beneficially own 8,364,997 shares of our common stock that are owned by Trian Fund Management, L.P. and its affiliates as described in the "Ownership by Certain Other Beneficial Owners" table below. |
(5) | This number does not include 1,025 shares owned by Mr. Levine's wife. Mr. Levine disclaims beneficial ownership of the shares owned by his wife. |
(6) | This number does not include 4,650 shares owned by Mr. Morgan's wife. Mr. Morgan disclaims beneficial ownership of the shares owned by his wife. |
(7) | Mr. Bloom is no longer an officer or employee of the Company, and the amounts shown for him reflect his stock ownership as of the date of his last Form 4 filing made with the SEC. Mr. Bloom does not currently have any outstanding rights granted by the Company to acquire beneficial ownership of shares. Mr. Bloom's last Form 4 was filed on October 17, 2013. |
116
Ownership by Certain Other Beneficial Owners
Based on filings with the SEC and other information, we believe that, as of the dates set forth below, the following stockholders beneficially owned more than 5% of our common stock:
Name and Address | Amount and Nature of Beneficial Ownership(1) | Percent of Common Stock(2) | |||
Trian Fund Management, L.P. | 8,366,386 | (3) | 7.32 | % | |
280 Park Avenue | |||||
41st Floor | |||||
New York, NY 10017 | |||||
Paulson & Co. Inc. | 8,020,000 | (4) | 7.02 | % | |
1251 Avenue of Americas | |||||
New York, NY 10020 | |||||
The Vanguard Group | 7,576,148 | (5) | 6.63 | % | |
100 Vanguard Blvd. | |||||
Malvern, PA 19355 | |||||
Franklin Advisory Services, LLC | 6,657,828 | (6) | 5.83 | % | |
One Parker Plaza | |||||
Ninth Floor | |||||
Fort Lee, NY 07024 | |||||
State Street Corp. | 6,620,249 | (7) | 5.80 | % | |
One Lincoln Street | |||||
Boston, MA 02111 | |||||
UBS AG | 6,601,029 | (8) | 5.77 | % | |
677 Washington Blvd. | |||||
Stamford, CT 06901 | |||||
Harris Associates, LP | 6,254,295 | (9) | 5.48 | % | |
2 North LaSalle Street, Suite 500 | |||||
Chicago, IL 60602 | |||||
(1) | "Beneficial ownership" is a term broadly defined by the SEC and includes more than the typical form of stock ownership, that is, stock held in the person's name. The term also includes what is referred to as "indirect ownership" such as where, for example, the person has or shares the power to vote the stock, sell it or acquire it within 60 days. Accordingly, some of the shares reported as beneficially owned in this table may actually be held by other persons or organizations. Those other persons and organizations are described in the reports filed with the SEC. |
(2) | Based on the number of shares of common stock owned by each stockholder as set forth above and 114,225,777 shares of our common stock outstanding as of October 23, 2014. |
(3) | Based solely on the Schedule 13D/A filed with the SEC on July 28, 2014, by Trian Fund Management, L.P. and certain of its affiliates. As of July 27, 2014, the Filing Persons reported beneficial ownership of 8,366,386 shares. According to the Schedule 13D/A, the Filing Persons, who may be deemed to share voting and investment power, are Trian Partners, L.P., Trian Partners Master Fund, L.P., Trian Partners Parallel Fund I, L.P., Trian Partners Strategic Investment Fund, L.P., Trian Partners Master Fund (ERISA), L.P., Trian Fund Management, L.P., Trian Fund Management GP, LLC, Nelson Peltz, Peter W. May and Edward P. Garden. |
117
(4) | Based solely on the Form 13F-HR filed on August 14, 2014 by Paulson & Co. and Paulson Management LP. As of June 30, 2014, the filers reported defined investment power and sole voting power over all of the reported shares. |
(5) | Based solely on the Form 13F-HR filed with the SEC by The Vanguard Group, Inc. and its affiliates, on August 11, 2014. As of June 30, 2014, the Vanguard Group, Inc. had sole investment power over 7,422,381 shares, Vanguard Fiduciary Trust Company has investment power over 126,167 shares, and Vanguard Investments Australia, Ltd. has investment power over 27,600 shares. The Vanguard Group, Inc. has sole voting power over 36,008 shares and no voting power over 7,386,373 shares. The Vanguard Fiduciary Trust Company has sole voting power over 126,167 shares. Vanguard Investments Australia, Ltd. has no voting power over 27,600 shares. |
(6) | Based solely on the Form 13F-HR filed with the SEC by Franklin Resources Inc. and their affiliates, on August 12, 2014. As of June 30, 2014, Franklin Advisory Services, LLC has defined investment power over 6,655,828 shares, Fiduciary Trust Co. International has defined investment power over 800 shares, and Franklin Templeton Portfolio Advisors, Inc. has defined investment power over 1,200 shares. Franklin Advisory Services, LLC has sole voting power over 6,655,828 shares, Fiduciary Trust Co. International has sole voting power over 800 shares, and Franklin Templeton Portfolio Advisors, Inc. has sole voting power over 1,200 shares. |
(7) | Based solely on the Form 13F-HR filed with the SEC by State Street Corp and its affiliates on August 12, 2014. As of June 30, 2014, State Street Corp., State Street Bank and Trust Company, SSgA Funds Management, Inc. State Street Global Advisors LTD, State Street Global Advisors Ltd., State Street Global Advisors, Australia, State Street Global Advisors (Japan) Co., Ltd., State Street Global Advisors Asia LTD and State Street Global Advisors France, S.A., have defined investment power over all of the shares and State Street Corp. has sole voting power over all of the shares. |
(8) | Based solely on the Form 13F-HR filed with the SEC by UBS AG and its affiliates on August 14, 2014. As of June 30, 2014, UBS AG has defined investment power over 6,468,007 shares and UBS Financial Services, LLC has defined investment power over 133,022 shares. UBS AG has shared voting power over 6,462,007 shares and no voting power over 6,000 shares. UBS Financial Services, LLC has shared voting power over 133,022 shares. These numbers include shares for which UBS AG has the right to acquire beneficial ownership, as of June 30, 2014, or within 60 days thereafter, pursuant to the exercise of stock options-80,400 call options and 300 put options. |
(9) | Based solely on the Form 13F-HR filed with the SEC by Harris Associates L.P. and its affiliates on August 12, 2014. As of June 30, 2014, Harris Associates L.P. has sole investment power over 5,411,671 shares and NGAM Advisors, L.P. has investment power over 842,624 shares. Harris Associates L.P. has sole voting power over 4,021,186 shares, and no voting power over 1,390,485 shares. NGAM Advisors, L.P. has shared voting power over 793,300 shares and no voting power over 49,324 shares. |
118
ITEM 13. CERTAIN RELATIONSHIPS AND RELATED TRANSACTIONS, AND DIRECTOR INDEPENDENCE
TRANSACTIONS WITH RELATED PERSONS
Policy and Procedures
The Nominating/Corporate Governance Committee (the "Governance Committee") has adopted written procedures for the review, approval and monitoring of transactions between Family Dollar and its directors and executive officers (and their immediate family members) that would be subject to disclosure in our Report pursuant to the SEC rules (generally transactions involving amounts exceeding $120,000 in which a related party has a material interest). Under these procedures, the Governance Committee is to be informed of transactions subject to review before their implementation. The procedures establish our practices for obtaining and reporting information to the Governance Committee regarding such transactions on a periodic and an as-needed basis. The policy provides that such transactions are to be submitted for approval before they are initiated but also provides for ratification of such transactions. No director who is interested in a transaction may participate in the Governance Committee's determinations as to the appropriateness of such transaction. In certain situations, the Chairman of the Governance Committee has been delegated the authority to make determinations regarding the approval of such transactions. The policy also pre-approves certain transactions excluded from the SEC's disclosure rules and transactions arising solely from ownership of our stock in which all stockholders are equally treated. The Governance Committee and/or the Board have previously approved certain related party transactions, as described below. The procedures established by the Governance Committee provide for continuing monitoring and annual review of these pre-approved transactions. These procedures operate in conjunction with other aspects of the Company's compliance program, such as our Board of Directors Code of Conduct and our Code of Business Conduct, which generally require directors and Team Members to report any circumstances that may create or appear to create a conflict between the interests of such a person and those of the Company, regardless of the amount involved. Related person transactions involving directors are also subject to Board approval or ratification when so required under Delaware law.
Related Party Transactions
We have entered into a Retirement Agreement with Mr. Leon Levine, the former Chairman of the Board and the father of Howard R. Levine, in connection with Mr. Leon Levine's retirement as of September 30, 2002. Pursuant to the Retirement Agreement, we are currently providing continuing health care coverage for Mr. Leon Levine and certain members of his family and use of Family Dollar aircraft for up to 30 hours per year (not including "dead-head" time). We accrued approximately $1,285,000 in fiscal 2002 for the total value of these benefits to be received over the term of the Retirement Agreement. The incremental cost of providing these benefits and services was $206,441 in fiscal 2014.
DIRECTOR INDEPENDENCE
Our Corporate Governance Guidelines state that a majority of the Board members and all members of each of the Audit, Leadership Development and Compensation and Nominating/Corporate Governance Committees must be independent, as defined by the NYSE listing standards and additional categorical standards of independence adopted by the Board and set forth in such Guidelines, which can be found on our website at www.familydollar.com under the "Investor Relations" link (see "Corporate Governance" on the "Investor Relations" page). Under our Corporate Governance Guidelines, a director will not be considered independent if the director:
• | has been employed by Family Dollar, its subsidiaries or affiliates within the last four years; |
• | has received, during the current year, or any of the three immediately preceding years, remuneration, directly or indirectly, other than de minimis remuneration (as defined below), as a result of service (other than as a director of a customer or supplier) as (i) an advisor, consultant or legal counsel to Family Dollar or to a member of our senior management; or (ii) a significant customer or supplier of Family Dollar; |
• | has any personal services contracts with Family Dollar or any member of our senior management; |
• | is an officer or employee of a not-for-profit entity that receives significant contributions from Family Dollar or serves any such entity in any capacity for which remuneration is received; |
• | has any investment in any entity in which Family Dollar also has an investment, other than equity or debt investments that are available to the public in governmental or public entities, or investments in any other entity in which neither the director nor Family Dollar or any of its parents, subsidiaries, or affiliates own an interest of 5% or more or exercises managerial control; |
• | has had any of the relationships described above with any affiliate of Family Dollar; or |
119
• | is a member of the immediate family of any person who fails to satisfy these qualifications. |
A director shall be deemed to have received remuneration (excluding remuneration as a director, such as remuneration provided to a Committee Chairman or Lead Director), directly or indirectly, if the Company, its subsidiaries or affiliates, has paid remuneration to any entity in which the director has a beneficial ownership interest of 5% percent equity or more, or to an entity by which the director is employed or self-employed other than as a director. De minimis remuneration is excluded from this rule. Remuneration is de minimis if such remuneration is (a) $60,000 or less in any fiscal year; or (b) if such remuneration is paid to an entity and (i) such remuneration did not exceed the lesser of $1 million, or 5% of the gross revenues of the entity during the entity's fiscal year and (ii) such remuneration did not directly result in a material increase in the compensation received by the director from that entity.
The Board has determined, after a review of the relationships between and among each of the directors, the Company and its officers, that Mark R. Bernstein, Pamela L. Davies, Sharon Allred Decker, Edward C. Dolby, Glenn A. Eisenberg, Edward P. Garden, George R. Mahoney, Jr., James G. Martin, Harvey Morgan and Dale C. Pond, who include the Lead Director and all the members of the Audit, Leadership Development and Compensation and Nominating/Corporate Governance committees, are independent, as defined by the NYSE listing standards and the categorical independence standards described above, and that no material relationships exist between any of the independent directors and Family Dollar other than by virtue of their being directors and stockholders.
In reaching its determination of independence, the Board reviewed each of the following transactions, relationships and arrangements. In each case, the Board determined that such transactions, relationships and arrangements did not impact any director's independence.
• | With respect to Mr. Mahoney, the Board considered that he was employed by the Company as General Counsel in 1976 and served as the Executive Vice President, General Counsel and Secretary of Family Dollar from 1991 until his retirement in May 2005. |
• | With respect to Dr. Davies, the Board considered the amount of charitable contributions made by our executive officers and immediate family members of our executive officers to charitable organizations of which she serves as an executive officer. |
• | With respect to Mr. Garden, the Board considered Mr. Garden's relationship with Trian Fund Management, L.P. and its affiliates, and such firm's ownership of approximately 7.32% of the common stock of the Company. The Board also considered the less than 1% ownership of PepsiCo, Inc. and less than 2.5% ownership of Mondelez International (formerly Kraft Foods), both of which are suppliers of the Company, by Trian Fund Management, L.P. and its affiliates. |
ITEM 14. PRINCIPAL ACCOUNTING FEES AND SERVICES
The firm of PricewaterhouseCoopers LLP ("PwC") served as the Company's independent registered public accountants to audit and report on the consolidated financial statements of Family Dollar and its subsidiaries for fiscal 2014. PwC served as our independent registered public accountants for the fiscal year ended August 31, 1991, and for each subsequent fiscal year.
Independent Registered Public Accounting Firm's Fees and Services
The following sets forth fees billed for the audit and other services provided by PwC for fiscal 2014 and fiscal 2013:
Fee Category | Fee Description | Fiscal 2014 Fees | Fiscal 2013 Fees | ||||
Audit Fees | Includes fees for audits of annual financial statements, reviews of the related quarterly financial statements, and for services normally provided in connection with statutory and regulatory filings or engagements. | $ | 1,582,400 | $ | 1,114,807 | ||
Audit-Related Fees | Includes fees for pre and post implementation reviews in connection with the enterprise resource planning re-implementation and issuance of special purpose reports. | 174,052 | — | ||||
Tax Fees | Includes fees for tax compliance, tax advice, and tax planning. | — | — | ||||
All Other Fees | Represents fees paid for access to PwC's accounting research database. | 1,800 | 1,800 | ||||
Total Fees | $ | 1,758,252 | $ | 1,116,607 | |||
120
All services rendered by PwC are permissible under applicable laws and regulations regarding the independence of the independent registered public accounting firm, and all such services were pre-approved by the Audit Committee. The Audit Committee Charter requires that the Audit Committee pre-approve the services to be provided by PwC; the Audit Committee has delegated pre-approval authority to the Chairman of the Audit Committee with respect to audit services and permitted non-audit services to be performed for the Company by its independent registered public accountants up to $150,000 (other than the annual engagement of the independent registered public accountants). The Audit Committee will review all such delegated pre-approvals at their next scheduled meeting.
121
PART IV
ITEM 15. EXHIBITS AND FINANCIAL STATEMENT SCHEDULES
(a) | Documents filed as part of this report: |
1. | See Part II—Item 8—"Financial Statements and Supplementary Data—Index to Consolidated Financial Statements," of this Report. |
2. | All schedules for which provision is made in the applicable accounting regulations of the SEC are not required under the related instructions, are inapplicable or the information is included in the Consolidated Financial Statements, and therefore, have been omitted. |
The Financial Statements of Family Dollar Stores, Inc., (Parent Company) are omitted because the registrant is primarily a holding company and all subsidiaries included in the consolidated financial statements being filed, in the aggregate, do not have minority equity and/or indebtedness to any person other than the registrant or its consolidated subsidiaries in amounts which together exceed 5 percent of the total assets as shown by the most recent year-end consolidated balance sheet.
3. | The Exhibits listed below in item (b). |
(b) | The accompanying Index to Exhibits is incorporated herein by reference. |
122
SIGNATURES
Pursuant to the requirements of Section 13 or 15(d) of the Securities Exchange Act of 1934, the registrant has duly caused this report to be signed on its behalf by the undersigned, thereunto duly authorized.
FAMILY DOLLAR STORES, INC. | |||
(Registrant) | |||
Date: | October 29, 2014 | By | /s/ HOWARD R. LEVINE |
Howard R. Levine | |||
Chairman of the Board (Chief Executive Officer) | |||
Pursuant to the requirements of the Securities Exchange Act of 1934, this report has been signed by the following persons on behalf of the registrant and in the capacities and on the date indicated.
Signature | Title | Date | ||
/s/ HOWARD R. LEVINE | Chairman of the Board, Chief Executive Officer and Director (Principal Executive Officer) | October 29, 2014 | ||
Howard R. Levine | ||||
/s/ MARY A. WINSTON | Executive Vice President— Chief Financial Officer (Principal Financial Officer and Principal Accounting Officer) | October 29, 2014 | ||
Mary A. Winston | ||||
/s/ MARK R. BERNSTEIN | Director | October 29, 2014 | ||
Mark R. Bernstein | ||||
/s/ PAMELA L. DAVIES | Director | October 29, 2014 | ||
Pamela L. Davies | ||||
/s/ SHARON ALLRED DECKER | Director | October 29, 2014 | ||
Sharon Allred Decker | ||||
/s/ EDWARD C. DOLBY | Director | October 29, 2014 | ||
Edward C. Dolby | ||||
/s/ GLENN A. EISENBERG | Director | October 29, 2014 | ||
Glenn A. Eisenberg | ||||
/s/ EDWARD P. GARDEN | Director | October 29, 2014 | ||
Edward P. Garden | ||||
/s/ GEORGE R. MAHONEY, JR. | Director | October 29, 2014 | ||
George R. Mahoney, Jr. | ||||
/s/ JAMES G. MARTIN | Director | October 29, 2014 | ||
James G. Martin | ||||
/s/ HARVEY MORGAN | Director | October 29, 2014 | ||
Harvey Morgan | ||||
/s/ DALE C. POND | Director | October 29, 2014 | ||
Dale C. Pond | ||||
123
EXHIBIT INDEX
Exhibits incorporated by reference:
2.1 | Agreement and Plan of Merger, dated as of July 27, 2014, among Family Dollar Stores, Inc., and Dime Merger Sub, Inc. (filed as Exhibit 2.1 to the Company's Current Report on Form 8-K filed on July 28, 2014) | ||
2.2 | Amendment No. 1 to the Agreement and Plan of Merger, dated as of September 4, 2014, among Family Dollar Stores, Inc., Dollar Tree, Inc. and Dime Merger Sub, Inc. (filed as Exhibit 2.1 to the Company's Report on Form 8-K filed on September 5, 2014) | ||
3.1 | Restated Certificate of Incorporation, dated November 8, 2006 (filed as Exhibit 3.1 to the Company's Report on Form 10-K for the fiscal year ended August 26, 2006) | ||
3.2 | Bylaws of Family Dollar Stores, Inc., as amended through March 2, 2011 (filed as Exhibit 3.1 to the Company's Current Report on Form 8-K filed on March 3, 2011) | ||
4.1 | Sections FOURTH, SIXTH and SEVENTH of the Company's Restated Certificate of Incorporation (included as Exhibit 3.1) and Articles II, VII, VIII, XII and XIV of the Company's Bylaws (included as Exhibit 3.3) | ||
4.2 | Form of certificate representing shares of the Company's Common Stock (filed as Exhibit 4.2 to the Company's Form 10-K filing for the fiscal year ended August 27, 2005) | ||
4.3 | Rights Agreement, dated as of March 2, 2011, between Family Dollar Stores, Inc. and American Stock Transfer & Trust Company, LLC, which includes the Form of Certificate of Designation, Preferences and Rights of Series A Junior Participating Preferred Stock as Exhibit A and the Form of Right Certificate as Exhibit B (filed as Exhibit 4.1 to the Company's Current Report on Form 8-K filed on March 3, 2011) | ||
4.4 | Amendment No. 1, dated as of February 24, 2012, to the Rights Agreement, dated as of March 2, 2011, between Family Dollar Stores, Inc. and American Stock Transfer & Trust Company, LLC (filed as Exhibit 4.2 to the Company's Current Report on Form 8-K on February 24, 2012) | ||
4.5 | Amendment No. 2, dated as of November 16, 2012, to the Rights Agreement, dated as of March 2, 2011, as amended by Amendment No. 1, dated February 24, 2012, between Family Dollar Stores, Inc. and American Stock Transfer & Trust Company, LLC (filed as Exhibit 4.3 to the Company's Current Report on Form 8-K filed on November 16, 2012) | ||
4.6 | Rights Agreement, dated as of June 9, 2014, between Family Dollar Stores, Inc. and American Stock Transfer & Trust Company, LLC, which includes the Certificate of Designation, Preferences and Rights of Series A Junior Participating Preferred Stock as Exhibit A, the Form of Rights Certificate as Exhibit B and the Summary of Rights to Purchase Preferred Stock as Exhibit C (filed as Exhibit 4.1 to the Company's Current Report on Form 8-K filed on June 9, 2014) | ||
4.7 | Amendment No. 1 to Rights Agreement, dated as of July 27, 2014, between Family Dollar Stores, Inc. and American Stock Transfer & Trust Company, LLC (filed as Exhibit 4.1 to the Company's Current Report on Form 8-K filed on July 28, 2014) | ||
4.8 | Indenture between Family Dollar Stores, Inc. and U.S. Bank National Association, as trustee, dated as of January 28, 2011 (filed as Exhibit 4.4 to the Company's Form 10-Q for the quarter ended February 26, 2011) | ||
4.9 | First Supplemental Indenture between the Company and U.S. Bank National Association, as Trustee, dated as of January 28, 2011 (filed as Exhibit 4.1 to the Company's Current Report on Form 8-K filed with the SEC on January 28, 2011) | ||
4.10 | Form of Global Note 5.00% Senior Note due 2021 (included as part of Exhibit 4.5 above)(filed as Exhibit 4.1 to the Company's Current Report on Form 8-K filed with the SEC on January 28, 2011) | ||
10.1 | Note Purchase Agreement dated as of September 27, 2005, between Family Dollar Stores, Inc., Family Dollar, Inc., and the various purchasers named therein, relating to $169,000,000 5.41% Series 2005-A Senior Notes, Tranche A, due September 27, 2015; and, $81,000,000 5.24% Series 2005-A Senior Notes, Tranche B, due September 27, 2015 (filed as Exhibit 10.2 to the Company's Form 10-Q for the quarter ended February 27, 2010) | ||
10.2 | First Amendment dated as of November 17, 2010, to the Note Purchase Agreement dated as of September 27, 2005, between Family Dollar Stores, Inc. and the various purchasers named therein, relating to $169,000,000 5.41% Series 2005-A Senior Notes, Tranche A, due September 27, 2015 and $81,000,000 5.24% Series 2005-A Senior Notes, Tranche B, due September 27, 2015 (filed as Exhibit 10.4 to the Company's Form 10-Q for the quarter ended November 27, 2010) | ||
10.3 | $400 Million Credit Agreement dated as of November 17, 2010, by and among Family Dollar Stores, Inc. as Borrower, Wells Fargo Bank, National Association, as Administrative Agent, and the lenders party thereto (filed as Exhibit 10.5 to the Company's Form 10-Q for the quarter ended November 27, 2010) | ||
10.4 | First Amendment dated as of August 17, 2011, to the $400 Million Credit Agreement dated November 17, 2010, by and among Family Dollar Stores, Inc., as Borrower, and Wells Fargo Bank, National Association, as Administrative Agent, and the lenders party thereto (filed as Exhibit 10.31 to the Company's Form 10-K for the fiscal year ended August 27, 2011) | ||
124
10.5 | $350,000,000 Credit Agreement dated August 24, 2006, between the Company and Family Dollar, Inc., as Borrowers, and Wachovia Bank, National Association, as Administrative Agent, Swingline Lender and Fronting Bank, and various other Lenders named therein (filed as Exhibit 10 to the Company's Report on Form 8-K filed with the SEC on August 28, 2006) | ||
10.6 | Second Amendment dated as of November 17, 2010, to the Credit Agreement dated August 24, 2006, between the Family Dollar Stores, Inc., as Borrower, and Wells Fargo Bank, National Association (successor by merger to Wachovia Bank, National Association), as Administrative Agent, and various lenders named therein (filed as Exhibit 10.6 to the Company's Form 10-Q for the quarter ended November 27, 2010) | ||
10.7 | $250 million 364-Day Credit Agreement between the Company and Family Dollar, Inc., as Borrowers, and Wachovia Bank, National Association, as Administrative Agent and Swingline Lender, and various other lenders named therein (filed as Exhibit 10.3 to the Company's Form 10-Q for the quarter ended November 28, 2009) | ||
*10.8 | Summary of compensation arrangements of the Company's named executive officers for fiscal 2011 (filed under Item 5.02 in the Company's Current Report on Form 8-K filed with the SEC on October 15, 2010) | ||
*10.9 | Summary of compensation arrangements of the Company's named executive officers for fiscal 2012 (filed under Item 5.02 in the Company's Current Reports on Form 8-K filed with the SEC on September 9, 2011 and September 28, 2011) | ||
*10.10 | Summary of compensation arrangements of the Company's named executive officers for fiscal 2013 (filed under Item 5.02 in the Company's Current Reports on Form 8-K filed with the SEC on October 15, 2012) | ||
*10.11 | Summary of compensation arrangements of the Company's named executive officers for fiscal 2014 (filed under Item 5.02 in the Company's Current Report on Form 8-K filed with the SEC on October 21, 2013) | ||
*10.12 | Summary of compensation arrangements of the Company's named executive officers for fiscal 2015 (filed under Item 5.02 in the Company's Current Report on Form 8-K filed on October 16, 2014) | ||
*10.13 | Family Dollar Stores, Inc., 2006 Incentive Plan (filed as Appendix B to the Company's Definitive Proxy Statement filed with the SEC on December 7, 2010) | ||
*10.14 | Family Dollar Stores, Inc. 2006 Incentive Plan Guidelines for Annual Cash Bonus Awards (filed as Exhibit 10.2 to the Company's Form 10-Q for the quarter ended May 26, 2012) | ||
*10.15 | Retirement Agreement dated September 30, 2002, between the Company and Leon Levine (filed as Exhibit 10 to the Company's Report on Form 8-K filed with the SEC on October 2, 2002) | ||
*10.16 | Policy Regarding Tax Adjustments for Certain Severance Benefits (filed as Exhibit 10.2 to the Company's Report on Form 8-K filed with the SEC on November 21, 2008) | ||
*10.17 | Form of Indemnification Agreement between the Company and its Directors (filed as Exhibit 10.1 to the Company's Report on Form 8-K filed with the SEC on November 21, 2008) | ||
*10.18 | Employment Agreement effective October 7, 2008, between the Company and Howard R. Levine (filed as Exhibit 10.1 to the Company's Report on Form 8-K filed with the SEC on October 14, 2008) | ||
*10.19 | Employment Agreement effective December 28, 2012, between the Company and Howard R. Levine (filed as Exhibit 10.1 to the Company's Report on Form 8-K filed with the SEC on January 3, 2013) | ||
*10.20 | Employment Agreement between Michael K. Bloom and Family Dollar Stores, Inc. dated September 26, 2011 (filed as Exhibit 10.1 to the Company's Current Report on Form 8-K filed on September 28, 2011) | ||
*10.21 | Form of Severance Agreement for Executive Vice Presidents (filed as Exhibit 10.3 to the Company's Report on Form 8-K filed with the SEC on October 14, 2008) | ||
*10.22 | Form of Severance Agreement for Executive Vice Presidents (filed as Exhibit 10.1 to the Company's Report on Form 8-K filed with the SEC on October 15, 2012) | ||
*10.23 | Form of Severance Agreement for Senior Vice Presidents (filed as Exhibit 10.4 to the Company's Report on Form 8-K filed with the SEC on October 14, 2008) | ||
*10.24 | Form of Severance Agreement for Senior Vice Presidents (filed as Exhibit 10.36 to the Company's Form 10-K filed with the SEC on October 19, 2012) | ||
*10.25 | Medical Expense Reimbursement Plan, amended as of November 2, 2004 (filed as Exhibit 10(v) to the Company's Form 10-K for the fiscal year ended August 28, 2004) | ||
*10.26 | Family Dollar Stores, Inc., Executive Life Plan (filed as Exhibit 10.26 to the Company's Form 10-K for the fiscal year ended August 27, 2005) | ||
*10.27 | Relocation Policy applicable to executive officers of the Company (filed as Exhibit 10.27 to the Company's Form 10-K for the fiscal year ended August 27, 2005) | ||
*10.28 | Amended and Restated Family Dollar Compensation Deferral Plan (filed as Exhibit 10.3 to the Company's Form 10-Q for the quarter ended March 1, 2008) | ||
*10.29 | Family Dollar Stores Inc., 2006 Incentive Plan Directors' Share Awards Guidelines (filed as Exhibit 10.1 to the Company's Report on Form 8-K filed with the SEC on August 21, 2006) | ||
125
*10.30 | Family Dollar Stores Inc., 2006 Incentive Plan 2006 Non-Qualified Stock Option Grant Program (filed as Exhibit 10.3 to the Company's Report on Form 8-K filed with the SEC on January 25, 2006) | ||
*10.31 | Family Dollar Stores, Inc., 2006 Incentive Plan Guidelines for Long Term Incentive Performance Share Rights Awards (filed as Exhibit 10.3 to the Company's Form 10-Q for the quarter ended May 26, 2012) | ||
*10.32 | Form of Performance Share Rights Award Certificate Awards (filed as Exhibit 10.2 to the Company's Report on Form 8-K filed with the SEC on September 29, 2005) | ||
*10.33 | Stipulation and Agreement of Compromise, Settlement and Release (filed as Exhibit 10.1 to the Company's Report on Form 8-K filed with the SEC on June 26, 2007) | ||
*10.34 | Agreement dated September 28, 2011 between Family Dollar Stores, Inc. and Trian Fund Management, L.P., Trian Management GP, LLC, certain funds managed by Trian Management L.P. and Nelson Peltz, Peter W. May and Edward P. Garden (filed as Exhibit 10.1 to the Company's Current Report on Form 8-K filed on September 29, 2011) | ||
*10.35 | Severance Agreement between Mary A. Winston and Family Dollar Stores, Inc. dated April 5, 2012 (filed as Exhibit 10.1 to the Company's Current Report on Form 8-K filed on April 10, 2012) | ||
10.36 | $300 million Credit Agreement dated as of August 17, 2011, by and among Family Dollar Stores, Inc., as Borrower, and Wells Fargo Bank, National Association as Administrative Agent and the lenders party thereto (filed as Exhibit 10.31 to the Company's Form 10-K for the fiscal year ended August 27, 2011) | ||
10.37 | First Amendment dated as of February 20, 2013, to the $300 Million Credit Agreement dated August 17, 2011, by and among Family Dollar Stores, Inc., as Borrower, and Wells Fargo Bank, National Association as Administrative Agent and the lenders party thereto (filed as Exhibit 10.1 to the Form 10-Q for the quarter ended March 2, 2013) | ||
10.38 | Second Amendment dated as of February 20, 2013, to the $400 Million Credit Agreement dated November 17, 2010, by and among Family Dollar Stores, Inc., as Borrower, and Wells Fargo Bank, National Association, as Administrative Agent, and the lenders party thereto (filed as Exhibit 10.2 to the Company's Form 10-Q for the quarter ended March 2, 2013) | ||
10.39 | $300,000,000 Amended and Restated 4-Year Credit Agreement dated as of November 13, 2013, by and among Family Dollar Stores, Inc., as Borrower, Wells Fargo Bank, National Association, as Administrative Agent, and the lenders party thereto (filed as Exhibit 10.1 to the Company's Form 10-Q for the quarter ended November 30, 2013) | ||
10.40 | $600,000,000 Amended and Restated 5-Year Credit Agreement dated as of November 13, 2013, by and among Family Dollar Stores, Inc., as Borrower, Wells Fargo Bank, National Association, as Administrative Agent, and the lenders party thereto (filed as Exhibit 10.2 to the Company's Form 10-Q for the quarter ended November 30, 2013) | ||
*10.41 | Family Dollar Stores, Inc. Employee Stock Purchase Plan As Amended and Restated, Effective March 11, 2014.(filed as Exhibit 10.1 to the Company's Form 10-Q for the quarter ended March 1, 2014 | ||
*10.42 | Family Dollar Stores, Inc., Compensation Deferral Plan, as amended and restated effective January 1, 2014 (filed as Exhibit 10.1 to the Company's Form 10-Q for the quarter ended May 31, 2014) | ||
*10.43 | Family Dollar Stores, Inc., Domestic US Relocation Policy (Executive Homeowners), as amended and restated effective January 1, 2014. (filed as Exhibit 10.2 to the Company's Form 10-Q for the quarter ended May 31, 2014) | ||
*10.44 | Family Dollar Stores, Inc., Domestic US Relocation Policy (Executive Renters), as amended and restated effective January 1, 2014 (filed as Exhibit 10.3 to the Company's Form 10-Q for the quarter ended May 31, 2014) | ||
*10.45 | Family Dollar Stores, Inc., Executive Life Insurance Plan (filed as Exhibit 10.4 to the Company's Form 10-Q for the quarter ended May 31, 2014) | ||
*10.46 | Family Dollar Stores, Inc., Executive Supplemental Disability Income Plan (filed as Exhibit 10.5 to the Company's Form 10-Q for the quarter ended May 31, 2014) | ||
*10.47 | Retention Letter, dated as of July 27, 2014, among Family Dollar Stores, Inc., Dollar Tree, Inc. and Howard R. Levine (filed as Exhibit 10.1 to the Company's Current Report on Form 8-K filed on July 28, 2014) | ||
*10.48 | Family Dollar Stores, Inc. 2006 Incentive Plan Restricted Stock Unit Grant Program (filed as Exhibit 10.1 to the Company's Current Report on Form 8-K filed on October 16, 2014) | ||
*10.49 | Family Dollar Stores, Inc. 2006 Incentive Plan Fiscal 2015 Non-Qualified Stock Option Grant Program and Non-Qualified Stock Option Award Certificate (filed as Exhibit 10.2 to the Company's Current Report on Form 8-K filed on October 16, 2014) | ||
*10.50 | Summary of retention awards for the Company's named executive officers (filed under Item 5.02 in the Company's Current Report on Form 8-K filed on October 7, 2014) | ||
126
Exhibits filed herewith:
*10.1 | First Amendment effective November 1, 2014 to Family Dollar Stores, Inc., Compensation Deferral Plan, as amended and restated effective January 1, 2014 | ||
*10.2 | Family Dollar Stores, Inc. Retention Award Plan | ||
21 | Subsidiaries of the Company | ||
23 | Consent of Independent Registered Public Accounting Firm | ||
31.1 | Certification of Principal Executive Officer Pursuant to Rules 13a-14(a) and 15d-14(a) under the Securities Exchange Act of 1934, as adopted pursuant to Section 302 of the Sarbanes-Oxley Act of 2002 | ||
31.2 | Certification of Principal Financial Officer Pursuant to Rules 13a-14(a) and 15d-14(a) under the Securities Exchange Act of 1934, as adopted pursuant to Section 302 of the Sarbanes-Oxley Act of 2002 | ||
32 | Certification of Principal Executive Officer and Principal Financial Officer Pursuant to 18 U.S.C. Section 1350 as adopted pursuant to Section 906 of the Sarbanes-Oxley Act of 2002 | ||
101 | Financial statements from the annual report on Form 10-K of the Company for the year ended August 30, 2014, filed on October 29, 2014, formatted in XBRL: (i) the Consolidated Statements of Income, (ii) Consolidated Statements of Comprehensive Income, (iii) the Consolidated Balance Sheets, (iv) the Consolidated Statements of Shareholders' Equity, (v) the Consolidated Statements of Cash Flows and (vi) the Notes to Consolidated Financial Statements | ||
* | Exhibit represents a management contract or compensatory plan |
127