Attached files
| file | filename |
|---|---|
| 8-K - 8-K - UMB FINANCIAL CORP | d812432d8k.htm |
| EX-99.1 - EX-99.1 - UMB FINANCIAL CORP | d812432dex991.htm |
 Quality endures.
Third Quarter 2014
UMB Financial
Exhibit 99.2 |
 Cautionary Notice about Forward-Looking Statements
2
This presentation contains, and our other communications may contain,
forward-looking statements within the meaning of the Private Securities
Litigation Reform Act of 1995. These statements can be identified by the
fact that they do not relate strictly to historical or current facts. All forward-looking
statements
are
subject
to
assumptions,
risks,
and
uncertainties,
which
may
change
over
time
and
many
of
which
are
beyond
our
control.
You
should
not
rely
on
any
forward-looking
statement
as
a
prediction or guarantee about the future. Our actual future objectives, strategies,
plans, prospects, performance, condition, or results may differ materially
from those set forth in any forward-looking statement. Some of the
factors that may cause actual results or other future events, circumstances, or
aspirations to differ from those in forward-looking statements are described in
our Annual Report on Form
10-K
for
the
year
ended
December
31,
2013,
our
subsequent
Quarterly
Reports
on
Form
10-Q
or Current Reports on Form 8-K, or other applicable documents that are filed or
furnished with the Securities and Exchange Commission (SEC). Any
forward-looking statement made by us or on our behalf speaks only as of
the date that it was made. We do not undertake to update any forward-
looking statement to reflect the impact of events, circumstances, or results that
arise after the date that the statement was made. You, however, should
consult further disclosures (including disclosures of a forward-looking
nature) that we may make in any subsequent Quarterly Report on Form 10-Q, Current
Report on Form 8-K, or other applicable document that is filed or furnished
with the SEC. |
 Earnings Summary
$ in thousands, except per-share data; unaudited
3
3Q14
3Q13
2Q14
vs. 3Q13
vs. 2Q14
Net Interest Income
87,526
$
85,545
$
86,170
$
2.3
1.6
Noninterest Income
126,475
121,625
134,001
4.0
(5.6)
Total Revenue
214,001
207,170
220,171
3.3
(2.8)
Noninterest Expense
161,461
153,063
166,511
5.5
(3.0)
Operating Income
52,540
54,107
53,660
(2.9)
(2.1)
Provision for loan losses
4,500
6,500
5,000
(30.8)
(10.0)
Income before Taxes
48,040
47,607
48,660
0.9
(1.3)
Income Tax Expense
12,410
13,175
13,988
(5.8)
(11.3)
Net Income
35,630
$
34,432
$
34,672
$
3.5
2.8
Diluted EPS
0.78
$
0.83
$
0.76
$
(6.0)
2.6
Dividends per share
0.225
0.215
0.225
4.7
0.0
WASO
44,890,309
40,698,700
44,823,370
10.3
0.1
% variance |
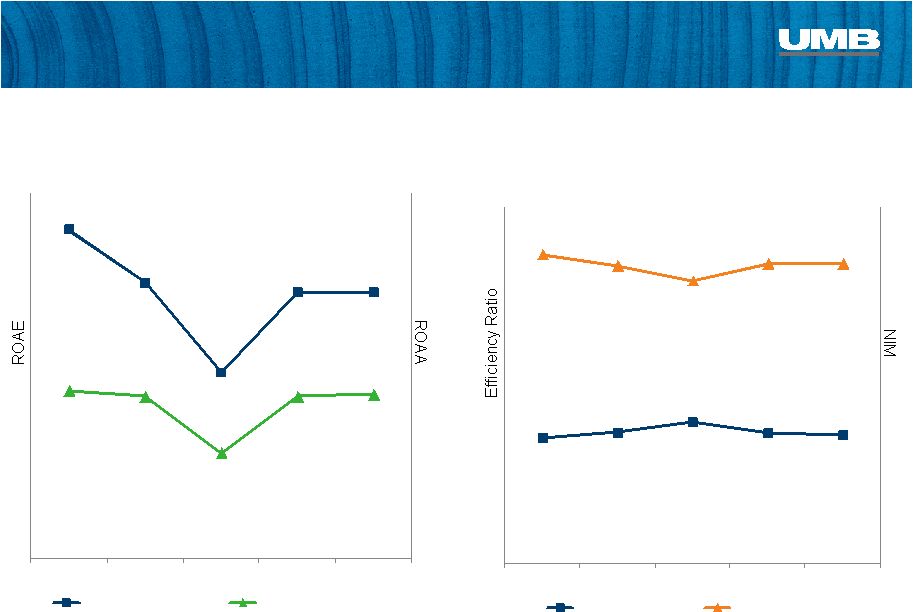 70.77%
73.64%
79.67%
73.32%
72.25%
2.61%
2.51%
2.39%
2.53%
2.53%
3Q'13
4Q'13
1Q'14
2Q'14
3Q'14
Efficiency Ratio
Net Interest Margin
10.84%
9.08%
6.13%
8.77%
8.77%
0.92%
0.89%
0.58%
0.89%
0.90%
3Q'13
4Q'13
1Q'14
2Q'14
3Q'14
Return on Avg Equity
Return on Avg Assets
Performance Metrics
ROAE/ROAA
Efficiency Ratio/NIM
4 |
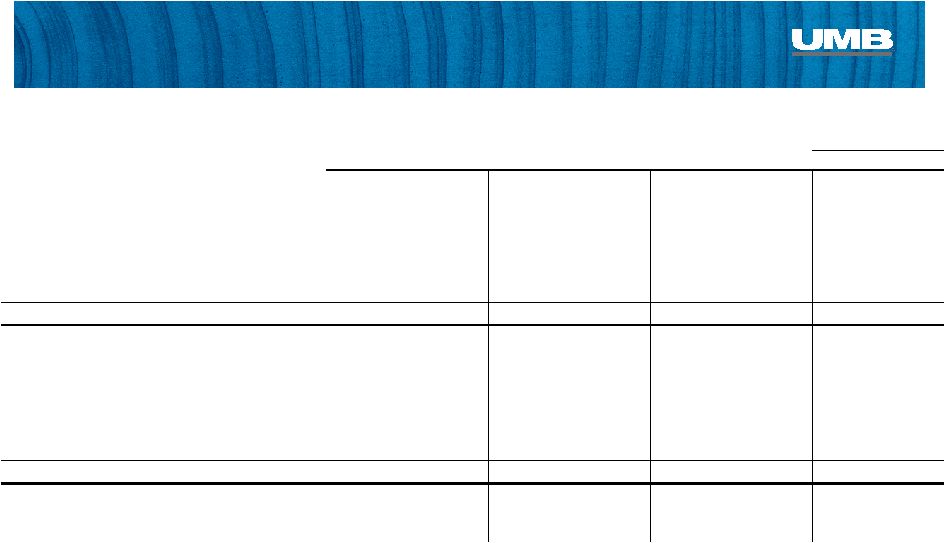 Select Balance Sheet Items
5
$ in thousands, average balances; unaudited
vs. 3Q'13
vs. 2Q'14
Avg. Balance
Avg. Balance
Avg. Balance
Assets
Loans, net of unearned interest
6,996,363
$
3.50
6,418,368
$
3.65
6,897,840
$
3.51
9.0
1.4
Total securities
6,992,618
1.92
6,985,343
1.99
6,940,448
1.97
0.1
0.8
Total earning assets
14,575,849
2.62
13,855,913
2.71
14,526,859
2.63
5.2
0.3
Allowance for loan losses
(77,347)
(72,792)
(75,929)
6.3
1.9
Total assets
15,638,322
$
14,923,769
$
15,618,192
$
4.8
0.1
Liabilities and Shareholders' Equity
Interest-bearing deposits
7,444,093
$
0.16
7,117,927
$
0.17
7,126,614
$
0.17
4.6
4.5
Total interest-bearing liabilities
8,797,486
0.15
8,886,697
0.16
8,725,371
0.17
(1.0)
0.8
Noninterest-bearing demand deposits
5,060,662
4,669,742
5,152,980
8.4
(1.8)
Shareholders' Equity
1,612,470
1,260,330
1,585,612
27.9
1.7
Total liabilities and shareholders' equity
15,638,322
$
14,923,769
$
15,618,192
$
4.8
0.1
Net interest spread
2.47
2.55
2.46
Net interest margin
2.53
2.61
2.53
% variance
3Q'14
3Q'13
2Q'14
Avg Yield
/ Rate %
Avg Yield
/ Rate %
Avg Yield
/ Rate % |
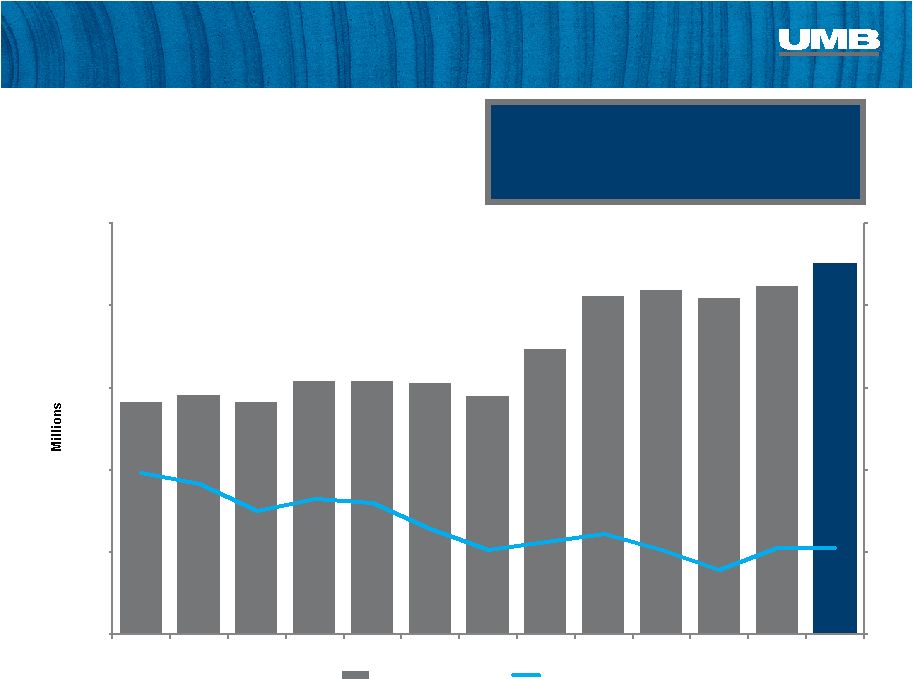
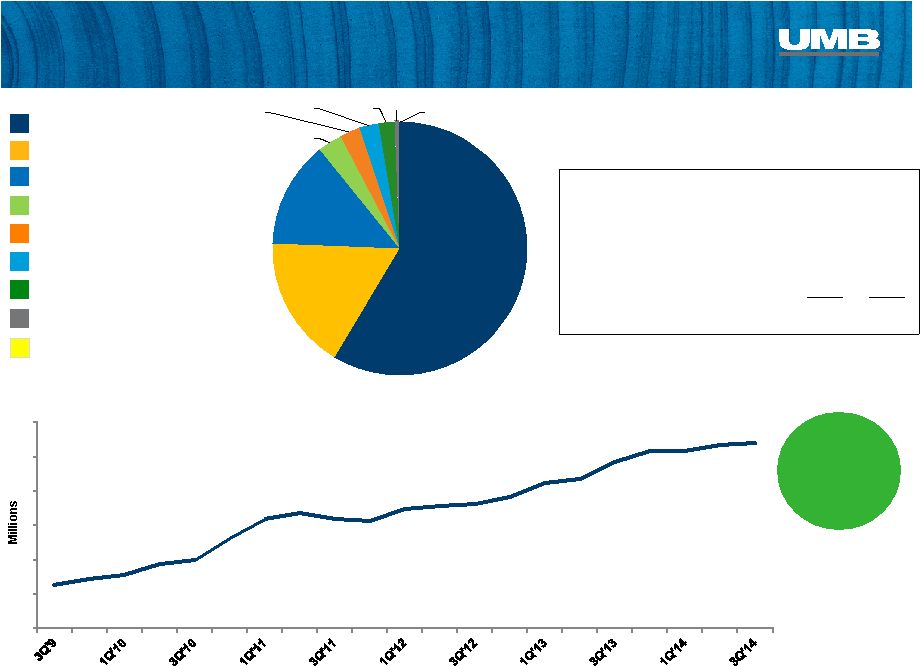
 Consistent Loan Growth
5 Year
CAGR
9.9%
6
Average Net Loans & Loan Yields
$4.6
$4.8
$5.3
$6.4
$7.0
4.92%
3.50%
3.0%
3.5%
4.0%
4.5%
5.0%
5.5%
6.0%
6.5%
7.0%
Average Net Loans
Average Loan Yield |
 Credit Quality Metrics
Net Charge-Offs
$ thousands
Nonperforming Loans
$ thousands
7
$3,209
$4,187
$3,737
$3,713
$3,985
0.20%
0.26%
0.23%
0.22%
0.23%
3Q'13
4Q'13
1Q'14
2Q'14
3Q'14
Net Charge-offs
NCOs/Avg Loans
$31,260
$30,706
$30,153
$27,175
$32,662
0.48%
0.47%
0.45%
0.39%
0.46%
3Q'13
4Q'13
1Q'14
2Q'14
3Q'14
Nonperforming Loans
NPLs/Loans |
 Net
Interest Income 8
+2.3%
Net Interest Income 3Q’14 vs. 3Q’13
•
Increased loan balances
$79.1
$79.5
$79.1
$80.4
$80.4
$80.2
$79.5
$82.3
$85.5
$85.9
$85.4
$86.2
$87.5
2.98%
2.91%
2.75%
2.82%
2.80%
2.64%
2.51%
2.56%
2.61%
2.51%
2.39%
2.53%
2.53%
$65.0
$70.0
$75.0
$80.0
$85.0
$90.0
3Q'11
4Q'11
1Q'12
2Q'12
3Q'12
4Q'12
1Q'13
2Q'13
3Q'13
4Q'13
1Q'14
2Q'14
3Q'14
Net Interest Income
NIM% |
 58.6%
17.1%
13.5%
3.0%
2.6%
2.5%
2.0%
0.7%
0.02%
Bankcard Fees
Noninterest Income Highlights
5 Year
CAGR
17.8%
Trust & Securities Processing Composition:
Equity Earnings/Alternatives
Trading & Investment Banking
Other
Deposit Service Charges
Trust & Securities Processing
Brokerage Fees
Gains on Sale of Securities
($ millions)
Insurance Fees
9
Source of income:
3Q'14
3Q'13
Institutional Investment Mgmt.
$33.7
$32.9
Asset Servicing
$22.6
$20.3
Bank (inst. & personal asset mgmt.
$17.7
$15.2
$74.1
$68.5
$32.6
$39.8
$51.9
$56.3
$68.5
$74.1
Trust & Securities Processing Revenue |
 Non-Int
Expense
5yr
CAGR
7.0%
0%
20%
40%
60%
80%
100%
$40
$60
$80
$100
$120
$140
$160
$180
Salary/Benefit Expense
Noninterest Income
Total Noninterest Expense
Coverage Ratio*
Noninterest Expense
Noninterest expense increased 5.5% to $161.5 million vs. 3Q’13
•
Salary and benefit expense increased $6.3 million or 7.5% compared to
3Q’13 •
Expense
for
contingent
consideration
liabilities
on
acquisitions
was
$2.2
million
in
3Q’14
compared
to
$1.1
million a year ago
Salary
5yr
CAGR
8.4%
Non-Int
Income
5yr
CAGR
9.5%
Managed FTE Costs; Growing Noninterest Income
10
* Noninterest Income/Noninterest Expense
Demonstrating Operating
Leverage |
    Average Balance, AFS:
$6.7 billion
Average Yield:
1.86%
Investment Mix
Securities Available for Sale,
At September 30, 2014
Agencies
High Quality Investment Portfolio
11
CDs & Corporates
Municipals
Mortgage-Backed Securities
Treasuries
AFS Portfolio Statistics
46.8%
29.1%
14.6%
2.0%
7.5%
Securities Gains
$ in thousands
3Q13
1,140
$
4Q13
(10)
$
1Q14
1,470
$
2Q14
2,569
$
3Q14
26
$
Roll off
Purchased
($ millions)
Yield
($ millions)
Yield
4Q'13
$308
2.04%
$355
0.64%
1Q'14
$528
1.53%
$618
1.26%
2Q'14
$275
2.23%
$560
1.35%
3Q'14
$244
1.98%
$311
1.45%
Scheduled Cash Flow
4Q'14
$272
2.08%
Next 12 months
$1,071
1.98%
Duration/Life
(in months)
at 09/30/14
at 06/30/14
Avg. Life Total
45.15
46.93
Duration Total
40.20
42.55 |
 Deposit Growth
Deposits & % of Free Funds
$ billions
3Q’14
Cost of Funds 0.15%
Including DDA 0.09%
12
$9.4
$13.0
$10.6
$12.8
38.5%
41.6%
43.2%
42.9%
$0.0
$2.0
$4.0
$6.0
$8.0
$10.0
$12.0
$14.0
Interest Bearing
Non-Interest Bearing |
 12.45
12.20
11.92
14.43
14.51
11.30
11.20
11.05
13.61
13.72
6.56
6.71
6.81
8.41
8.90
2010
2011
2012
2013
3Q14
Total Risk-Based Capital
Tier 1 Capital
Tier 1 Leverage
Strong Capital Position
Tier 1 Capital Ratio vs. Industry
3Q 2014
13
Average Equity
($ billions)
5 yr
CAGR
9.8%
Capital Ratio Trends
Industry Median as of 2Q14; Source: SNL Financial |
 Business Segment Updates |
 $8.3
$9.5
$10.4
$11.8
$12.5
32.7%
37.1%
40.4%
39.6%
40.5%
3Q'10
3Q'11
3Q'12
3Q'13
3Q'14
Interest Bearing
Non-Interest Bearing
$4.6
$4.8
$5.3
$6.4
$7.0
3Q'10
3Q'11
3Q'12
3Q'13
3Q'14
Bank
15
Average Net Loans
$ in billions
5 yr
CAGR
9.9%
5 yr
CAGR
10.9%
Average Deposits
$ in billions
Net loans grew for the 18 consecutive
quarter, increasing by 9.2% year-over-
year to $7.1 billion
Private Wealth managed AUM increased
13.5% totaling $7.6 billion in 3Q’14
compared to 3Q’13
Private Banking average loans increased
26.7% to $386.7 million vs. 3Q’13
3 Quarter 2014 Highlights
rd
th
Bank Operating Results
$ in 000s, unaudited
3 mos Ended
June 30,
Y/Y
LQ
2014
2013
2014
Net interest income
72,906
$
73,419
$
72,481
$
-0.7%
0.6%
Provision for loan losses
2,446
1,833
2,686
33.4%
-8.9%
Noninterest income
48,385
48,945
56,006
-1.1%
-13.6%
Noninterest expense
99,307
93,150
100,928
6.6%
-1.6%
NI before taxes
19,538
27,381
24,873
-28.6%
-21.4%
Income tax expense
5,081
6,922
7,211
-26.6%
-29.5%
Net income
14,457
$
20,459
$
17,662
$
-29.3%
-18.1%
pre-tax profit margin
16.1%
22.4%
19.4%
3 mos Ended
% Change
September 30, |
 Bank -
Lending
16
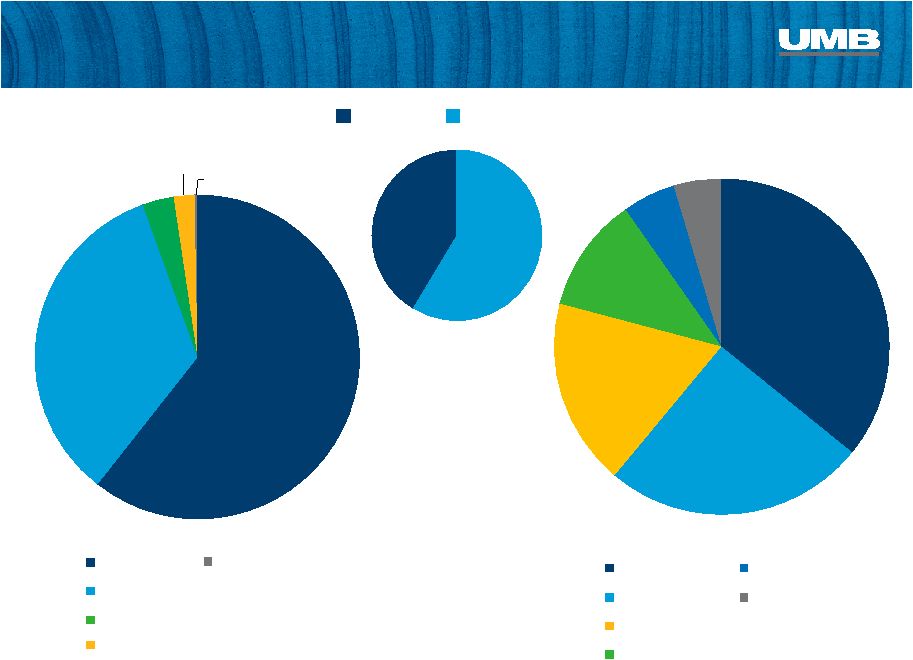
Diverse Loan Book
(Actual Loan Balances at September 30)
46.6%
53.8%
28.2%
25.4%
10.7%
$5.4B
$7.1B
8.9%
8.9%
$6.5B
6.1%
4.0%
4.5%
1.6%
$4.8B
1.3%
3Q'11
3Q'12
3Q'13
3Q'14
Commercial & Industrial*
Commercial Real Estate
Home Equity
Credit Card
Consumer Real Estate
Consumer -
Other
*includes C&I, real estate construction and leases
|
 Bank -
Deposits
Diverse Sources of Deposits
(Average Deposits for Three Months Ended September 30)
17
31.4%
32.5%
35.3%
25.1%
6.1%
7.8%
7.3%
6.9%
8.3%
6.3%
3.1%
6.5%
4.6%
3.4%
9.8%
4.8%
$9.5B
$10.4B
$11.8B
$12.5B
0.5%
0.3%
3Q'11
3Q'12
3Q'13
3Q'14
Commercial/Treasury Mgmt
Consumer Banking
Asset Servicing
Private Wealth Mgmt
Institutional Asset Mgmt
Healthcare Svcs
Small Business Banking
Inst. Banking & Investor Services
Other |
 Bank –
Commercial Banking
High Growth Regions
3Q’14 vs. 3Q’13
Commercial Loans By Region
Loan Balances
$ in billions, Average C&I and CRE Loan Balances for Three Months Ended
September 30 5 yr
CAGR
11.1%
18
48.0%
45.9%
44.1%
42.3%
42.2%
0%
50%
100%
3Q'10
3Q'11
3Q'12
3Q'13
3Q'14
KC
CO
STL
Greater MO
KS
OK
AZ
NE
TX
$3.57
$3.79
$4.23
$5.28
$5.75
3Q'10
3Q'11
3Q'12
3Q'13
3Q'14
•
Texas
+649.8%
•
Arizona
+37.4%
•
Kansas
+10.4% |
 Bank –
Private Wealth Mgmt. & Consumer Banking
19
$473
$512
$564
$573
$629
$470
$524
$604
$652
$733
50.1%
49.4%
48.3%
46.8%
46.2%
3Q '10
3Q '11
3Q '12
3Q '13
3Q '14
Balances
Unused Commitments
Utilization
Home Equity Lines of Credit
$ in millions
$0.94B
$1.04B
$1.17B
$1.23B
$1.36B
$5,366
$6,390
$7,044
$7,376
$7,565
$7,562
$2,035
$2,219
$2,853
$3,195
$3,326
$3,515
$188
$226
$351
$364
$393
$394
2011
2012
2013
1Q'14
2Q'14
3Q'14
Private Wealth & Institutional Asset Mgmt
Prairie Capital Management
Brokerage Assets
Assets Under Management
$ in millions
$8.8B
$10.2B
$10.9B
$11.3B
$11.5B
$7.6B |
 $29.3
$31.2
$32.2
$32.4
$30.6
3Q'13
4Q'13
1Q'14
2Q'14
3Q'14
Institutional Investment Management
20
Total Scout Assets Under Management
$ in billions
AUM increased 4.5% to $30.6
billion compared to 3Q’13
Extended employment
agreements with key principals of
Reams and look forward to
continued growth with one of the
industry’s most respected fixed
income teams
3 Quarter 2014 Highlights
rd
Institutional Investment Management Operating Results
$ in 000s, unaudited
3 mos Ended
June 30,
Y/Y
LQ
2014
2013
2014
Net Interest income
-
$
(11)
$
(1)
$
100.0%
100.0%
Noninterest income
33,919
33,842
33,999
0.2%
-0.2%
Noninterest expense
20,910
21,054
22,111
-0.7%
-5.4%
NI before taxes
13,009
12,777
11,887
1.8%
9.4%
Income tax expense
3,350
3,506
3,375
-4.4%
-0.7%
Net income
9,659
$
9,271
$
8,512
$
4.2%
13.5%
pre-tax profit margin
38.4%
37.8%
35.0%
September 30,
% Change
3 mos Ended |
  AUM
Drivers $ in millions
$230.7
$996.1
Total Change
($millions)
$32,394.3
$32,163.5
Total AUM
($millions)
Institutional Investment Management
21
$2,994.8
$29,308.9
$1,858.5
$31,167.4
($1,767.0)
$30,627.3 |
 Total AUM
$30.6B
$19.9B
$19.7B
Institutional Investment Management
22
$23.5B
$31.2B
Equity Mutual Funds
Equity Institutional & Other
Money Market
Fixed Income Institutional & Other
Fixed Income Mutual Funds |
 35.9%
25.2%
18.1%
11.1%
5.1%
4.6%
AUM by Strategy –
As of 3Q’14
Equity Strategies
International
Mid Cap
International ADR
Emerging Markets
Global
Small Cap
Other:
23
Fixed Income Strategies
Core Plus
Low Duration
Long Duration
Core
Intermediate
Unconstrained
Unconstrained UCITS
Real Return
Equity
Fixed Income
59%
41%
60.6%
33.9%
3.2%
2.0%
0.3%
Other:
Large Cap
Equity Opportunity
Global Aggregate |
 $1.06
$1.08
$1.31
$1.36
$1.29
$1.26
$1.58
$1.48
$1.37
$1.38
$1.79
$1.72
$1.64
$1.63
$2.10
$2.18
$2.11
$14.3
$16.3
$15.4
$16.4
$18.6
Purchase Volume ($ billions)
Interchange ($ millions)
Payment Solutions
Total Card Purchase Volume
& Interchange Revenue
24
Durbin
effective
Credit and debit card purchase
volume increased 28.5% vs.
3Q’13 to $2.11 billion
HSA deposits and assets grew by
nearly 40% vs. 3Q’13 to $892.6
million
Healthcare payer-to-provider
purchase volume surpassed $1
billion YTD during the 3 quarter
3 Quarter 2014 Highlights
rd
rd
Payment Solutions Operating Results
$ in 000s, unaudited
3 mos Ended
June 30,
Y/Y
LQ
2014
2013
2014
Net interest income
13,442
$
11,587
$
12,390
$
16.0%
8.5%
Provision for loan losses
2,054
4,667
2,314
-56.0%
-11.2%
Noninterest income
21,579
18,409
21,219
17.2%
1.7%
Noninterest expense
22,056
21,658
24,603
1.8%
-10.4%
NI before taxes
10,911
3,671
6,692
197.2%
63.0%
Income tax expense
2,795
1,283
1,910
117.8%
46.3%
Net income
8,116
$
2,388
$
4,782
$
239.9%
69.7%
pre-tax profit margin
31.2%
12.2%
19.9%
% Change
September 30,
3 mos Ended |
 Payment Solutions
25
Healthcare Purchase Volume Trends
$millions
* Interchange revenue from Healthcare cards divided by purchase volume on
Healthcare cards 6.8%
8.9%
16.9%
23.4%
22.7%
32.5%
37.7%
$261.5
$252.3
$512.2
$461.2
$393.8
$350.0
$682.2
$536.4
$448.0
$421.4
$881.3
$748.6
$680.2
$649.1
$1,150.0
$1,152.1
$1,082.9
0.44%
0.38%
0.39%
0.34%
0.31%
0.20%
0.25%
0.30%
0.35%
0.40%
0.45%
Payer-to-Provider Volume
Other Healthcare Volume
Effective Interchange Rate * |
 $84.2
$125.1
$169.8
$255.2
$298.5
$399.6
$595.0
$824.8
$16.7
$15.4
$20.9
$24.7
$24.9
$30.9
$47.4
$67.8
2005
2006
2007
2008
2009
2010
2011
2012
2013
3Q '14
HSA Deposits
HSA Assets
Payment Solutions
26
Healthcare Deposits and Assets
$millions
$36.6M
$65.8M
$100.8M
$140.5M
$190.7M
$279.9M
$323.3M
$430.5M
$642.4M
$892.6M
Healthcare
provided
6.5% of Total
Avg. Deposits
in 3Q’14 |
 Asset Servicing
27
Assets Under Administration
$billions
Investment Managers Series Trust
assets increased 6.6% in 3Q’14 and
>50% YTD
46 new fund accounting & administration
clients have been added during the past
12 months, increasing AUA in that
business by 22.6%
3 Quarter 2014 Highlights
rd
Asset Servicing Operating Results
$ in 000s, unaudited
3 mos Ended
June 30,
Y/Y
LQ
2014
2013
2014
Net interest income
1,178
$
550
$
1,300
$
114.2%
-9.4%
Noninterest income
22,592
20,429
22,777
10.6%
-0.8%
Noninterest expense
19,188
17,201
18,869
11.6%
1.7%
NI before taxes
4,582
3,778
5,208
21.3%
-12.0%
Income tax expense
1,184
1,464
1,492
-19.1%
-20.6%
Net income
3,398
$
2,314
$
3,716
$
46.8%
-8.6%
pre-tax profit margin
19.3%
18.0%
21.6%
% Change
September 30,
3 mos Ended |
 Asset Servicing
Fund Accounting & Administration
Alternative Asset Servicing
Custody
Transfer Agency
28
$35.9
$44.1
$48.4
$52.1
$58.2
$63.0
$66.8
$71.4
$71.4
160
179
181
182
196
219
229
238
242
2011
2012
1Q'13
2Q'13
3Q'13
4Q'13
1Q'14
2Q'14
3Q'14
Assets Under Administration
# of Funds Serviced
$24.7
$26.3
$27.9
$28.3
$29.3
$27.9
$27.1
$31.3
$31.0
467
532
543
549
551
514
512
592
583
2011
2012
1Q'13
2Q'13
3Q'13
4Q'13
1Q'14
2Q'14
3Q'14
Assets Under Administration
# of Funds Serviced
802.4
946.8
1,058.7
1,213.8
1,208.0
1,280.1
1,122.6
1,195.8
1,037.0
256
270
275
284
303
301
313
318
327
2011
2012
1Q'13
2Q'13
3Q'13
4Q'13
1Q'14
2Q'14
3Q'14
# of Shareholders
# of Funds Serviced
$115.6
$54.9
$58.5
$56.2
$62.9
$68.0
$65.6
$70.5
$61.8
499
443
432
400
416
411
432
438
443
2011
2012
1Q'13
2Q'13
3Q'13
4Q'13
1Q'14
2Q'14
3Q'14
Assets Under Administration
# of Custody Accounts |
 Building a company
for the next 100 years.
UMB Financial
Third Quarter 2014 |