Attached files
| file | filename |
|---|---|
| 8-K - TRUEBLUE, INC. FORM 8-K - TrueBlue, Inc. | tbiq32014earningsrelease.htm |
| EX-99.1 - PRESS RELEASE OF THE COMPANY DATED SEPTEMBER 26, 2014 - TrueBlue, Inc. | tbiq32014pressreleaseexhib.htm |
| EX-99.2 - EARNINGS RELEASE PRESENTATION - TrueBlue, Inc. | finalq3earningsresults10.htm |

Q4 2014 Investor Presentation

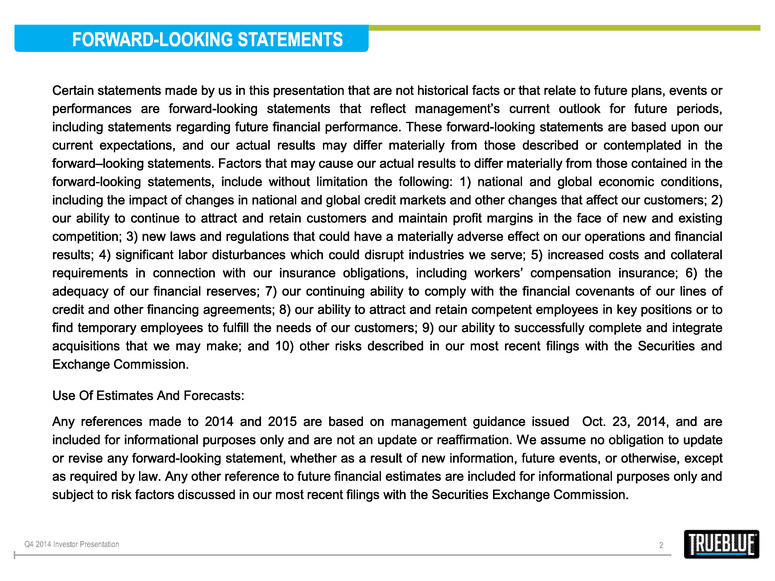
Q4 2014 Investor Presentation 2

2012 2013 2014F 2015F Revenue $2.7B* $2.2B 2014 Forecasted Revenue 2012 2013 2014F 2015F Adjusted EBITDA $150M* Q4 2014 Investor Presentation 3

Q4 2014 Investor Presentation 4 • • • • • • •

OUTSOURCING SOLUTIONS 1 • • • • • Q4 2014 Investor Presentation 5 STAFFING SOLUTIONS • • • • •

Q4 2014 Investor Presentation 6

• • • • • • • • • Late economic cycle Q4 2014 Investor Presentation 7 Compelling market trends driving growth Outsourcing on the rise Industry Highlights CAGR 14% CAGR 9% 2010- 2013 Industry Highlights Source: Staffing Industry Analysts, Everest Group, IBISWORLD, TrueBlue estimates Source: Staffing Industry Analysts and TrueBlue estimates

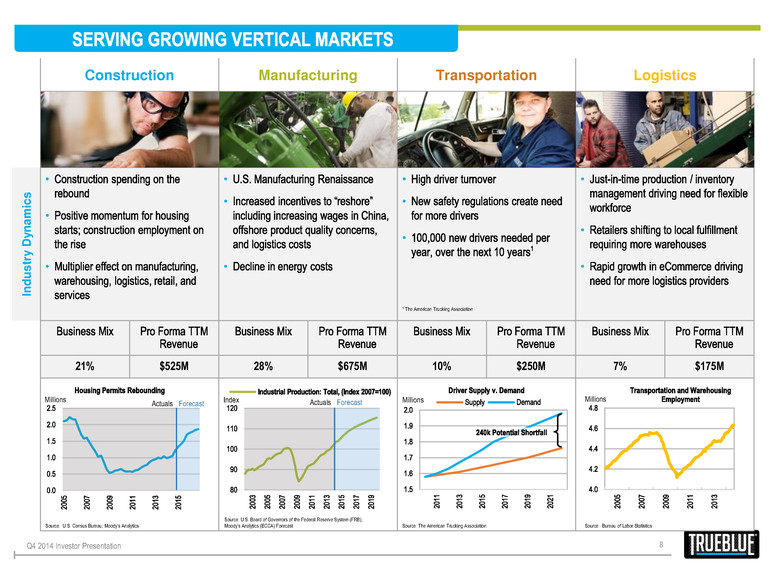
Construction Manufacturing Transportation Logistics In d u s tr y D y n a m ic s • • • • • • • • • • • • 21% $525M 28% $675M 10% $250M 7% $175M Residential Construction on the Rise Industrial Production in a Growth Cycle Driver Shortage Logistics At New Peak Q4 2014 Investor Presentation 8 Source: U.S. Census Bureau; Moody's Analytics Source: The American Trucking Association Source: U.S. Board of Governors of the Federal Reserve System (FRB); Moody's Analytics (ECCA) Forecast Actuals Forecast Millions Millions Actuals Forecast Index Millions Source: Bureau of Labor Statistics 1 The American Trucking Association

Q4 2014 Investor Presentation 9 • • • • • • • • • • •

Q4 2014 Investor Presentation 10 GROW MARKET LEADERSHIP Strategy Produces Results Strategy Increases Growth Opportunities • • • • • 1996 General Labor On Demand 2004-2005 Manufacturing & Skilled Construction Trades Staffing 2007-2008 Transportation & Logistics Staffing 2010-2013 Expand Geographic Reach Source: Staffing Industry Analysts, Moody’s economic forecasts, TrueBlue estimates 2014 Outsourcing Solutions

Q4 2014 Investor Presentation 11 • • • • • Benefits of Expansion On-Premise Workforce Management Recruitment Process Outsourcing Managed Service Provider 1 Source: International Data Corporation

Q4 2014 Investor Presentation 12 Technology Enabled Service Delivery and Processes Technology and Efficiency Yields Value • • • Electronic pay Mobile Dispatch Online Recruiting Process Centralization Innovation Driving More Business Efficiency Online Recruiting • • Process Centralization • •

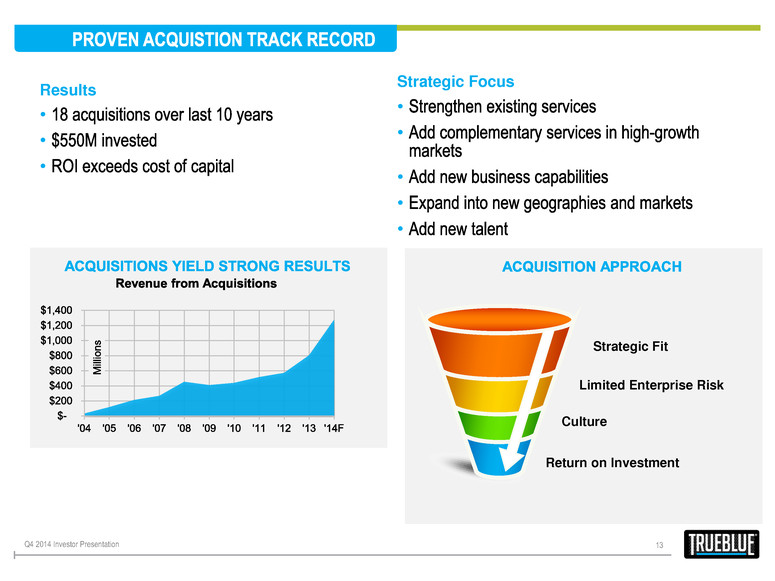
Q4 2014 Investor Presentation 13 Strategic Focus • • • • • Results • • • Strategic Fit Limited Enterprise Risk Culture Return on Investment

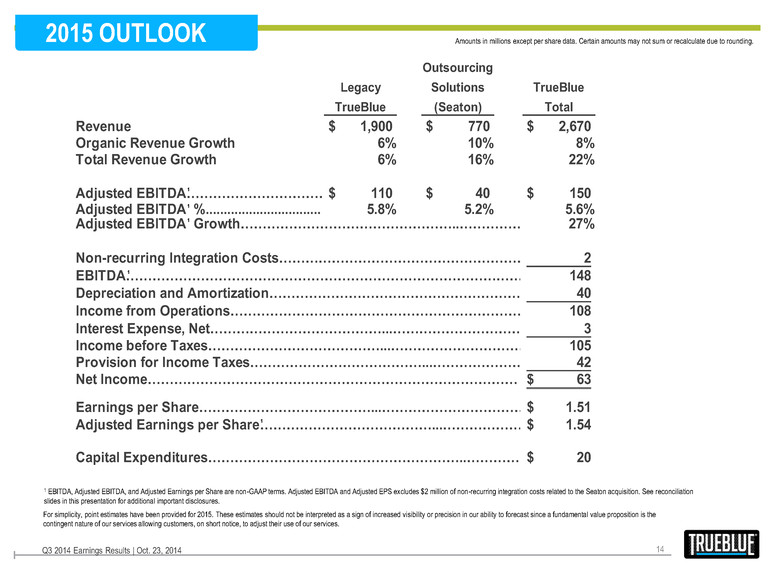
2015 OUTLOOK Amounts in millions except per share data. Certain amounts may not sum or recalculate due to rounding. Q3 2014 Earnings Results | Oct. 23, 2014 14 1 EBITDA, Adjusted EBITDA, and Adjusted Earnings per Share are non-GAAP terms. Adjusted EBITDA and Adjusted EPS excludes $2 million of non-recurring integration costs related to the Seaton acquisition. See reconciliation slides in this presentation for additional important disclosures. 1 1 1 1 Legacy TrueBlue Outsourcing Solutions (Seaton) TrueBlue Total Revenue 1,900$ 770$ 2,670$ Organic Revenue Growth 6% 10% 8% Total Revenue Growth 6% 16% 22% Adjusted EBITDA…………………………………………………110$ 40$ 150$ Adjusted EBITDA %..........................................................5 8% 5.2% 5.6% Adjusted EBITDA Growth…………………………………………..………………………..27% Non-recurring Integration Costs………………………………………………………………………………………….2 EBITDA………………………………………………………………………………………………………………………………..148 Depreciation and Amortization………………………………………………………………………………………….40 Income from Operations………………………………………………………………………………………….108 Interest Expense, Net…………………………………...…………………………………...…………………………………...…………………………………...…………………………………...……………………………………3 Income before Taxes…………………………………...…………………………………...…………………………………...…………………………………...…………………………………...……………………………………105 Provision for Income Taxes…………………………………...…………………………………...…………………………………...…………………………………...…………………………………...……………………………………42 Net Income………………………………………………………………………… 63$ Earnings per Share…………………………………...…………………………………...…………………………………...…………………………………...…………………………………...……………………………………1.51$ Adjusted Earnings per Share…………………………………...…………………………………...…………………………………...…………………………………...…………………………………...……………………………………1.54$ Capital Expenditures…………………………………………………..…………………………………………..20$ 1 For simplicity, point estimates have been provided for 2015. These estimates should not be interpreted as a sign of increased visibility or precision in our ability to forecast since a fundamental value proposition is the contingent nature of our services allowing customers, on short notice, to adjust their use of our services.

Q4 2014 Investor Presentation 15 • • • • • • •
