Attached files
| file | filename |
|---|---|
| 8-K - FORM 8-K - WELLS FARGO & COMPANY/MN | d803270d8k.htm |
| EX-99.1 - EX-99.1 - WELLS FARGO & COMPANY/MN | d803270dex991.htm |
 3Q14 Quarterly Supplement
October 14, 2014
©
2014 Wells Fargo & Company. All rights reserved.
Exhibit 99.2 |
 Wells Fargo
3Q14 Supplement 1
Appendix
-
Non-strategic/liquidating loan portfolio
22
-
Purchased credit-impaired (PCI) portfolios
23
-
Residential mortgage trends
24
-
Real estate 1-4 family first mortgage portfolio
25
-
Real estate 1-4 family junior lien mortgage portfolio
26
-
Consumer credit card portfolio
27
-
Auto portfolios
28
-
Student lending portfolio
29
Common Equity Tier 1 under Basel III (General
Approach)
30
Common Equity Tier 1 under Basel III (Advanced
Approach, fully phased-in)
31
Forward-looking statements and
additional information
32
Table of contents
3Q14 Results
-
3Q14 Highlights
Page 2
-
Year-over-year results
3
-
Strong revenue diversification
4
-
Balance Sheet and credit overview (linked quarter)
5
-
Income Statement overview (linked quarter)
6
-
Loans
7
-
Broad-based, year-over-year loan growth
8
-
Commercial and Industrial diversified loan growth
9
-
Deposits
10
-
Net interest income
11
-
Noninterest income
12
-
Noninterest expense and efficiency ratio
13
-
Community Banking
14
-
Wholesale Banking
15
-
Wealth, Brokerage and Retirement
16
-
Credit quality
17
-
Capital position
18
-
Capital return
19
-
Summary
20
Financial information for certain periods prior to 2014 was revised to reflect our
determination that certain factoring arrangements did not qualify as loans.
Accordingly, we revised our commercial loan balances for year-end 2012 and each of the
quarters in 2013 in order to present the Company’s lending trends on a comparable
basis over this period. This revision, which resulted in a reduction to total commercial loans and a corresponding decrease to other liabilities, did
not impact the Company’s consolidated net income or total cash flows. We reduced our
commercial loans by $3.5 billion, $3.2 billion, $2.1 billion, $1.6 billion, and $1.2
billion at December 31, September 30, June 30, and March 31, 2013, and December 31, 2012, respectively, which represented less than 1% of total
commercial loans and less than 0.5% of our total loan portfolio. Other affected financial
information, including financial guarantees and financial ratios, has been
appropriately revised to reflect this revision.
Pages 21-32 |
 Wells Fargo
3Q14 Supplement 2
3Q14 Highlights
Strong earnings of $5.7 billion, up $151 million,
or 3% year-over-year (YoY), and stable linked
quarter (LQ)
Diluted earnings per common share of $1.02, up
3% YoY and 1% LQ
Balanced revenue
-
Net interest income up 1% LQ
-
Noninterest income stable LQ
Solid loan and deposit growth, with core loans
(1)
up 2% and deposits up 1% LQ
Pre-tax pre-provision profit (PTPP)
(2)
up 1% LQ
Provision expense up $151 million LQ as lower net
charge-offs were more than offset by a lower
reserve release
Strong capital position and shareholder return
-
Returned $3.6 billion to shareholders through
common stock dividends and net share
repurchases including $1.0 billion forward share
repurchase expected to settle in 4Q14
Wells Fargo Net Income
($ in millions)
(1)
Diluted earnings per common share
$0.99
$1.00
$1.05
$1.01
$1.02
5,578
5,610
5,893
5,726
5,729
3Q13
4Q13
1Q14
2Q14
3Q14
(2)
See pages 7 and 22 for additional information regarding core loans and the
non-strategic/liquidating portfolio, which is comprised of Pick-a-Pay, liquidating
home equity, legacy WFF indirect auto, legacy WFF debt consolidation, Education
Finance-government guaranteed, and legacy Wachovia commercial & industrial,
commercial real estate, foreign and other PCI loan portfolios. At the end of 2Q14, $9.7 billion in Education Finance-government guaranteed loans
were transferred to loans held for sale. Pre-tax
pre-provision profit (PTPP) is total revenue less noninterest expense. Management believes PTPP is a useful financial measure because it enables
investors and others to assess the Company’s ability to generate capital to cover credit
losses through a credit cycle. |
 Wells Fargo
3Q14 Supplement 3
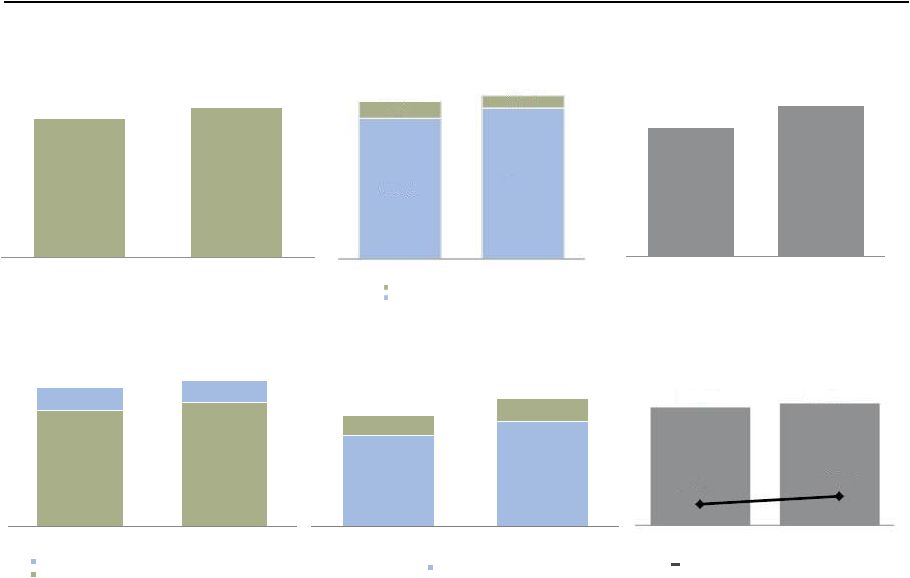
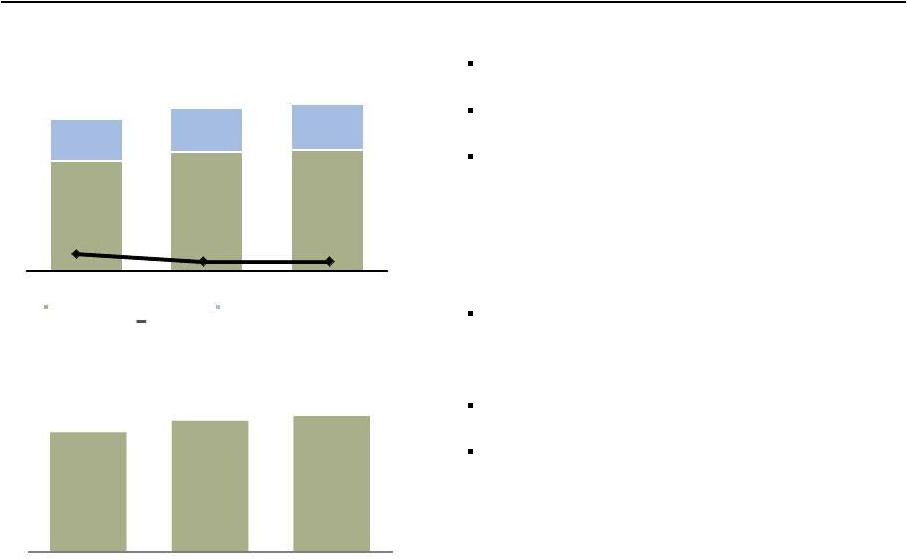
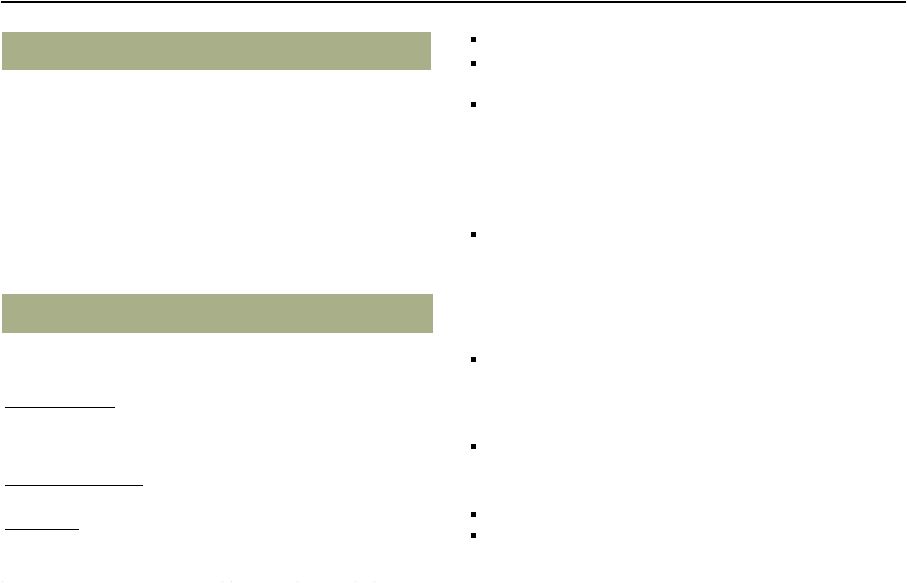
Year-over-year results
Pre-tax Pre-provision Profit
(2)
($ in millions)
Net Income
($ in millions, except EPS)
Diluted earnings per common share
Period-end Loans
(1)
($ in billions)
Net Interest Income
($ in millions)
Noninterest Income
($ in millions)
Period-end Deposits
($ in billions)
(1)
Please see page 1 for information on certain prior period revisions.
(2)
Pre-tax pre-provision profit (PTPP) is total revenue less noninterest expense.
Management believes PTPP is a useful financial measure because it enables investors and
others to assess the Company’s ability to generate capital to cover credit losses through a credit cycle.
Mortgage banking
Noninterest income excluding Mortgage banking
Core Deposits
10,748
10,941
3Q13
3Q14
8,376
8,965
3Q13
3Q14
8,122
8,639
1,608
1,633
9,730
10,272
3Q13
3Q14
947.8
1,016.5
94.1
114.1
1,041.9
1,130.6
3Q13
3Q14
$0.99
$1.02
5,578
5,729
3Q13
3Q14
725.0
775.8
84.1
63.1
809.1
838.9
3Q13
3Q14
Non-strategic/liquidating loans
Core loans |
 Wells Fargo
3Q14 Supplement 4
Balanced Spread and
Fee Income
Diversified Fee Generation
Deposit Service Charges
13%
Card Fees
9%
Total Mortgage Banking
16%
Insurance
4%
Net Gains from Trading
2%
All data is for 3Q14.
(1) Other noninterest income includes lease income, life insurance investment income and
all other noninterest income. Strong revenue diversification
Total Trust & Investment Fees 35%
Total Other Fees
10%
Net Gains from Equity Inv.
7%
Net Interest
Income
Noninterest
Income
Other Noninterest Income
(1)
2%
Net Gains on Debt Securities
2%
$21.2
billion
$10.3
billion
Brokerage advisory,
commissions
and
other
Mortgage Orig./
Sales, net
Mortgage Servicing, net
Trust and investment
management
Investment banking
Charges and fees on loans
Merchant processing
1% Cash network
1% CRE brokerage commissions
1% Letters of credit
Card fees
Deposit service charges
Other noninterest income
(1)
Net gains from trading
Insurance
All other fees
Net gains from equity investments
Net gains on debt securities
13%
23%
8%
4%
9%
3%
2%
2%
7%
9%
4%
2%
2%
7%
2%
48%
52% |
 Wells Fargo
3Q14 Supplement 5
Balance Sheet and credit overview (linked quarter)
Loans
Core loans
(1)
increased $12.2 billion, or 6% annualized, LQ on broad-based growth
Non-strategic/liquidating portfolio
(1)
decreased $2.2 billion
Short-term investments/
Fed funds sold
Up $23.2 billion primarily due to deposit growth and liquidity-related actions
Investment securities
Up $9.9 billion as gross purchases of ~$25 billion were partially offset by run-off
Deposits
Up $12.0 billion on strong consumer and small business growth and liquidity-related
fundings
Long term debt
Up $16.7 billion including $16.3 billion in liquidity-related issuance
Common stock
repurchases
Common shares outstanding down 34.9 million on net share repurchases
Purchased 48.7 million common shares in the quarter and entered into a $1.0 billion
forward
repurchase
transaction
that
is
expected
to
settle
for
an
estimated
19.8
million shares in 4Q14
Credit
Provision expense of $368 million, up $151 million
-
Net charge-offs of $668 million, or 32 bps, down $49 million
-
$300 million reserve release
(2)
vs. $500 million in 2Q14 on strong credit
performance
Period-end balances. All comparisons are 3Q14 compared with 2Q14.
(1)
See pages 7 and 22 for additional information regarding core loans and the
non-strategic/liquidating portfolio, which is comprised of Pick-a-Pay,
liquidating home equity, legacy WFF indirect auto, legacy WFF debt consolidation, Education
Finance-government guaranteed, and legacy Wachovia commercial & industrial,
commercial real estate, foreign and other PCI loan portfolios. At the end of 2Q14, $9.7 billion in Education
Finance-government guaranteed loans were transferred to loans held for sale. (2) Provision expense minus net charge-offs. |
 Wells Fargo
3Q14 Supplement 6
Income Statement overview (linked quarter)
Total revenue
Revenue of $21.2 billion, up $147 million
Net interest income
NII up $150 million driven by growth in earning assets, PCI accretion income and one extra
day in the quarter
NIM down 9 bps to 3.06% reflecting deposit growth and liquidity-related funding
actions Noninterest income
Noninterest income stable
-
Service charges on deposit accounts and card fees each up $28 million
-
Trust and investment fees down $55 million as lower investment banking was partially
offset by higher retail brokerage asset-based fees and trust and investment
management fees
-
Mortgage banking down $90 million as lower servicing income was partially offset by
higher production revenue
-
Market
sensitive
revenue
(1)
up
$231
million
Noncontrolling interest
(Reduces Net Income)
Minority interest up $166 million LQ reflecting strong equity gains from venture capital
businesses
Noninterest expense
Noninterest expense up $54 million
-
Personnel
expense
down
$38
million
as
lower
employee
benefits
expense
(2)
more
than
offset higher salaries expense and higher commission and incentive compensation
-
Operating
losses
up
$53
million
primarily
from
higher
litigation
accruals
-
Outside professional services up $38 million
Income tax
Tax expense down $227 million reflecting tax benefits primarily due to charitable donations
of appreciated securities
All comparisons are 3Q14 compared with 2Q14.
(1) Consists of net gains from trading activities, debt securities and equity
investments. (2) Deferred compensation plan investment results are essentially
P&L neutral as the employee benefits expense is hedged with offsetting trading revenue.
•
Net gains from trading down $214 million on $163 million lower deferred
compensation
plan
investment
results
(2)
(offset
in
employee
benefits
expense) and lower customer accommodation trading results
•
Net gains from debt securities up $182 million
•
Net gains from equity investments up $263 million from venture capital
businesses |
 Wells Fargo
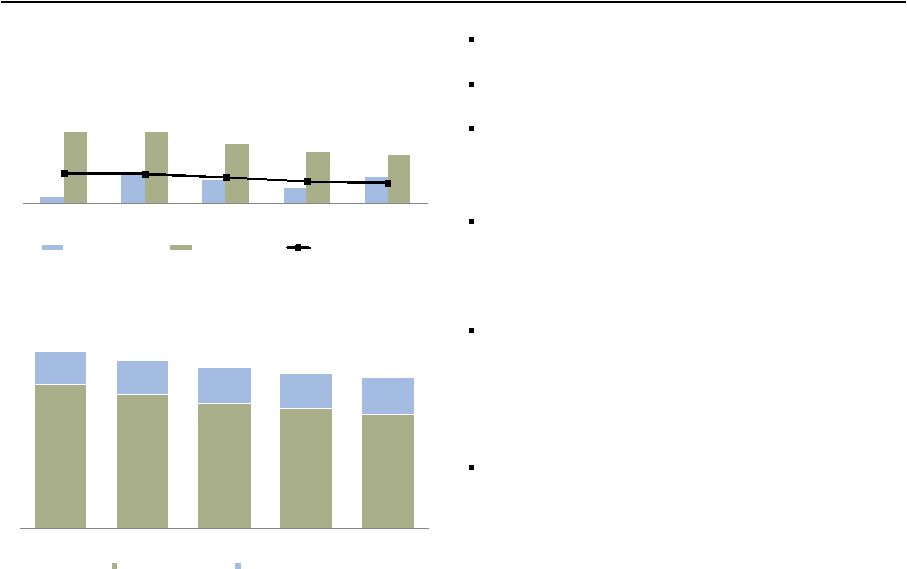
3Q14 Supplement 7
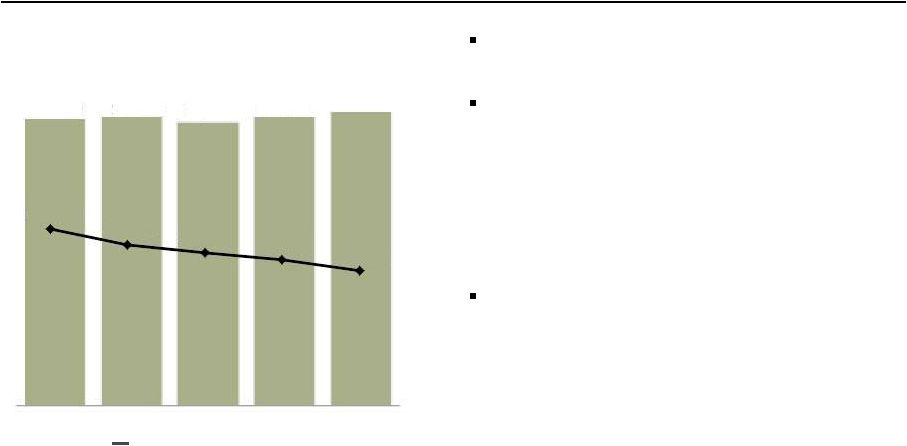
Loans
(1)
(1) Please see page 1 for information on certain prior period revisions.
(2) See page 22 for additional information regarding the non-strategic/liquidating
portfolio, which is comprised of Pick-a-Pay, liquidating home equity, legacy WFF
indirect auto, legacy WFF debt consolidation, Education Finance-government guaranteed, and
legacy Wachovia commercial & industrial, commercial real estate, foreign and other
PCI loan portfolios. At the end of 2Q14, $9.7 billion in Education Finance-government guaranteed loans were transferred to loans held for sale.
Period–end Loans Outstanding
($ in billions)
(2)
Total average loan yield
Period-end
-
Commercial loans up $5.1 billion LQ
driven by growth in C&I and real estate construction
-
Consumer loans up $7.1 billion LQ on
growth in nonconforming mortgage, auto and credit
card
Average
-
Excluding the 2Q14 period-end transfer of $9.7 billion in
student loans to held for sale, average loans would have
been up $12.0 billion, or 6% annualized, LQ
-
Core loan yield excluding the non-strategic/
liquidating portfolio was down 3 bps
-
Non-strategic/liquidating portfolio yield
of 5.46%
725.0
741.4
748.4
763.6
775.8
84.1
80.9
78.0
65.3
63.1
809.1
822.3
826.4
828.9
838.9
3Q13
4Q13
1Q14
2Q14
3Q14
Core loans
Non-strategic/liquidating loans
4.42%
4.36%
4.29%
4.28%
4.29%
Core loans grew $50.8 billion, or 7%, YoY and $12.2
billion, or 6% annualized, LQ
Non-strategic/liquidating loans
(2)
down $21.0 billion
YoY and $2.2 billion from 2Q14
Total average loans of $833.2 billion up $31.1 billion
YoY and $2.2 billion LQ
Total average loan yield of 4.29%, up 1 bp LQ |
 Wells Fargo
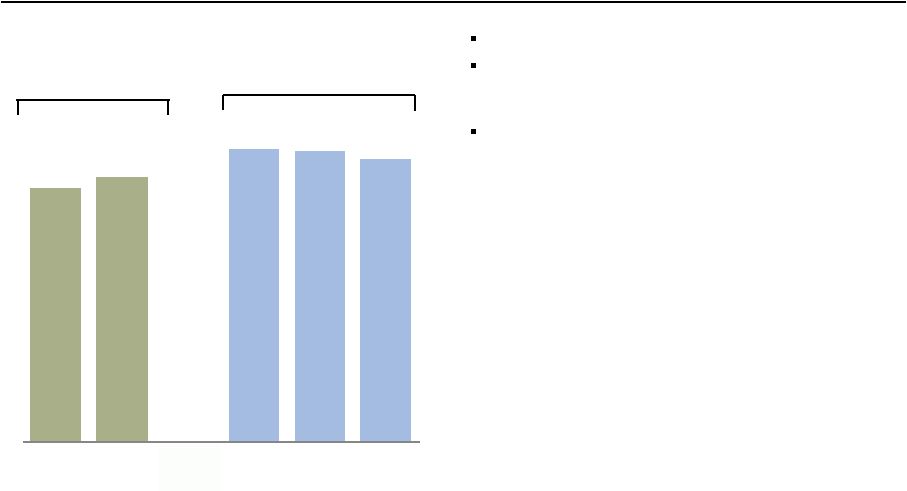
3Q14 Supplement 8
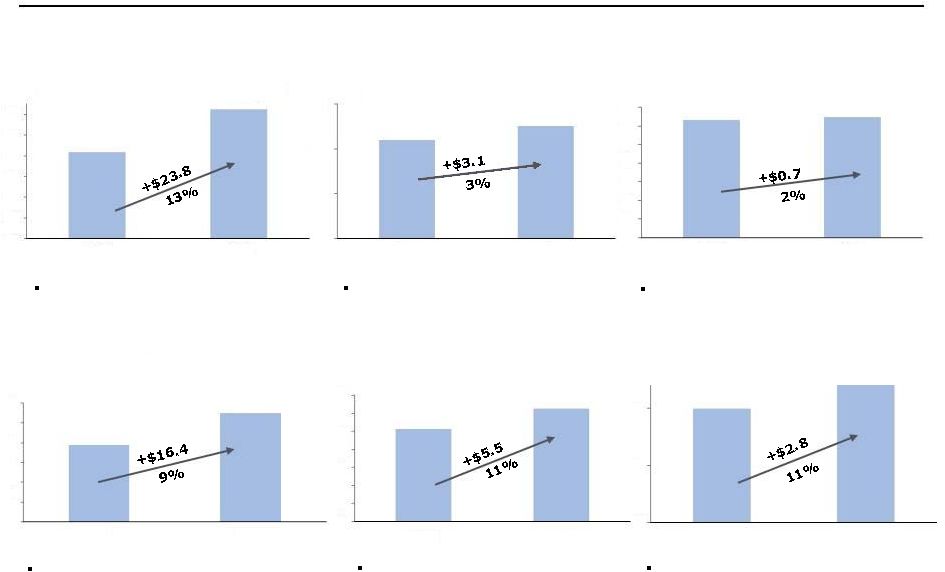
Broad-based, year-over-year loan
growth
Growth in nonconforming mortgage
Strong originations, up 9%
Continued account growth
($ in billions)
Broad-based growth, see page 9 for
additional information
Trade finance growth and 3Q13 U.K.
CRE acquisition
(1)
Please see page 1 for information on certain prior period revisions.
(2)
Please see page 25 for additional information.
New originations
150
160
170
180
190
200
210
3Q13
3Q14
16
21
26
3Q13
3Q14
100
110
120
130
3Q13
3Q14
24
29
34
39
44
49
54
59
3Q13
3Q14
15
20
25
30
35
40
45
50
3Q13
3Q14
150
160
170
180
190
200
210
3Q13
3Q14
Core 1-4 Family First
Mortgage
(2)
Credit Card
Commercial Real Estate
Automobile
Foreign
(1)
Commercial and Industrial
(1) |
 Wells Fargo
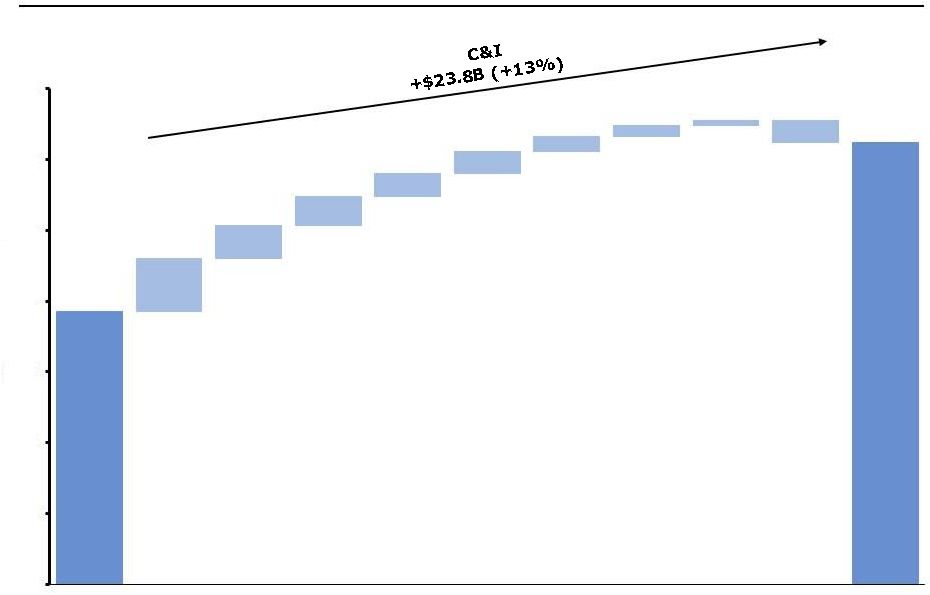
3Q14 Supplement 9
3Q13
3Q14
Corporate
Banking
Govt. &
Institutional
Banking
Commercial
Banking
CRE
All
Other
C&I
Commercial and Industrial diversified loan growth
WF
Capital
Finance
Equipment
Finance
Commercial
Dealer
Services
Period-end balances.
$188.6
212.4
$150
$160
$170
$180
$190
$200
$210
$220
Asset
Backed
Finance
$ |
 Wells Fargo
3Q14 Supplement 10
Deposits
Average
-
Average retail core deposits up 5% YoY on new
customer account growth and up 2%
annualized, LQ
Average Deposits and Rates
($ in billions)
Average deposit cost
Average Core Deposits
(1)
($ in billions)
Deposits up $101.5 billion, or 10%, YoY and $25.6
billion, or 9% annualized, LQ
Average deposit cost of 10 bps, stable LQ and down 2
bps YoY
Core deposits of $1.0 trillion up $71.9 billion, or 8%,
YoY and up $20.5 billion, or 8% annualized, LQ
Primary consumer checking customers
(2)
up a net
4.9% YoY
Primary small business and business banking checking
customers
(2)
up a net 5.6% YoY
746.4
805.6
819.1
279.2
295.9
308.0
1,025.6
1,101.5
1,127.1
3Q13
2Q14
3Q14
Interest-bearing deposits
Noninterest-bearing deposits
0.12%
0.10%
0.10%
940.3
991.7
1,012.2
3Q13
2Q14
3Q14
Period-end
Total period-end deposits of $1.1 trillion up $88.8
billion, or 9%, YoY and up $12.0 billion, or 4%
annualized, LQ
(1)
Core deposits are noninterest-bearing deposits, interest-bearing checking, savings
certificates, certain market rate and other savings, and certain foreign deposits
(Eurodollar sweep balances). (2)
Data as of August 2014, comparisons with August 2013; customers who actively use their
checking account with transactions such as debit card purchases, online bill payments,
and direct deposits. |
 Wells Fargo
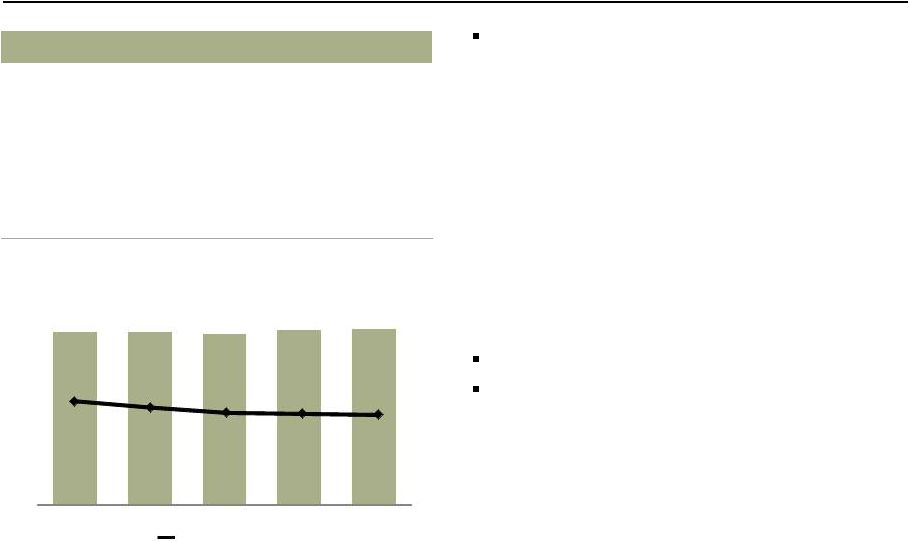
3Q14 Supplement 11
Net interest income (TE)
(1)
up $147 million LQ on
growth in earning assets, PCI accretion and one
additional day in the quarter
Average earning assets up $50.7 billion, or
4%, LQ
-
Short-term investments/fed funds sold up
$23.4 billion
-
Mortgages and loans held for sale up $12.0
billion
(3)
-
Investment securities up $9.8 billion
-
Trading assets up $3.1 billion
-
Loans up $2.2 billion
NIM of 3.06% down 9 bps from 2Q14 on:
-
Customer-driven deposit growth = (4) bps
-
Liquidity-related activity = (4) bps
-
Balance sheet repricing, growth and mix = (1) bp
-
Variable income = 0 bps
Net interest income
Net Interest Income (TE)
(1)
($ in millions)
Net Interest Margin (NIM)
(2)
10,949
11,022
10,832
11,016
11,163
3.39%
3.27%
3.20%
3.15%
3.06%
3Q13
4Q13
1Q14
2Q14
3Q14
(1)
Tax-equivalent net interest income is based on the federal statutory rate of 35% for the
periods presented. Net interest income was $10,748 million, $10,803 million, $10,615
million, $10,791 million and $10,941 million for 3Q13, 4Q13, 1Q14, 2Q14 and 3Q14
respectively.
(2)
Please see page 1 for information on certain prior period revisions. (3)
At the end of 2Q14, $9.7 billion in Education Finance-government guaranteed
loans were transferred to loans held for sale. |
 Wells Fargo
3Q14 Supplement 12
Noninterest income
Deposit service charges up $28 million LQ
Trust and investment fees down $55 million, or 2%,
LQ as higher retail brokerage asset-based fees and
trust and investment management fees were more
than offset by lower investment banking
Card fees up $28 million on higher transaction
volumes reflecting new customer growth
Other fees up $2 million as higher CRE brokerage
commissions were offset by the impact of the exit of
the direct deposit advance product
Mortgage banking down $90 million
Insurance down $65 million reflecting the impact of
the 2Q14 sale of insurance offices and seasonally
lower crop insurance
Trading gains down $214 million on $163 million
lower deferred compensation investment income (P&L
neutral) (($53) million in 3Q14 vs. $110 million in
2Q14) and lower customer accommodation trading
Debt gains up $182 million
Equity gains up $263 million from venture capital
businesses
Other income down $95 million from 2Q14 gain on
sale of 40 insurance offices
vs
vs
($ in millions)
3Q14
2Q14
3Q13
Noninterest income
Service charges on deposit accounts
$
1,311
2
%
3
Trust and investment fees
Brokerage advisory, commissions
and other fees
2,327
2
13
Trust and investment management
856
2
6
Investment banking
371
(24)
(7)
Card fees
875
3
8
Other fees
1,090
-
(1)
Mortgage banking
1,633
(5)
2
Insurance
388
(14)
(6)
Net gains from trading activities
168
(56)
(58)
Net gains on debt securities
253
n.m.
n.m.
Net gains from equity investments
712
59
42
Lease income
137
6
(14)
Life insurance investment income
143
4
(7)
Other
8
(92)
(78)
Total noninterest income
$
10,272
-
%
6
-
Gain on sale revenue up $266 million reflecting
higher gain on sale margin and higher repurchase
reserve releases
-
Net servicing income down $356 million reflecting
higher unreimbursed direct servicing costs and lower
net MSR hedge results
8,122
8,292
8,500
8,552
8,639
1,608
1,570
1,510
1,723
1,633
9,730
9,862
10,010
10,275
10,272
3Q13
4Q13
1Q14
2Q14
3Q14
Mortgage banking
Noninterest income excluding Mortgage banking |
 Wells Fargo
3Q14 Supplement 13
Noninterest expense and efficiency ratio
(1)
Noninterest expense up $54 million LQ
-
Personnel expense down $38 million
•
Salaries up $119 million reflecting one extra
day in the quarter and higher staffing levels
•
Commission and incentive compensation up
$82 million and included $45 million higher
revenue-based incentive compensation
•
Employee benefits expense down $239 million
and included $163 million lower deferred
compensation expense (($47) million vs.
$116 million in 2Q14)
-
Outside professional services
(2)
up $38 million
-
Other expense
(2)
up $36 million
•
Operating losses up $53 million on higher
litigation accruals
•
Foreclosed asset expense up $27 million
•
Insurance down $43 million on crop insurance
seasonality
Efficiency ratio improved LQ to 57.7%
Expect to operate within targeted efficiency ratio
range of 55%-59% in 4Q14
12,102
12,085
11,948
12,194
12,248
3Q13
4Q13
1Q14
2Q14
3Q14
59.1%
58.5%
57.9%
57.9%
57.7%
Efficiency Ratio
(1)
Efficiency ratio defined as noninterest expense divided by total revenue (net interest income
plus noninterest income). Noninterest expense and our efficiency ratio may be affected
by a variety of factors, including business and economic cyclicality, seasonality, changes in our business composition and operating environment,
growth in our business and/or acquisitions, and unexpected expenses relating to, among other
things, litigation and regulatory matters.
(2)
The sum of Outside professional services expense and Other expense ties to Other noninterest
expense in the Consolidated Statement of Income, pages 19 and 20 of the press release.
vs
vs
($ in millions)
3Q14
2Q14
3Q13
Noninterest expense
Salaries
$
3,914
3
%
-
Commission and incentive compensation
2,527
3
5
Employee benefits
931
(20)
(21)
Equipment
457
3
(3)
Net occupancy
731
1
-
Core deposit and other intangibles
342
(2)
(9)
FDIC and other deposit assessments
229
2
7
684
6
10
Other
(2)
2,433
2
10
Total noninterest expense
$
12,248
-
%
1
Outside professional services
(2) |
 Wells Fargo
3Q14 Supplement 14
Community Banking
Net income of $3.5 billion, up 4% YoY and 1% LQ
reflecting growth in both net interest income and
noninterest income
Regional Banking
(1)
Primary consumer checking customers
(2)
up a
net 4.9% YoY
Primary business checking customers
(2)
up a net
5.6% YoY
Retail bank cross-sell of 6.15 products per
household; strong net household growth
Consumer Lending
Credit card penetration
(1) (3)
rose to 39.7%, up
from 39.0% in 2Q14 and 36.0% in 3Q13
Consumer auto originations of $7.6 billion, down
3% LQ and up 9% YoY
Mortgage originations of $48 billion, up 2% LQ
-
70% of originations were purchases, up from 59% in
3Q13
-
1.82% gain on sale margin
vs
vs
($ in millions)
3Q14
2Q14
3Q13
Net interest income
$
7,472
1
%
3
Noninterest income
5,356
3
7
Provision for credit losses
465
67
94
Noninterest expense
7,051
-
-
Income tax expense
1,609
(12)
7
Segment net income
$
3,470
1
%
4
($ in billions)
Avg loans, net
$
498.6
(1)
-
Avg core deposits
646.9
1
5
3Q14
2Q14
3Q13
Regional Banking
Primary consumer checking customers
(1)(2)
4.9
%
4.6
3.9
Primary business checking customers
(1)(2)
5.6
5.2
3.6
Retail Bank household cross-sell
(1)
6.15
6.17
6.15
vs
vs
($ in billions)
3Q14
2Q14
3Q13
Consumer Lending
Credit card payment volumes (POS)
$
15.9
3
%
16
Credit card penetration
(1)(3)
39.7
70
bps
367
Home Lending
Applications
$
64
(11)
%
(26)
Application pipeline
25
(17)
(29)
Originations
48
2
(40)
Gain on sale margin
1.82
41
bps
40
(1)
Metrics reported on a one-month lag from reported quarter-end; for example 3Q14 data
as of August 2014 compared with August 2013. (2)
Customers who actively use their checking account with transactions such as debit card
purchases, online bill payments, and direct deposit. (3)
Household penetration as of August 2014 and defined as the percentage of retail
bank households that have a credit card with Wells Fargo. |
  Wells Fargo
3Q14 Supplement 15
Wholesale Banking
Net income of $1.9 billion, down 3% YoY and
2% LQ
Net interest income up 2% LQ reflecting average
loan growth of 3%
Noninterest income down 3% LQ on lower
investment banking and sales and trading, as well
as lower insurance (2Q14 sale of offices and
seasonality)
Noninterest expense up 1% LQ on higher
personnel expense
Cross-sell
Cross-sell of 7.2 products per relationship
(2)
up
from 7.0 in 3Q13
Treasury Management
Commercial card spend volume of $5.7 billion up
2% LQ and 15% YoY
Wholesale treasury management revenue up 1%
LQ and 9% YoY reflecting new product sales and
repricing
Investment Banking
U.S. investment banking market share
of 4.5%
(3)
Asset Management
Total AUM up $9 billion YoY, including an $11
billion increase in equity AUM reflecting higher
market valuations and net equity inflows
-
Equity AUM as a % of total AUM = 29%, up from
28% in 3Q13
(1) Please see page 1 for information on certain prior period revisions.
(2) Cross-sell reported on a one-quarter lag.
(3) Source: Dealogic U.S. investment banking fee market share.
vs
vs
($ in millions)
3Q14
2Q14
3Q13
Net interest income
$
3,007
2
%
(2)
Noninterest income
2,895
(3)
3
Reversal of provision for
credit losses
(85)
73
(41)
Noninterest expense
3,250
1
5
Income tax expense
824
(2)
(13)
Segment net income
$
1,920
(2)
%
(3)
($ in billions)
Avg loans, net
(1)
$
316.5
3
10
Avg core deposits
278.4
5
18
vs
vs
($ in billions)
3Q14
2Q14
3Q13
Key Metrics:
Cross-sell
(2)
7.2
-
%
3
Commercial card spend
volume
$
5.7
2
15
U.S. investment banking
market share %
(3)
4.5
-
bps
(120)
Total AUM
$
483.9
(1)
%
2
Advantage Funds AUM
233.7
(1)
(1)
|
 Wells Fargo
3Q14 Supplement 16
Wealth, Brokerage and Retirement
Net income up 22% YoY and 1% LQ
Net interest income up 2% LQ; average loans
up 3%
Noninterest income flat LQ as higher asset-based
fees were partially offset by lower deferred
compensation gains and lower brokerage
transaction revenue
-
Brokerage managed account asset fees priced
at beginning of quarter, reflecting 6/30/2014
market valuations
Noninterest expense flat LQ as increased broker
commissions and non-personnel expenses were
partially offset by lower deferred compensation
plan expense
Retail Brokerage
Managed account assets of $409 billion, flat LQ;
up 17% YoY driven by market performance and
net flows
Wealth Management
Wealth Management client assets
down 1% LQ
and up 7% YoY
Retirement
IRA assets down 1% LQ and up 8% YoY
Institutional Retirement plan assets down 2% LQ
and up 6% YoY
(1) Includes deposits.
(2) Data as of August 2014.
vs
vs
($ in millions)
3Q14
2Q14
3Q13
Net interest income
$
790
2
%
5
Noninterest income
2,763
-
8
Reversal of provision for
credit losses
(25)
-
(34)
Noninterest expense
2,690
-
3
Income tax expense
338
1
23
Segment net income
$
550
1
%
22
($ in billions)
Avg loans, net
$
52.6
3
13
Avg core deposits
153.6
-
2
vs
vs
($ in billions, except where noted)
3Q14
2Q14
3Q13
Key Metrics:
WBR Client Assets
(1)
($ in trillions)
$
1.6
(1)
%
8
Cross-sell
(2)
10.44
-
-
Retail Brokerage
Financial Advisors
15,163
-
(1)
Managed account assets
$
409
-
17
Client assets
(1)
($ in trillions)
1.4
(1)
8
Wealth Management
Client assets
(1)
219
(1)
7
Retirement
IRA Assets
354
(1)
8
Institutional Retirement
Plan Assets
314
(2)
6 |
 Wells Fargo
3Q14 Supplement 17
0.1
0.4
0.3
0.2
0.4
1.0
1.0
0.8
0.7
0.7
0.48%
0.47%
0.41%
0.35%
0.32%
3Q13
4Q13
1Q14
2Q14
3Q14
Provision Expense
Net Charge-offs
Net charge-off rate
16.9
15.7
14.7
14.0
13.4
3.8
3.9
4.1
4.1
4.3
20.7
19.6
18.8
18.1
17.7
3Q13
4Q13
1Q14
2Q14
3Q14
Nonaccrual loans
Foreclosed assets
Credit quality
Provision expense of $368 million, up $151 million
from 2Q14
Net charge-offs of $668 million, down $49 million,
or 7%, LQ
0.32% net charge-off rate
-
Commercial net recoveries of 2 bps, improved
5 bps LQ
-
Consumer losses of 0.62%, stable LQ
NPAs declined $406 million LQ
-
$607 million decline in nonaccrual loans
-
$201 million increase in foreclosed assets due to
growth in government insured/guaranteed
properties primarily in judicial states
Reserve release
(3)
of $300 million, down $200
million LQ
-
Continue to expect future reserve releases absent
significant deterioration in the economy, but
expect a lower level of future releases as the rate
of improvement in credit slows and the loan
portfolio continues to grow
Allowance for credit losses = $13.5 billion
-
Allowance covered 5.1x annualized 3Q14
net charge-offs
(1) Please see page 1 for information on certain prior period revisions.
(2) 30-89 days and 90 days or more past due and still accruing, and nonperforming
loans, include held for sale loans reported on Balance Sheet. (3) Provision
expense minus net charge-offs. Provision Expense and Net Charge-offs
($ in billions)
Nonperforming Assets
(2)
($ in billions)
(1) |
 Wells Fargo
3Q14 Supplement 18
Capital remained strong
Common Equity Tier 1 ratio under Basel III
(General Approach) of 11.16%, largely due to
balance sheet growth
Common Equity Tier 1 ratio under Basel III
(Advanced Approach, fully phased-in) of
10.46% at 9/30/14
(1)
-
Advanced approach is more risk-sensitive
than the general approach, and is our
constraining factor
-
Ratio improvement reflects strong capital
generation, better credit quality and data
refinements
Capital position
See pages 30-31 for additional information regarding common equity ratios.
3Q14 capital ratios are preliminary estimates.
Common Equity Tier 1 Ratio
Under Basel I
Basel III
(General Approach)
(1)
Estimated based on final rules adopted July 2, 2013, by the Federal Reserve Board establishing
a new comprehensive capital framework for U.S. banking organizations that would
implement the Basel III capital framework and certain provisions of the Dodd-Frank Act.
10.60%
10.82%
11.36%
11.31%
11.16%
3Q13
4Q13
1Q14
2Q14
3Q14 |
 Wells Fargo
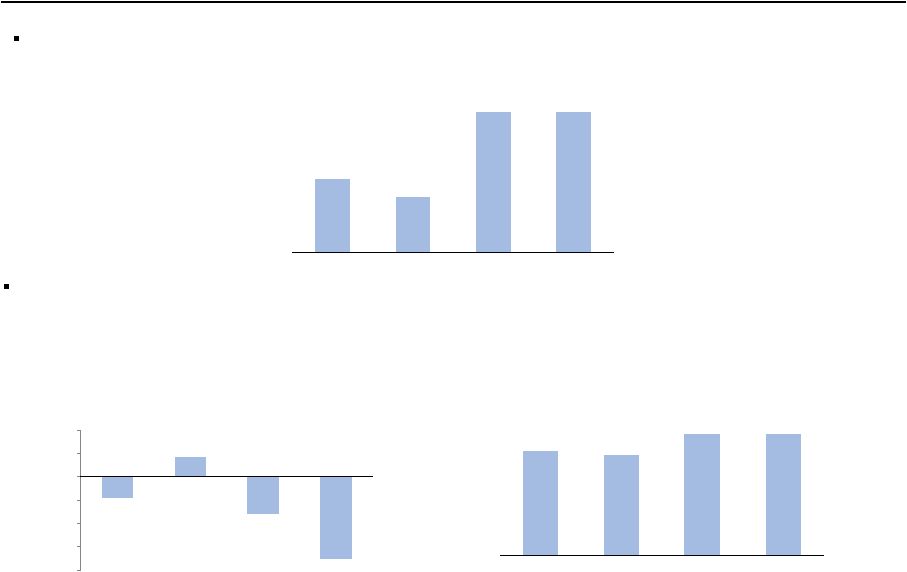
3Q14 Supplement 19
Our
strong
capital
levels
have
allowed
us
to
return
more
capital
to
shareholders
-
Returned $3.6 billion to shareholders in 3Q14
Capital return
(1)
Net payout ratio means the ratio of (i) common stock dividends and share repurchases less
issuances and stock compensation-related items, divided by (ii) net income
applicable to common stock. (2)
Dividends declared per common share as a percentage of diluted earnings per common share.
34%
26%
66%
66%
2013
1Q14
2Q14
3Q14
Net Payout Ratio
(1)
(9)
9
(16)
(35)
(40)
(30)
(20)
(10)
-
10
20
2013
1Q14
2Q14
3Q14
Net Change in Ending Common
Shares Outstanding
(shares in millions)
Period-end common shares outstanding down 34.9 million LQ
-
Purchased 48.7 million common shares
-
Issued 13.8 million common shares
-
Entered
into
a
$1.0
billion
forward
repurchase
transaction
which
is
expected
to
settle
in
4Q14
for
an
estimated 19.8 million shares
29%
28%
34%
34%
2013
1Q14
2Q14
3Q14
Dividend Payout Ratio
(2) |
 Wells Fargo
3Q14 Supplement 20
Summary
3Q14
-
Diluted EPS of $1.02, up 3%
-
ROA = 1.40%
-
ROE = 13.10%
-
Loans
(1)
up $29.7 billion, or 4%, with core loans up $50.8 billion, or 7%, on broad-based
growth -
Deposits up $88.7 billion, or 9%
-
Loan portfolio is balanced, diversified and high quality
•
Credit quality improved with net charge-offs of 0.32% (annualized), down 16 bps
-
Strengthened capital levels while returning more capital to shareholders
•
Returned $3.6 billion to shareholders through common stock dividends and net share
repurchases including $1.0 billion forward repurchase transaction expected to settle
in 4Q14 •
Net payout ratio
(2)
of 66%
-
Strong liquidity; significant amount of cash available to be deployed into high quality liquid
assets Strong earnings of $5.7 billion, up $151 million, or 3% from 3Q13
PTPP up 7% reflecting diversified business model
Solid returns
Strong loan and deposit growth
Balance sheet has never been stronger
Well positioned for the future
All comparisons are 3Q14 compared with 3Q13.
(1) Please see page 1 for information on certain prior period
revisions. (2) Net payout ratio means the ratio of (i) common stock dividends and share repurchases
less issuances and stock compensation-related items, divided by (ii) net income
applicable to common stock. |
 Appendix |
 Wells Fargo
3Q14 Supplement 22
(1) Net of purchase accounting adjustments.
(2) At the end of 2Q14, $9.7 billion in Education Finance-government guaranteed
loans were transferred to loans held for sale. -$106.7
Non-strategic/liquidating loan portfolio
-$3.2
-$127.7
-$2.9
-$12.7
-$2.2
($ in billions)
3Q14
2Q14
1Q14
4Q13
3Q13
4Q08
Pick-a-Pay mortgage
(1)
$
46.4
48.0
49.5
51.0
52.8
95.3
Liquidating home equity
3.1
3.3
3.5
3.7
3.9
10.3
Legacy WFF indirect auto
0.1
0.1
0.1
0.2
0.3
18.2
Legacy WFF debt consolidation
11.8
12.2
12.6
12.9
13.3
25.3
Education Finance - gov't guaranteed
(2)
-
-
10.2
10.7
11.1
20.5
Legacy WB C&I, CRE and foreign PCI loans
(1)
1.5
1.5
1.7
2.0
2.3
18.7
Legacy WB other PCI loans
(1)
0.2
0.2
0.4
0.4
0.4
2.5
Total
$
63.1
65.3
78.0
80.9
84.1
190.8
|
 Wells Fargo
3Q14 Supplement 23
Purchased credit-impaired (PCI) portfolios
Nonaccretable difference
Accretable yield
•
3Q14 accretable yield percentage of 6.15% increased from 4.98% LQ on the 2Q14
reclassification from nonaccretable difference to accretable yield
-
Commercial accretable yield balance of $345 million; weighted average life of portfolio is 1.9
years -
Pick-a-Pay accretable yield balance of $17.3 billion; weighted average life of 11.9
years $3.1 billion remains to absorb losses on PCI loans
$446 million accreted into interest income in 3Q14 vs. $362 million in 2Q14
$18.0 billion expected to accrete to income over the remaining life of the underlying
loans (1)
Includes write-downs taken on loans where severe delinquency (normally 180 days) or other
indications of severe borrower financial stress exist that indicate there will be a loss
of contractually due amounts upon final resolution of the loan. (2)
Reflects releases of $1.9 billion for loan resolutions and $8.4 billion from the
reclassification of nonaccretable difference to the accretable yield, which will result
in increasing income over the remaining life of the loan or pool of loans.
($ in billions)
Adjusted
unpaid
principal
balance
(1)
December 31, 2008
$
29.2
62.5
6.5
98.2
September 30,2014
2.2
26.9
0.7
29.8
Nonaccretable
difference
rollforward
12/31/08 Nonaccretable difference
$
10.4
26.5
4.0
40.9
Addition of nonaccretable difference due to acquisitions
0.2
-
-
0.2
Losses from loan resolutions and write-downs
(6.9)
(17.9)
(2.9)
(27.7)
Release of nonaccretable difference since merger
(3.6)
(5.8)
(0.9)
(10.3)
(2)
9/30/14 Remaining nonaccretable difference
0.1
2.8
0.2
3.1
Life-to-date
net
performance
Additional provision since 2008 merger
$
(1.6)
-
(0.1)
(1.7)
Release of nonaccretable difference since 2008 merger
3.6
5.8
0.9
10.3
(2)
Net performance
2.0
5.8
0.8
8.6
Commercial
Pick-a-Pay
Other
consumer
Total |
  Wells Fargo 3Q14
Supplement 24
Residential mortgage trends
Mortgage production
-
70% of originations were purchases, compared with 74% in 2Q14
Mortgage repurchase liability
-
Total provision for repurchases losses: $81 million net reduction in 3Q14; primarily
reflecting release of $93 million for change in estimate vs. $26 million net reduction
in 2Q14, primarily reflecting release of $38 million for change in estimate
-
Outstanding repurchase demands (dollars) down 25% LQ
Servicing portfolio
-
(1) Net gains on mortgage loan origination/or sales activities less repurchase reserve
build/release divided by total originations. Residential mortgage production trends
($ in billions)
3Q14
2Q14
1Q14
4Q13
3Q13
Applications
$
64
72
60
65
87
Pipeline
25
30
27
25
35
Originations
48
47
36
50
80
Refinance %
30
%
26
34
32
41
Purchase %
70
74
66
68
59
Gain on Sale
(1)
1.82
1.41
1.61
1.77
1.42
$48 billion of mortgage originations, up 2% LQ
$669 million balance
Residential servicing portfolio of $1.8 trillion
Wells Fargo servicing portfolio’s total delinquency and foreclosure ratio for 3Q14 was
5.80%, up 16 bps LQ and down 53 bps YoY |
 Wells Fargo
3Q14 Supplement 25
Real estate 1-4 family first mortgage portfolio
First lien mortgage loans up 1% as growth in core
first lien mortgage was partially offset by continued
run-off in the liquidating portfolio
Core first lien up $5.2 billion, or 3%, reflecting
nonconforming mortgage originations
-
Nonconforming mortgages increased $8.5 billion
to $104.0 billion
(3)
-
First lien home equity lines and loans of $17.3
billion, down $258 million
Strong core first lien credit performance
-
Nonaccrual loans down $63 million LQ
-
Net charge-offs down $7 million LQ to 7 bps
Pick-a-Pay non-PCI portfolio
-
Loans down 4% LQ driven by loans paid-in-full
-
87% of portfolio current
-
79% of portfolio with LTV
(4)
80%, up from 72%
in 2Q14 as a result of improving home values
-
Nonaccrual loans decreased $160 million,
or 5%, LQ
-
Net charge-offs of $12 million down $7 million LQ
on improved portfolio performance and lower
severities
($ in millions)
3Q14
2Q14
Total real estate 1-4 family first mortgage
$
263,326
260,104
Less consumer non-strategic/liquidating portfolios:
Pick-a-Pay
non-PCI
first
lien
mortgage
(1)
24,332
25,301
PCI first lien mortgage
(1)
22,271
22,888
Debt consolidation first mortgage portfolio
11,558
11,930
Liquidating first lien home equity lines and loans
134
144
Core first lien mortgage
205,031
199,841
Nonaccrual loans
$
3,819
3,864
as % of loans
1.86 %
1.93
Net charge-offs
$
37
43
as % of loans
0.07 %
0.09
Non-PCI loans
Nonaccrual loans
2,953
3,113
as % of loans
12.13 %
12.30
Net charge-offs
$
12
19
as % of average loans
0.19 %
0.30
90+ days past due as % of loans
8.17
8.29
PCI loans carrying value
(1)
22,057
22,664
Nonaccrual loans
$
2,032
2,049
Net charge-offs
$
65
75
as % of loans
2.22 %
2.49
Legacy
WFF
debt
consolidation
first
mortgage
and
liquidating
first
lien
HE
lines
and
loans
(2)
Pick-a-Pay first lien mortgage
Core first lien mortgage
(1)
The carrying value, which does not reflect the allowance for loan losses, includes purchase
accounting adjustments, which, for PCI loans, are the nonaccretable difference and the
accretable yield, and for all other loans, an adjustment to mark the loans to a market yield at date of merger less any subsequent charge-offs.
(2)
Ratios on Legacy WFF debt consolidation first mortgage loan portfolio only.
(3)
Nonconforming mortgages originated post February 2009.
(4)
Current LTV calculated as net carrying value divided by collateral value.
|
 Wells Fargo
3Q14 Supplement 26
Real estate 1-4 family junior lien mortgage portfolio
Outstandings
down
3%
LQ
-
High quality new originations with weighted
average CLTV of 66%, 775 FICO and 33% total
debt service ratio
Net charge-offs down $20 million, or 12 bps, LQ
2+ delinquencies increased $28 million, or 11 bps
Delinquency rate for loans with a CLTV >100%
decreased 4 bps
49% in junior lien position behind WFC owned or
serviced
1
lien
-
Current
1
lien,
Current
junior
lien
=
96.8%
-
Current
1
lien,
Delinquent
junior
lien
=
1.0%
-
Delinquent
1
lien,
Current
junior
lien
=
0.9%
-
Delinquent
1
lien,
Delinquent
junior
lien
=
1.3%
51%
in
junior
lien
position
behind
third
party
1
lien
(1)
CLTV is calculated based on outstanding balance plus unused lines of credit divided by
estimated home value. Estimated home values are determined predominantly based on
automated valuation models updated through August 2014. (2)
Unsecured balances, representing the percentage of outstanding balances above
the most recent home value. ($ in millions)
3Q14
2Q14
Outstandings
$
60,844
62,455
Net charge-offs
140
160
as % of avg loans
0.90
%
1.02
2+ payments past due
$
1,517
1,489
as % of loans
2.50
%
2.39
% CLTV > 100%
(1)
20
24
2+ payments past due
3.08
%
2.79
% Unsecured balances
(2)
8
11
st
st
st
st
st
st |
 Wells Fargo
3Q14 Supplement 27
Consumer credit card portfolio
Credit card outstandings up 4% LQ and 11% YoY
reflecting continued new account growth
-
Credit card household penetration
(2)
of 39.7%,
up 70 bps LQ and 367 bps YoY
-
Purchase dollar volume up 3% LQ and 16% YoY
reflecting growth in the account base
-
POS transactions up 4% LQ and 16% YoY
Net charge-offs down $10 million, or 33 bps, LQ
(1)
Consumer credit card new account openings, excludes private label.
(2)
Household penetration as of August 2014 and defined as the percentage of retail banking
deposit households that have a credit card with Wells Fargo. ($ in millions)
3Q14
2Q14
Credit card outstandings
$
28,270
27,215
Net charge-offs
201
211
as % of avg loans
2.87
%
3.20
Key Metrics:
Purchase volume
$
15,858
15,388
POS transactions (millions)
224
215
New accounts
(1)
546,640
601,631
Penetration
(2)
39.7
%
39.0 |
 Wells Fargo
3Q14 Supplement 28
Auto portfolios
(1)
Consumer Portfolio
Auto outstandings of $55.2 billion up 2% LQ and
11% YoY
3Q14 originations of $7.6 billion down 3% LQ
on seasonality and up 9% YoY
Nonaccrual loans declined $7 million LQ and $45
million YoY
Net charge-offs were up $66 million LQ reflecting
seasonality, and up $34 million YoY on portfolio
growth
September Manheim index of 121.4 down 2%
LQ and 1% YoY
30+ days past due increased $147 million, or 23
bps, LQ reflecting seasonality and increased
$286 million, or 35 bps, YoY on portfolio mix and
aging
Commercial Portfolio
Loans of $8.5 billion down 3% LQ and up
13% YoY
(1)
The consumer auto portfolio includes the liquidating legacy Wells Fargo Financial indirect
portfolio of $54 million. ($ in millions)
3Q14
2Q14
Auto outstandings
$
52,245
51,345
Nonaccrual loans
136
142
as % of loans
0.26
%
0.28
Net charge-offs
$
110
46
as % of avg loans
0.84
%
0.36
30+ days past due
$
1,090
944
as % of loans
2.09
%
1.84
Auto outstandings
$
2,997
2,750
Nonaccrual loans
7
8
as % of loans
0.23
%
0.29
Net charge-offs
$
2
-
as % of avg loans
0.28
%
0.05
30+ days past due
$
11
10
as % of loans
0.37
%
0.36
Commercial
Auto outstandings
$
8,470
8,705
Nonaccrual loans
18
18
as % of loans
0.21
%
0.21
Net charge-offs
$
-
-
as % of avg loans
n.m.
%
n.m.
Indirect Consumer
Direct Consumer |
 Wells Fargo
3Q14 Supplement 29
Student lending portfolio
Private Portfolio
$11.9 billion private loan outstandings up 2%
LQ and 5% YoY
Average FICO of 753 and 80% of the total
outstandings have been co-signed
Net charge-offs down $3 million LQ
30+ days past due increased $35 million LQ
on seasonality
Government Portfolio
Transferred to held for sale at the end of 2Q14
($ in millions)
3Q14
2Q14
Private Portfolio
Private outstandings
$
11,916
11,633
Net charge-offs
30
33
as % of avg loans
1.03
%
1.14
30 days past due
$
230
195
as % of loans
1.93
%
1.68
|
 Wells Fargo
3Q14 Supplement 30
Common Equity Tier 1 under Basel III (General
Approach) Wells Fargo & Company
FIVE QUARTER RISK-BASED CAPITAL COMPONENTS
Sept. 30,
June 30,
Mar. 31,
Dec. 31,
Sept 30,
2014
2014
2014
2013
2013
$
183.0
181.5
176.5
171.0
168.8
(0.5)
(0.6)
(0.8)
(0.9)
(1.6)
182.5
180.9
175.7
170.1
167.2
(18.0)
(17.2)
(15.2)
(15.2)
(14.3)
(2.5)
(3.2)
(2.2)
(1.4)
(2.2)
(25.5)
(25.6)
(25.6)
(29.6)
(29.8)
-
(0.1)
-
(0.4)
(0.6)
(A)
136.5
134.8
132.7
123.5
120.3
18.0
17.2
15.2
15.2
14.3
-
-
-
2.0
2.9
(0.4)
(0.3)
(0.3)
-
-
154.1
151.7
147.6
140.7
137.5
23.7
24.0
21.7
20.5
18.9
13.5
13.8
14.1
14.3
14.3
(0.2)
-
0.2
0.7
0.6
37.0
37.8
36.0
35.5
33.8
(B)
$
191.1
189.5
183.6
176.2
171.3
$
1,171.7
1,145.7
1,120.3
51.3
46.8
48.1
1,105.2
1,099.2
36.3
35.9
(C)
$
1,223.0
1,192.5
1,168.4
1,141.5
1,135.1
(A)/(C)
11.16 %
11.31
11.36
10.82
10.60
(B)/(C)
15.63
15.89
15.71
15.43
15.09
(1)
(2)
(3)
(4)
(5)
(6)
(in billions)
Under Basel III
(General Approach) (1)
Under Basel I
Other
Total equity
Noncontrolling interests
Total Wells Fargo stockholders' equity
Adjustments:
Preferred stock
Cumulative other comprehensive income (2)
Goodwill and other intangible assets (2)(3)
Investment in certain subsidiaries and other
Common Equity Tier 1 (1)(4)
Preferred stock
Qualifying hybrid securities and noncontrolling interests
Market risk
Total Tier 1 capital
Long-term debt and other instruments qualifying as Tier 2
Qualifying allowance for credit losses
Other
Total Tier 2 capital
Total qualifying capital
Basel III Risk-Weighted Assets (RWAs) (5)(6):
Credit risk
Market risk
Basel I RWAs (5)(6):
Credit risk
Total Basel III / Basel I RWAs
Capital Ratios (6):
Common Equity Tier 1 to total RWAs
Total capital to total RWAs
Basel III revises the definition of capital, increases minimum capital ratios, and introduces a minimum
Common Equity Tier 1 (CET1) ratio. These changes are being fully phased in effective January 1,
2014 through the end of 2021 and the capital ratios will be determined using Basel III (General Approach) RWAs during 2014.
Under transition provisions to Basel III, cumulative other comprehensive income (previously deducted
under Basel I) is included in CET1 over a specified phase-in period. In addition, certain
intangible assets includable in CET1 are phased out over a specified period. Goodwill and other
intangible assets are net of any associated deferred tax liabilities. CET1 (formerly Tier 1
common equity under Basel I) is a non-GAAP financial measure that is used by investors, analysts and bank regulatory agencies to assess the capital position
of financial services companies. Management reviews CET1 along with other measures of capital as part
of its financial analyses and has included this non-GAAP financial information, and the
corresponding reconciliation to total equity, because of current interest in such information on the part of market participants.
Under the regulatory guidelines for risk-based capital, on-balance sheet assets and credit
equivalent amounts of derivatives and off-balance sheet items are assigned to one of several
broad risk categories according to the obligor, or, if relevant, the guarantor or the nature of any collateral. The aggregate dollar amount in each risk category is then
multiplied
by
the
risk
weight
associated
with
that
category.
The
resulting
weighted
values
from
each
of
the
risk
categories
are
aggregated
for
determining
total
RWAs.
The Company's September 30, 2014, RWAs and capital ratios are preliminary.
|
 Wells Fargo
3Q14 Supplement 31
Common Equity Tier 1 under Basel III (Advanced Approach, fully
phased-in) Wells Fargo &
Company COMMON EQUITY TIER 1 UNDER BASEL III (ADVANCED APPROACH, FULLY PHASED-IN)
(1)(2) Sept. 30, 2014
$
136.5
2.5
(2.5)
-
Common Equity Tier 1 (fully phased-in) under Basel III
(C) $
136.5
(D) $
1,305.7
Common Equity Tier 1 to total RWAs anticipated under Basel III (Advanced Approach, fully
phased-in) (C)/(D)
10.46
%
(1)
(2)
(3)
(4)
Common Equity Tier 1 (transition amount) under Basel III
(in billions)
CET1 is a non-GAAP financial measure that is used by investors, analysts and bank regulatory
agencies to assess the capital position of financial services companies. Management reviews CET1
along with other measures of capital as part of its financial analyses and has included this non-GAAP financial information, and the corresponding
reconciliation to total equity, because of current interest in such information on the part of market
participants. The Basel III CET1 and RWA are estimated based on the Basel III capital rules
adopted July 2, 2013, by the FRB. The rules establish a new comprehensive capital framework for
U.S. banking organizations that implement the Basel III capital framework and certain provisions of the
Dodd-Frank Act. The rules are being phased in effective January 1, 2014 through the end of
2021. Assumes
cumulative
other
comprehensive
income
is
fully
phased
in
and
certain
other
intangible
assets
are
fully
phased
out
under
Basel
III
capital
rules.
The
final
Basel
III
capital
rules
provide
for
two
capital
frameworks:
the
Standardized
Approach
intended
to
replace
Basel
I,
and
the
Advanced
Approach
applicable
to
certain
institutions. Under the final rules, we will be subject to the lower of our CET1 ratio calculated under
the Standardized Approach and under the Advanced Approach in the assessment of our capital
adequacy. While the amount of RWAs determined under the Standardized and Advanced Approaches has been converging, management’s estimate
of RWAs as of September 30, 2014, is based on the Advanced Approach, which is currently estimated to be
higher than RWAs under the Standardized Approach, resulting in a lower CET1 compared with the
Standardized Approach. Basel III capital rules adopted by the Federal Reserve Board incorporate different classification of assets, with risk weights
based on Wells Fargo's internal models, along with adjustments to address a combination of
credit/counterparty, operational and market risks, and other Basel III elements.
Adjustments from transition amount to fully phased-in under Basel III (3):
Cumulative other comprehensive income
Other
Total adjustments
Total RWAs anticipated under Basel III (4) |
| Wells Fargo
3Q14 Supplement 32
Forward-looking statements and additional information
Forward-looking statements:
This document contains “forward-looking statements”
within the meaning of the Private Securities Litigation Reform Act of 1995. In addition, we
may make forward-looking statements in our other documents filed or furnished with
the SEC, and our management may make forward-looking statements orally to analysts,
investors, representatives of the media and others. Forward-looking statements can
be identified by words such as “anticipates,”
“intends,”
“plans,”
“seeks,”
“believes,”
“estimates,”
“expects,”
“target,”
“projects,”
“outlook,”
“forecast,”
“will,”
“may,”
“could,”
“should,”
“can”
and similar references to future periods. In particular, forward-looking statements
include, but are not limited to, statements we make about:
(i)
the
future
operating
or
financial
performance
of
the
Company,
including
our
outlook
for
future
growth;
(ii)
our
noninterest
expense
and efficiency ratio; (iii) future credit quality and performance, including our expectations
regarding future loan losses and allowance releases; (iv) the appropriateness of the
allowance for credit losses; (v) our expectations regarding net interest income and net interest margin; (vi) loan growth
or the reduction or mitigation of risk in our loan portfolios; (vii) future capital levels and
our estimated Common Equity Tier 1 ratio under Basel III capital standards; (viii) the
performance of our mortgage business and any related exposures; (ix) the expected outcome and impact of legal,
regulatory and legislative developments, as well as our expectations regarding compliance
therewith; (x) future common stock dividends, common share repurchases and other uses
of capital; (xi) our targeted range for return on assets and return on equity; (xii) the outcome of contingencies,
such as legal proceedings; and (xiii) the Company’s plans, objectives and strategies.
Forward-looking statements are not based on historical facts but instead represent
our current expectations and assumptions regarding our business, the economy and other future conditions. Investors are
urged to not unduly rely on forward-looking statements as actual results could differ
materially from expectations. Forward-looking statements speak only as of the date
made, and we do not undertake to update them to reflect changes or events that occur after that date. For more
information about factors that could cause actual results to differ materially from
expectations, refer to the “Forward-Looking Statements” discussion in
Wells Fargo’s press release announcing our third quarter 2014 results and in our
most recent Quarterly Report on Form 10-Q, as well as to Wells Fargo’s other
reports filed with the Securities and Exchange Commission, including the discussion under “Risk Factors”
in our Annual
Report on Form 10-K for the year ended December 31, 2013.
Purchased credit-impaired loan portfolio:
In certain cases, the purchased credit-impaired loans may affect portfolio credit ratios
and trends. Management believes that the presentation of information adjusted to
exclude the purchased credit-impaired loans provides useful disclosure regarding the credit quality of the non-impaired loan
portfolio. Accordingly, certain of the loan balances and credit ratios in this document have
been adjusted to exclude the purchased credit-impaired loans. References in this
document to impaired loans mean the purchased credit-impaired loans. Please see pages 32-34 of the press release
announcing our 3Q14 results for additional information regarding
the purchased credit-impaired loans.
Loans that were acquired from Wachovia that were considered credit impaired were written down
at acquisition date in purchase accounting to an amount estimated to be collectible and
the related allowance for loan losses was not carried over to Wells Fargo’s
allowance. In addition, such purchased credit-impaired loans are not classified as
nonaccrual or nonperforming, and are not included in loans that were contractually 90+
days past due and still accruing. Any losses on such loans are charged against the nonaccretable
difference established in purchase accounting and are not reported as charge-offs (until
such difference is fully utilized). As a result of accounting for purchased loans with
evidence of credit deterioration, certain ratios of the combined company are not comparable to a
portfolio that does not include purchased credit-impaired loans. |