Attached files
| file | filename |
|---|---|
| EXCEL - IDEA: XBRL DOCUMENT - Corvus Gold Inc. | Financial_Report.xls |
| EX-31.2 - EXHIBIT 31.2 - Corvus Gold Inc. | v390016_ex31-2.htm |
| EX-23.1 - EXHIBIT 23.1 - Corvus Gold Inc. | v390016_ex23-1.htm |
| EX-32.1 - EXHIBIT 32.1 - Corvus Gold Inc. | v390016_ex32-1.htm |
| EX-32.2 - EXHIBIT 32.2 - Corvus Gold Inc. | v390016_ex32-2.htm |
| EX-23.2 - EXHIBIT 23.2 - Corvus Gold Inc. | v390016_ex23-2.htm |
| EX-31.1 - EXHIBIT 31.1 - Corvus Gold Inc. | v390016_ex31-1.htm |
| EX-23.3 - EXHIBIT 23.3 - Corvus Gold Inc. | v390016_ex23-3.htm |
UNITED STATES
SECURITIES AND EXCHANGE COMMISSION
Washington, D.C. 20549
| FORM 10-Q |
| x | QUARTERLY REPORT PURSUANT TO SECTION 13 OR 15(d) OF THE SECURITIES EXCHANGE ACT OF 1934 |
For the quarterly period ended August 31, 2014
OR
| ¨ | TRANSITION REPORT PURSUANT TO SECTION 13 OR 15(d) OF THE SECURITIES EXCHANGE ACT OF 1934 |
For the transition period from to
| Commission file number: 333-197099 |

CORVUS GOLD INC.
(Exact Name of Registrant as Specified in its Charter)
| British Columbia, Canada | 98-0668473 | |
| (State or other jurisdiction of incorporation or organization) |
(I.R.S. Employer Identification No.) |
| 2300-1177 West Hastings Street | ||
| Vancouver, British Columbia, Canada, V6E 2K3 | V6E 2K3 | |
| (Address of Principal Executive Offices) | (Zip code) |
Registrant’s telephone number, including area code: (604) 638-3246
Indicate by check mark whether the registrant (1) has filed all reports required to be filed by Section 13 or 15(d) of the Securities Exchange Act of 1934 during the preceding 12 months (or for such shorter period that the registrant was required to file such reports), and (2) has been subject to such filing requirements for the past 90 days.
Yes ¨ No x
Indicate by check mark whether the registrant has submitted electronically and posted on its corporate Web site, if any, every Interactive Data File required to be submitted and posted pursuant to Rule 405 of Regulation S-T (§232.405 of this chapter) during the preceding 12 months (or for such shorter period that the registrant was required to submit and post such files).
Yes ¨ No ¨
Indicate by check mark whether the registrant is a large accelerated filer, an accelerated filer, a non-accelerated filer, or a smaller reporting company. See the definitions of “large accelerated filer,” “accelerated filer” and “smaller reporting company” in Rule 12b-2 of the Exchange Act. (Check one):
| Large Accelerated Filer ¨ | Accelerated Filer ¨ |
| Non-Accelerated filer ¨ | Small Reporting company x |
| (Do not check if a smaller reporting company) |
Indicate by check mark whether the registrant is a shell company (as defined in Rule 12b-2 of the Exchange Act). Yes ¨ No x
As of October 14, 2014, the registrant had 75,565,028 Common Shares outstanding.
Table of Contents
| Page | ||
| PART I | FINANCIAL INFORMATION | |
| ITEM 1 | FINANCIAL STATEMENTS | 3 |
| ITEM 2 | MANAGEMENT’S DISCUSSION AND ANALYSIS OF FINANCIAL CONDITION AND RESULTS OF OPERATIONS | 20 |
| ITEM 3 | QUANTITATIVE AND QUALITATIVE DISCLOSURES ABOUT MARKET RISK | 36 |
| ITEM 4 | CONTROLS AND PROCEDURES | 36 |
| PART II | OTHER INFORMATION | |
| ITEM 1 | LEGAL PROCEEDINGS | 37 |
| ITEM 1A | RISK FACTORS | 37 |
| ITEM 2 | UNREGISTERED SALES OF EQUITY SECURITIES AND USE OF PROCEEDS | 37 |
| ITEM 3 | DEFAULTS UPON SENIOR SECURITIES | 38 |
| ITEM 4 | MINE SAFETY DISCLOSURES | 38 |
| ITEM 5 | OTHER INFORMATION | 38 |
| ITEM 6 | EXHIBITS | 39 |
| SIGNATURES | 40 |
| 2 |
CORVUS GOLD INC.
CONDENSED INTERIM CONSOLIDATED BALANCE SHEETS
(Expressed in Canadian dollars)
| August 31, 2014 | May 31, 2014 | |||||||
| (Unaudited) | ||||||||
| ASSETS | ||||||||
| Current assets | ||||||||
| Cash and cash equivalents | $ | 6,642,082 | $ | 3,227,970 | ||||
| Marketable securities (note 4) | 108,730 | 147,451 | ||||||
| Accounts receivable | 49,844 | 16,787 | ||||||
| Prepaid expenses | 228,296 | 217,316 | ||||||
| Total current assets | 7,028,952 | 3,609,524 | ||||||
| Property and equipment (note 5) | 92,504 | 97,447 | ||||||
| Reclamation bond (note 6) | 523,826 | 522,332 | ||||||
| Capitalized acquisition costs (note 7) | 4,056,557 | 4,045,115 | ||||||
| $ | 11,701,839 | $ | 8,274,418 | |||||
| LIABILITIES AND SHAREHOLDERS’ EQUITY | ||||||||
| Current liabilities | ||||||||
| Accounts payable and accrued liabilities (note 10) | $ | 217,060 | $ | 622,950 | ||||
| Promissory note payable (note 8) | 260,952 | 260,208 | ||||||
| Total liabilities | 478,012 | 883,158 | ||||||
| Shareholders’ equity | ||||||||
| Share capital (note 9) | 59,693,273 | 53,703,440 | ||||||
| Contributed surplus | 10,225,448 | 9,768,967 | ||||||
| Accumulated other comprehensive income – cumulative translation differences | 164,463 | 151,192 | ||||||
| Deficit accumulated during the exploration stage | (58,859,357 | ) | (56,232,339 | ) | ||||
| Total shareholders’ equity | 11,223,827 | 7,391,260 | ||||||
| Total liabilities and shareholders’ equity | $ | 11,701,839 | $ | 8,274,418 | ||||
Nature and continuance of operations (note 2)
Subsequent events (note 14)
Approved on behalf of the Directors:
| “Jeffrey Pontius” | Director | |
| “Anton Drescher” | Director |
These accompanying notes form an integral part of these condensed interim consolidated financial statements
| 3 |
CORVUS GOLD INC.
CONDENSED INTERIM CONSOLIDATED STATEMENTS OF OPERATIONS AND COMPREHENSIVE LOSS
(Unaudited)
(Expressed in Canadian dollars)
THREE MONTHS ENDED AUGUST 31,
| 2014 | 2013 | |||||||
| Expenses | ||||||||
| Administration | $ | 3,015 | $ | 1,636 | ||||
| Charitable donations | - | 516 | ||||||
| Consulting fees (notes 9 and 10) | 168,826 | 135,858 | ||||||
| Depreciation | 6,115 | 4,916 | ||||||
| Exploration expenditures (notes 7 and 9) | 1,489,088 | 2,487,907 | ||||||
| Insurance | 11,462 | 14,160 | ||||||
| Investor relations (notes 9 and 10) | 184,524 | 276,159 | ||||||
| Office and miscellaneous | 35,343 | 35,597 | ||||||
| Professional fees (notes 9 and 10) | 114,489 | 62,017 | ||||||
| Regulatory | 55,157 | 15,172 | ||||||
| Rent | 23,121 | 22,738 | ||||||
| Travel | 12,244 | 17,997 | ||||||
| Wages and benefits (notes 9 and 10) | 447,970 | 360,665 | ||||||
| Total operating expenses | (2,551,354 | ) | (3,435,338 | ) | ||||
| Other income (expense) | ||||||||
| Interest income | 1,770 | 23,290 | ||||||
| Unrealized loss on marketable securities | (38,977 | ) | - | |||||
| Foreign exchange loss | (38,457 | ) | (11,631 | ) | ||||
| Total other income (expense) | (75,664 | ) | 11,659 | |||||
| Net loss for the period | (2,627,018 | ) | (3,423,679 | ) | ||||
| Other comprehensive income | ||||||||
| Exchange difference on translating foreign operations | 13,271 | 71,283 | ||||||
| Comprehensive loss for the period | $ | (2,613,747 | ) | $ | (3,352,396 | ) | ||
| Basic and diluted loss per share | $ | (0.04 | ) | $ | (0.05 | ) | ||
| Weighted average number of shares outstanding | 70,694,919 | 65,130,245 | ||||||
These accompanying notes form an integral part of these condensed interim consolidated financial statements
| 4 |
CORVUS GOLD INC.
CONDENSED INTERIM CONSOLIDATED STATEMENTS OF CASH FLOWS
(Unaudited)
(Expressed in Canadian dollars)
THREE MONTHS ENDED AUGUST 31,
| 2014 | 2013 | |||||||
| Operating activities | ||||||||
| Net loss for the period | $ | (2,627,018 | ) | $ | (3,423,679 | ) | ||
| Add items not affecting cash: | ||||||||
| Depreciation | 6,115 | 4,916 | ||||||
| Stock-based compensation (note 9) | 456,481 | 388,337 | ||||||
| Unrealized loss on marketable securities | 38,977 | - | ||||||
| Loss on foreign exchange | 38,457 | 11,631 | ||||||
| Changes in non-cash items: | ||||||||
| Accounts receivable | (33,057 | ) | 518 | |||||
| Prepaid expenses | (10,980 | ) | 347,296 | |||||
| Accounts payable and accrued liabilities | (405,890 | ) | (59,541 | ) | ||||
| Cash used in operating activities | (2,536,915 | ) | (2,730,522 | ) | ||||
| Financing activities | ||||||||
| Cash received from issuance of shares | 6,180,000 | 48,300 | ||||||
| Share issuance costs | (190,167 | ) | - | |||||
| Cash provided by financing activities | 5,989,833 | 48,300 | ||||||
| Investing activities | ||||||||
| Expenditures on property and equipment | (932 | ) | (1,706 | ) | ||||
| Increase in reclamation deposit | - | (1,955 | ) | |||||
| Cash used in investing activities | (932 | ) | (3,661 | ) | ||||
| Effect of foreign exchange on cash | (37,874 | ) | 1,736 | |||||
| Increase (decrease) in cash and cash equivalents | 3,414,112 | (2,684,147 | ) | |||||
| Cash and cash equivalents, beginning of the period | 3,227,970 | 7,867,270 | ||||||
| Cash and cash equivalents, end of the period | $ | 6,642,082 | $ | 5,183,123 | ||||
Supplemental cash flow information (note 12)
These accompanying notes form an integral part of these condensed interim consolidated financial statements
| 5 |
CORVUS GOLD INC.
CONDENSED INTERIM CONSOLIDATED STATEMENT OF CHANGES IN EQUITY
(Unaudited)
(Expressed in Canadian dollars)
| Number of shares | Amount | Contributed Surplus | Accumulated Other Comprehensive Income(Loss) – Cumulative Translation Differences | Deficit | Total | |||||||||||||||||||
| Balance, May 31, 2014 | 70,415,028 | $ | 53,703,440 | $ | 9,768,967 | $ | 151,192 | $ | (56,232,339 | ) | $ | 7,391,260 | ||||||||||||
| Net loss for the period | - | - | - | - | (2,627,018 | ) | (2,627,018 | ) | ||||||||||||||||
| Other comprehensive income | ||||||||||||||||||||||||
| Exchange difference on translating foreign operations | - | - | - | 13,271 | - | 13,271 | ||||||||||||||||||
| Shares issued for cash | ||||||||||||||||||||||||
| Public offering | 5,150,000 | 6,180,000 | - | - | - | 6,180,000 | ||||||||||||||||||
| Share issuance costs | - | (190,167 | ) | - | - | - | (190,167 | ) | ||||||||||||||||
| Stock-based compensation | - | - | 456,481 | - | - | 456,481 | ||||||||||||||||||
| Balance, August 31, 2014 | 75,565,028 | $ | 59,693,273 | $ | 10,225,448 | $ | 164,463 | $ | (58,859,357 | ) | $ | 11,223,827 | ||||||||||||
These accompanying notes form an integral part of these condensed interim consolidated financial statements
| 6 |
CORVUS GOLD INC.
NOTES TO THE CONDENSED INTERIM CONSOLIDATED FINANCIAL STATEMENTS
(Unaudited)
(Expressed in Canadian dollars)
THREE MONTHS ENDED AUGUST 31, 2014 AND 2013
| 1. | PLAN OF ARRANGEMENT AND TRANSFER OF ASSETS |
On August 25, 2010, International Tower Hill Mines Ltd. (“ITH”) completed a Plan of Arrangement (the “Arrangement”) under the British Columbia Business Corporations Act (“BCBCA”) whereby its existing Alaska mineral properties (other than the Livengood project) and related assets and the North Bullfrog mineral property and related assets in Nevada (collectively, the “Nevada and Other Alaska Business”) were indirectly spun out into a new public company, being Corvus Gold Inc. (“Corvus” or the “Company”).
The Arrangement was approved by the board of directors of each of ITH and Corvus and by the shareholders of ITH and was accepted for filing by the Toronto Stock Exchange (“TSX”) on behalf of both ITH and Corvus. In connection with the completion of the Arrangement, the common shares of Corvus were listed on the TSX.
Under the Arrangement, each shareholder of ITH received (as a return of capital) one Corvus common share for every two ITH common shares held as at the effective date of the Arrangement and exchanged each old common share of ITH for a new common share of ITH. As part of the Arrangement, ITH transferred its wholly-owned subsidiary Corvus Gold Nevada Inc. (formerly Talon Gold Nevada Inc.) (“Corvus Nevada”), incorporated in Nevada, United States (which held the North Bullfrog property), to Corvus and a wholly-owned Alaskan subsidiary of ITH sold to Raven Gold Alaska Inc. (“Raven Gold”), incorporated in Alaska, United States, a wholly owned subsidiary of Corvus, the Terra, Chisna, LMS and West Pogo properties. As a consequence of the completion of the Arrangement, Corvus now holds the Terra, Chisna, LMS, West Pogo and North Bullfrog properties (the “Spin-out Properties”).
The Company’s consolidated financial statements reflect the Balance Sheets and Statement of Changes in Equity of the Nevada and Other Alaska Business as if Corvus existed in its present form since the inception of the business on June 1, 2006. The financial statements have been presented under the predecessor basis of accounting with Balance Sheet amounts based on the amounts recorded by ITH. Management cautions readers of these financial statements that the allocation of expenses does not necessarily reflect future general and administrative expenses.
The deficit of the Company at August 25, 2010 was calculated on the basis of the ratio of costs incurred on the Spin-out Properties in each period as compared to the costs incurred on all mineral properties of ITH in each of these periods to the cumulative transactions relating to the Spin-out Properties from the date of acquisition of those mineral properties to August 25, 2010 and includes an allocation of ITH’s general and administrative expenses from the date of acquisition of those mineral properties to August 25, 2010. The allocation of general and administrative expense was calculated on the basis of the ratio of costs incurred on the Spin-out Properties in each prior year as compared to the costs incurred on all mineral properties and exploration costs of ITH in each of those prior years. Subsequent to August 25, 2010, ITH has not incurred any expenses on behalf of Corvus and therefore, no allocation of ITH expenses subsequent to that date has occurred.
| 2. | NATURE AND CONTINUANCE OF OPERATIONS |
The Company was incorporated on April 13, 2010 under the British Columbia Business Corporations Act. These condensed interim consolidated financial statements reflect the cumulative operating results of the predecessor, as related to the mineral properties that were transferred to the Company from June 1, 2006.
The Company is engaged in the business of acquiring, exploring and evaluating mineral properties, and either joint venturing or developing these properties further or disposing of them when the evaluation is completed. At August 31, 2014, the Company had interests in properties in Alaska and Nevada, U.S.A.
The business of mining and exploration involves a high degree of risk and there can be no assurance that current exploration programs will result in profitable mining operations. The Company has no source of revenue, and has significant cash requirements to meet its administrative overhead and maintain its mineral property interests. The recoverability of amounts shown for exploration and evaluation assets is dependent on several factors. These include the discovery of economically recoverable reserves, the ability of the Company to obtain the necessary financing to complete the development of these properties, and future profitable production or proceeds from disposition of exploration and evaluation assets. The carrying value of the Company’s exploration and evaluation assets does not reflect current or future values.
| 7 |
CORVUS GOLD INC.
NOTES TO THE CONDENSED INTERIM CONSOLIDATED FINANCIAL STATEMENTS
(Unaudited)
(Expressed in Canadian dollars)
THREE MONTHS ENDED AUGUST 31, 2014 AND 2013
These condensed interim consolidated financial statements have been prepared on a going concern basis, which presume the realization of assets and discharge of liabilities in the normal course of business for the foreseeable future. The Company’s ability to continue as a going concern is dependent upon achieving profitable operations and/or obtaining additional financing.
In assessing whether the going concern assumption is appropriate, management takes into account all available information about the future which is at least, but not limited to, 12 months from August 31, 2014. Management is aware, in making its assessment, of material uncertainties relating to events or conditions that raise significant doubt upon the Company’s ability to continue as a going concern, as explained in the following paragraph.
The Company has sustained losses from operations, and has an ongoing requirement for capital investment to explore its exploration and evaluation assets. Based on its current plans, budgeted expenditures, and cash requirements, the Company does not have sufficient cash to finance its current plans for at least 12 months from August 31, 2014. The Company expects that it will need to raise substantial additional capital to accomplish its business plan over the next several years. The Company expects to seek additional financing through equity financing. There can be no assurance as to the availability or terms upon which such financing might be available.
These condensed interim consolidated financial statements do not include any adjustments to the amounts and classification of assets and liabilities that might be necessary should the Company be unable to continue in business.
| 3. | SIGNIFICANT ACCOUNTING POLICIES |
Basis of presentation
These unaudited condensed consolidated interim financial statements have been prepared in accordance with accounting principles generally accepted in the United States (“U.S. GAAP”) for interim financial information and with the instructions to Form 10-Q and Article 10 of Regulation S-X under the Securities Exchange Act of 1934, as amended. Accordingly, they do not include all of the information and footnotes required by U.S. GAAP for annual financial statements. These unaudited condensed interim consolidated financial statements should be read in conjunction with the audited consolidated financial statements for the year ended May 31, 2014 as filed in our Annual Report on Form S-1/A. In the opinion of the Company’s management these financial statements reflect all adjustments, consisting of normal recurring adjustments, necessary to present fairly the Company’s financial position at August 31, 2014 and the results of its operations for the three months then ended. Operating results for the three months ended August 31, 2014 are not necessarily indicative of the results that may be expected for the year ending May 31, 2015. The 2014 year-end balance sheet data was derived from audited financial statements but does not include all disclosures required by U.S. GAAP.
The preparation of financial statements in conformity with US GAAP requires management to make judgments, estimates and assumptions that affect the reported amounts of assets and liabilities and disclosure of contingent assets and liabilities at the date of the financial statements, and the reported amounts of revenues and expenses during the period. These judgments, estimates and assumptions are continuously evaluated and are based on management’s experience and knowledge of the relevant facts and circumstances. While management believes the estimates to be reasonable, actual results could differ from those estimates and could impact future results of operations and cash flows.
Basis of Consolidation
These unaudited condensed interim consolidated financial statements include the accounts of the Company and its wholly-owned subsidiaries (collectively, the “Group”), Corvus Gold (USA) Inc. (“Corvus USA”) (a Nevada corporation), Corvus Gold Nevada Inc. (“Corvus Nevada”) (a Nevada corporation), Raven Gold Alaska Inc. (“Raven Gold”) (an Alaska corporation) and SoN Land and Water LLC (“SoN”) (a Nevada limited liability company). All intercompany transactions and balances were eliminated upon consolidation.
Earnings (loss) per share
Basic loss per share is calculated using the weighted average number of common shares outstanding during the period. The Company uses the treasury stock method to compute the dilutive effect of options, warrants and similar instruments. Under this method, the dilutive effect on earnings (loss) per share is calculated presuming the exercise of outstanding options, warrants and similar instruments. It assumes that the proceeds of such exercise would be used to repurchase common shares at the average market price during the period. However, the calculation of diluted loss per share excludes the effects of various conversions and exercise of options and warrants that would be anti-dilutive. For the period ended August 31, 2014, 6,175,234 outstanding stock options (2013 – 6,175,234) were not included in the calculation of diluted earnings (loss) per share as their inclusion was anti-dilutive.
| 8 |
CORVUS GOLD INC.
NOTES TO THE CONDENSED INTERIM CONSOLIDATED FINANCIAL STATEMENTS
(Unaudited)
(Expressed in Canadian dollars)
THREE MONTHS ENDED AUGUST 31, 2014 AND 2013
| 4. | MARKETABLE SECURITIES |
As at August 31, 2014, the Company held 200,000 (May 31, 2014 – 200,000) common shares of WestMountain Gold with a fair value of $108,730 (May 31, 2014 - $147,451). The Company classified these shares as held-for-trading.
| 5. | PROPERTY AND EQUIPMENT |
| Computer Equipment | Vehicles | Tent | Total | |||||||||||||
| Cost | ||||||||||||||||
| Balance, May 31, 2014 | $ | 38,733 | $ | 73,962 | $ | 54,210 | $ | 166,905 | ||||||||
| Additions | 932 | - | - | 932 | ||||||||||||
| Currency translation adjustments | 85 | 211 | 155 | 451 | ||||||||||||
| Balance, August 31, 2014 | $ | 39,750 | $ | 74,173 | $ | 54,365 | $ | 168,288 | ||||||||
| Depreciation | ||||||||||||||||
| Balance, May 31, 2014 | $ | 21,978 | $ | 42,058 | $ | 5,422 | $ | 69,458 | ||||||||
| Depreciation of the period | 1,290 | 2,389 | 2,436 | 6,115 | ||||||||||||
| Currency translation adjustments | 57 | 129 | 25 | 211 | ||||||||||||
| Balance at August 31, 2014 | $ | 23,325 | $ | 44,576 | $ | 7,883 | $ | 75,784 | ||||||||
| Carrying amounts | ||||||||||||||||
| Balance at May 31, 2014 | $ | 16,755 | $ | 31,904 | $ | 48,788 | $ | 97,447 | ||||||||
| Balance at August 31, 2014 | $ | 16,425 | $ | 29,597 | $ | 46,482 | $ | 92,504 | ||||||||
| 6. | RECLAMATION BOND |
As at August 31, 2014 the Company has not commenced development of any exploration and evaluation assets and accordingly a reasonable estimate of the timing of the cash flows cannot be made. The Company has posted non-interest bearing bonds totalling $523,826 (USD 481,767) (May 31, 2014 - $522,332 (USD 481,767)) with the Nevada Division of Minerals in the State of Nevada as security for these obligations. Fair value cannot be reasonably determined and accordingly the bonds have been recorded at historical cost, adjusted for current exchange rates.
| 9 |
CORVUS GOLD INC.
NOTES TO THE CONDENSED INTERIM CONSOLIDATED FINANCIAL STATEMENTS
(Unaudited)
(Expressed in Canadian dollars)
THREE MONTHS ENDED AUGUST 31, 2014 AND 2013
| 7. | CAPITALIZED ACQUISITION COSTS |
The Company had the following activity related to capitalized acquisition costs:
| Chisna | North Bullfrog | LMS | Total | |||||||||||||
| (note 7(a)) | (notes 7(d)) | (note 7(c)) | ||||||||||||||
| Balance, May 31, 2014 | $ | 550,255 | $ | 3,168,810 | $ | 326,050 | $ | 4,045,115 | ||||||||
| Acquisition costs | - | - | - | - | ||||||||||||
| Currency translation adjustments | 1,573 | 8,936 | 933 | 11,442 | ||||||||||||
| Balance, August 31, 2014 | $ | 551,828 | $ | 3,177,746 | $ | 326,983 | $ | 4,056,557 | ||||||||
The following table presents costs incurred for exploration and evaluation activities for the three months ended August 31, 2014:
| West Pogo | Chisna | North Bullfrog | LMS | Total | ||||||||||||||||
| (note 7(b)) | (note 7(a)) | (notes 7(d)) | (note 7(c)) | |||||||||||||||||
| Exploration costs: | ||||||||||||||||||||
| Aircraft services | $ | - | $ | 11,202 | $ | - | $ | - | $ | 11,202 | ||||||||||
| Assay | - | 8,865 | 211,632 | - | 220,497 | |||||||||||||||
| Drilling | - | - | 320,811 | - | 320,811 | |||||||||||||||
| Equipment rental | - | 1,466 | 102,388 | - | 103,854 | |||||||||||||||
| Field costs | 1,966 | 5,541 | 103,467 | 66 | 111,040 | |||||||||||||||
| Geological/ Geophysical | 3,558 | 1,811 | 224,429 | 27,220 | 257,018 | |||||||||||||||
| Land maintenance & tenure | - | - | 159,186 | - | 159,186 | |||||||||||||||
| Permits | - | - | - | - | - | |||||||||||||||
| Professional fees | - | - | - | - | - | |||||||||||||||
| Studies | - | - | 246,664 | - | 246,664 | |||||||||||||||
| Transportation | - | - | - | 298 | 298 | |||||||||||||||
| Travel | - | 5,133 | 51,962 | 1,423 | 58,518 | |||||||||||||||
| Total expenditures for the period | $ | 5,524 | $ | 34,018 | $ | 1,420,539 | $ | 29,007 | $ | 1,489,088 | ||||||||||
| 10 |
CORVUS GOLD INC.
NOTES TO THE CONDENSED INTERIM CONSOLIDATED FINANCIAL STATEMENTS
(Unaudited)
(Expressed in Canadian dollars)
THREE MONTHS ENDED AUGUST 31, 2014 AND 2013
The following table presents costs incurred for exploration and evaluation activities for the three months ended August 31, 2013:
| Chisna | North Bullfrog | Terra | Gerfaut | Total | ||||||||||||||||
| (note 7(a)) | (notes 7(d)) | |||||||||||||||||||
| Exploration costs: | ||||||||||||||||||||
| Aircraft services | $ | - | $ | - | $ | - | $ | - | $ | - | ||||||||||
| Assay | - | 390,439 | - | - | 390,439 | |||||||||||||||
| Drilling | - | 1,094,788 | - | - | 1,094,788 | |||||||||||||||
| Equipment rental | - | 169,959 | - | - | 169,959 | |||||||||||||||
| Field costs | 3,073 | 53,497 | 8 | 1,638 | 58,216 | |||||||||||||||
| Geological/Geophysical | 78 | 292,729 | - | - | 292,807 | |||||||||||||||
| Land maintenance & tenure | 1,815 | 141,888 | - | - | 143,703 | |||||||||||||||
| Permits | - | 2,001 | - | - | 2,001 | |||||||||||||||
| Professional fees | - | - | 221 | - | 221 | |||||||||||||||
| Studies | - | 271,292 | - | - | 271,292 | |||||||||||||||
| Transportation | - | - | - | - | - | |||||||||||||||
| Travel | 1,057 | 63,424 | - | - | 64,481 | |||||||||||||||
| Total expenditures for the period | $ | 6,023 | $ | 2,480,017 | $ | 229 | $ | 1,638 | $ | 2,487,907 | ||||||||||
| a) | Chisna Property, Alaska |
The Chisna property is located in the eastern Alaska Range, Alaska, and is comprised of unpatented mineral claims owned 100% by the Company and fee simple lands leased from Ahtna Incorporated.
On November 2, 2009, ITH and Talon Gold Alaska, Inc. (ITH’s wholly-owned Alaskan subsidiary) (“Talon Gold”) entered into an agreement (as amended) with Ocean Park Ventures Corp. (“OPV”). Pursuant to the agreement, an Alaskan subsidiary of OPV (“Subco”) and Raven Gold formed a joint venture (the “OPV/Raven JV”) for the purpose of exploring and developing the Chisna property.
On November 7, 2012, OPV withdrew from the joint venture and thereby returned 100% of the Chisna Project to the Company.
On March 24, 2010, Raven Gold entered into a Mineral Exploration Agreement with Option to Lease with Ahtna Incorporated (“Ahtna”), an Alaska Native Regional Corporation, concerning approximately 26,516 hectares of fee simple lands in the Athell Area of Alaska surrounding or adjacent to some of the blocks of mineral claims owned by Raven Gold (the “Ahtna Agreement”).
The key terms of the Ahtna Agreement include the following:
| · | exclusive right to explore, and the option to enter into a mining lease to develop and mine, the subject lands for a six-year period |
| · | annual option payments of USD 1.00 – USD 1.25 per acre |
| · | minimum exploration expenditures of USD 4.00 – USD 8.00 per acre, provided that if the agreement is not terminated at the end of any option year, the exploration expenditures for the next year become a firm commitment |
| · | at the end of the third year, Raven Gold will release at least 50% of the original lands subject to the agreement |
| · | preferential contracting, hiring and training practice for Ahtna shareholders or designees |
| · | scholarship contributions to the Ahtna Heritage Foundation (USD 10,000/year, subject to increase for inflation) |
| 11 |
CORVUS GOLD INC.
NOTES TO THE CONDENSED INTERIM CONSOLIDATED FINANCIAL STATEMENTS
(Unaudited)
(Expressed in Canadian dollars)
THREE MONTHS ENDED AUGUST 31, 2014 AND 2013
| · | all surface work subject to Ahtna archaeological and cultural clearance |
Upon Raven Gold having expended an aggregate of USD 1,000,000 (including 2,500 feet of core drilling) and having completed a feasibility study over some or all of the land subject to the exploration agreement within the six year term of the Ahtna Agreement, Raven Gold has the option to enter into a mining lease. The key terms of the mining lease include:
| · | exclusive mining rights for an initial term of ten years and so long thereafter as commercial production continues |
| · | minimum exploration expenditures of USD 4.00 – USD 9.00 per acre subject to the lease until commercial production is achieved, escalating over time |
| · | advance minimum royalty payments of USD 6.00 – USD 12.00 per acre escalating over time (50% deductible from production royalties) |
| · | NSR production royalties for gold and silver scaled from 2.5% (gold price USD 550 per ounce or less) to 14% (gold price USD 1,900 per ounce or higher). 2.5% on base metals and 3% on all minerals other than gold, silver or base metals |
| · | Ahtna is also entitled to receive an amount by which 20% of the net profits realized by Raven Gold from its mining operations on Ahtna minerals (10% in the case of non-Ahtna minerals) in any year exceed the aggregate royalties paid by Raven Gold to Ahtna in that year |
| · | Ahtna has the right to acquire a working interest in the lands subject to the lease, which is to be greater than or equal to 10% but not more than 15%, upon Raven Gold having made a production decision, and in consideration, Ahtna will be required to fund ongoing operations after such exercise in an amount equal to 200% of Ahtna’s percentage share of the pre-production expenditures incurred by Raven Gold (not including advance minimum royalty payments to Ahtna). |
As at August 31, 2014, the Ahtna Agreement is in good standing and the Company has made the required option payments, and completed the minimum exploration expenditures and contributions.
| b) | West Pogo Property, Alaska |
The West Pogo property is located approximately 50 kilometres north of Delta Junction, Alaska, and consists of unpatented mineral claims owned 100% by the Company.
During the year ended May 31, 2014, the Company wrote off the West Pogo property, as there had been a delay in exploration work on the property for an extended period of time.
| c) | LMS Property, Alaska |
The LMS property consists of unpatented mineral claims owned 100% by the Company.
| d) | North Bullfrog Project, Nevada |
The Company’s North Bullfrog project consists of certain leased patented lode mining claims and an additional 758 federal unpatented mining claims owned 100% by the Company.
| (i) | Interests acquired from Redstar Gold Corp. |
On October 9, 2009, a US subsidiary of ITH at the time (Corvus Nevada) completed the acquisition of all of the interests of Redstar Gold Corp. (“Redstar”) and Redstar Gold U.S.A. Inc. (“Redstar US”) in the North Bullfrog project, which consisted of the following leases:
| 12 |
CORVUS GOLD INC.
NOTES TO THE CONDENSED INTERIM CONSOLIDATED FINANCIAL STATEMENTS
(Unaudited)
(Expressed in Canadian dollars)
THREE MONTHS ENDED AUGUST 31, 2014 AND 2013
| (1) | Pursuant to a mining lease and option to purchase agreement made effective October 27, 2008 between Redstar and an arm’s length limited liability company, Redstar has leased (and has the option to purchase) 12 patented mining claims referred to as the “Connection” property. The ten-year, renewable mining lease requires advance minimum royalty payments (recoupable from production royalties, but not applicable to the purchase price if the option to purchase is exercised) of USD 10,800 (paid) on signing and annual payments for the first three anniversaries of USD 10,800 (paid) and USD 16,200 for every year thereafter (paid to September 30, 2014). Redstar has an option to purchase the property (subject to the NSR royalty below) for USD 1,000,000 at any time during the life of the lease. Production is subject to a 4% NSR royalty, which may be purchased by the lessee for USD 1,250,000 per 1% (USD 5,000,000 for the entire royalty). |
| (2) | Pursuant to a mining lease made and entered into as of May 8, 2006 between Redstar and two arm’s length individuals, Redstar has leased 3 patented mining claims which form part of the North Bullfrog project holdings. The lease is for an initial term of 10 years, and for so long thereafter as mining activities continue on the claims or contiguous claims held by the lessee. The lessee is required to pay advance minimum royalty payments (recoupable from production royalties) of USD 4,000 on execution, USD 3,500 on each of May 8, 2007, 2008 and 2009 (paid), USD 4,500 on May 8, 2010 and each anniversary thereafter, adjusted for inflation (paid to May 8, 2014). The lessor is entitled to receive a 2% NSR royalty on all production, which may be purchased by the lessee for USD 1,000,000 per 1% (USD 2,000,000 for the entire royalty). |
| (3) | Pursuant to a mining lease made and entered into as of May 8, 2006 between Redstar and an arm’s length private Nevada corporation, Redstar has leased 2 patented mining claims which form part of the North Bullfrog project holdings. The lease is for an initial term of 10 years, and for so long thereafter as mining activities continue on the claims or contiguous claims held by the lessee. The lessee is required to pay advance minimum royalty payments (recoupable from production royalties) of USD 2,000 on execution, USD 2,000 on each of May 8, 2007, 2008 and 2009 (paid), USD 3,000 on May 8, 2010 and each anniversary thereafter, adjusted for inflation (paid to May 8, 2014). The lessor is entitled to receive a 3% NSR royalty on all production, which may be purchased by the lessee for USD 850,000 per 1% (USD 2,550,000 for the entire royalty). |
| (4) | Pursuant to a mining lease made and entered into as of May 16, 2006 between Redstar and an arm’s length individual, Redstar has leased 12 patented mineral claims which form part of the North Bullfrog project holdings. The lease is for an initial term of 10 years, and for so long thereafter as mining activities continue on the claims or contiguous claims held by the lessee. The lessee is required to pay advance minimum royalty payments (recoupable from production royalties) of USD 20,500 on execution and USD 20,000 on each anniversary thereafter (paid to May 16, 2014). The lessor is entitled to receive a 4% NSR royalty on all production, which may be purchased by the lessee for USD 1,000,000 per 1% (USD 4,000,000 for the entire royalty). |
| (5) | Pursuant to a mining lease made and entered into as of May 22, 2006 between Redstar and two arm’s length individuals, Redstar has leased 3 patented mineral claims which form part of the North Bullfrog project holdings. The lease is for an initial term of 10 years, and for so long thereafter as mining activities continue on the claims or contiguous claims held by the lessee. The lessee is required to pay advance minimum royalty payments (recoupable from production royalties) of USD 8,000 on execution, USD 4,800 on each of May 22, 2007, 2008 and 2009 (paid), USD 7,200 on May 22, 2010 and each anniversary thereafter, adjusted for inflation (paid to May 22, 2014). The lessor is entitled to receive a 2% NSR royalty on all production, which may be purchased by the lessee for USD 1,000,000 per 1% (USD 2,000,000 for the entire royalty). |
| 13 |
CORVUS GOLD INC.
NOTES TO THE CONDENSED INTERIM CONSOLIDATED FINANCIAL STATEMENTS
(Unaudited)
(Expressed in Canadian dollars)
THREE MONTHS ENDED AUGUST 31, 2014 AND 2013
| (6) | Pursuant to a mining lease made and entered into as of June 16, 2006 between Redstar and an arm’s length individual, Redstar has leased one patented mineral claims which form part of the North Bullfrog project holdings. The lease is for an initial term of 10 years, and for so long thereafter as mining activities continue on the claims or contiguous claims held by the lessee. The lessee is required to pay advance minimum royalty payments (recoupable from production royalties) of USD 2,000 on execution, USD 2,000 on each of June 16, 2007, 2008 and 2009 (paid), USD 3,000 on June 16, 2010 and each anniversary thereafter, adjusted for inflation (paid to June 16, 2014). The lessor is entitled to receive a 2% NSR royalty on all production, which may be purchased by the lessee for USD 1,000,000 per 1% (USD 2,000,000 for the entire royalty). |
As a consequence of the acquisition of Redstar and Redstar US’s interest in the foregoing leases, Corvus Nevada is now the lessee under all of such leases. The Company acquired all of the shares of Corvus Nevada on August 26, 2010 upon the completion of the Arrangement.
| (ii) | Interests acquired directly by Corvus Nevada |
| (1) | Pursuant to a mining lease and option to purchase agreement made effective December 1, 2007 between Corvus Nevada and a group of arm’s length limited partnerships, Corvus Nevada has leased (and has the option to purchase) patented mining claims referred to as the “Mayflower” claims which form part of the North Bullfrog project. The terms of the lease/option are as follows: |
| ¤ | Terms: Initial term of five years, commencing December 1, 2007, with the option to extend the lease for an additional five years. The lease will continue for as long thereafter as the property is in commercial production or, alternatively, for an additional three years if Corvus Nevada makes advance minimum royalty payments of USD 100,000 per year (which are recoupable against actual production royalties). |
¤ | Lease Payments: USD 5,000 (paid) and 25,000 common shares of ITH (delivered) following regulatory acceptance of the transaction; and an additional USD 5,000 and 20,000 common shares on each of the first through fourth lease anniversaries (paid and issued). Pursuant to an agreement with the lessors, in lieu of the 20,000 ITH shares due December 1, 2010, Corvus Nevada paid USD 108,750 on November 10, 2010 and delivered 46,250 common shares of the Company on December 2, 2010. If Corvus Nevada elects to extend the lease for a second five-year term, it will pay USD 10,000 and deliver 50,000 common shares of ITH upon election being made, and an additional 50,000 common shares of ITH on each of the fifth through ninth anniversaries (USD 10,000 paid on October 31, 2012 and 50,000 common shares of ITH delivered on October 25, 2012 paid with cash of $126,924; and USD 10,000 paid on November 13, 2013 and 50,000 common shares of ITH delivered on November 25, 2013 paid with cash of $35,871). |
¤ | Work Commitments: USD 100,000 per year for the first three years (incurred), USD 200,000 per year for the years 4 – 6 (incurred) and USD 300,000 for the years 7 – 10. Excess expenditures in any year may be carried forward. If Corvus Nevada does not incur the required expenditures in year one, the deficiency is required to be paid to the lessors. |
¤ | Retained Royalty: Corvus Nevada will pay the lessors a NSR royalty of 2% if the average gold price is USD 400 per ounce or less, 3% if the average gold price is between USD 401 and USD 500 per ounce and 4% if the average gold price is greater than USD 500 per ounce. |
| (2) | Pursuant to a mining lease and option to purchase made effective March 1, 2011 between Corvus Nevada and an arm’s length individual, Corvus Nevada has leased, and has the option to purchase, 2 patented mineral claims which form part of the North Bullfrog project holdings. The lease is for an initial term of 10 years, subject to extension for an additional 10 years (provided advance minimum royalties are timely paid), and for so long thereafter as mining activities continue on the claims. The lessee is required to pay advance minimum royalty payments (recoupable from production royalties, but not applicable to the purchase price if the option to purchase is exercised) of USD 20,000 on execution (paid), USD 25,000 on each of March 1, 2012 (paid), 2013 (paid) and 2014 (paid), USD 30,000 on March 1, 2015 and each anniversary thereafter, adjusted for inflation. The lessor is entitled to receive a 2% NSR royalty on all production. The lessee may purchase the royalty for USD 1,000,000 per 1%. If the lessee purchases the entire royalty (USD 2,000,000) the lessee will also acquire all interest of the lessor in the subject property. |
| 14 |
CORVUS GOLD INC.
NOTES TO THE CONDENSED INTERIM CONSOLIDATED FINANCIAL STATEMENTS
(Unaudited)
(Expressed in Canadian dollars)
THREE MONTHS ENDED AUGUST 31, 2014 AND 2013
| (3) | Pursuant to a purchase agreement made effective March 28, 2013, Corvus Nevada has agreed to purchase the surface rights of five patented mining claims owned by two arm’s length individuals for USD 160,000 payable on closing (March 28, 2013). The Terms include payment by Corvus Nevada of a fee of USD 0.02 per ton of overburden to be stored on the property, subject to payment of a minimum of 12 million short tons. The minimum tonnage fee (USD 240,000) bears interest at 4.77% per annum from closing and is evidenced by a promissory note due on the sooner of the commencing of use of the property for waste materials storage or December 31, 2015. As a result, the Company recorded $406,240 (USD 400,000) in acquisition costs with $157,408 paid in cash and the remaining $248,832 (USD 240,000) in promissory note payable (note 8) during the year ended May 31, 2013. |
| (4) | In December 2013, SoN completed the purchase of a parcel of land approximately 30 km north of the North Bullfrog project which carries with it 1,600 acre feet of irrigation water rights. The cost of the land and associated water rights was cash payment of $1,100,118 (USD 1,034,626). |
Acquisitions
The acquisition of title to mineral properties is a detailed and time-consuming process. The Company has taken steps, in accordance with industry norms, to verify title to mineral properties in which it has an interest. Although the Company has taken every reasonable precaution to ensure that legal title to its properties is properly recorded in the name of the Company (or, in the case of an option, in the name of the relevant optionor), there can be no assurance that such title will ultimately be secured.
Environmental Expenditures
The operations of the Company may in the future be affected from time to time in varying degrees by changes in environmental regulations, including those for future removal and site restoration costs. Both the likelihood of new regulations and their overall effect upon the Company vary greatly and are not predictable. The Company’s policy is to meet or, if possible, surpass standards set by relevant legislation by application of technically proven and economically feasible measures.
Environmental expenditures that relate to ongoing environmental and reclamation programs are charged against earnings as incurred or capitalized and amortized depending on their future economic benefits. Estimated future removal and site restoration costs, when the ultimate liability is reasonably determinable, are charged against earnings over the estimated remaining life of the related business operation, net of expected recoveries. The Company has determined as of August 31, 2014, the disturbances to earth are minimal, therefore has not recorded a provision for environmental expenditures.
| 8. | PROMISSORY NOTE PAYABLE |
As at March 28, 2013 the Company issued a promissory note payable of USD 240,000 (May 31, 2014 - $260,208 (USD 240,000)) bearing interest at 4.77% per annum due on the sooner of the commencing of use of the property for waste materials storage as stated in note 7(d)(ii)(3) or December 31, 2015. At August 31, 2014, the promissory note payable was translated to $260,952.
| 15 |
CORVUS GOLD INC.
NOTES TO THE CONDENSED INTERIM CONSOLIDATED FINANCIAL STATEMENTS
(Unaudited)
(Expressed in Canadian dollars)
THREE MONTHS ENDED AUGUST 31, 2014 AND 2013
| 9. | SHARE CAPITAL |
Authorized
Unlimited common shares without par value.
Share issuances
During the period ended August 31, 2014:
On August 27, 2014, the Company closed a non-brokered public equity financing and issued 5,150,000 common shares at a price of $1.20 per share for gross proceeds of $6,180,000. In connection with the financing, the Company paid $190,167 in share issuance costs. The offering was registered under the United States Securities Act of 1933, as amended, pursuant to a Form S-1 registration statement filed with the United States Securities and Exchange Commission and qualified in certain Canadian provinces pursuant to a prospectus filed with the relevant Canadian regulatory authorities.
Stock options
Stock options awarded to employees and non-employees by the Company are measured and recognized in the condensed interim consolidated statement of comprehensive loss over the vesting period.
The Company has adopted an incentive stock option plan (the “2010 Plan”). The essential elements of the 2010 Plan provide that the aggregate number of common shares of the Company’s share capital that may be made issuable pursuant to options granted under the 2010 Plan (together with any other shares which may be issued under other share compensation plans of the Company) may not exceed 10% of the number of issued shares of the Company at the time of the granting of the options. Options granted under the 2010 Plan will have a maximum term of ten years. The exercise price of options granted under the 2010 Plan will not be less than the greater of the market price of the common shares (as defined by the Toronto Stock Exchange (“TSX”), currently defined as the 5 day volume weighted average price for the 5 trading days immediately preceding the date of grant) or the closing market price of the Company’s common shares for the trading day immediately preceding the date of grant), or such other price as may be agreed to by the Company and accepted by the TSX. Options granted under the 2010 Plan vest immediately, unless otherwise determined by the directors at the date of grant.
A summary of the status of the stock option plan as of August 31 and May 31, 2014, and changes during the periods are presented below:
| August 31, 2014 | May 31, 2014 | |||||||||||||||
| Number of Options | Weighted Average Exercise Price | Number of Options | Weighted Average Exercise Price | |||||||||||||
| Balance, beginning of the period | 6,175,234 | $ | 0.84 | 4,075,234 | $ | 0.88 | ||||||||||
| Granted | - | - | 2,470,000 | 0.76 | ||||||||||||
| Exercised | - | - | (70,000 | ) | (0.69 | ) | ||||||||||
| Forfeited | - | - | (300,000 | ) | (0.81 | ) | ||||||||||
| Balance, end of the period | 6,175,234 | $ | 0.84 | 6,175,234 | $ | 0.84 | ||||||||||
The weighted average share price, on the date of exercise, for the options exercised during the period ended August 31, 2014 was $nil (May 31, 2014 - $0.76). The weighted average remaining contractual life of options outstanding at August 31, 2014 was 3.21 years (May 31, 2014 - 3.46 years).
| 16 |
CORVUS GOLD INC.
NOTES TO THE CONDENSED INTERIM CONSOLIDATED FINANCIAL STATEMENTS
(Unaudited)
(Expressed in Canadian dollars)
THREE MONTHS ENDED AUGUST 31, 2014 AND 2013
Stock options outstanding are as follows:
| August 31, 2014 | May 31, 2014 | |||||||||||||||||||||||
| Expiry Date | Exercise Price | Number of Options | Exercisable at Period- End | Exercise Price | Number of Options | Exercisable at Year- End | ||||||||||||||||||
| September 27, 2014 (note 14) | $ | 1.08 | 150,000 | 150,000 | $ | 1.08 | 150,000 | 150,000 | ||||||||||||||||
| July 29, 2016 | $ | 0.50 | 483,334 | 483,334 | $ | 0.50 | 483,334 | 483,334 | ||||||||||||||||
| November 17, 2016 | $ | 0.67 | 210,000 | 210,000 | $ | 0.67 | 210,000 | 210,000 | ||||||||||||||||
| May 29, 2017 | $ | 0.92 | 300,000 | 300,000 | $ | 0.92 | 300,000 | 300,000 | ||||||||||||||||
| September 19, 2017 | $ | 0.96 | 2,561,900 | 1,628,370 | $ | 0.96 | 2,561,900 | 1,628,370 | ||||||||||||||||
| August 16, 2018 | $ | 0.76 | 2,470,000 | 1,645,020 | $ | 0.76 | 2,470,000 | 822,510 | ||||||||||||||||
| 6,175,234 | 4,416,724 | 6,175,234 | 3,594,214 | |||||||||||||||||||||
Stock-based compensation
The Company uses the fair value method for determining stock-based compensation for all options granted during the periods. The fair value of options granted was $Nil (2014 - $1,449,654), determined using the Black-Scholes option pricing model based on the following weighted average assumptions:
| Three Months Ended August 31, 2013 | ||||
| Risk-free interest rate | 1.96 | % | ||
| Expected life of options | 5 years | |||
| Annualized volatility | 100 | % | ||
| Dividend yield | 0.0 | % | ||
| Exercise price | $ | 0.76 | ||
| Fair value per share | $ | 0.59 | ||
Annualized volatility was determined by reference to historic volatility of similar entities following a comparable period in their lives.
| 17 |
CORVUS GOLD INC.
NOTES TO THE CONDENSED INTERIM CONSOLIDATED FINANCIAL STATEMENTS
(Unaudited)
(Expressed in Canadian dollars)
THREE MONTHS ENDED AUGUST 31, 2014 AND 2013
Stock-based compensation has been allocated as follows:
| For the three months ended August 31, | 2014 | 2013 | ||||||
| Consulting | $ | 123,826 | $ | 94,584 | ||||
| Exploration expenditures – Geological/geophysical | 16,431 | 14,909 | ||||||
| Investor relations | 71,219 | 93,506 | ||||||
| Professional fees | 18,777 | 13,514 | ||||||
| Wages and benefits | 226,228 | 171,824 | ||||||
| $ | 456,481 | $ | 388,337 | |||||
| 10. | RELATED PARTY TRANSACTIONS |
During the period ended August 31, 2014, the Company entered into the following transactions with related parties:
Management compensation
| For the three months ended August 31, | 2014 | 2013 | ||||||
| Consulting fees to CFO | $ | 18,000 | $ | 18,000 | ||||
| Wages and benefits to CEO, President and COO | 151,611 | 123,179 | ||||||
| Directors fees (included in consulting fees) | 22,500 | 18,774 | ||||||
| Fees to Vice President of Corporate Communications (included in investor relations) | 37,500 | 30,000 | ||||||
| Professional fees to Vice President | 19,260 | 22,470 | ||||||
| Stock-based compensation to related parties | 397,822 | 316,989 | ||||||
| $ | 646,693 | $ | 529,412 | |||||
As at August 31, 2014, included in accounts payable and accrued liabilities was $13,572 (May 31, 2014 – $27,462) in expenses owing to companies related to officers of the Company.
These amounts were unsecured, non-interest bearing and had no fixed terms or terms of repayment. Accordingly, fair value could not be readily determined.
The Company has entered into a retainer agreement dated June 1, 2011 with Lawrence W. Talbot Law Corporation (“LWTLC”), a company with officers in common, pursuant to which LWTLC agrees to provide legal services to the Company. Pursuant to the retainer agreement, the Company has agreed to pay LWTLC a minimum annual retainer of $72,000 (plus applicable taxes and disbursements). The retainer agreement may be terminated by LWTLC on reasonable notice, and by the Company on one year’s notice (or payment of one year’s retainer in lieu of notice). An officer of the Company is a director and shareholder of LWTLC.
The Company has also entered into change of control agreements with officers of the Company. In the case of termination, the officers are entitled to an amount equal to a multiple (ranging from two times to three times) of the sum of the annual base salary then payable to the officer, the aggregate amount of bonus(es) (if any) paid to the officer within the calendar year immediate preceding the Effective Date of Termination, and an amount equal to the vacation pay which would otherwise be payable for the one year period next following the Effective Date of Termination.
| 18 |
CORVUS GOLD INC.
NOTES TO THE CONDENSED INTERIM CONSOLIDATED FINANCIAL STATEMENTS
(Unaudited)
(Expressed in Canadian dollars)
THREE MONTHS ENDED AUGUST 31, 2014 AND 2013
| 11. | GEOGRAPHIC SEGMENTED INFORMATION |
The Company operates in one industry segment, the mineral resources industry, and in two geographical segments, Canada and the United States. All current exploration activities are conducted in the United States and Canada. The significant asset categories identifiable with these geographical areas are as follows:
| Canada | United States | Total | ||||||||||
| August 31, 2014 | ||||||||||||
| Capitalized acquisition costs | $ | - | $ | 4,056,557 | $ | 4,056,557 | ||||||
| Property and equipment | $ | 3,753 | $ | 88,751 | $ | 92,504 | ||||||
| May 31, 2014 | ||||||||||||
| Capitalized acquisition costs | $ | - | $ | 4,045,115 | $ | 4,045,115 | ||||||
| Property and equipment | $ | 4,057 | $ | 93,390 | $ | 97,447 | ||||||
| For the three months ended August 31, | 2014 | 2013 | ||||||
| Net loss for the period – Canada | $ | (821,989 | ) | $ | (680,657 | ) | ||
| Net loss for the period – United States | (1,805,029 | ) | (2,743,022 | ) | ||||
| Net loss for the period | $ | (2,627,018 | ) | $ | (3,423,679 | ) | ||
| 12. | SUPPLEMENTAL CASH FLOW INFORMATION |
| For the three months ended August 31, | 2014 | 2013 | ||||||
| Supplemental cash flow information | ||||||||
| Interest paid (received) | $ | - | $ | - | ||||
| Income taxes paid | $ | - | $ | - |
| 13. | SUBSIDIARIES |
Significant subsidiaries for the three months ended August 31, 2014 and 2013 are:
| Country of Incorporation | Principal Activity | The Company’s effective interest for 2014 | The Company’s effective interest for 2013 | |||||||||
| Corvus Gold (USA) Inc. | USA | Holding company | 100 | % | 100 | % | ||||||
| Raven Gold Alaska Inc. | USA | Exploration company | 100 | % | 100 | % | ||||||
| Corvus Gold Nevada Inc. | USA | Exploration company | 100 | % | 100 | % | ||||||
| SoN Land & Water LLC | USA | Exploration company | 100 | % | 100 | % | ||||||
| 14. | SUBSEQUENT EVENTS |
| a) | On September 8, 2014 the Company granted incentive stock options to consultants and employees of the Company to purchase 1,375,000 common shares in the share capital of the Company. The options are exercisable on or before September 8, 2019 at a price of $1.40 per share. The options will vest as to 33.3% on September 8, 2014, 33.3% on September 8, 2015, and 33.4% on September 8, 2016. |
| b) | On September 27, 2014, 150,000 stock options exercisable at a price of $1.08 per option expired unexercised. |
| 19 |
ITEM 2. MANAGEMENT’S DISCUSSION AND ANALYSIS OF FINANCIAL CONDITION AND RESULTS OF OPERATIONS
The following discussion and analysis should be read in conjunction with our unaudited consolidated financial statements for the three months ended August 31, 2014, and the related notes thereto, which have been prepared in accordance with generally accepted accounting principles in the United States (“U.S. GAAP”). This discussion and analysis contains forward-looking statements and forward-looking information that involve risks, uncertainties and assumptions. Our actual results may differ materially from those anticipated in these forward-looking statements and information as a result of many factors. See section heading “Note Regarding Forward-Looking Statements” below. All currency amounts are stated in Canadian dollars unless noted otherwise.
CAUTIONARY NOTE TO U.S. INVESTORS REGARDING ESTIMATES OF MEASURED, INDICATED AND INFERRED RESOURCES AND PROVEN AND PROBABLE RESERVES
Corvus Gold Inc. (“we”, “us”, “our,” “Corvus” or the “Company”) is a mineral exploration company engaged in the acquisition and exploration of mineral properties. The mineral estimates in this Quarterly Report on Form 10-Q have been prepared in accordance with the requirements of the securities laws in effect in Canada, which differ from the requirements of United States securities laws. As used in this Quarterly Report on Form 10-Q, the terms “mineral reserve”, “proven mineral reserve” and “probable mineral reserve” are Canadian mining terms as defined in accordance with Canadian National Instrument 43-101 “Standards of Disclosure for Mineral Projects” (“NI 43-101”) and the Canadian Institute of Mining, Metallurgy and Petroleum (the “CIM”) CIM Definition Standards on Mineral Resources and Mineral Reserves, adopted by the CIM Council, as amended. These definitions differ from the definitions in the United States Securities and Exchange Commission (“SEC”) Industry Guide 7 (“SEC Industry Guide 7”). Under SEC Industry Guide 7 standards, a “final” or “bankable” feasibility study is required to report reserves, the three-year historical average price is used in any reserve or cash flow analysis to designate reserves, and the primary environmental analysis or report must be filed with the appropriate governmental authority.
In addition, the terms “mineral resource”, “measured mineral resource”, “indicated mineral resource” and “inferred mineral resource” are defined in and required to be disclosed by NI 43-101; however, these terms are not defined terms under SEC Industry Guide 7 and are normally not permitted to be used in reports and registration statements filed with the SEC. Investors are cautioned not to assume that all or any part of a mineral deposit in these categories will ever be converted into reserves. “Inferred mineral resources” have a great amount of uncertainty as to their existence, and great uncertainty as to their economic and legal feasibility. It cannot be assumed that all, or any part, of an inferred mineral resource will ever be upgraded to a higher category. Under Canadian rules, estimates of inferred mineral resources may not form the basis of feasibility or pre-feasibility studies, except in rare cases. Investors are cautioned not to assume that all or any part of an inferred mineral resource exists or is economically or legally mineable. Disclosure of “contained ounces” in a resource is permitted disclosure under Canadian regulations; however, the SEC normally only permits issuers to report mineralization that does not constitute “reserves” by SEC standards as in place tonnage and grade without reference to unit measures.
Accordingly, information contained in this report and the documents incorporated by reference herein contain descriptions of our mineral deposits that may not be comparable to similar information made public by U.S. companies subject to the reporting and disclosure requirements under the United States federal securities laws and the rules and regulations thereunder.
The term “mineralized material” as used in this Quarterly Report on Form 10-Q, although permissible under SEC Industry Guide 7, does not indicate “reserves” by SEC Industry Guide 7 standards. We cannot be certain that any part of the mineralized material will ever be confirmed or converted into SEC Industry Guide 7 compliant “reserves”. Investors are cautioned not to assume that all or any part of the mineralized material will ever be confirmed or converted into reserves or that mineralized material can be economically or legally extracted.
CAUTIONARY NOTE TO ALL INVESTORS CONCERNING ECONOMIC ASSESSMENTS THAT INCLUDE INFERRED RESOURCES
The Company currently holds or has the right to acquire interests in an advanced stage exploration project in Nye County, Nevada referred to as the North Bullfrog Project (the “NBP”). Mineral resources that are not mineral reserves have no demonstrated economic viability. The preliminary assessments on the NBP are preliminary in nature and include “inferred mineral resources” that have a great amount of uncertainty as to their existence, and are considered too speculative geologically to have economic considerations applied to them that would enable them to be categorized as mineral reserves. It cannot be assumed that all, or any part, of an inferred mineral resource will ever be upgraded to a higher category. Under Canadian rules, estimates of inferred mineral resources may not form the basis of feasibility or pre-feasibility studies. There is no certainty that such inferred mineral resources at the NBP will ever be realized. Investors are cautioned not to assume that all or any part of an inferred mineral resource exists or is economically or legally mineable.
| 20 |
NOTE REGARDING FORWARD-LOOKING STATEMENTS
This Quarterly Report on Form 10-Q contains forward-looking statements or information within the meaning of the United States Private Securities Litigation Reform Act of 1995 concerning anticipated results and developments in the operations of the Company in future periods, planned exploration activities, the adequacy of the Company’s financial resources and other events or conditions that may occur in the future. Forward-looking statements are frequently, but not always, identified by words such as “expects,” “anticipates,” “believes,” “intends,” “estimates,” “potential,” “possible” and similar expressions, or statements that events, conditions or results “will,” “may,” “could” or “should” (or the negative and grammatical variations of any of these terms) occur or be achieved. These forward looking statements may include, but are not limited to, statements concerning:
| · | the Company’s strategies and objectives, both generally and in respect of its specific mineral properties; |
| · | the timing of decisions regarding the timing and costs of exploration programs with respect to, and the issuance of the necessary permits and authorizations required for, the Company’s exploration programs, including for the NBP; |
| · | the Company’s estimates of the quality and quantity of the resources at its mineral properties; |
| · | the timing and cost of planned exploration programs of the Company and its joint venture partners (as applicable), and the timing of the receipt of results therefrom; |
| · | the planned use of proceeds from the Company’s private placements completed in November 2013 and August 2014, from the exercises of stock options and warrants, and from the proceeds of the sale of the Company’s interest in the Terra Project, Alaska in February 2014; |
| · | the Company’s future cash requirements; |
| · | general business and economic conditions; |
| · | the Company’s ability to meet its financial obligations as they come due, and to be able to raise the necessary funds to continue operations; |
| · | the Company’s expectation that its joint venture partners will contribute the required expenditures, and make the required payments and share issuances (if applicable) as necessary to earn an interest in certain of the Company’s mineral properties in accordance with existing option/joint venture agreements; |
| · | the Company’s expectation that it will be able to add additional mineral projects of merit to its assets; |
| · | the planned completion of and timing for an updated resource estimate for the NBP, and for the preparation of a new Preliminary Economic Evaluation (“PEA”) of the NBP; |
| · | the potential for the existence or location of additional high-grade veins at the NBP; |
| · | the potential to expand the high grade gold and silver at the Yellowjacket target, and the potential to expand the higher grade bulk tonnage at the Sierra Blanca target, at the NBP; |
| · | the potential for any delineation of higher grade mineralization at the NBP; |
| · | the potential for there to be one or more additional vein zone(s) to the west and northeast of the current Yellowjacket high grade zone; |
| · | the potential discovery and delineation of mineral deposits/resources/reserves and any expansion thereof beyond the current estimate; |
| · | the potential for the NBP mineralization system to continue to grow and/or to develop into a major new higher-grade, bulk tonnage, Nevada gold discovery; and |
| · | the Company’s expectation that it will be able to build itself into a non-operator gold producer with significant carried interests and royalty exposure. |
Such forward-looking statements reflect the Company’s current views with respect to future events and are subject to certain known and unknown risks, uncertainties and assumptions. Many factors could cause actual results, performance or achievements to be materially different from any future results, performance or achievements that may be expressed or implied by such forward-looking statements, including, among others:
| · | risks related to our requirement of significant additional capital; |
| · | risks related to our limited operating history; |
| · | risks related to our history of losses; |
| · | risks related to cost increases for our exploration and, if warranted, development projects; |
| · | risks related to our properties being in the exploration stage; |
| · | risks related to mineral exploration and production activities; |
| · | risks related to our lack of mineral production from our properties; |
| · | risks related to estimates of mineral resources; |
| · | risks related to changes in mineral resource estimates; |
| · | risks related to differences in United States and Canadian reserve and resource reporting; |
| · | risks related to our exploration activities being unsuccessful; |
| · | risks related to fluctuations in gold, silver and other metal prices; |
| 21 |
| · | risks related to our ability to obtain permits and licenses for production; |
| · | risks related to government and environmental regulations that may increase our costs of doing business or restrict our operations; |
| · | risks related to proposed legislation that may significantly affect the mining industry; |
| · | risks related to land reclamation requirements; |
| · | risks related to competition in the mining industry; |
| · | risks related to equipment and supply shortages; |
| · | risks related to current and future joint ventures and partnerships; |
| · | risks related to our ability to attract qualified management; |
| · | risks related to the ability to enforce judgment against certain of our Directors; |
| · | risks related to currency fluctuations; |
| · | risks related to claims on the title to our properties; |
| · | risks related to surface access on our properties; |
| · | risks related to potential future litigation; |
| · | risks related to our lack of insurance covering all our operations; |
| · | risks related to our status as a “passive foreign investment company” under US federal tax code; and |
| · | risks related to the Common Shares. |
Should one or more of these risks or uncertainties materialize, or should underlying assumptions prove incorrect, actual results may vary materially from those described herein. This list is not exhaustive of the factors that may affect any of the Company’s forward-looking statements. Forward-looking statements are statements about the future and are inherently uncertain, and actual achievements of the Company or other future events or conditions may differ materially from those reflected in the forward-looking statements due to a variety of risks, uncertainties and other factors, including without limitation those discussed in Part II, Item 1A, Risk Factors, of this Quarterly Report on Form 10-Q, which are incorporated herein by reference, as well as other factors described elsewhere in this report and the Company’s other reports filed with the SEC.
The Company’s forward-looking statements contained in this Quarterly Report on Form 10-Q are based on the beliefs, expectations and opinions of management as of the date of this report. The Company does not assume any obligation to update forward-looking statements if circumstances or management’s beliefs, expectations or opinions should change, except as required by law. For the reasons set forth above, investors should not attribute undue certainty to or place undue reliance on forward-looking statements.
Current Business Activities
General
The Company’s material mineral property is the NBP, an advanced stage project in Nevada which has a number of high-priority, bulk tonnage and high-grade vein targets (held through Corvus Gold Nevada Inc. (“Corvus Nevada”), a Nevada subsidiary). In addition, the Company holds a 100% interest in three early stage projects in Alaska (Chisna, LMS and West Pogo) through its Alaskan subsidiary, Raven Gold Alaska Inc. (“Raven Gold”).
The primary focus of the Company will be to leverage its exploration expertise to discover major new gold deposits. Other than with respect to the NBP, the Company’s strategy is to leverage its assets by utilizing partner funding during the high-cost, development phase of exploration to minimize shareholder financial risk while building a non-operator, gold production portfolio with carried interests and royalty exposure. To meet this objective, the Company is presently looking for joint venture partners to advance exploration on the LMS, West Pogo and Chisna projects.
Highlights of activities during the period and to the date of this MD&A include:
| · | The Company had an offering pursuant to a registration statement on Form S-1 (“Registration Statement”) and a short form prospectus in Canada (the “Canadian Prospectus”) of 5,150,000 common shares (the “Shares”) of the Company at a price of $1.20 per Share for aggregate gross proceeds of $6,180,000 (the “Offering”). The Shares were issued on August 27, 2014 to certain funds managed by Van Eck Associates Corp., to the Tocqueville Gold Fund and to certain members of Corvus management and directors (collectively, the “Investors”), each such Investor being an accredited investor as such term is defined under National Instrument 45-106 - Prospectus and Registration Exemptions). No underwriter was involved in the preparation of the Registration Statement or Canadian Prospectus or performed any review of the contents of the Registration Statement or Canadian Prospectus, and no underwriter’s fee was payable in connection with the Offering. No securities were issued to any persons other than the Investors pursuant to the Registration Statement and Canadian Prospectus. |
| 22 |
| · | NBP Exploration: The 2014 Phase I drilling campaign started in February 2014 with focus on the Yellowjacket vein system and the Phase II program began in July. In September two core rigs began drilling to delineate the extent of the Josh Vein and explore the southern extensions. To date, 7250 metres have been drilled in 30 holes. It is anticipated that approximately 4,000 metres more will be completed before drilling stops at the end of November. |
| · | LMS Project (Alaska): Work is underway to prepare an initial mineral resource estimate for LMS incorporating drill data from the work by First Star during the Raven Gold/First Star joint venture and it is anticipated that a new independent technical report on the LMS project, containing an initial mineral resource estimate, will be issued in late 2014. |
| · | West Pogo Project (Alaska): A “Cooperation Agreement” has been signed with Dave Wright and Partners which allows them to market the West Pogo property together with their adjacent claims in an effort to find companies interested in exploring this area. The agreement allows Dave Wright and Partners to show the exploration data from the West Pogo claims to potential buyers but does not empower them to negotiate exploration agreements on the West Pogo property. |
| · | Chisna Project (Alaska): In July 2014 a modest exploration program was completed on the Rock On and Ptarmigan prospects to cover expenditure obligations on the property. |
Nevada Property
North Bullfrog Project
Our principal mineral property is the NBP, a gold exploration project located in northwestern Nye County, Nevada, in the Northern Bullfrog Hills about 15 km north of the town of Beatty. The NBP has indicated and inferred resources as defined under NI 43-101 criteria. The NBP technical information is in part summarized in the NI 43-101 technical report entitled “Technical Report – The North Bullfrog Project, Bullfrog Mining District, Nye County, Nevada” and dated April 1, 2014, which was prepared for us by Scott W. Wilson, SME, of Metal Mining Consultants, Inc., Gary Giroux, M.A. Sc., P. Eng. (BC), of Giroux Consultants Ltd. and Herbert Osborne, Metallurgical Eng., SME, of H. C. Osborne and Associates (the “NBP Technical Report”).
The NBP does not have SEC Industry Guide 7 compliant proven or probable reserves and our operations on the NBP are exploratory in nature.
The NBP is located in the Bullfrog Hills of northwestern Nye County, Nevada (Figure 1) and is 100% controlled by the Company. The NBP covers about 4,426 hectares of patented and unpatented mining claims in Sections 20, 21, 25, 26, 27, 28, 29, 32, 33, 34, 35, and 36 of T10S, R46E; sections 1, 2, 11, 12, 13, and 14 of T11S, R46E; section 31 of T10S, R47E; and section 6, T11S, R47E, MDBM. We have a total of eight option/lease agreements in place that give us control of an aggregate of 46 patented lode mining claims (Figure 2).
Based upon a US $1300 gold price and a silver to gold price ratio of 59:1, the NBP currently has estimated mineral resources defined in six deposits: the structurally controlled Yellowjacket milling deposit and the oxidized disseminated heap leach Sierra Blanca, Jolly Jane, Air Track West, Connection and Mayflower deposits. The Yellowjacket vein-style deposit has an Indicated Mineral Resource of 3.69 Mt at an average grade of 1.03 g/t gold and 5.52 g/t silver for 122,000 contained ounces of gold and 654,000 ounces of silver and an Inferred Mineral Resource of 18.40 Mt with an average grade of 0.94 g/t gold and 6.16 g/t silver for 555,000 contained ounces of gold and 3.64M ounces of silver, both at a 0.29 g/t gold cutoff. The five oxidized disseminated heap leach deposits contain an Indicated Mineral Resource of 25.72 Mt at an average grade of 0.29 g/t gold for 240,000 contained ounces of gold and an Inferred Mineral Resource of 185.99 Mt at 0.19 g/t gold for 1,136,000 contained ounces of gold (both at a 0.13 g/t gold cut-off), with appreciable silver credits. For full details with respect to the assumptions underlying the current resource estimate detailed herein, please review the NBP Technical Report.
| 23 |
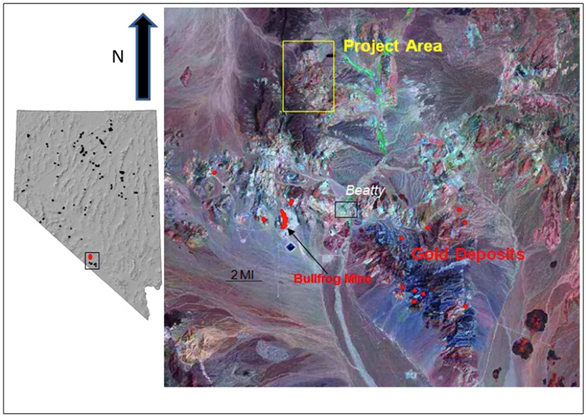
Figure 1 Property Map showing the Location of the North Bullfrog Project
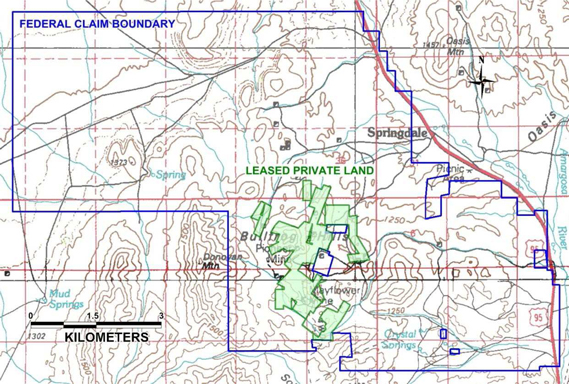
Figure 2 Property Map of the North
Bullfrog Project, Blue outline shows the NBP boundary
and green areas are the Leased Private Land
| 24 |
In the NBP Technical Report, six areas of activity are identified to advance the NBP, with the suggested budget given in Table 1:
| 1. | in-fill drilling at the Sierra Blanca and Jolly Jane areas to reduce drill hole spacing to increase confidence/compliance in the mineralization estimates; |
| 2. | step-out/definition drilling around the Sierra Blanca and Jolly Jane areas; |
| 3. | further metallurgical testing to further define performance of a heap leach on the oxide and mixed-oxide/sulfide portion of the mineralization and define performance of gravity and cyanide leach milling processes; |
| 4. | re-evaluation of the several known alteration/geochemical anomalies which should result in the identification of additional drill targets; |
| 5. | expansion of the drill testing of structural systems at Yellowjacket and other potential structural targets, and |
| 6. | development of environmental baseline data which requires a 1-year historical record prior to beginning the permitting process. |
Table 1: Proposed Budget to Support Recommended Program at the NBP
| Administration, Exploration and Resource Drilling for Mayflower, Sierra Blanca and Jolly Jane |
USD | 5.8 M |
| Baseline Metallurgical Testing | USD | 0.4 M |
| Baseline Data Collection | USD | 0.8 M |
| Total | USD | 7.0 M |
The Company is proceeding with the recommended program.
Drilling at Sierra Blanca and Yellowjacket began in February 2014 and will continue through November 2014. During that time it is anticipated that approximately 11,000 metres of drilling will be completed. Phase I drilling, which focused on the delineation of the West Vein and northern extension, was completed in June 2014 and Phase II, which is focused on the Josh Vein and the southern extensions, began in July. As part of Phase II, two core rigs began operating in September 2014. Part of the drilling will be of PQ3 diameter to collect sample material for metallurgical testing. Water samples are being collected on a quarterly basis from the monitor wells and springs in the area. The latest sampling event was in July 2014. The meteorological station has been maintained and continues to collect continuous data in the NBP area.
Following the return of all results from the Phase I and II 2014 programs, the Company plans on calculating a new resource estimate for the NBP in the first quarter of 2015. This new resource estimate will form the basis of an initial PEA that will incorporate the Yellowjacket discovery. The PEA is presently scheduled to be completed in the second quarter of 2015. In addition, the Company is engaged in detailed metallurgical studies of the new high-grade mineralization which have to date provided very encouraging initial results. The NBP is also being advanced on a number of development fronts as well as project characterization work ahead of permitting.
A summary of expenditures for the 3 months ended August 31, 2014 is provided in Table 2.
Table 2: NBP Expenditures in Q1 2015
| Project Labor | 0.199M |
| Drilling | 0.596M |
| Assay Costs | 0.134M |
| Project Studies | 0.261M |
| Total NBP | 1.190M |
Recent Exploration Work
Recent Drilling at the Yellowjacket Zone
During this period the Company has now received the assay results from the 13 additional drill holes completed as part of the Phase I and Phase II of the 2014 drill program. This drilling adds to the continuity of the West Vein and the extension of the Josh Vein to the north (Figure 3, Table 3).
| 25 |
Holes NB-14-387, 388 and 389 were drilled to test the southern limits of the West Vein/Josh Vein system (Table 3, Figure 3). Hole NB-14-387, returned 28 metres of 1 g/t gold and 6 g/t silver and expands the continuity of the Josh Vein 60 metres down dip from NB-12-184 (58 metres @ 1.7 g/t gold and 33 g/t silver, see NR13-03, January 22, 2013) and 50 metres south along strike from hole NB-14-389 (24.6 metres of 2.8 g/t gold and 14.1 g/t silver, see NR14-14, May 22, 2014). Between NB-14-389 and NB-14-387, the West Vein merges with the Josh Vein (Figure 3).
Holes NB-14-390, 391 and 392 have been drilled on the northern extension of the Josh Vein (Figure 3). The final complete vein plus stockwork intercept for NB-14-391 returned 18 metres of 8.5 g/t gold and 34 g/t silver. Hole NB-14-392, which represents a 40 metre step out to the north from NB-14-391, encountered 9.3 metres of 1.9 g/t gold and 12 g/t silver in the Josh Vein. In hole NB-14-390 the Josh Vein zone is present as thin silver-rich quartz veining within highly altered host rock which limited main vein development and thus resulted in less mineralization due to a lack of vein density (Table 3).
Drill hole NB-14-392 intersected the Josh Vein and its surrounding stockwork and continued to test a parallel target to the east of the main vein zone called the Rhyolite Zone (referring to its host rock). The hole was successful in intersecting 11.3 metres @ 3.3 g/t gold and 4 g/t silver in this new zone. This intersection is a follow-up to the original discovery hole drilled last year (NB-13-352 with 2.4 metres @ 7.6 g/t gold and 6.9 g/t silver, see NR13-29, October 29, 2013) and confirms its strike and dip. The Rhyolite Zone dips to the east similar to the Liberator Zone (50 metres east) and potentially represents a new high-grade vein system similar to the West Vein discovery made earlier this year.
Holes NB-14-393 through NB-14-398 mapped the Josh Vein structure to the north while hole NB-14-399 was drilled to fill a gap in the current drilling on the central portion of the Josh Vein. The drilling has shown that the Josh Vein fault structure continues to the north but is filled with silicified rock flour rather than vein material. However, two new mineralized structures have been discovered which will require follow-up.
Both holes NB-14-395 and 396 encountered significant mineralization along the NW10 Fault, a structure that was not previously known to be mineralized. In hole NB-14-395 the Josh Vein is less than 6 metres away from the NW10 fault which may play a role in the mineralization (Table 3). The interaction of these faults may also explain why the Josh Vein is only weakly mineralized to the north of hole NB-14-395.
In NB-14-397 a silicified fault running 0.44g/t gold and 5g/t silver over 3.7 metres was discovered. This feature is important because it is hosted in debris flow sediments that were previously assumed to be post-Yellowjacket mineralization cover. This discovery will open up new possibilities for exploration in the north.
These two structures, together with the Rhyolite Zone (NB-14-392 with 11.3 metres @ 3.3 g/t gold and 4 g/t silver and NB-13-352 with 2.4 metres @ 7.6 g/t gold and 6.9 g/t silver; NR Sept 4, 2014) indicate that the northern end of the Yellowjacket Zone is still open for exploration.
Hole NB-14-399 was drilled to fill a gap in the previous drilling at the point immediately north of the intersection of the West Vein and the Josh Vein (Figure 3). The hole has confirmed that the strike of the vein has changed to north-northwest at this location and that the vein is well mineralized. Hole NB-14-400 (assays pending) was drilled 50 metres down-dip from NB-14-399 and, based on the presence of visible gold, is expected to confirm the down-dip continuity of the vein there.
The Yellowjacket Vein Zone at the NBP is currently defined by the Josh-West Vein structural zone on the west and the Liberator Fault to the east (Figure 3). The interaction of these two faults has created a large broken zone which contains several quartz veined structures, such as the Josh Vein, and broad zones of stockwork mineralization. The West Vein strand delineated by 2014 drilling represents a new hangingwall splay off the main Josh Vein Fault as well as the new vein structure intercepts in NB-14-386. Ongoing drilling is continuing to intersect new vein structures within and around the overall Yellowjacket deposit.
Hole NB-14-402 returned a main Josh Vein intercept of 4.5 metres @ 14.6 g/t gold and 79 g/t silver. The bulk of hole NB-14-402 assays are still pending, but the current stockwork plus vein intercept returned 17 metres @ 4.9 g/t gold and 28 g/t silver (Table 3). This result is similar to the vein intercept in NB-13-370, which returned 4.9 metres @ 21.2g/t gold and 117 g/t silver (NR14-03, January 22, 2014), located 30 metres to the south in the same target area. The results from Hole 14-402 confirm the lateral continuity of the vein thickness and grade within the main shoot. In addition, this new intercept is located about 150 metres north along strike and 100 metres deeper than hole NB-14-399 and has significantly higher grades. Two other holes drilled in this target area have also intercepted broad zones of veining with visible gold and silver mineralization. At least two other holes are planned for this target area as exploration focuses on this higher-grade internal shoot zone within the Josh Vein system. Two other similar high-grade shoot type targets have been outlined within the nearly 1 kilometre long Josh Vein system, and it is also planned to drill these in 2014.
| 26 |
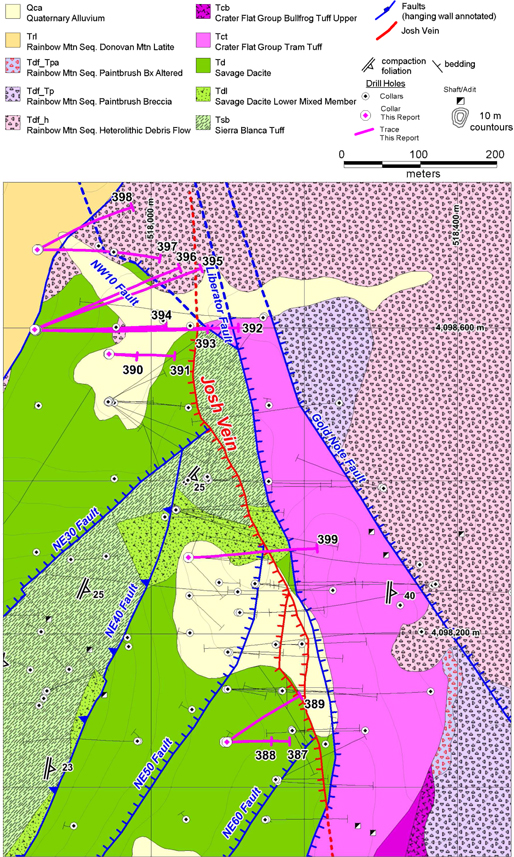
Figure 3 – Geologic Map of the Yellowjacket Area showing locations of collars and traces for holes cited in this report.
| 27 |
Table 3: Significant Intercepts*
from Yellowjacket South Quartz Vein System
(Reported drill intercepts are not true widths. At this time, there is insufficient data with
respect to the shape of the mineralization to calculate its true orientation in space.)
| Hole ID | From (m) | To (m) | Interval (m) | Gold (g/t) | Silver (g/t) | Comments | ||||||||||||||||
| 153.3 | 170.2 | 17.0 | 0.8 | 4.4 | WV HW Stockwork | |||||||||||||||||
| NB-14-387 | 170.2 | 173.6 | 3.3 | 1.9 | 13.8 | West Vein | ||||||||||||||||
| 173.6 | 181.1 | 7.5 | 1.0 | 6.4 | WV FW Stockwork | |||||||||||||||||
| Az 90 incl -63 | 27.8 | 1.0 | 6.1 | Vein + Stockwork | ||||||||||||||||||
| NB-14-388 | Az 90 incl -75 | No Significant Intercepts | Hole lost before target | |||||||||||||||||||
| 142.0 | 153.2 | 11.2 | 1.1 | 4.8 | WV HW Stockwork | |||||||||||||||||
| NB-14-389 | 153.2 | 161.7 | 8.5 | 6.1 | 33.6 | West Vein | ||||||||||||||||
| 161.7 | 166.6 | 4.9 | 1.0 | 1.8 | WV FW Stockwork | |||||||||||||||||
| Az 58 incl -57 | 24.6 | 2.8 | 14.1 | Vein + Stockwork | ||||||||||||||||||
| 130.8 | 147.0 | 16.2 | 0.58 | 1.72 | Disseminated | |||||||||||||||||
| 173.4 | 194.4 | 21.0 | 0.3 | 8.6 | JV HW Stockwork | |||||||||||||||||
| NB-14-390 | 194.4 | 198.4 | 4.0 | 0.2 | 7.8 | JV | ||||||||||||||||
| 198.4 | 216.5 | 18.1 | 0.2 | 12.9 | JV FW Stockwork | |||||||||||||||||
| 43.1 | 0.3 | 10.4 | Vein + Stockwork | |||||||||||||||||||
| Az 90 incl -80 | 223.6 | 229.6 | 6.0 | 0.69 | 2.00 | Disseminated | ||||||||||||||||
| NB-14-391 | 117.4 | 142.6 | 25.2 | 3.8 | 22.4 | JV HW Stockwork | ||||||||||||||||
| Including | 135.4 | 139.3 | 3.8 | 19.93 | 107.86 | |||||||||||||||||
| 142.6 | 151.0 | 8.4 | 17.3 | 66.3 | JV | |||||||||||||||||
| 151.0 | 156.3 | 5.3 | 0.7 | 5.8 | JV FW Stockwork | |||||||||||||||||
| 17.6 | 8.5 | 33.5 | Vein + Stockwork | |||||||||||||||||||
| Az 90 incl -67 | 204.5 | 228.0 | 23.5 | 0.67 | 0.85 | Disseminated | ||||||||||||||||
| 211.8 | 218.1 | 6.2 | 0.8 | 7.9 | JV HW Stockwork | |||||||||||||||||
| NB-14-392 | 218.1 | 219.0 | 0.9 | 12.7 | 58.3 | JV | ||||||||||||||||
| 219.0 | 221.1 | 2.1 | 0.4 | 1.3 | JV FW Stockwork | |||||||||||||||||
| 9.3 | 1.9 | 11.5 | Vein + Stockwork | |||||||||||||||||||
| Az 90 incl -45 | 251.1 | 262.4 | 11.3 | 3.32 | 4.14 | Rhyolite Stockwork | ||||||||||||||||
| 139.6 | 146.8 | 7.2 | 0.89 | 1.0 | Disseminated | |||||||||||||||||
| 181.6 | 187.2 | 5.6 | 0.82 | 1.1 | Disseminated | |||||||||||||||||
| 207.6 | 225.3 | 17.8 | 0.45 | 4.0 | JV HW Stockwork | |||||||||||||||||
| NB-14-393 | 225.3 | 228.3 | 3.0 | 0.66 | 40.5 | Josh Vein | ||||||||||||||||
| 228.3 | 231.6 | 3.3 | 0.25 | 11.2 | JV FW Stockwork | |||||||||||||||||
| Az 90 incl -51 | 293.5 | 360.1 | 66.7 | 0.46 | 0.9 | Disseminated | ||||||||||||||||
| 114.9 | 177.3 | 62.4 | 0.67 | 1.3 | Disseminated | |||||||||||||||||
| 242.2 | 245.5 | 3.3 | 0.40 | 12.6 | JV HW Stockwork | |||||||||||||||||
| NB-14-394 | 245.5 | 246.7 | 1.3 | 0.15 | 1.8 | Josh Vein | ||||||||||||||||
| 246.7 | 248.5 | 1.8 | 0.46 | 9.0 | JV FW Stockwork | |||||||||||||||||
| Az 90 incl -62 | 286.8 | 322.4 | 35.6 | 0.41 | 1.3 | Qtz Stockwork | ||||||||||||||||
| 226.5 | 234.4 | 7.9 | 0.42 | 8.7 | JV HW Stockwork | |||||||||||||||||
| NB-14-395 | 234.4 | 239.3 | 4.9 | 1.14 | 22.6 | Josh Vein | ||||||||||||||||
| 239.3 | 241.5 | 2.2 | 0.43 | 6.1 | JV FW Stockwork | |||||||||||||||||
| 245.1 | 254.7 | 9.6 | 1.13 | 6.4 | NW10 Fault | |||||||||||||||||
| 254.7 | 270.4 | 15.7 | 0.44 | 3.2 | NW10 Fault | |||||||||||||||||
| Az 69 incl -50 | 268.8 | 287.7 | 18.8 | 1.20 | 3.5 | NW10 HW Stockwork | ||||||||||||||||
| 147.6 | 160.9 | 13.4 | 0.41 | 1.2 | Disseminated | |||||||||||||||||
| 242.2 | 267.2 | 25.0 | 0.16 | 7.3 | JV HW Stockwork | |||||||||||||||||
| NB-14-396 | 267.2 | 267.7 | 0.5 | 0.14 | 2.9 | Josh Vein | ||||||||||||||||
| 267.7 | 269.8 | 2.1 | 0.15 | 2.6 | JV FW Stockwork | |||||||||||||||||
| 328.6 | 333.4 | 4.8 | 1.03 | 2.9 | NW10 Fault | |||||||||||||||||
| Az 66 incl -62 | 333.4 | 340.8 | 7.4 | 0.43 | 1.0 | NW10 HW Stockwork | ||||||||||||||||
| 40.5 | 44.2 | 3.7 | 0.44 | 5.0 | Silicified Fault in Debris Flow | |||||||||||||||||
| 28 |
| Hole ID | From (m) | To (m) | Interval (m) | Gold (g/t) | Silver (g/t) | Comments | ||||||||||||||||
| 141.5 | 218.7 | 77.2 | 0.35 | 1.5 | Disseminated | |||||||||||||||||
| 266.1 | 282.8 | 16.7 | 0.06 | 2.3 | JV HW Stockwork | |||||||||||||||||
| NB-14-397 | 282.8 | 286.0 | 3.1 | 0.05 | 2.7 | Josh Vein | ||||||||||||||||
| 316.3 | 324.8 | 8.5 | 0.70 | 1.6 | Py Veining | |||||||||||||||||
| 338.7 | 362.4 | 23.7 | 0.19 | 4.0 | Qtz Stockwork | |||||||||||||||||
| Az 90 incl -65 | 372.8 | 374.1 | 1.3 | 0.24 | 2.1 | NW10 Fault | ||||||||||||||||
| 147.4 | 166.8 | 19.4 | 0.37 | 0.9 | Disseminated | |||||||||||||||||
| 170.8 | 191.8 | 21.0 | 0.42 | 0.7 | Disseminated | |||||||||||||||||
| 231.5 | 243.0 | 11.5 | 0.73 | 1.0 | Qtz Stockwork | |||||||||||||||||
| 285.1 | 304.9 | 19.8 | 0.07 | 1.1 | JV HW Stockwork | |||||||||||||||||
| NB-14-398 | 304.9 | 308.1 | 3.2 | 0.04 | 0.4 | Josh Vein | ||||||||||||||||
| 308.1 | 311.4 | 3.3 | 0.03 | 0.3 | JV FW Stockwork | |||||||||||||||||
| Az 65 incl -68 | 334.7 | 340.0 | 5.3 | 0.41 | 1.0 | Qtz Stockwork | ||||||||||||||||
| 112.2 | 115.4 | 3.2 | 0.67 | 4.9 | JV HW Stockwork | |||||||||||||||||
| NB-14-399 | 115.4 | 116.9 | 1.6 | 10.59 | 59.1 | Josh Vein | ||||||||||||||||
| 116.9 | 121.6 | 4.7 | 0.99 | 4.3 | JV FW Stockwork | |||||||||||||||||
| 9.4 | 2.5 | 13.7 | Vein + Stockwork | |||||||||||||||||||
| Az 90 incl -45 | 147.1 | 154.2 | 7.1 | 0.66 | 1.0 | Qtz Stockwork | ||||||||||||||||
| 169.8 | 179.3 | 9.5 | 1.8 | 10.4 | JV HW Stockwork | |||||||||||||||||
| NB-14-402 | 179.3 | 183.7 | 4.5 | 14.6 | 79.0 | Josh Vein | ||||||||||||||||
| 183.7 | 186.8 | 3.0 | 0.4 | 5.3 | JV FW Stockwork | |||||||||||||||||
| Az 112, incl -46 | 17.0 | 4.9 | 28 | Vein + Stockwork | ||||||||||||||||||
*The veining and stockwork veining have been defined by geological observation of the percentage of veining in the interval, e.g. significant concentrations of veining in the immediate hangingwall and footwall of the main structure. Several intersections are below the assumed economic cutoff of 0.3g/t gold and are reported simply to indicate the tenor of the mineralization along the Josh Vein Fault.
New Metallurgical Data on Yellowjacket Zone
In December, 2013, a second set of composites were developed for Yellowjacket PQ core to provide source material for cyanide bottle roll testing and column leach testing at larger particle size. Bottle roll tests were conducted at 80% passing 200 mesh, 150 mesh, 100 mesh, 0.07 inch, 0.25 in and 0.75 inch. The bottle roll tests results are listed in Table 4, and indicate high gold and silver recovery at fine particle sizes, but substantially reduced recoveries at larger particle sizes. The test data in Table 4 indicated that Yellowjacket mineralization is suitable for a cyanide leach milling process.
Table 4: Yellowjacket Bottle Roll Test Results at Different Particle Size Gradations
(96 hours on 80% passing 200 mesh material)
| Composite | Feed Size (P80 - inches) | Au Recovery (%) | Ag Recovery (%) | NaCN Consumption (kg/mt) | Lime Added (kg/mt) | |||||||||||||||
| YJPQ01 | 0.75” | 12.7 | 10.5 | <0.09 | 0.5 | |||||||||||||||
| YJPQ01 | 0.25” | 30.4 | 24.9 | 0.12 | 0.7 | |||||||||||||||
| YJPQ01 | 0.07” | 50 | 46.9 | 0.17 | 0.7 | |||||||||||||||
| YJPQ01 | 100 mesh | 86.2 | 66.8 | <0.12 | 1.0 | |||||||||||||||
| YJPQ01 | 150 mesh | 88.4 | 68.7 | <0.12 | 1.0 | |||||||||||||||
| YJPQ01 | 200 mesh | 88.3 | 70.3 | 0.17 | 1.2 | |||||||||||||||
| YJPQ02 | 0.75” | 11.3 | 15 | 0.11 | 0.7 | |||||||||||||||
| YJPQ02 | 0.25” | 32.9 | 35.4 | <0.11 | 0.9 | |||||||||||||||
| YJPQ02 | 0.07” | 53.6 | 50.2 | 0.12 | 0.9 | |||||||||||||||
| YJPQ02 | 100 mesh | 92 | 74.3 | 0.1 | 1.3 | |||||||||||||||
| YJPQ02 | 150 mesh | 92.9 | 75.8 | <0.07 | 1.4 | |||||||||||||||
| YJPQ02 | 200 mesh | 90.4 | 77.4 | 0.18 | 1.2 | |||||||||||||||
| 29 |
| Composite | Feed Size (P80 - inches) | Au Recovery (%) | Ag Recovery (%) | NaCN Consumption (kg/mt) | Lime Added (kg/mt) | |||||||||||||||
| YJPQ03 | 0.75” | 13.7 | 11.4 | 0.09 | 0.6 | |||||||||||||||
| YJPQ03 | 0.25” | 27.3 | 20.5 | <0.07 | 0.8 | |||||||||||||||
| YJPQ03 | 0.07” | 45.9 | 38.4 | 0.12 | 1.1 | |||||||||||||||
| YJPQ03 | 100 mesh | 88.5 | 68.4 | <0.07 | 1.2 | |||||||||||||||
| YJPQ03 | 150 mesh | 88.3 | 65.9 | <0.07 | 1.3 | |||||||||||||||
| YJPQ03 | 200 mesh | 89.6 | 76.1 | 0.2 | 1.3 | |||||||||||||||
| YJPQ04 | 0.75” | 23.1 | 16.7 | 0.07 | 0.8 | |||||||||||||||
| YJPQ04 | 0.25” | 33.3 | 41.9 | <0.07 | 1.1 | |||||||||||||||
| YJPQ04 | 0.07” | 57.8 | 52.3 | <0.09 | 1.2 | |||||||||||||||
| YJPQ04 | 100 mesh | 61.4 | 62 | 0.11 | 1.5 | |||||||||||||||
| YJPQ04 | 150 mesh | 67.3 | 66 | <0.07 | 1.6 | |||||||||||||||
| YJPQ04 | 200 mesh | 68.8 | 66.7 | <0.08 | 2.5 | |||||||||||||||
| YJPQ05 | 0.75” | 43.9 | 29.4 | <0.07 | 1.0 | |||||||||||||||
| YJPQ05 | 0.25” | 44.2 | 36.8 | 0.07 | 1.2 | |||||||||||||||
| YJPQ05 | 0.07” | 54 | 47.4 | 0.16 | 1.3 | |||||||||||||||
| YJPQ05 | 100 mesh | 76.4 | 65 | <0.10 | 1.7 | |||||||||||||||
| YJPQ05 | 150 mesh | 76.2 | 70 | 0.1 | 1.8 | |||||||||||||||
| YJPQ05 | 200 mesh | 74.4 | 61.9 | <0.08 | 2.3 | |||||||||||||||
The composites were designed to be representative of the range of mineralization types and grades observed in the Yellowjacket vein system and are listed below:
| · | Composite YJPQ01 was made up of quartz vein material with an average calculated head grade (extracted gold plus gold remaining in the tail) of 6.7 g/t gold. |
| · | Composite YJPQ02 was composed of vein breccia (~30% quartz) and stockwork (less than 10% quartz) and had an average calculated head grade of 5.8 g/t gold. |
| · | Composite YJPQ03 was constructed of vein breccia and stockwork samples with an average calculated head grade of 1.8 g/t gold. |
| · | Composite YJPQ04 was constructed of samples with 5-10% quartz veining and had an average calculated head grade of 0.56 g/t gold. |
| · | Composite YJPQ05 was constructed entirely of stockwork and had an average calculated head grade of 0.46 g/t gold. |
Following the initial grind size test work the Company conducted follow-up gravity gold recovery testing and cyanide leaching of the gravity tail material from the main vein and stockwork core of the Yellowjacket deposit. These test samples are representative of an estimated 70% of the gold and 85% of the silver within the Yellowjacket deposit estimated mineral resource (location shown in Figure 4).
| 30 |

Figure 4: Corvus land position at the NBP with estimated mineral resource areas shown.
Results for the initial gravity followed by cyanide leaching of the tail material has produced high weighted recoveries for this zone, with an average of 89.2% for gold and 73% for silver (Tables 5 and 6). Of interest, 40% of the gold (weighted average) recovers via gravity separation with the concentrate reporting to just 0.06% of the processed material (a very high concentration ratio of greater than 1500 to 1).
The residual tail material after the gravity separation process produced an average weighted recovery in cyanide bottle roll tests of approximately 84% for gold and 71% for silver, which is similar to the average gold recovery from the oxide heap leach material. In addition, reagent consumptions are low as in earlier studies, averaging below 0.15 kg/t cyanide and about 1.5 kg/t for lime. Test work is ongoing for the surrounding, primarily lower grade, material hosting the remaining estimated 30% of gold and 15% of silver within the Yellowjacket deposit.
The tests were conducted at a coarse grind size of 65 mesh for the gravity separation and 100 mesh for the bottle roll tests, confirming the earlier grind size optimization results reported in Table 4. These results establish a clear path to proceed with optimization studies for the design of a simple, coarse grind, high recovery, milling circuit for the Yellowjacket deposit.
The presently envisioned system would include initial gravity separation of coarse gold and silver followed by cyanide leaching of the gravity tail either as an agglomerated product on the leach pad or in a standard CIL leach circuit for final gold-silver recovery. The ongoing metallurgical testing will focus on maximizing gold-silver recovery and minimizing potential processing costs. These studies are intended to better define the currently proposed mill flow sheet, plant design and estimated actual recovery predictions for operations.
| 31 |
Table 5 –
Results of Gravity Recoverable Gold testing followed by Cyanide Bottle Roll testing of
the Yellowjacket Deposit Composites.
| Metallurgical Test Results | ||||||||||||||||||||||
| Metallurgical Composite | Calculated Au Head Grade (g/t) | Yellowjacket Mineralization Type* | % of Yellowjacket Deposit Contained Au | Gravity Gold Recovery (%) | Gravity Tail BRT, Additional Gold Recovery (%) | Total Gold Recovered in Tests (%) | ||||||||||||||||
| YJPQ01 | 9.22 | Main Vein | 30 | % | 50.7 | 43.0 | 93.7 | |||||||||||||||
| YJPQ02 | 5.78 | Stockwork | 13 | % | 57.8 | 36.7 | 94.5 | |||||||||||||||
| YJPQ03 | 1.40 | Stockwork | 15 | % | 25.7 | 62.6 | 88.3 | |||||||||||||||
| YJPQ04 | 0.59 | Stockwork*** | 6 | % | 23.6 | 49.3 | 72.9 | |||||||||||||||
| YJPQ05 | 0.55 | Stockwork*** | 6 | % | ** | 76.4 | 76.4 | |||||||||||||||
*-consist of 17% Indicated and 83% Inferred Resource
**-no gravity recovery testing performed due to limited sample
***-mixed oxide and sulphide mineralization
Table 6 - Results
of Gravity Recoverable Silver testing followed by Cyanide Bottle Roll testing
of the Yellowjacket Deposit Composites
| Metallurgical Test Results | ||||||||||||||||||||||
| Metallurgical Composite | Calculated Ag Head Grade (g/t) | Yellowjacket Mineralization Type* | % of Yellowjacket Deposit Contained Ag | Gravity Silver Recovery (%) | Gravity Tail BRT Additional Silver Recovery (%) | Total Silver Recovered in Tests (%) | ||||||||||||||||
| YJPQ01 | 47.4 | Main Vein | 45 | % | 11.7 | 63.4 | 75.1 | |||||||||||||||
| YJPQ02 | 20.0 | Stockwork | 11 | % | 5.8 | 71.2 | 76.9 | |||||||||||||||
| YJPQ03 | 8.2 | Stockwork | 15 | % | 2.3 | 68.9 | 71.2 | |||||||||||||||
| YJPQ04 | 4.9 | Stockwork*** | 7 | % | 1.9 | 62.3 | 64.2 | |||||||||||||||
| YJPQo5 | 0.6 | Stockwork*** | 7 | % | ** | 65.0 | 65.0 | |||||||||||||||
*-consist of 16% Indicated and 84% Inferred Resource
**-no gravity recovery testing performed due to limited sample
***-mixed oxide and sulphide mineralization
Other Developments
A number of other advances associated with the potential development of the NBP have taken place during the last quarter.
Water
In December 2013, the Company completed the purchase of a 430 acre fee simple parcel of land located about 30 miles north of the NBP area which carries with it 1,600 acre-feet of irrigation water rights within the Sarcobatus Flats water basin. Cost of the land and water was USD 1,000,000. This water right is significant because it provides all water presently anticipated to be required under the current conceptual NBP mine plan. The first phase of the hydrologic characterization program was completed during the 2013 drill program which successfully identified a potential water production well site in the Sarcobatus Flats (Nevada State Water Basin 146) within the northwest portion of the NBP. The test well, NB-WW-10, penetrated over 300 metres of alluvial material with a static water level beginning at a depth of 55 metres and sustained air lift water production in excess of 100 gpm for several hours. The Company has registered the purchase of the water rights with the Nevada State Engineer (“NSE”), and received the annual extension of the water rights from the NSE to June 2015. As NBP progresses, the Company will begin to make application to the NSE to move the production point to the NBP, and change the application to mining.
| 32 |
Power
The upgrade of the main power line, located along Highway 95 on the east side of the NBP, by Valley Electric Association is nearly complete. The upgraded capacity of the line exceeds the current projected power requirements of the NBP. The Company contributed USD 28,500 for the line upgrade.
Highway
Nevada Highway 95, connecting Las Vegas and Reno, passes the NBP approximately 1.6 km to the east, and received extensive maintenance upgrade during the summer of 2013. The highway has been re-surfaced between Las Vegas and a point to the north of the NBP, thereby providing for efficient road access to the site. The Company will be making application for the necessary rights-of-way for road traffic from the highway to the proposed mine facilities.
Baseline Characterization
In January 2014, Corvus Nevada executed a Memorandum of Understanding (“MOU”) with the Tonopah Office of the US Bureau of Land Management (“BLM”) for definition of baseline characterization requirements and development of a mining plan of operations at the NBP. Characterization plans for hydro-geologic modeling studies, rock geochemical studies and biologic/wildlife studies have been developed and have been reviewed by BLM specialists. The Company is in the process of responding to comments and additional requirements received from the BLM with respect to such plans.
A total of seven additional hydrologic test wells were drilled during 2013 to facilitate water level monitoring and water quality sampling stations located around the NBP. These wells have been equipped with down-hole sample pumps. A network of nine surface springs is also being sampled in the greater area around the project site to ensure completeness in regional characterization. Sampling events have been conducted in Q1-Q4 of the fiscal year ending May 31, 2014, and in Q1 of the current fiscal year ending May 31, 2015.
A meteorological station was constructed during August 2012, and has now accumulated 24 months of continuous data.
Rock geochemistry characterization work has been underway since 2012, with both Acid-Base accounting static testing and Humidity Cell Testing data collected for the initially proposed pre-Yellowjacket high-grade discovery mining plan. Initial data have formed the basis of the geochemistry characterization plan document, which is now being updated to reflect the addition of the newly defined Yellowjacket deposit to the updated proposed mining plan. A geochemical block model of the Sierra Blanca/Yellowjacket resource has been completed to guide the sample selection for characterization of the Yellowjacket waste materials.
Qualified Person and Quality Control/Quality Assurance
Jeffrey A. Pontius (CPG 11044), a qualified person as defined by National Instrument 43-101, has supervised the preparation of the scientific and technical information that forms the basis for the NBP disclosure in this Quarterly Report on Form 10-Q (other than the NBP resource estimate) and has approved the disclosure herein. Mr. Pontius is not independent of the Company, as he is the CEO and holds common shares and incentive stock options.
The exploration program at the NBP was designed and supervised by Russell Myers (CPG-11433), President of the Company, and Mark Reischman, Nevada Exploration Manager, who are responsible for all aspects of the work, including the quality control/quality assurance program. On-site personnel at the project log and track all samples prior to sealing and shipping. All sample shipments are sealed and shipped to ALS Minerals in Reno, Nevada, for preparation and then on to ALS Minerals in Reno, Nevada, or Vancouver, B.C., for assay. McClelland Laboratories Inc. prepared composites from duplicated RC sample splits collected during drilling. Bulk samples were sealed on site and delivered to McClelland Laboratories Inc. by ALS Minerals or Corvus personnel. All metallurgical testing reported here was conducted or managed by McClelland Laboratories Inc.
Carl Brechtel (Colorado PE 23212 and Nevada PE 8744), a qualified person as defined by National Instrument 43-101, has supervised the NBP metallurgical testing program and has approved the disclosure in this Quarterly Report on Form 10-Q related thereto. Mr. Brechtel is not independent of the Company, as he is the Chief Operating Officer and holds common shares and incentive stock options.
Mr. Scott E. Wilson, SME, President of Metal Mining Consultants Inc., is an independent consulting geologist specializing in mineral reserve and resource calculation reporting, mining project analysis and due diligence evaluations. He is acting as the Qualified Person, as defined in NI 43-101, for the NBP Technical Report (other than the potions for which other QP’s are responsible, as noted below), and specifically for the Mineral Resource Estimate (other than the estimate of the NBP mineralization inventory). Mr. Wilson has over 23 years’ experience in surface mining and is a Registered Member of the Society of Mining, Metallurgy and Exploration. Mr. Wilson and Metal Mining Consultants, Inc. are independent of the Company under NI 43-101.
| 33 |
Mr. Gary Giroux, M.Sc., P. Eng (B.C.), a consulting geological engineer employed by Giroux Consultants Ltd., has acted as the Qualified Person, as defined in NI 43-101, for the estimate of the NBP mineralization inventory contained in the NBP Technical Report. He has over 30 years of experience in all stages of mineral exploration, development and production. Mr. Giroux specializes in computer applications in ore reserve estimation, and has consulted both nationally and internationally in this field. He has authored many papers on geostatistics and ore reserve estimation and has practiced as a Geological Engineer since 1970 and provided geostatistical services to the industry since 1976. Both Mr. Giroux and Giroux Consultants Ltd. are independent of the Company under NI 43-101.
Mr. Herbert Osborne, SME, a consulting metallurgist, has acted as the Qualified Person, as defined by NI 43-101, for evaluation of the metallurgical testing data contained in the NBP Technical Report. He has over 50 years of experience in mineral process design and operations. He is a registered Member of the Society of Mining, Metallurgy and Exploration (SME Member No. 2430050 RM). Mr. Osborne is independent of the Company under NI 43-101.
ALS Minerals’ quality system complies with the requirements for the International Standards ISO 9001:2000 and ISO 17025:1999. Analytical accuracy and precision are monitored by the analysis of reagent blanks, reference material and replicate samples. Quality control is further assured by the use of international and in-house standards. Finally, representative blind duplicate samples are forwarded to ALS Minerals and an ISO compliant third party laboratory for additional quality control.
Results of Operations
Three months ended August 31, 2014 Compared to Three months ended August 31, 2013
For the three months ended August 31, 2014, the Company had a net loss of $2,627,018 compared to a net loss of $3,423,679 in the comparative period of the prior year. Included in net loss was $456,481 (2013 - $388,337) in stock-based compensation charges which is a result of previously granted stock options which vested during the period. The decrease in loss of $796,661in the three month period of the current year was due to a combination of factors discussed below.
The primary factor for the decrease in the net loss was the exploration expenditures of $1,489,088 incurred in the current period compared to $2,487,907 in the comparative period of the prior year. The exploration activities of the Company decreased mainly due to less funding being available in the current period compared with the comparative period of the prior year. This decrease was slightly offset by an increase in stock-based compensation charges of $16,431 in the current period compared to $14,909 in the prior period.
Consulting fees increased to $168,826 (2013 - $135,858) mainly due to increased stock-based compensation charges of $123,826 during the current period compared to $94,584 in the prior period.
Investor relations expenses decreased to $184,524 (2013 - $276,159) due to decreased stock-based compensation charges of $71,219 during the current period compared to $93,506 in the prior period. This was further decreased by $69,348 due to a combination of decreases in investor relations-related travel, advertising and marketing, and the number of personnel engaged as the Company worked on completing the financing which closed at the end of August 2014.
Professional fees increased to $114,489 (2013 - $62,017) primarily due to increased stock-based compensation charges of $18,777 during the current period compared to $13,514 in the prior period, and an increase of $47,209 in legal and accounting fees in the current period compared to the prior period as a result of the Company registering its securities in the United States.
Regulatory expenses increased to $55,157 (2013 - $15,172) due to additional filing and listing fees incurred in the current period due to the Company’s registration of its securities in the US.
Wages and benefits increased to $447,970 (2013 - $360,665) mainly due to an increase in stock-based compensation charges of $226,228 in the current period compared to $171,824 in the prior period and an increase of $32,901 in wages and benefits in the current period.
Other expense categories that reflected only moderate change period over period were administration expenses of $3,015 (2013 - $1,636), charitable donations of $nil (2013 - $516), depreciation expenses of $6,115 (2013 - $4,916), insurance expenses of $11,462 (2013 - $14,160), office expenses of $35,343 (2013 - $35,597), rent expenses of $23,121 (2013 – $22,738) and travel expenses of $12,244 (2013 - $17,997).
| 34 |
Other items amounted to a loss of $75,664 compared to an income of $11,659 in the prior period. This was mainly due to an unrealized loss on marketable securities of $38,977 in the current period compared to $nil in the comparative period of the prior year. There was an increase in foreign exchange to a loss of $38,457 (2013 - $11,631), which is the result of factors outside of the Company’s control and a decrease in interest income of $1,770 (2013 - $23,290) as a result of less investment in cashable GIC’s during the current period.
Liquidity and Capital Resources
The Company has no revenue generating operations from which it can internally generate funds. To date, the Company’s ongoing operations have been financed by the sale of its equity securities by way of private placements and the exercise of incentive stock options and share purchase warrants. The Company believes that it will be able to secure additional private placements and public financings in the future, although it cannot predict the size or pricing of any such financings. In addition, the Company can raise funds through the sale of interests in its mineral properties, although current market conditions have substantially reduced the number of potential buyers/acquirers of any such interest(s). This situation is unlikely to change until such time as the Company can develop a bankable feasibility study on one of its projects. When acquiring an interest in mineral properties through purchase or option, the Company will sometimes issue common shares to the vendor or optionee of the property as partial or full consideration for the property interest in order to conserve its cash.
The Company reported cash and cash equivalents of $6,642,082 as at August 31, 2014 compared to $3,227,970 as at May 31, 2014. The change in cash position was the net result of $932 used on property and equipment, $2,536,915 used for operating activities and $5,989,833 received from the public offering (net of share issue costs) during the three months ended August 31, 2014.
As at August 31, 2014, the Company had working capital of $6,811,892 compared to working capital of $2,986,574 as at May 31, 2014. The Company expects that it will operate at a loss for the foreseeable future and believes the current cash and cash equivalents will be sufficient for it to maintain its currently held properties, and fund its currently anticipated general and administrative costs, for the balance of the year ending May 31, 2015. The Company’s current anticipated operating expenses are $5,040,000 until May 31, 2015. The Company’s anticipated burn rate averages approximately $1,072,000 for September to November, 2014, where approximately $208,000 is for administrative purposes and approximately $864,000 is for planned exploration expenditures related to the completion of the ongoing Phase II exploration program at the NBP. From December 2014 to May 2015, the monthly burn rate averages approximately $304,000, of which $208,000 is for administrative purposes and approximately $96,000 is for planned exploration expenditures related to the ongoing Phase II exploration program at the NBP. The Company anticipates that it will pursue additional public or private equity financings in late 2014 to raise additional funds for additional exploration at the NBP. In any event, the Company will be required to raise additional funds, again through public or private equity financings, prior to the end of May 2015 in order to continue in business. Should such financing not be available in that time-frame, the Company will be required to reduce its activities and will not be able to carry out all of its presently planned exploration and development activities at the NBP on its currently anticipated scheduling.
The Company currently has no further funding commitments or arrangements for additional financing at this time (other than the potential exercise of incentive stock options) and there is no assurance that the Company will be able to obtain additional financing on acceptable terms, if at all. There is significant uncertainty that the Company will be able to secure any additional financing in the current equity markets. The quantity of funds to be raised and the terms of any proposed equity financing that may be undertaken will be negotiated by management as opportunities to raise funds arise. Specific plans related to the use of proceeds will be devised once the proposed offering has been completed and management knows what funds will be available for these purposes.
The Company has no exposure to any asset-backed commercial paper. Other than cash held by its subsidiaries for their immediate operating needs in Alaska and Nevada, all of the Company’s cash reserves are on deposit with a major Canadian chartered bank. The Company does not believe that the credit, liquidity or market risks with respect thereto have increased as a result of the current market conditions. However, in order to achieve greater security for the preservation of its capital, the Company has, of necessity, been required to accept lower rates of interest, which has also lowered its potential interest income.
| 35 |
Off-Balance Sheet Arrangements
The Company has no off-balance sheet arrangements.
Environmental Regulations
The operations of the Company may in the future be affected from time to time in varying degrees by changes in environmental regulations, including those for future removal and site restoration costs. Both the likelihood of new regulations and their overall effect upon the Company vary greatly and are not predictable. The Company’s policy is to meet or, if possible, surpass standards set by relevant legislation by application of technically proven and economically feasible measures
Certain U.S. Federal Income Tax Considerations for U.S. Holders
The Company has been a “passive foreign investment company” (“PFIC”) for U.S. federal income tax purposes in recent years and expects to continue to be a PFIC in the future. Current and prospective U.S. shareholders should consult their tax advisors as to the tax consequences of PFIC classification and the U.S. federal tax treatment of PFICs. Additional information on this matter is included in the Company’s Registration Statement on Form S-1/A as filed with the SEC on August 7, 2014, under “Certain United States Federal Income Tax Considerations”.
ITEM 3. QUANTITATIVE AND QUALITATIVE DISCLOSURES ABOUT MARKET RISK
Not applicable.
ITEM 4. CONTROLS AND PROCEDURES
Disclosure Controls and Procedures
As of August 31, 2014, an evaluation was carried out under the supervision of and with the participation of the Company’s management, including the Chief Executive Officer (the principal executive officer) and Chief Financial Officer (the principal financial officer and accounting officer), of the effectiveness of the design and operation of the Company’s disclosure controls and procedures (as defined in Rules 13a-15(e) and 15d-15(e) of the Exchange Act). Based on the evaluation, the Chief Executive Officer and the Chief Financial Officer have concluded that, as of August 31, 2014, the Company’s disclosure controls and procedures were effective in ensuring that: (i) information required to be disclosed in reports filed or submitted to the SEC under the Exchange Act is recorded, processed, summarized and reported within the time periods specified in applicable rules and forms and (ii) material information required to be disclosed in our reports filed under the Exchange Act is accumulated and communicated to management, including the Chief Executive Officer and Chief Financial Officer, in a manner that allows for accurate and timely decisions regarding required disclosures.
The effectiveness of our or any system of disclosure controls and procedures, however well designed and operated, can provide only reasonable assurance that the objectives of the system will be met and is subject to certain limitations, including the exercise of judgement in designing, implementing and evaluating controls and procedures and the assumptions used in identifying the likelihood of future events.
Changes in Internal Control over Financial Reporting
There were no changes in internal control over financial reporting during the quarter ended August 31, 2014 that have materially, or are reasonably likely to materially affect, the Company’s internal control over financial reporting.
| 36 |
None.
There have been no material changes from the risk factors set forth in our Registration Statement on Form S-1/A as filed with the SEC on August 7, 2014.
ITEM 2. UNREGISTERED SALES OF EQUITY SECURITIES AND USE OF PROCEEDS
Unregistered Sales of Equity Securities
None
Repurchase of Securities
None
Use of Proceeds
On August 27, 2014, the Company closed a non-brokered public equity financing and issued 5,150,000 common shares at a price of $1.20 per share for gross aggregate proceeds of $6,180,000 (the “Offering”). The offering was registered under the United States Securities Act of 1933, as amended, pursuant to a Form S-1 registration statement filed with the United States Securities and Exchange Commission (the “Registration Statement”) and qualified in certain Canadian provinces pursuant to a prospectus filed with the relevant Canadian regulatory authorities.
The Registration Statement (File No. 333-197099) went effective on August 20, 2014. The Offering commenced on August 20, 2014 and closed on August 27, 2014 upon the sale of all 5,150,000 common shares registered under the Registration Statement. The aggregate amount registered was $6,180,000 (US$5,768,000 based on an exchange rate of $1=US$0.9327). In connection with the Offering, the Company paid $190,167 in share issuance costs.
Of the $5,989,833 in net proceeds received from the offering, the net proceeds have been used as follows:
| Company Cost Center | Budget 2015 Q1 Jun 1 – Aug 31 | Actual 2015 Q1 Jun 1 – Aug 31* | Variance (Budget – Actual) Jun 1 – Aug 31 | |||||||||
| Corporate | ||||||||||||
| Company Administration | $ | 600,000 | $ | 603,000 | $ | (3,000 | ) | |||||
| Land & Corp Support | $ | 125,000 | $ | 222,000 | $ | (97,000 | ) | |||||
| Subtotal | $ | 725,000 | $ | 825,000 | $ | (100,000 | ) | |||||
| NBP Exploration | ||||||||||||
| Project Labor | $ | 323,800 | $ | 199,000 | $ | 124,800 | ||||||
| Drilling | $ | 812,700 | $ | 596,000 | $ | 216,700 | ||||||
| Assay Costs | $ | 166,800 | $ | 134,000 | $ | 32,800 | ||||||
| Project Studies | $ | 256,700 | $ | 261,000 | $ | (4,300 | ) | |||||
| Subtotal | $ | 1,560,000 | $ | 1,190,000 | $ | 370,000 | ||||||
| Total | $ | 2,285,000 | $ | 2,015,000 | $ | 270,000 | ||||||
*Unaudited Cost Reporting
Actual Land & Corp Support expenditures are above the planned expenditures as land payments scheduled for 2015 Q2 were paid in 2015 Q1. Actual Project Labor and Drilling expenditures were below planned expenditures as the Company halted drilling in August while it worked on closing the public equity financing.
| 37 |
ITEM 3. DEFAULTS UPON SENIOR SECURITIES
None.
ITEM 4. MINE SAFETY DISCLOSURES
Pursuant to Section 1503(a) of the Dodd-Frank Act, issuers that are operators, or that have a subsidiary that is an operator, of a coal or other mine in the United States are required to disclose specified information about mine health and safety in their periodic reports. These reporting requirements are based on the safety and health requirements applicable to mines under the Federal Mine Safety and Health Act of 1977 (the “Mine Act”) which is administered by the U.S. Department of Labor’s Mine Safety and Health Administration (“MSHA”). During the three month period ended August 31, 2014, the Company and its subsidiaries and their properties or operations were not subject to regulation by MSHA under the Mine Act and thus no disclosure is required under Section 1503(a) of the Dodd-Frank Act.
None.
| 38 |
| 3.1* | Notice of Articles, dated April 13, 2010 |
| 3.2* | Articles, dated April 12, 2010 |
| 23.1 | Consent of Scott W. Wilson, SME, of Metal Mining Consultants, Inc. |
| 23.2 | Consent of Gary Giroux, M.A. Sc., P. Eng. (BC), of Giroux Consultants Ltd. |
| 23.3 | Consent of Herbert Osborne, Metallurgical Eng., SME, of H. C. Osborne and Associates |
| 31.1 | Certification of Chief Executive Officer pursuant to Exchange Act Rules 13a-14(a) and 15d-14(a), as adopted pursuant to Section 302 of the Sarbanes-Oxley Act of 2002. |
| 31.2 | Certification of Chief Financial Officer pursuant to Exchange Act Rules 13a-14(a) and 15d-14(a), as adopted pursuant to Section 302 of the Sarbanes-Oxley Act of 2002. |
| 32.1 | Certification of the Chief Executive Officer pursuant to 18 U.S.C. Section 1350, as adopted pursuant to Section 906 of the Sarbanes-Oxley Act of 2002. |
| 32.2 | Certification of the Chief Financial Officer pursuant to 18 U.S.C. Section 1350, as adopted pursuant to Section 906 of the Sarbanes-Oxley Act of 2002. |
| 101.INS*(1) | XBRL Instance Document |
| 101.SCH*(1) | XBRL Taxonomy Extension – Schema |
| 101.CAL*(1) | XBRL Taxonomy Extension – Calculations |
| 101.DEF*(1) | XBRL Taxonomy Extension – Definitions |
| 101.LAB*(1) | XBRL Taxonomy Extension – Labels |
| 101.PRE*(1) | XBRL Taxonomy Extension – Presentations |
* - Previously filed with the SEC as an exhibit to the Company’s DRS filing as filed with the SEC on May 12, 2014.
| (1) | Submitted Electronically Herewith. Attached as Exhibit 101 to this report are the following formatted in XBRL (Extensible Business Reporting Language): (i) the Condensed Interim Consolidated Balance Sheets at August 31, 2014 and May 31, 2014, (ii) the Condensed Interim Consolidated Statements of Operations and Comprehensive Loss for the Three Months ended August 31, 2014 and 2013, (iii) the Condensed Interim Consolidated Statements of Cash Flows for the Three Months Ended August 31, 2014 and 2013, (iv) the Condensed Interim Consolidated Statements of Changes in Equity for the Three Months Ended August 31, 2014 and 2013, (v) the Notes to the Condensed Interim Consolidated Financial Statements. |
| 39 |
Pursuant to the requirements of Section 13 or 15(d) of the Securities Exchange Act of 1934, the registrant has duly caused this report to be signed on its behalf by the undersigned, thereunto duly authorized.
CORVUS GOLD INC.
(the Registrant)
| By: | /s/ Jeffrey Pontius | |
| Jeffrey Pontius | ||
| Chief Executive Officer | ||
| (Principal Executive Officer) | ||
| Date: October 14, 2014 | ||
| By: | /s/ Peggy Wu | |
| Peggy Wu | ||
| Chief Financial Officer | ||
| (Principal Financial and Accounting Officer) | ||
| Date: October 14, 2014 | ||
| 40 |