Attached files
| file | filename |
|---|---|
| 8-K - 8-K - Bristow Group Inc | d803301d8k.htm |
 October 10, 2014
Returns Comparison
Exhibit 99.1 |
 2
Illustrative comparison of return metrics
•
Bristow believes a good capital deployment strategy includes a
mix of leased assets and owned assets
•
The company uses the metric Bristow Value Added (BVA), which
is a tailored version of the cash flow value added (CFVA) metric
also similar to the economic value added (EVA) metric
BVA is our primary metric for evaluating capital deployment decisions
We believe BVA is a superior metric to other off the shelf metrics like return
on capital (ROC) for a company with a mix of leased and owned assets
BVA is the largest component of management incentive bonuses at Bristow
•
We provide the following summary as an illustrative reconciliation
of a traditional ROC calculation to an adjusted ROC calculation
(similar to a BVA return calculation) which we believe is a more
meaningful return calculation for our capital structure
|
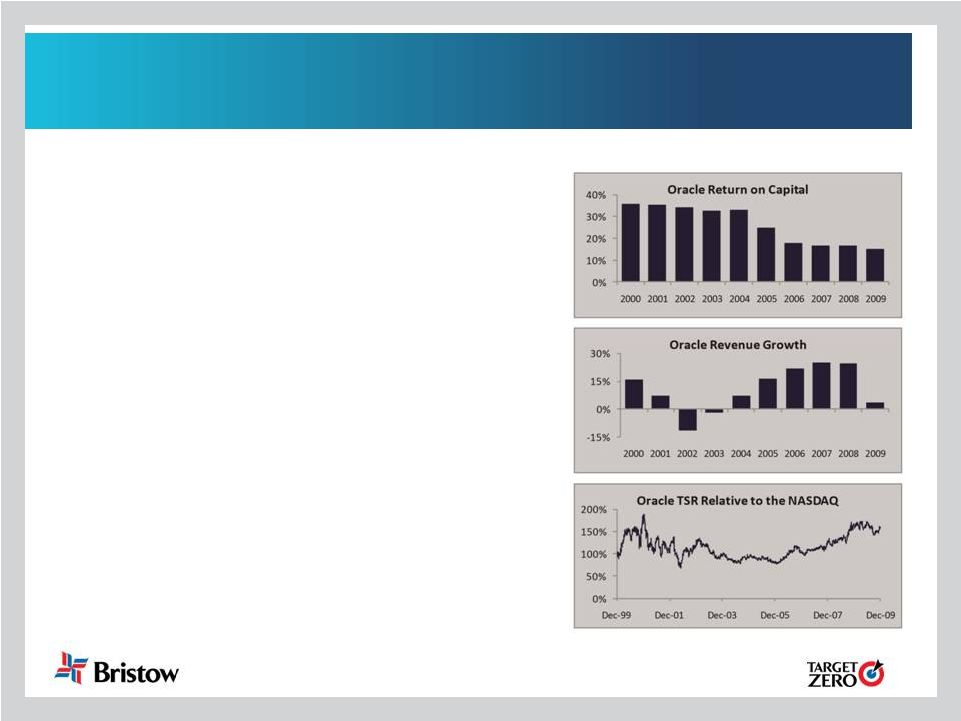 TSR
requires a growth and return balance Return alone only measures quality and
not quantity •
Don’t Be Too Preoccupied with Return
on
Capital
Gregory
V.
Milano,
Fortuna
Advisors (May 19, 2010)
•
Study was based on the 1000 Largest Non-
Financial US Companies as of 12/31/2009,
excluding those not public for the entire 10-yr
period of the study, yielding 765 companies.
“…sacrificing returns to achieve higher
revenue growth worked for most
companies…
14% of the companies had
higher revenue growth and lower return on
capital in the second half of the decade, 57%
of these higher-growth lower-return
companies generated TSR above the
median. Among these were well-known
companies including Oracle, PepsiCo, CVS
Caremark and Procter & Gamble.”
3
, |
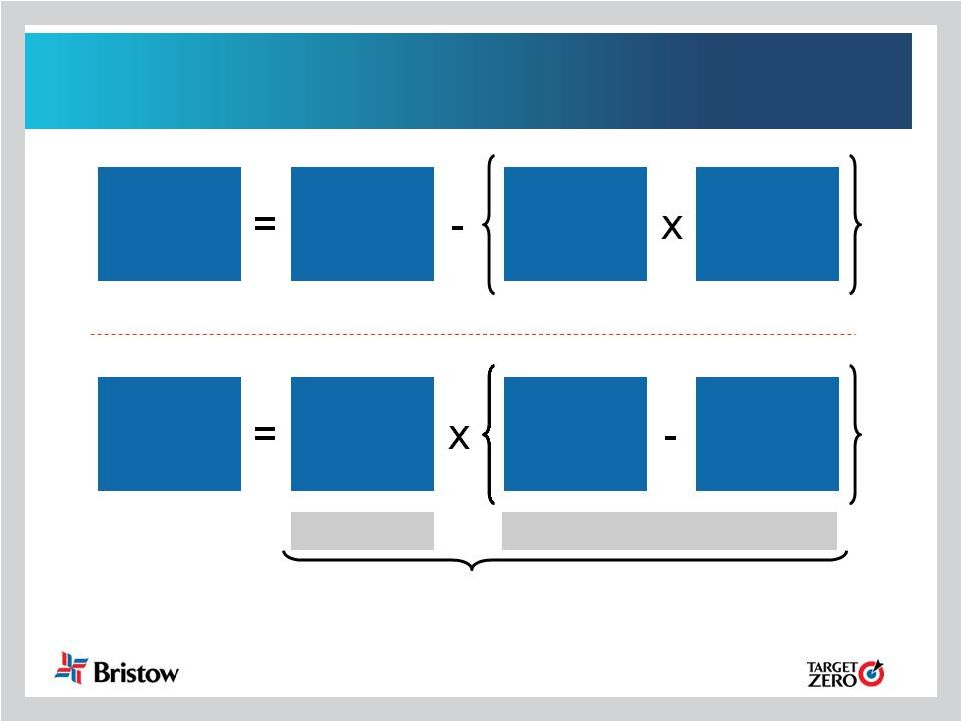 BVA
balances growth and return Two equivalent ways to calculate BVA
BVA
Gross
Cash Flow
Gross
Operating
Assets
Required
Return
(10.5%)
BVA
Gross
Operating
Assets
Gross
Cash Flow
Return
Required
Return
(10.5%)
Quality
Quantity
BVA captures quantity and quality
which return measures do not
4 |
 5
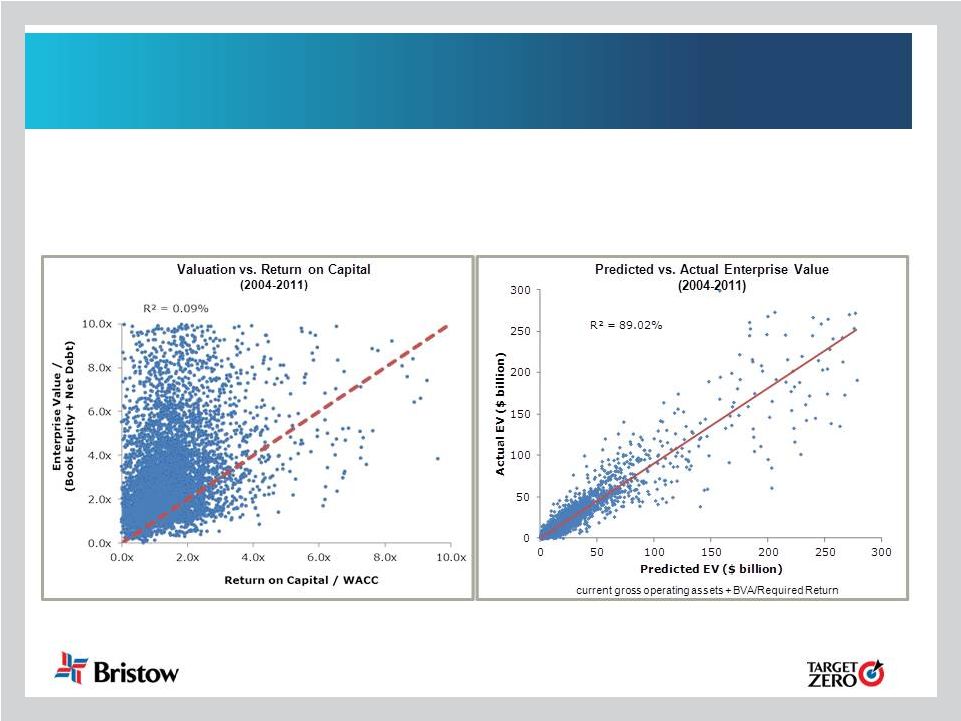
BVA is a superior valuation metric
•
When used in valuation (current gross operating assets + NPV of future BVA), BVA
predicts enterprise values quite well even when future BVA is assumed
constant. •
The approach helps solve the apparent disconnect between market valuation and
traditional measures of performance such as the ROC/WACC relationship.
Note: Right chart employs Fortuna Advisor’s standard proprietary framework for BVA-like
measures. See “Postmodern Corporate Finance” in the Spring 2010 issue of the
Journal of Applied Corporate Finance
|
 6
ROC misses important performance aspects
BVA treatment:
•
•
•
•
•
Leases
Remove
rent
to
get
EBITDAR
and
capitalize
the
present
value
of leases as a debt equivalent
Depreciation:
Remove
depreciation
to
get
EBITDAR
and
add
back
accumulated depreciation to capital
Cash
Remove
from
capital
–
reflects
negative
debt
•
Líder
Remove
equity
accounting
and
replace
with
proportional
consolidation
Goodwill
Remove
to
reflect
operating
returns
but
adjust
BVA
incentive goals to target enough BVA improvement to justify the
required return on the goodwill over five years
:
:
:
: |
 7
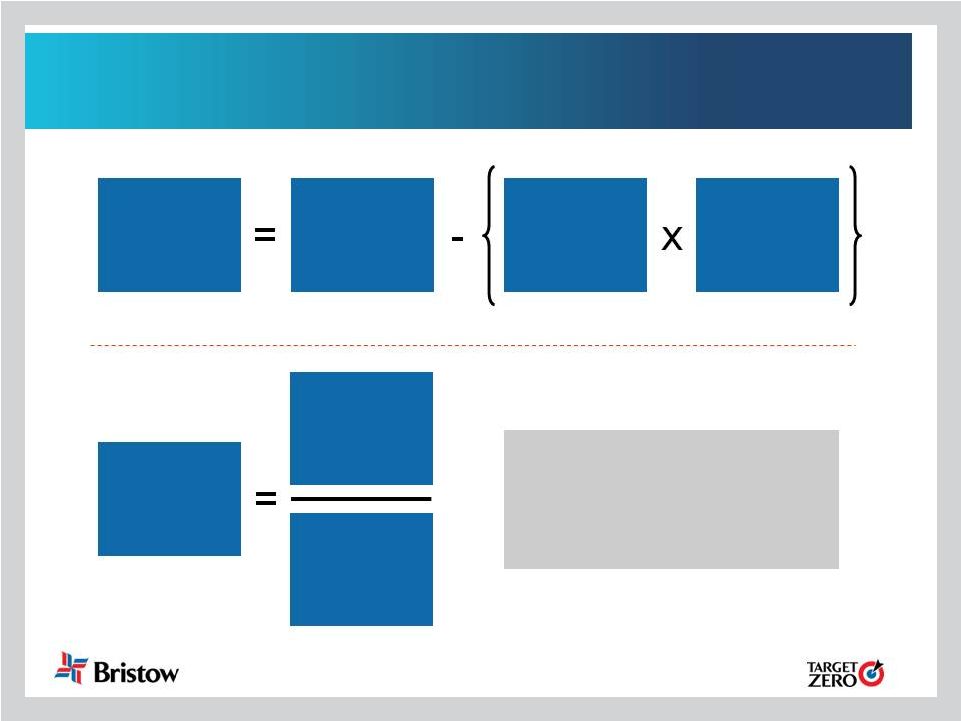
Gross cash flow return (GCFR)
A BVA-like return measure
BVA
Gross
Cash Flow
Gross
Operating
Assets
Required
Return
(10.5%)
Gross
Cash Flow
Return
The numerator and denominator
in Gross Cash Flow Return are
the very same Gross Cash Flow
and Gross Operating Assets
used in calculating BVA.
Gross
Operating
Assets
Gross
Cash Flow |
 8
Bridge ROC to GCFR: FY13
Gross cash flow return numerator and denominator from BVA
NOTE: For illustrative purposes only
7.2%
10.7%
1.5%
2.0%
0.4%
0.4%
5.0%
6.0%
7.0%
8.0%
9.0%
10.0%
11.0%
12.0%
13.0%
ROC
Leases
D&A
Líder
Other
GCFR
FY13 |
 9
Bridge ROC to GCFR: FY14
Gross cash flow return numerator and denominator from BVA
NOTE: For illustrative purposes only
7.2%
12.1%
2.3%
1.6%
1.0%
5.0%
6.0%
7.0%
8.0%
9.0%
10.0%
11.0%
12.0%
13.0%
ROC
Leases
D&A
Líder
GCFR
FY14 |
 10
Treatment of leases in BVA and GCFR
•
In BVA and GCFR, the present value of lease commitments is added
to gross
operating assets
Equivalent to taking out a level payment loan to finance making a one time
payment to purchase the rights to the asset over the lease term.
The hypothetical loan value (i.e. capital) would be the present value of the
principal and interest payments (same as the rent)
Encourages risk reduction by managing lease commitments which can be helpful
in the next industry downturn (easier to not renew a lease than to sell an
owned asset during a downturn)
•
In BVA and GCFR, lease expense (i.e. rent) is removed from gross
cash flow
Consistent with ignoring principal and interest payments on the hypothetical loan
when calculating EBITDA or EBITDAR
Alternatively can be viewed as consistent with removal of depreciation and
interest when calculating EBITDAR on owned assets
•
Bristow has limits on the volume of lease commitments to avoid excessive
fixed charges, and manages lease durations as a balanced portfolio
|
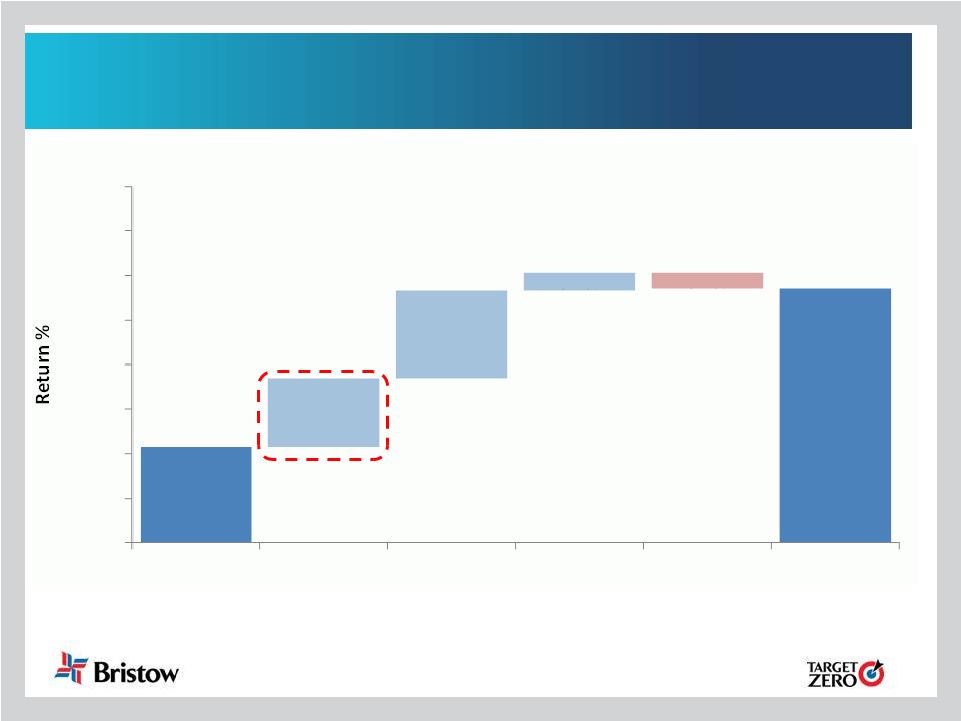
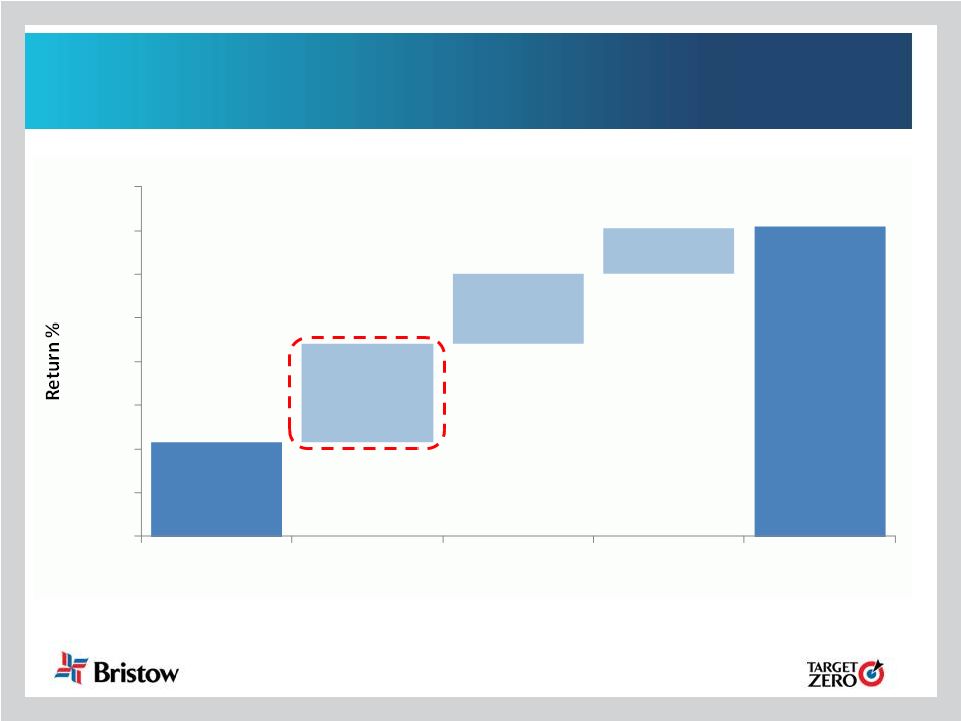
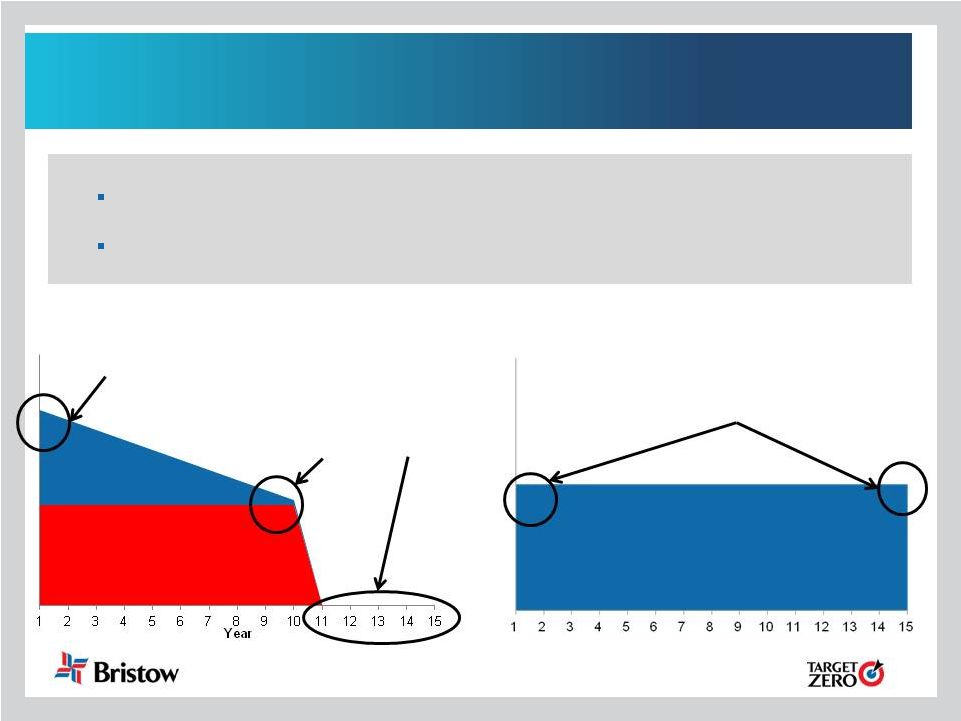
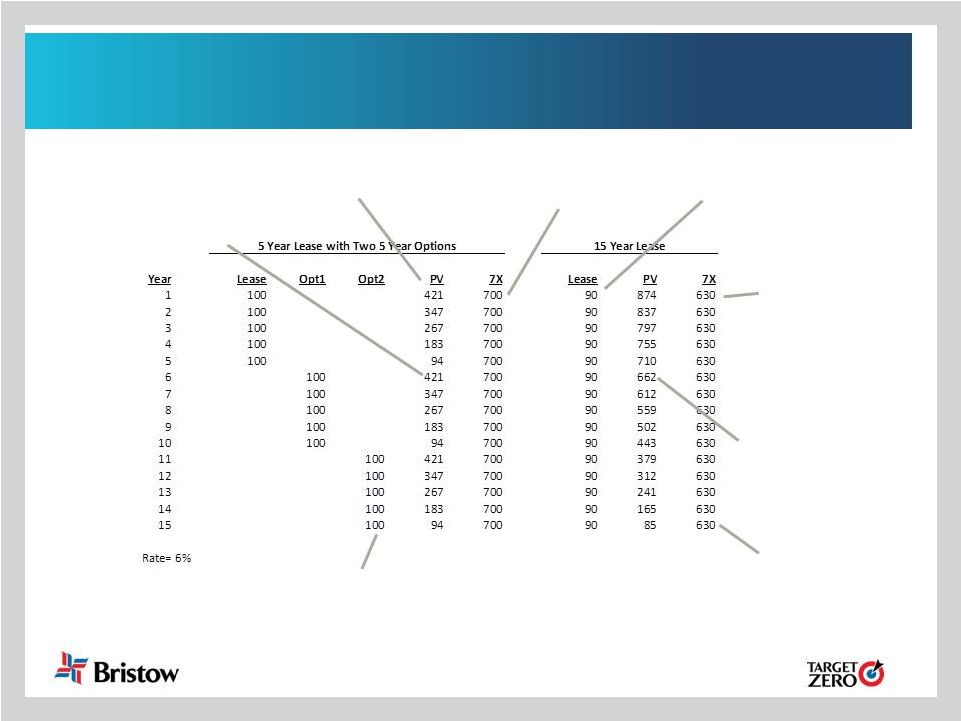 11
Illustration of PV approach to leases
Assume 10%
discount for longer
commitment
Shorter commitment
implies less capital
Optionality: only
renew if needed
Stuck if not needed
Overstates the
commitment
Understates the
commitment
Ultimately pay more in total if used
all 15 years –
that’s the cost of
unexercised option
Motivates signing the
longest lease possible
to get annual rent low
even if unnecessary |
 12
Treatment of depreciation in BVA and GCFR
•
Using gross assets treats old assets the same as new assets
A net asset framework gives misleading signals as older businesses with
depreciated assets look better than newer businesses with
un-depreciated assets A
gross
measure
removes
this
distortion
by
smoothing
the
capital
charge
over
the
entire
life
of
the asset
Typical economic profit measures
BVA (&GCFR)
New investments look
prohibitively expensive….
…while older assets look
‘cheap’…or ‘free’
Balanced view
of new vs. old assets –
encouraging more growth into profitable
opportunities
Capital
Charge
Depreciation
Required
Return |
 13
Cash is removed
•
Cash is removed from gross operating assets in BVA and
gross cash flow return
•
In most valuations, cash is treated as a negative debt (i.e.
subtract cash from debt to get net debt to subtract from
enterprise value to get equity value).
BVA treats cash the same way
•
Cash is expected to earn its own risk adjusted return which is
much lower than the required return so it would be penalizing
in BVA for a company to carry any cash.
•
Removing cash encourages management to streamline
inventory, receivables and other assets to convert them to
cash and immediately see the benefit in higher BVA. |
 14
Treatment of Lider in BVA and GCFR
•
Earnings from unconsolidated entities removed from
gross cash flow
•
Investment in unconsolidated entities removed from
gross operating assets
•
Proportional consolidation of pro rata share of Lider BVA
added in to improve accuracy over using equity
accounting; this is only done for ‘major’
investments (i.e.
Líder) |
 15
Goodwill is excluded from BVA
•
We aimed for a framework that would simultaneously encourage
investments and hold management accountable for delivering returns.
Incentives focus on year to year changes in BVA to encourage a constant
pursuit of growth and return that more than covers the required return on all
new investments.
•
Goodwill is excluded to facilitate operating performance comparisons
and to avoid discouraging acquisitive investments
Acquisitions
often
do
not
cover
the
cost
of
capital
on
the
total
investment
for
a few years and we would not want to be discouraged from making good
long term investments.
•
The
incentive
plan
is
adjusted
whenever
new
goodwill
is
acquired
to
step
up
the
required
improvements
in
BVA
to
deliver
a
required
return
on
the
goodwill so if management doesn’t earn an adequate return over time
bonuses will suffer. |
 16
Appendix |
 17
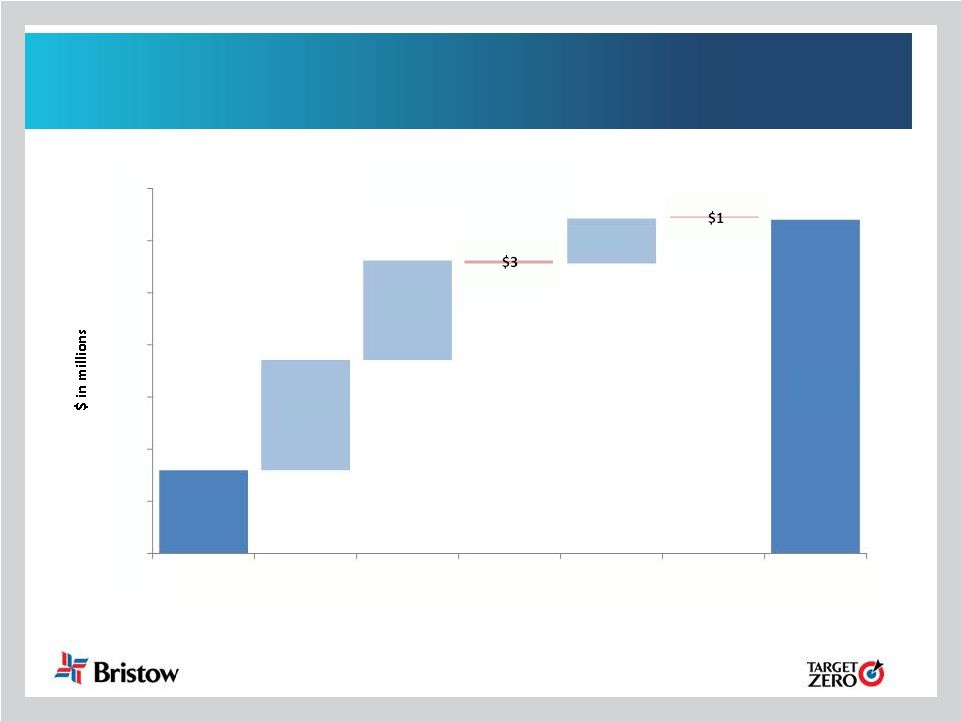
FY14 bridge to gross cash flow
NOTE: For illustrative purposes only
$180
$420
$106
$95
$43
$100
$150
$200
$250
$300
$350
$400
$450
NOPAT
Rent
D&A
Líder equity
earnings
Líder
proportional
Other
GCF
FY14 NOPAT to GCF |
 18
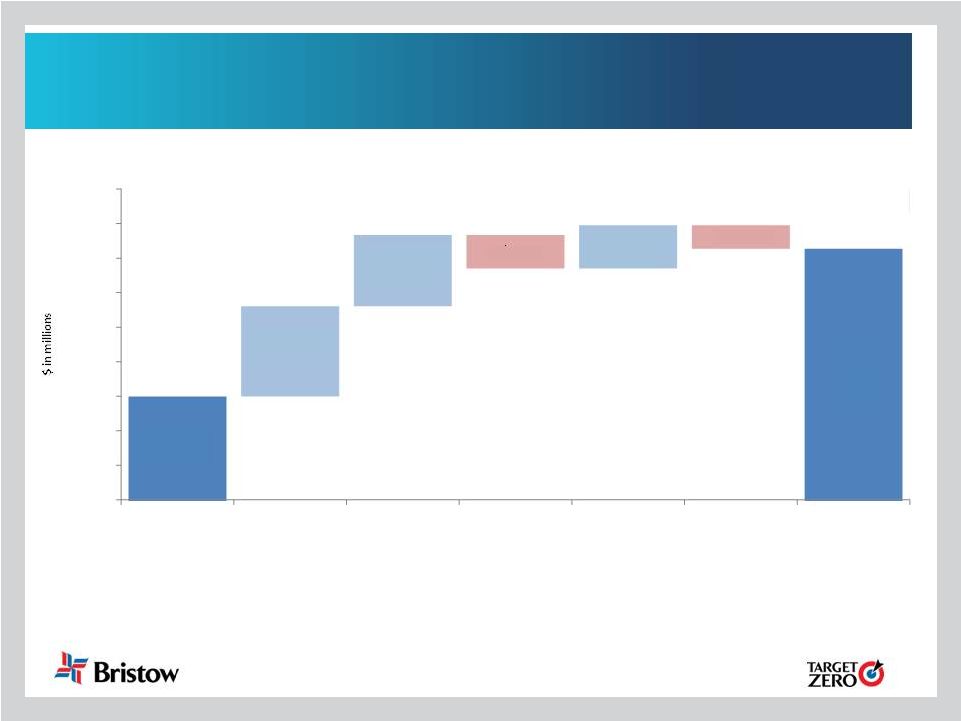
FY14 bridge to gross operating assets
NOTE: For illustrative purposes only
$2,598
$3,455
$523
$412
$250
$193
$135
$2,000
$2,200
$2,400
$2,600
$2,800
$3,000
$3,200
$3,400
$3,600
$3,800
Invested Capital
(LT + ST Debt +
Equity)
Accumulated
depreciation
NPV of leases
Líder equity
investment
balance
Líder
proportional GCF
Other
GOA
FY14 Invested Capital to GOA |