Attached files
| file | filename |
|---|---|
| 8-K - 8-K - IBERIABANK CORP | d799722d8k.htm |
| EX-2.1 - EX-2.1 - IBERIABANK CORP | d799722dex21.htm |
| EX-99.1 - EX-99.1 - IBERIABANK CORP | d799722dex991.htm |
 Acquisition of Florida Bank Group, Inc.
October 3, 2014
Exhibit 99.2 |
| Safe
Harbor And Legend 2
Statements contained in this presentation which are not historical facts and which pertain to
future operating results of IBERIABANK Corporation and its subsidiaries constitute
“forward- looking statements” within the meaning of the Private Securities Litigation
Reform Act of 1995. These forward-looking statements involve significant risks and
uncertainties. Actual results may differ materially from the results discussed in these
forward-looking statements. Factors that might cause such a difference include, but are not
limited to, those discussed in IBERIABANK Corporation’s periodic filings with the
SEC.
In connection with the proposed merger, IBERIABANK Corporation will file a Registration
Statement on Form S-4 that will contain a proxy statement / prospectus. INVESTORS AND
SECURITY HOLDERS ARE URGED TO CAREFULLY READ THE PROXY STATEMENT /
PROSPECTUS REGARDING THE PROPOSED TRANSACTION WHEN IT BECOMES AVAILABLE,
BECAUSE IT WILL CONTAIN IMPORTANT INFORMATION. Investors and security holders may
obtain a free copy of the proxy statement / prospectus (when it is available) and other documents
containing information about IBERIABANK Corporation and Florida Bank Group, Inc., without
charge, at the SEC’s website at http://www.sec.gov. Copies of the proxy statement / prospectus
and the SEC filings that will be incorporated by reference in the proxy statement / prospectus
may also be obtained for free from the IBERIABANK Corporation website, www.iberiabank.com,
under the heading “Investor Information”. This
communication is not a solicitation of any vote or approval, is not an offer to purchase shares
of Florida Bank Group, Inc. common stock, nor is it an offer to sell shares of IBERIABANK
Corporation common stock which may be issued in any proposed merger with Florida Bank
Group, Inc. The issuance of IBERIABANK Corporation common stock in any proposed merger
with Florida Bank Group, Inc. would have to be registered under the Securities Act of 1933, as
amended (the “Act”), and such IBERIABANK Corporation common stock would be offered only
by means of a prospectus complying with the Act. |
 3
3
3
3
3
3
Transaction Rationale
•
In market and new-market acquisition of a Florida-based commercial
bank based in Tampa, Florida
•
Established and complementary customer profile
•
13 branch
offices
located
in
Florida
–
eight
offices
in
Tampa,
three
in Jacksonville, one in Sarasota and one in Tallahassee
•
Small Business focus with $400 million in deposits and $329
million in gross loans
•
Adds approximately $524 million in assets
•
Neutral to 2015 earnings per share and accretive thereafter
•
Tangible book value dilution of less than 1% excluding one-time
acquisition
and
conversion
related
costs
on
a
pro
forma
basis
at
June
30, 2014
•
Tangible book value breakeven, including one-time acquisition and
conversion related costs, of approximately two years
•
Transaction has limited impact on capital ratios
•
Anticipate internal rate of return in excess of 20%
•
Comprehensive
due
diligence
completed,
including
credit
review
•
Strong credit culture and asset quality
•
Limited loss content expected (2% of gross loans)
•
Conversion and integration experience reduces integration risk
Compelling
Strategic
Rationale
Financially
Attractive
Low Risk |
 4
4
4
4
4
4
Transaction Overview
•
Combination cash and common stock with aggregate cash
consideration not to exceed 50% of total consideration
•
$7.81 in cash per Florida Bank Group common share, and
•
Fixed exchange ratio of 0.149 of a share of IBKC common stock for
each Florida Bank Group share within price collars and floating
exchange
ratios
outside
of
the
collars
(1),
•
$87 million
(1)
for common stock outstanding based on IBKC
closing price of $62.61 on October 2, 2014
•
$17.14 per Florida Bank Group share outstanding
(1)
•
$3.5 million in cash liquidation value of options
•
Completed comprehensive due diligence
•
Florida Bank Group shareholder approval
•
Customary regulatory approvals
•
Expected closing in first quarter of 2015
Consideration
Deal Value
Valuation
Multiples
Due Diligence
Required
Approvals
Timing
Common and With All
Other Preferred
Adjustments
(2)
•
Price / Total Book:
142%
126%
•
Price / Tangible Book:
142%
126%
(1)
If the weighted average trading price of IBERIABANK common stock were to decline to or go below $56.79
per share, or to reach or exceed $76.83 per share, over a specified period, the value of the
common stock portion of the transaction would become fixed and the exchange ratio would float
(2)
Assumes the impact of cash liquidation for options, reversal of $23.4 million of deferred tax asset
valuation allowance, credit loss assumptions, interest rate adjustments and fair value marks to
facilities |
 5
5
5
5
5
5
Pricing Overview
Credit, interest rate and facilities marks are shown net of tax
Dollars in thousands
IBKC
Common
Stock
Price
-
10/02/14
$62.61
Purchase Price Per Share of FBG
$17.14
Amount
($000s)
Common
Equivalent
Shares
Common
Equity per
Share
Purchase
Multiple
Common Equity
36,195
$
2,471,745
14.64
$
117%
Preferred Stock
24,800
2,480,000
10.00
171%
Subtotal Equity
60,995
$
4,951,745
12.32
$
139%
Warrants
100
$
100,000
1.00
$
1714%
Options
-
-
-
-
With Options & Warrants
61,095
$
5,051,745
12.09
$
142%
Deferred Tax Asset
23,395
$
Liquidation of Options
(3,519)
Credit Loss, Net of Allowance
910
Interest Rate Adjustment
(5,590)
With Credit & Interest Marks
76,291
$
5,051,745
15.10
$
113%
Facility FMV Adjustment
(7,475)
$
Total With Facilities FMV
68,816
$
5,051,745
13.62
$
126% |
  6
6
6
6
6
6
Enhances Our
Florida Franchise
Deposit Market Share
Source: SNL Financial, June 30, 2013
•
Total Gross Loans: $329 million
•
Total Assets: $524 million
•
Total Deposits: $400 million
•
Total Equity: $36 million common equity
and $25 million in convertible preferred
equity
Rank
Institution
Branches
Deposits
($ mm)
Market
Share %
1
Bank of America Corp.
608
81,494
18.90
2
Wells Fargo & Co.
650
69,468
16.11
3
SunTrust Banks Inc.
510
42,022
9.75
4
Regions Financial Corp.
363
18,609
4.32
5
JPMorgan Chase & Co.
385
18,528
4.30
6
BB&T Corp.
325
16,186
3.75
7
Citigroup Inc.
57
13,932
3.23
8
EverBank Financial
16
13,743
3.19
9
Toronto-Dominion Bank
167
9,373
2.17
10
Fifth Third Bancorp
171
9,219
2.14
21
Pro Forma IBKC
50
2,910
0.67
24
IBERIABANK Corp.
37
2,458
0.57
73
Florida Bank Group
13
452
0.10
Total For Institutions In Market
5,474
431,189
State Of Florida |
 7
7
7
7
7
7
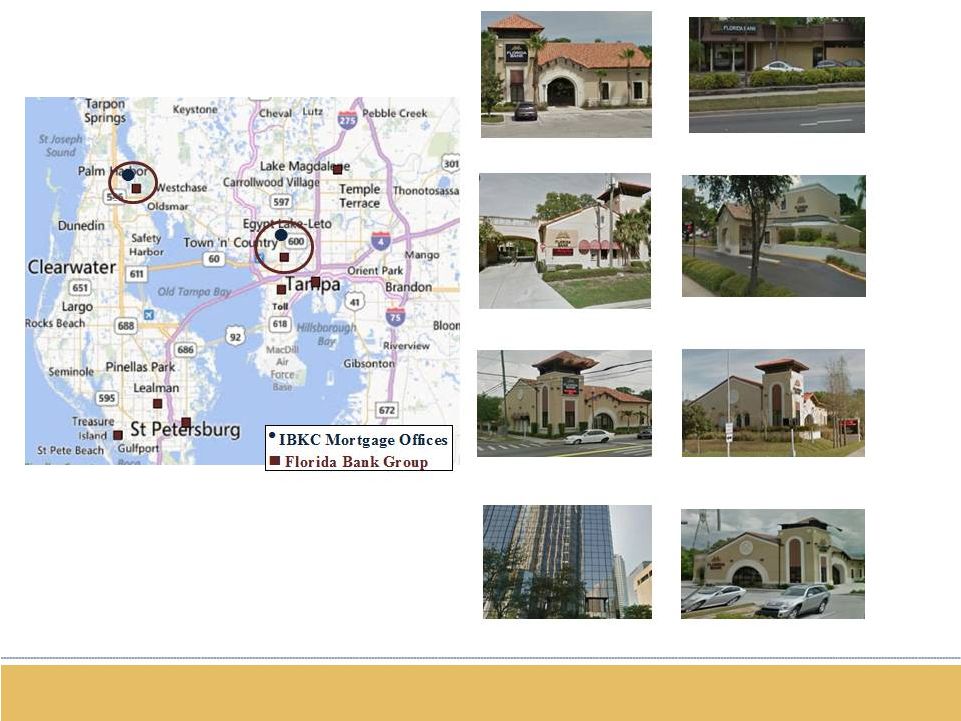
Tampa Market
Source: SNL Financial, June 30, 2013
3000 Cove Bend Drive,
Tampa, $29.5 million
4105 North Himes Ave,
Tampa, $17.3 million
201 North Franklin St,
Tampa, $92.2 million
500
4
St
North,
St Petersburg, $24.9 million
777 Pasadena Ave S,
St. Petersburg, $77.0 million
612 S Dale Mabry,
Tampa, $35.3 million
3065 34 St North
St Petersburg, $20.0 million
•
Eight branches in Tampa-St. Petersburg market
•
Four owned and four leased branches
•
Total market deposits of $316 million
•
Average deposits per branch of $40 million
•
Two IBKC Mortgage office consolidations
3100 Tampa Rd,
Oldsmar, $20.1 million
th
th |
 8
8
8
8
8
8
Jacksonville Market
Source: SNL Financial, June 30, 2013
135 West Bay Street
Jacksonville, $26.8 million
4211 San Juan Ave
Jacksonville, $19.4 million
250 Route A1A North
Ponte Vedra Beach, $29.6 million
•
Three
branches
in
Jacksonville
-
two
owned
and
one
leased
•
Total market deposits of $76 million
•
Average deposits per branch of $25 million
•
More favorable locations than IBKC’s previous Jacksonville branches
|
 9
9
9
9
9
9
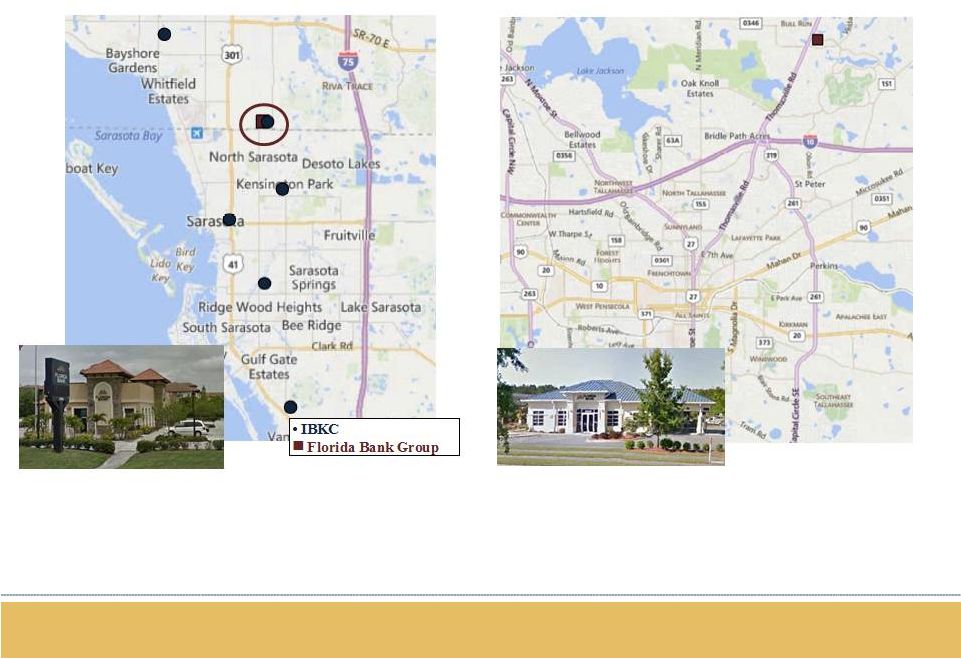
Sarasota
Tallahassee
Source: SNL Financial, June 30, 2013
•
One owned branch in Sarasota
•
Total market deposits of $17 million
•
Consolidate into existing IBKC branch system
•
One owned branch in Tallahassee
•
Total market deposits of $43 million |
 10
10
10
10
10
10
Florida MSA Deposit Market Share
Source: SNL Financial, June 30, 2013
Tampa-St. Petersburg-Clearwater, FL
Rank
Institution
Branches
Deposits
($ mm)
Market
Share %
1
Bank of America Corp.
94
10,559
19.31
2
Wells Fargo & Co.
87
10,176
18.61
3
SunTrust Banks Inc. (GA)
97
7,765
14.20
4
Regions Financial Corp.
79
5,415
9.90
5
Fifth Third Bancorp
44
3,019
5.52
6
BB&T Corp.
47
2,619
4.79
7
USAmeriBancorp Inc.
13
1,383
2.53
8
JPMorgan Chase & Co.
56
1,280
2.34
9
Tampa Bay Banking Co.
10
1,133
2.07
10
TFS Financial Corp (MHC)
5
1,131
2.07
21
Florida Bank Group
8
316
0.58
Total For Institutions In Market
767
54,683
Jacksonville, FL
Rank
Institution
Branches
Deposits
($ mm)
Market
Share %
1
Bank of America Corp.
35
20,164
42.12
2
EverBank Financial
6
12,061
25.20
3
Wells Fargo & Co.
62
5,560
11.61
4
SunTrust Banks Inc.
27
2,049
4.28
5
BBVA
25
1,646
3.44
6
Regions Financial Corp. (AL)
24
1,165
2.43
7
BB&T Corp. (NC)
14
556
1.16
8
Ameris Bancorp
10
507
1.06
9
Toronto-Dominion Bank
8
507
1.06
10
Jacksonville Bancorp Inc.
9
451
0.94
24
Florida Bank Group
3
76
0.16
Total For Institutions In Market
316
47,868
Tallahassee, FL
Rank
Institution
Branches
Deposits
($ mm)
Market
Share %
1
Capital City Bank Group Inc.
19
929
18.22
2
SunTrust Banks Inc.
9
823
16.14
3
Wells Fargo & Co.
8
590
11.58
4
Bank of America Corp.
7
511
10.03
5
Home BancShares Inc.
9
466
9.14
6
FMB Banking Corp.
5
306
6.01
7
BB&T Corp.
3
261
5.13
8
Synovus Financial Corp.
4
241
4.72
9
Regions Financial Corp.
5
231
4.53
10
Hancock Holding Co.
4
205
4.02
16
Florida Bank Group
1
43
0.85
Total For Institutions In Market
88
5,097
North Port-Sarasota-Bradenton, FL
Rank
Institution
Branches
Deposits
($ mm)
Market
Share %
1
Bank of America Corp.
35
3,118
18.69
2
Wells Fargo & Co.
30
2,559
15.34
3
SunTrust Banks Inc.
31
2,151
12.89
4
BB&T Corp.
20
1,152
6.91
5
Fifth Third Bancorp
16
740
4.44
Pro Forma IBKC
9
638
3.82
6
IBERIABANK Corp.
8
621
3.72
7
JPMorgan Chase & Co.
19
601
3.61
8
Northern Trust Corp.
3
518
3.11
9
Regions Financial Corp.
16
502
3.01
10
Bank of Montreal
11
474
2.84
39
Florida Bank Group
1
17
0.10
Total For Institutions In Market
302
16,680 |
 11
11
11
11
11
11
Credit Summary
Source: SNL Financial and Company documents
Data as of June 30, 2014
Diligence Scope
•
Approximately 90 people involved in due diligence
process; credit team included 25 associates
performing both on-site credit file and off-site credit
portfolio reviews
•
Reviewed 99% of outstanding loan balances and
nearly 99% of total number of loans
•
Approximately one-third of the loans were reviewed
on-site with the remainder analyzed by off-site
portfolio review
Loan Portfolio Comments
•
Majority are in-market loans
•
Primarily focused on real estate and small business
lending
•
Good asset quality metrics:
•
NPA / assets = 0.55%
•
Nonaccrual loans / loans = 0.56%
•
Allowance for loan losses of $8.0 million
•
Credit mark of approximately $6.6 million on a pre-tax
basis
Loan Portfolio Composition
Loan Type
Balance
($ millions)
% of Total
CRE - Owner Occupied
$87.7
26.7%
CRE - Non Owner Occupied
70.2
21.4%
1-4 Family Residential
67.6
20.6%
HELOC
36.4
11.1%
Commercial & Industrial
26.9
8.2%
C&D
20.0
6.1%
Multifamily Loans
11.5
3.5%
Consumer & Other
4.2
1.3%
Other
3.9
1.2%
Total Loans
$328.6
100.0% |
 12
12
12
12
12
12
Costs and Synergies
Merger Considerations
•
No corporate or bank board seats
•
Florida Bank Group board members
invited to join IBKC’s local Advisory
Boards
•
One employment contract
•
Savings equate to approximately
31% compared to Florida Bank
Group’s total expenses
•
Branch and office consolidations
anticipated
•
One branch consolidation in
Sarasota
•
Consolidate operations center
•
Consolidate mortgage offices with
existing IBKC mortgage
Approximately $20 million in pre-tax costs:
•
$6.4 million in lease terminations
•
$5.6 million in contract terminations
•
$2.7 million in severance/retention payments
•
$1.1 million in system conversions
•
$0.6 million in marketing/communications
•
$3.6 million in other merger-related expense
Merger-Related Costs
DTA Allowance Reversal
•
Reversal of Deferred Tax Asset Allowance
and utilization of prior NOL carryforwards
of approximately $24 million |
 13
13
13
13
13
13
Financial Assumptions & Impact
Conservative
Financial
Assumptions
Attractive
Financial
Impact
Other Marks:
Cost Savings:
Merger Related Costs:
•
Gross loss estimate of $6.6 million on a pre-tax basis
(2% of gross loan portfolio)
•
Loss estimate is less than current allowance for loan
losses of $8.0 million
•
Aggregate negative $1.2 million in other marks, including
securities portfolio, loan rate, allowance for loss reversal,
OREO, fixed assets, FHLB marks
•
Annual run-rate cost savings of approximately $5 million
on a pre-tax basis
•
Represents approximately of 31% of Florida
Bank’s anticipated 2014 non-interest expenses
•
Savings expected to be achieved within six months
of closing
•
Approximately $20 million on a pre-tax basis
•
Neutral to 2015 EPS and accretive thereafter
•
Tangible book value dilution of less than 1% excluding one-time acquisition
and conversion related costs on a pro forma basis at June 30, 2014
•
Tangible book value breakeven, including one-time acquisition and
conversion related costs, in approximately two years
•
Strong pro forma capital ratios:
•
Tangible common equity ratio = 8.4%
•
Total risk based capital ratio = 12.6%
•
Internal rate of return over 20%; well in excess of our cost of capital
Credit Mark: |
 Appendix |
 15
15
15
15
15
15
Management/Board of Directors
Susan
"Susie"
Martinez
-
President
and
Chief
Executive
Officer
of
Florida
Bank
Group,
Inc.
Served as Senior Executive Vice President and Florida Regional President of Regions
Financial Corporation until December 2007. Prior to the merger with Regions
in 2006, Ms. Martinez served as the head of the Florida Banking
Group
at
AmSouth
Bank.
Prior
to
joining
AmSouth
in
1998,
Ms.
Martinez
spent
more
than
25
years
with
Barnett
Bank
and
First
Florida
Bank,
and
held
various
positions,
including
Executive
Vice
President
and
Senior
Retail Executive for the Tampa, Florida market.
Board of Directors:
Robert Rothman
Chairman of the Board of Florida Bank Group, Inc. since January 2002.
Served as Chairman and CEO of Consolidated International Group, a
multinational financial services company, from 1987 to 1999
N. Troy Fowler
Director since 2004. Director of Triad Foundation, Inc.
Thomas E. Gibbs
Director since 2002. Founding partner of Dewey & LeBoeuf’s Florida
office. Lewis S. Lee, Jr.
Director since September 2007. President of Estabrook Capital
Management LLC
Stanley Calderon
D. Scott Lutrell
Founder, Chairman and Chief Investment Officer of LCM Group, Inc. from
1988 until 2011
Lisa Smithson
Director since 2009. Managing Partner of IS and Company, a Tampa Bay,
Florida based accounting firm
Charles B. Tomm
Director since 2007. CEO of Brumos Automotive |
 16
16
16
16
16
16
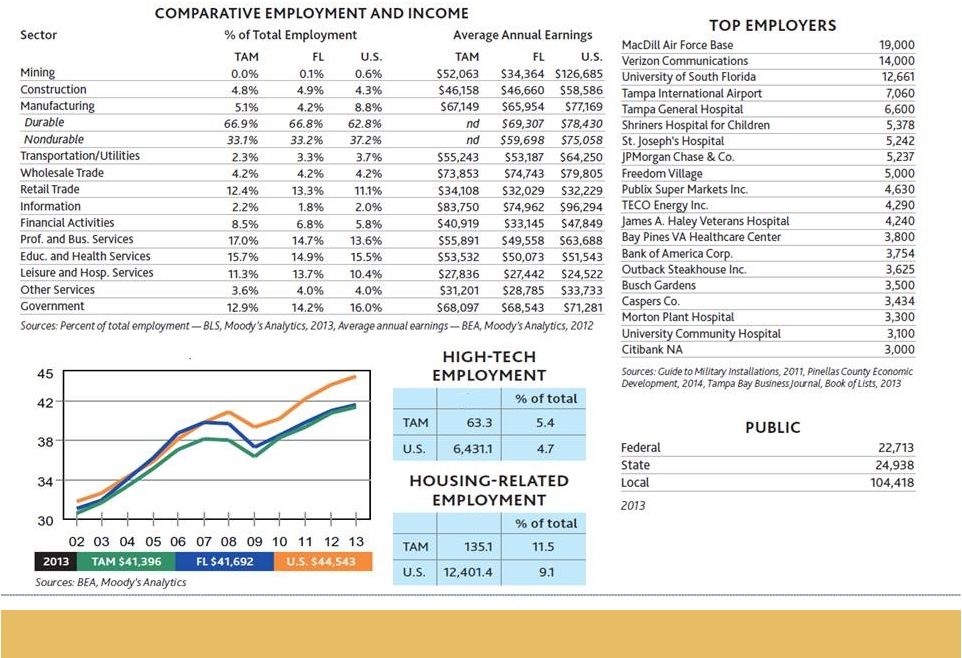
Tampa Market
•
Economy in Tampa-St. Petersburg-Clearwater progressing towards full
recovery •
Jobless
rate
of
6.4%
with
workers
entering
job
market
as
fast
as
jobs
are
being
created
•
Household employment has surpassed pre-recession peak
•
Financial services capital of Florida
•
Low tax burden and office rents
•
University
of
South
Florida
draws
high-skilled
workers
and
research
and
development
firms
•
Strong demographic trends
•
Expanding port
Source: Moody’s Analytics, July 2014 |
 17
17
17
17
17
17
Tampa Market
Source: Moody’s Analytics, July 2014
$ in thousands
000’s
000’s |
 18
18
18
18
18
18
Tampa Market
Home Price Change
Home values for Tampa-
St. Petersburg-Clearwater
are forecast to
increase by 10 percent over the next 12 months. Nationally, prices are
forecast to increase by 7.3 percent. In the second and third year, prices
are forecast to increase 7% and 7%, respectively
Home Price Change
Home prices in this market peaked in Q4 2006 at $259,646. Since their
peak, prices have fallen by 32%. In the last 12 months, prices have gone up
by 10 percent. The average home price in this market is currently $176,535.
Job Growth In the past 12 months, jobs in this market have grown
by 1.8 percent. This compares to a national increase of 1.9 percent.
Job Growth
Unemployment
The Unemployment Rate in July 2014 was 6.8% versus 7.3% last year.
Source: Local Market Monitor |
 19
19
19
19
19
19
Tampa Market
Population Growth
The population in this market grew 0.6% in 2012, while the US population
grew 0.7%.
Rent Per Month
We forecast rents to increase 17 percent over the next three years in this
market, to an average of $1246 per month, partly due to higher inflation
Total housing permits in July 2014 were up 83 percent from last year.
Single family permits were up 43 percent.
Housing Permits
Employment By Industry
Source: Local Market Monitor |
 |