Attached files
| file | filename |
|---|---|
| 8-K - 8-K - TransUnion | a8-kcoverpage9x30x2014dbfi.htm |

Exhibit 99.1 September 30, 2014 Deutsche Bank Leveraged Finance Conference Al Hamood Chief Financial Officer

Important Information This presentation is confidential and includes forward-looking statements. Certain information and statements included in this presentation are necessarily based upon estimates and assumptions that, while prepared in good faith and considered reasonable by management, are inherently subject to significant business, economic, regulatory, and competitive factors, many of which are beyond the control of management, and are based upon assumptions with respect to future business decisions, which are subject to change. These factors are discussed in Item 1A, “Risk Factors” in our Annual Report on Form 10-K for the fiscal year ended December 31, 2013, as modified in any subsequent Quarterly Report on Form 10-Q or Current Report on Form 8-K. The actual results may vary and those variations may be material. Nothing in this presentation should be regarded as a representation by any person that the forward-looking statements set forth herein (or in any other materials delivered to you) will be achieved, and the contemplated results of such forward-looking statements should not be viewed as facts or as a guarantee of performance. We do not undertake any obligation to update these forward-looking statements This presentation contains “non-GAAP financial measures.” Non-GAAP financial measures either exclude or include amounts that are not excluded or included in the most directly comparable measure calculated and presented in accordance with generally accepted accounting principles in the United States ("GAAP"). Specifically, we use “Adjusted EBITDA,” “Further Adjusted EBITDA,” “Adjusted Revenue,” "Free Cash Flow" and “Unlevered Free Cash Flow.” We use Adjusted EBITDA and Further Adjusted EBITDA as supplemental measures of operating performance because they eliminate the impact of certain items that we do not consider indicative of our ongoing operating performance. We also use Adjusted Revenue, Free Cash Flow and Unlevered Free Cash Flow because we believe they are useful tools in assessing our ability to service indebtedness. Adjusted EBITDA and Further Adjusted EBITDA do not reflect our capital expenditures, interest, income tax, depreciation, amortization, stock-based compensation and certain other income and expense. Adjusted Revenue, Free Cash Flow and Unlevered Free Cash Flow reflect certain income and other adjustments not in accordance with GAAP. Other companies in our industry may calculate Adjusted EBITDA, Further Adjusted EBITDA, Adjusted Revenue, Free Cash Flow and Unlevered Free Cash Flow differently than we do, limiting their usefulness as comparative measures. Because of these limitations, these non-GAAP financial measures should not be considered in isolation or as substitutes for performance or liquidity measures calculated in accordance with GAAP. Adjusted EBITDA, Further Adjusted EBITDA, Adjusted Revenue, Free Cash Flow and Unlevered Free Cash Flow are not measures of financial condition, profitability, operating performance and liquidity under GAAP and should not be considered as alternatives to net income attributable to TransUnion Holding Company, Inc. ,revenue or cash flow from operations, their most directly comparable GAAP measures. See the Appendix for a reconciliation of these non- GAAP financial measures to their most directly comparable GAAP measures. In this presentation, the terms “TransUnion”, the “Company”, “we”, “our”, “us” and “its” refer to TransUnion Holding, a Delaware corporation, and its direct and indirect subsidiaries, except where otherwise indicated. In this presentation, amounts and figures are as of June 30, 2014 unless otherwise noted. 2 ©2014 TransUnion Corp All Rights Reserved

Agenda I. Company Overview II. Segment Overview III. Key Credit Strengths IV. Financial Overview V. Q&A 3 ©2014 TransUnion Corp All Rights Reserved

I. Company Overview
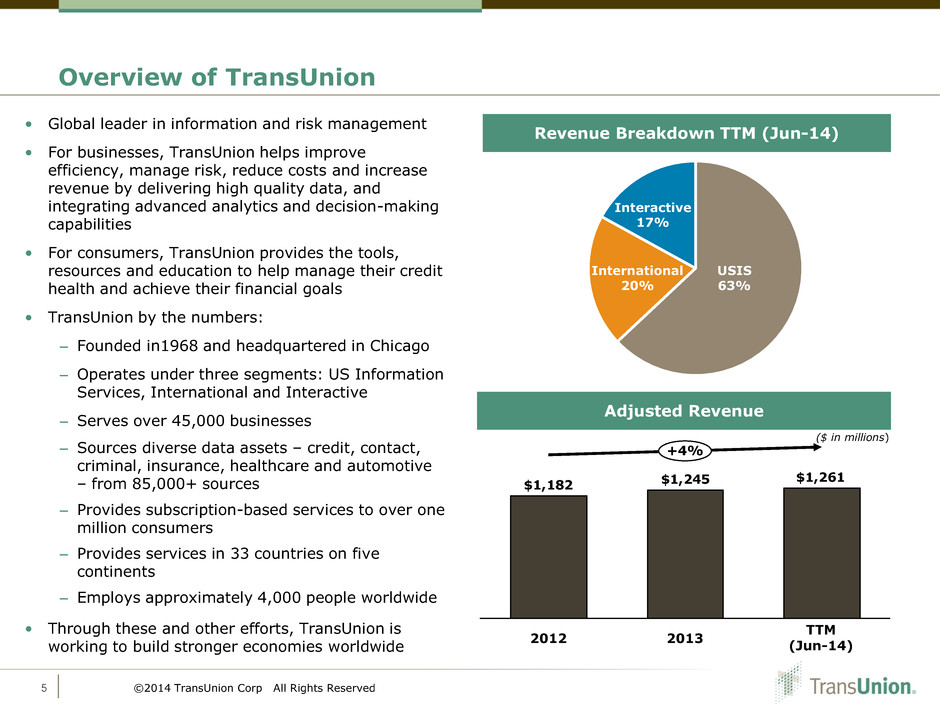
Overview of TransUnion 5 • Global leader in information and risk management • For businesses, TransUnion helps improve efficiency, manage risk, reduce costs and increase revenue by delivering high quality data, and integrating advanced analytics and decision-making capabilities • For consumers, TransUnion provides the tools, resources and education to help manage their credit health and achieve their financial goals • TransUnion by the numbers: – Founded in1968 and headquartered in Chicago – Operates under three segments: US Information Services, International and Interactive – Serves over 45,000 businesses – Sources diverse data assets – credit, contact, criminal, insurance, healthcare and automotive – from 85,000+ sources – Provides subscription-based services to over one million consumers – Provides services in 33 countries on five continents – Employs approximately 4,000 people worldwide • Through these and other efforts, TransUnion is working to build stronger economies worldwide Revenue Breakdown TTM (Jun-14) USIS 63% Interactive 17% International 20% Adjusted Revenue ©2014 TransUnion Corp All Rights Reserved $1,261$1,245$1,182 +4% 2013 2012 TTM (Jun-14) ($ in millions)
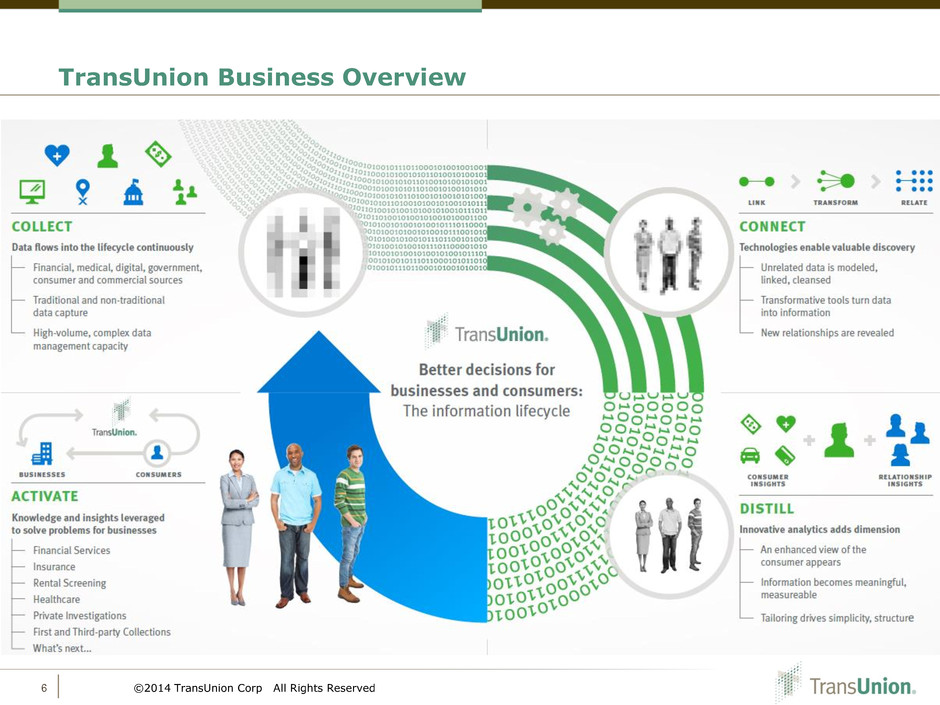
6 TransUnion Business Overview ©2014 TransUnion Corp All Rights Reserved

Strategic Plan to Drive Long Term Growth Mission Objective To help organizations optimize their risk-based decisions and enable consumers to understand and manage their personal information Become a superior global risk information solutions provider that delivers sustained, market-leading organic growth and attractive margins Strategy 1. Defend and grow the core U.S. Financial Services and Insurance businesses by delivering the highest quality credit-based and new value- added solutions 2. Continue to build U.S. Healthcare business and invest in new attractive adjacencies that leverage our core capabilities 3. Accelerate growth in TransUnion Interactive (TUI) business by focusing on the indirect channel, a more comprehensive marketing program to attract and retain consumers, and expansion into targeted countries 4. Expand the International footprint in high growth and meaningful geographies 5. Establish an operating model & culture, and invest in core capabilities needed to support our growth objective 7 ©2014 TransUnion Corp All Rights Reserved
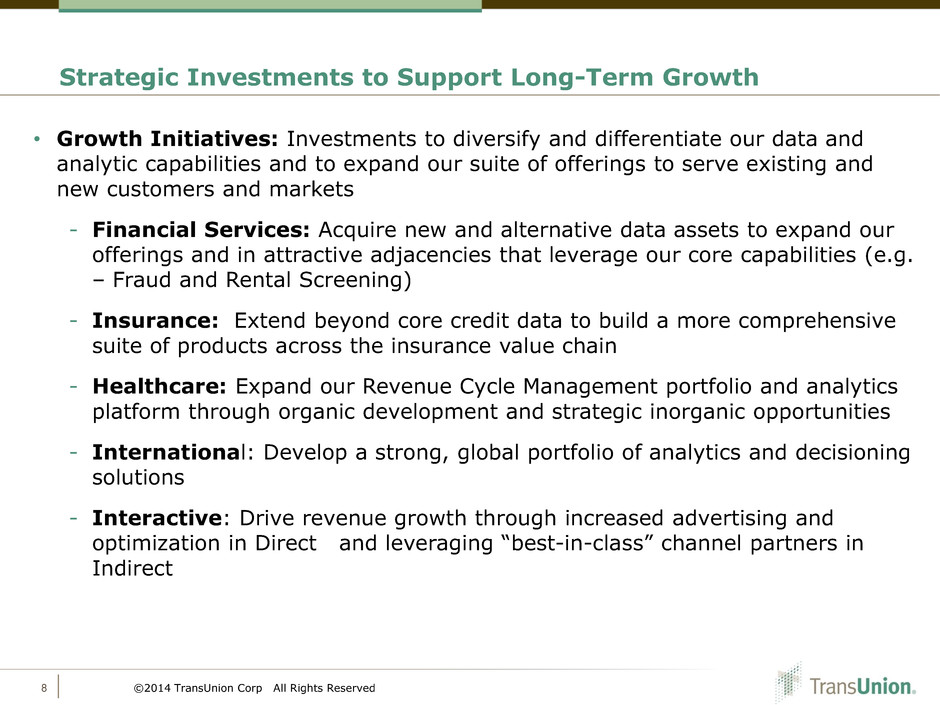
• Growth Initiatives: Investments to diversify and differentiate our data and analytic capabilities and to expand our suite of offerings to serve existing and new customers and markets - Financial Services: Acquire new and alternative data assets to expand our offerings and in attractive adjacencies that leverage our core capabilities (e.g. – Fraud and Rental Screening) - Insurance: Extend beyond core credit data to build a more comprehensive suite of products across the insurance value chain - Healthcare: Expand our Revenue Cycle Management portfolio and analytics platform through organic development and strategic inorganic opportunities - International: Develop a strong, global portfolio of analytics and decisioning solutions - Interactive: Drive revenue growth through increased advertising and optimization in Direct and leveraging “best-in-class” channel partners in Indirect Strategic Investments to Support Long-Term Growth 8 ©2014 TransUnion Corp All Rights Reserved

• IT Platform: Upgrades to our IT platform will enable advanced technology capabilities, promote innovation, drive operational efficiencies and enhance customer satisfaction • Call-Center Consolidation: Establish a “super call-center” to help ensure consistent and high-quality customer service to consumers, as well as drive operational efficiencies • HQ Renovation: Upgrades to our corporate HQ will foster an environment of collaboration, innovation and renewed energy among associates, and will drive operational efficiencies • Acquisitions: Pursue acquisitions that enhance and leverage our core capabilities, accelerate growth, and differentiate our position in industries and markets around the globe Strategic Investments to Support Long-Term Growth 9 ©2014 TransUnion Corp All Rights Reserved
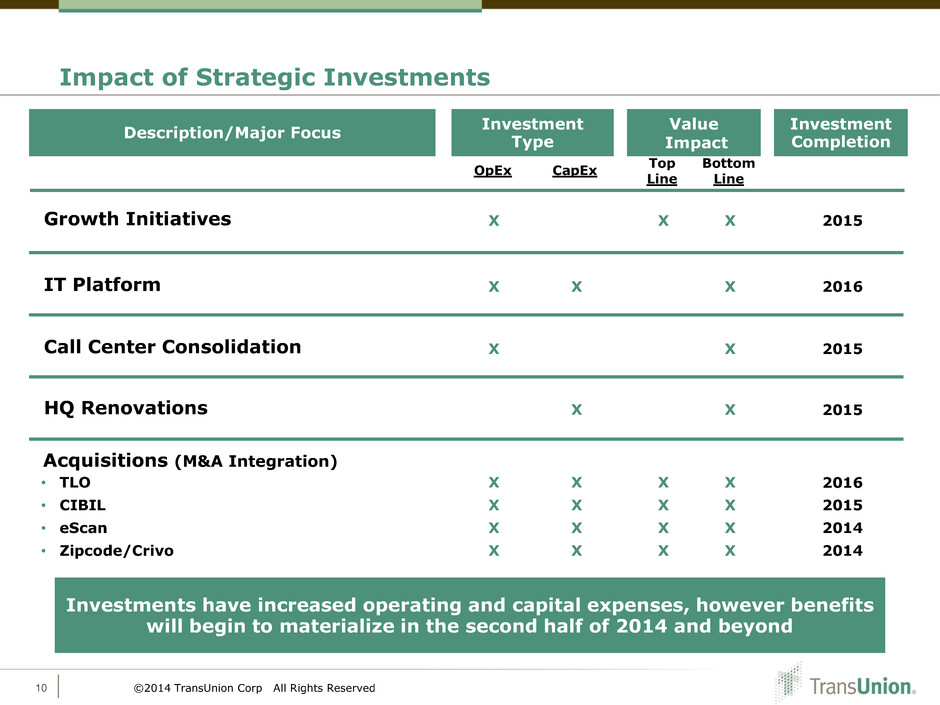
Impact of Strategic Investments 10 ©2014 TransUnion Corp All Rights Reserved Description/Major Focus Investment Completion Investment Type OpEx CapEx Value Impact Top Line Bottom Line Acquisitions (M&A Integration) X X X X X X X X X X X X • TLO • CIBIL • eScan • Zipcode/Crivo 2016 2015 2014 2014 X X X X Call Center Consolidation X X 2015 HQ Renovations X X 2015 IT Platform X X X 2016 Growth Initiatives X X 2015 X Investments have increased operating and capital expenses, however benefits will begin to materialize in the second half of 2014 and beyond

II. Segment Overview
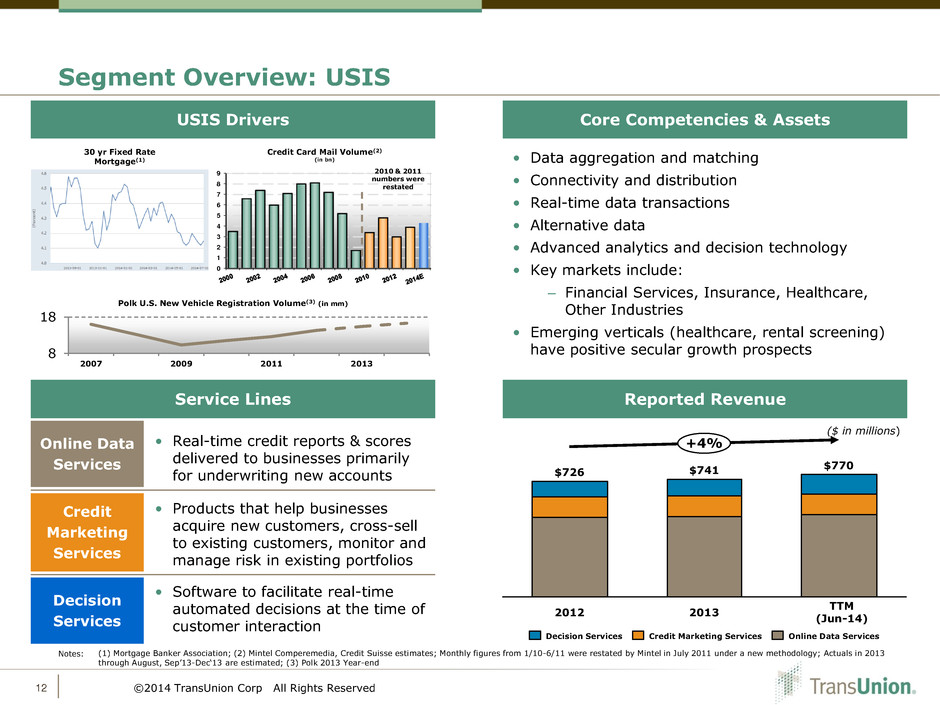
12 Segment Overview: USIS Core Competencies & Assets USIS Drivers Reported Revenue Service Lines Online Data Services Credit Marketing Services Decision Services • Real-time credit reports & scores delivered to businesses primarily for underwriting new accounts • Products that help businesses acquire new customers, cross-sell to existing customers, monitor and manage risk in existing portfolios • Software to facilitate real-time automated decisions at the time of customer interaction ($ in millions) Notes: (1) Mortgage Banker Association; (2) Mintel Comperemedia, Credit Suisse estimates; Monthly figures from 1/10-6/11 were restated by Mintel in July 2011 under a new methodology; Actuals in 2013 through August, Sep’13-Dec‘13 are estimated; (3) Polk 2013 Year-end • Data aggregation and matching • Connectivity and distribution • Real-time data transactions • Alternative data • Advanced analytics and decision technology • Key markets include: – Financial Services, Insurance, Healthcare, Other Industries • Emerging verticals (healthcare, rental screening) have positive secular growth prospects ©2014 TransUnion Corp All Rights Reserved $726 2012 +4% $741 2013 $770 TTM (Jun-14) Credit Marketing Services Online Data Services Decision Services 0 1 2 3 4 5 6 7 8 9 Credit Card Mail Volume(2) (in bn) 2010 & 2011 numbers were restated 30 yr Fixed Rate Mortgage(1) 8 18 2007 2009 2011 2013 Polk U.S. New Vehicle Registration Volume(3) (in mm)
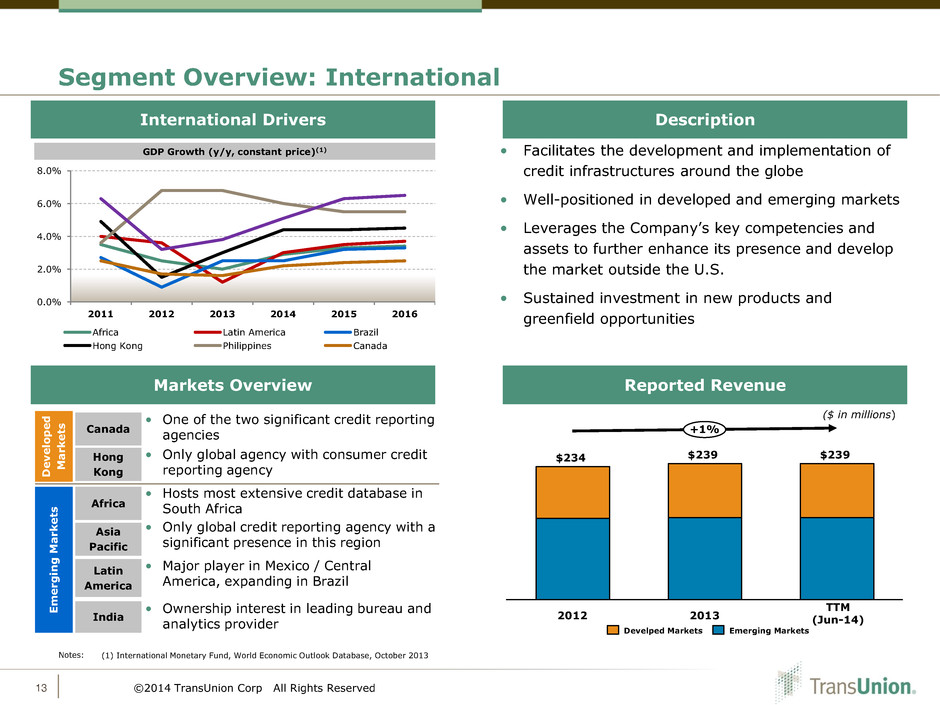
Segment Overview: International 13 • One of the two significant credit reporting agencies • Only global agency with consumer credit reporting agency ($ in millions) Notes: (1) International Monetary Fund, World Economic Outlook Database, October 2013 GDP Growth (y/y, constant price)(1) D e v e lo p e d M a rk e ts E m e rg in g M a rk e ts • Hosts most extensive credit database in South Africa • Only global credit reporting agency with a significant presence in this region • Major player in Mexico / Central America, expanding in Brazil • Ownership interest in leading bureau and analytics provider • Facilitates the development and implementation of credit infrastructures around the globe • Well-positioned in developed and emerging markets • Leverages the Company’s key competencies and assets to further enhance its presence and develop the market outside the U.S. • Sustained investment in new products and greenfield opportunities Canada Hong Kong Africa Asia Pacific Latin America India ©2014 TransUnion Corp All Rights Reserved 0.0% 2.0% 4.0% 6.0% 8.0% 2011 2012 2013 2014 2015 2016 Africa Latin America Brazil Hong Kong Philippines Canada 2012 +1% $239 $239 2013 $234 Develped Markets Emerging Markets Description International Drivers Reported Revenue Markets Overview TTM (Jun-14)
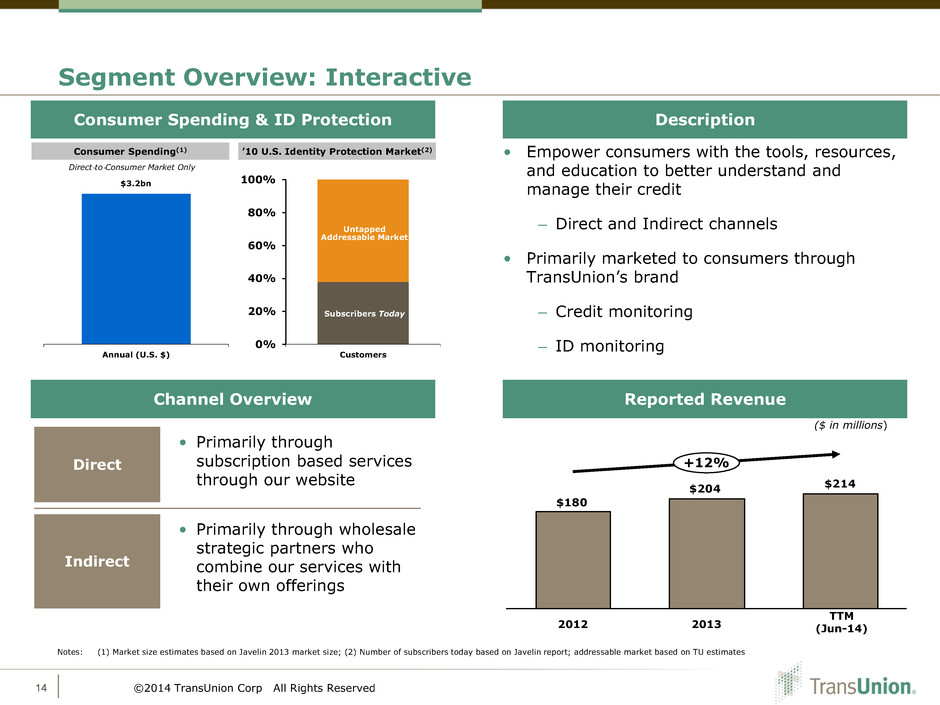
Segment Overview: Interactive 14 Direct Indirect • Primarily through subscription based services through our website • Primarily through wholesale strategic partners who combine our services with their own offerings Consumer Spending(1) Notes: (1) Market size estimates based on Javelin 2013 market size; (2) Number of subscribers today based on Javelin report; addressable market based on TU estimates • Empower consumers with the tools, resources, and education to better understand and manage their credit – Direct and Indirect channels • Primarily marketed to consumers through TransUnion’s brand – Credit monitoring – ID monitoring ’10 U.S. Identity Protection Market(2) $3.2bn Annual (U.S. $) Direct‐to‐Consumer Market Only 0% 20% 40% 60% 80% 100% Customers Untapped Addressable Market Subscribers Today ($ in millions) ©2014 TransUnion Corp All Rights Reserved Description Consumer Spending & ID Protection Reported Revenue Channel Overview $214 $204 $180 +12% 2013 2012 TTM (Jun-14)

III. Key Credit Strengths

Key Credit Highlights 16 Global Leader with Sustainable Competitive Advantage • One of three global players – similar and stable market share in core business in the U.S. • Significant impediments to replicating database, analytics, and technology lead to a sustainable competitive advantage • Unique international footprint – first mover / leader in key emerging markets Well-Diversified Customer Base with High Switching Risks • Relationships of over ten years with each of our top ten global financial services customers • Mission critical data and analytic solutions embedded in customer processes; high switching costs • Over 45,000 business customers, dispersed across key verticals such as financial services, healthcare, insurance, and collection agencies • Largest customer accounts for ~3% of revenues; top-10 accounts for ~20% Attractive Financial Model Drives Stable Free Cash Flows • Strong cash flow generation even under challenging macro conditions from a stable and diversified customer base • Low capital requirements lead to high cash flow as a percentage of revenues • Stable / high EBITDA margin Investments for Long-Term Growth • Growth Initiatives: Investing in all three segments across data, analytics, and new products • IT Platform: Next generation IT and data platform to reduce cost, increase flexibility, improve results and foster innovation • Call Center Consolidation: Establish a “super call-center” to ensure consistent, high-quality customer service to consumers Strategic Inorganic Growth Opportunities • Pursue strategic acquisitions that enhance and leverage the “core”, accelerate growth, differentiate our solutions, diversify our customer base and create sustainable shareholder value ©2014 TransUnion Corp All Rights Reserved

• One of only three global credit reporting agencies • No material market share shift over time and approximately same U.S. market presence – The 3 largest credit reporting agencies have similar market share in the U.S. • The largest U.S. financial services customers typically use the services of all three providers • Deeply embedded software within customers’ systems driving long standing customer relationships • Attractive and stable EBITDA margin Global Leader with Sustainable Competitive Advantage 17 Revenue EBITDA Margin $1,261mm $2,342mm $4,784mm 34% 35% 35% LTM March 31, 2014(2) TTM June 2014(2) TTM June 2014(2) Source: Company filings and press releases. (1) EBITDA margin are based on Adjusted Revenue and Further Adjusted EBITDA. See Appendix for more details. (2) TU based on Adjusted Revenue. Equifax and Experian based on as reported financials and not pro forma for recent acquisitions. (1) ©2014 TransUnion Corp All Rights Reserved

18 Well-Diversified Customer Base with High Switching Costs Long-Standing Customer Relationships Low Customer Concentration • Deep integration with customer core operating systems – high risks of switching • Have >10 years with each of top 10 global financial services customers • Top 10 customers accounted for ~20% of revenue • Largest customer represented ~3% of revenue Blue Chip Customer Base Across Multiple Sectors and Geographies • 9 of the 10 largest banks • All of the major credit card issuers Financial Services • 9 of the top 10 largest property & casualty carriers Insurance Healthcare • Thousands of healthcare providers Over 45,000 Customers Globally ©2014 TransUnion Corp All Rights Reserved Strong Geographic Diversification

Scale • One of the three global credit reporting agencies; with databases that host data on 500 million consumers and businesses; processes ~2 billion updates a month in the U.S. • TTM June 2014 Adjusted Revenue of $1,261 million(1) • TTM June 2014 Further Adjusted EBITDA of $426 million(1) 19 • Long standing relationships with customers • Deep integration with customer core operating systems and processes • Stable pricing dynamics • High quality leverageable data assets • Scalable technology platform • TTM June 2014 Further Adjusted EBITDA margin of 33.8%(1) • CapEx typically averages approximately 6-7% of Revenue on an accrual basis • Low working capital requirements Stability, Visibility and Cash Flow Notes: See Appendix for schedule on “as reported” to “as adjusted” financial statement reconciling items. (1) Further Adjusted EBITDA margin is based on Adjusted Revenue and Further Adjusted EBITDA. See Appendix for more details. Visible and Recurring Revenue Operating Leverage Strong Margins Low Capital Intensity Attractive Financial Model Drives Stable Free Cash Flows ©2014 TransUnion Corp All Rights Reserved

20 Area Recent Acquisitions – eScan (Q3 2013) • Market leader in the automated, post-service eligibility market • Identifies insurance coverage which a patient has, but was missed in the service process • Automated platform provides a compelling ROI to hospitals traditional manual processes • National footprint with over 500 hospitals using a SaaS-based solution ©2014 TransUnion Corp All Rights Reserved eScan Overview Revenue Cycle Management Market Middle (Clinical Operations / Claims Processing) Back-End (A/R Management and Collections) Front-End (Patient Access and Registration) Fix it at the front-end, catch it at the back-end
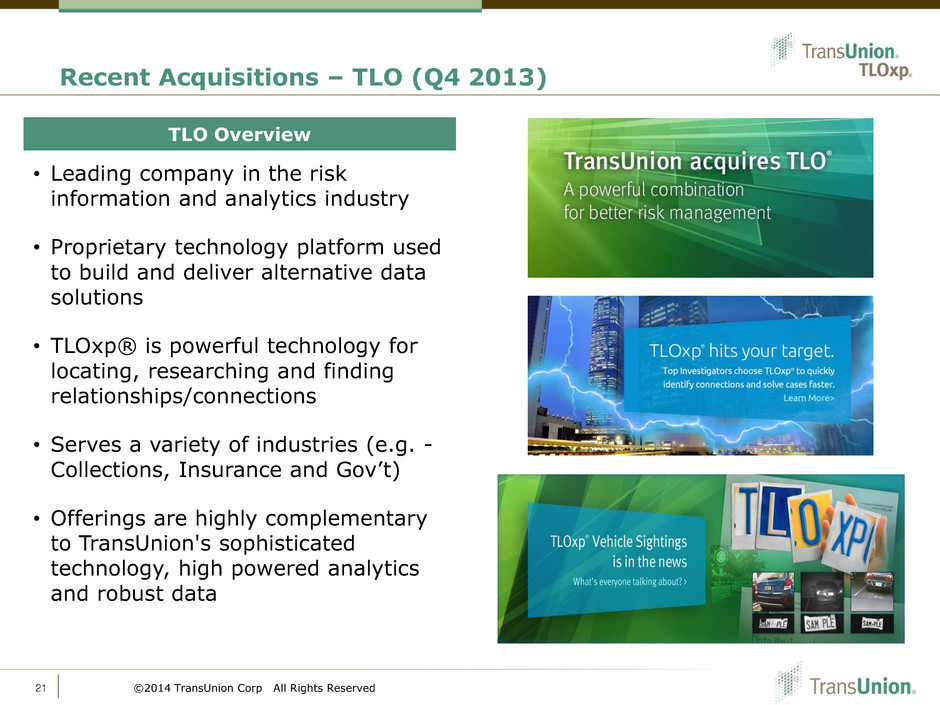
21 Area Recent Acquisitions – TLO (Q4 2013) ©2014 TransUnion Corp All Rights Reserved • Leading company in the risk information and analytics industry • Proprietary technology platform used to build and deliver alternative data solutions • TLOxp® is powerful technology for locating, researching and finding relationships/connections • Serves a variety of industries (e.g. - Collections, Insurance and Gov’t) • Offerings are highly complementary to TransUnion's sophisticated technology, high powered analytics and robust data TLO Overview

22 Area Recent Acquisitions – CIBIL (Q2 2014) ©2014 TransUnion Corp All Rights Reserved • India’s leading credit information company, located in Mumbai, India • TransUnion has been active in the Indian marketplace since 2001 • TransUnion worked with CIBIL to develop the market’s first generic scoring model (CIBIL TransUnion Score) • With the CIBIL TransUnion Score, financial institutions can make better decisions, faster • TransUnion has been accumulating additional holdings in CIBIL in recent years; achieved majority ownership (55%) in May 2014 CIBL Overview India Market Dynamics • Young credit market, expected to grow at >15% • Banks challenged to drive revenues while maintaining strong risk controls • Competition firming up in the bureau business as global players renew focus

IV. Financial Overview
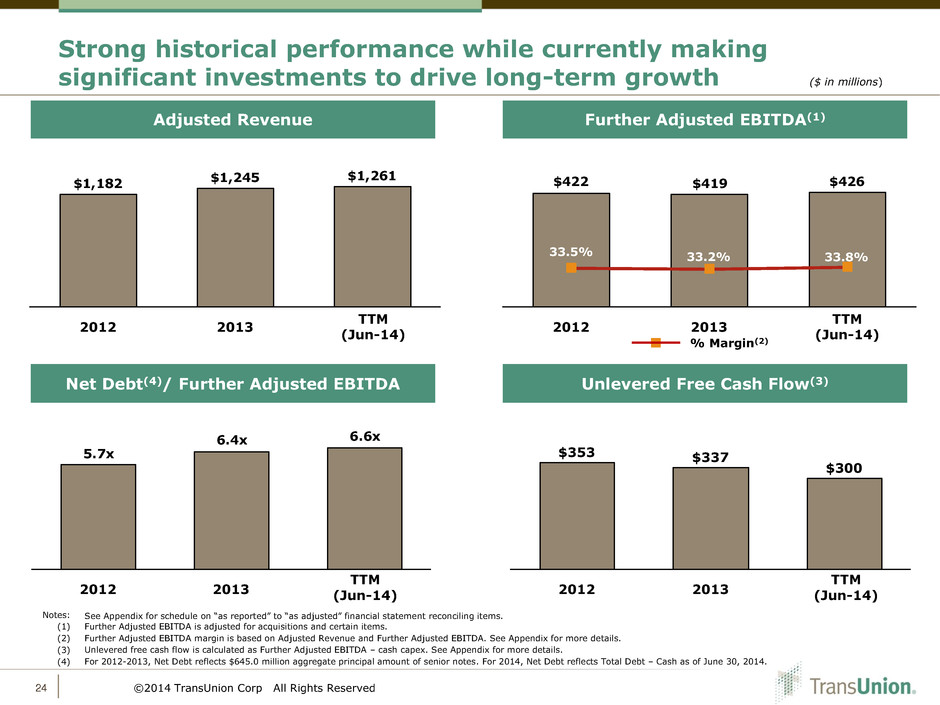
Notes: See Appendix for schedule on “as reported” to “as adjusted” financial statement reconciling items. (1) Further Adjusted EBITDA is adjusted for acquisitions and certain items. (2) Further Adjusted EBITDA margin is based on Adjusted Revenue and Further Adjusted EBITDA. See Appendix for more details. (3) Unlevered free cash flow is calculated as Further Adjusted EBITDA – cash capex. See Appendix for more details. (4) For 2012-2013, Net Debt reflects $645.0 million aggregate principal amount of senior notes. For 2014, Net Debt reflects Total Debt – Cash as of June 30, 2014. Strong historical performance while currently making significant investments to drive long-term growth ($ in millions) 24 (4) ©2014 TransUnion Corp All Rights Reserved Further Adjusted EBITDA(1) Adjusted Revenue Net Debt(4)/ Further Adjusted EBITDA 36.4% 34.2% 30.0% 35.7% 6.6x6.4x 5.7x 2013 2012 $1,261$1,245$1,182 2012 2013 $426$419$422 2013 2012 33.2% 33.8% 33.5% % Margin(2) TTM (Jun-14) TTM (Jun-14) TTM (Jun-14) TTM (Jun-14) Unlevered Free Cash Flow(3) 2012 $337 $300 2013 $353

Capital Expenditures and Unlevered Free Cash Flow are highly stable when normalized for key strategic investments 25 ©2014 TransUnion Corp All Rights Reserved ($ in millions) Capital Expenditures Unlevered Free Cash Flow Normalized CapEx % of Adj Rev 6% 5% 7% • 2014 remains a year of heavy CapEx investments related to renovations to TransUnion’s corporate headquarters and upgrades to its IT Platform • The level of CapEx spend is expected to trend towards normalized levels in 2015, as a percentage of revenue $41 $14 $126 10% 2013 $82 7% 2012 $69 6% Strategic Investments in HQ Renovation + IT Platform CapEx % of Adjusted Revenue $14 $41 $341 $300 2013 $351 $337 2012 $353 $353 TTM (Jun-14) Strategic Investments in HQ Renovation + IT Platform TTM (Jun-14)

26 Conclusion • TransUnion is a global leader in credit information and risk management solutions with an attractive, sustainable business model • TransUnion owns/has access to critical data and analytical capabilities demanded by a relatively stable and diverse customer base • Strong presence in meaningful geographies, serving both businesses and consumers around the world • Will continue to drive long term growth through technology, innovation and expanding beyond the core to serve the growing and changing risk information needs of our customers Proven ability to generate strong cash flow, providing an attractive risk- return opportunity with incremental upside through organic and inorganic growth opportunities ©2014 TransUnion Corp All Rights Reserved

VI. Q&A

Appendix

Historical Financial Summary 29 ($ in millions) Notes: Please consult the following page for schedule on “as reported” to “as adjusted” financial statement reconciling items. (1) Unlevered Free Cash Flow Conversion Rate defined as Further Adjusted EBITDA less capital expenditures as a percentage of Further Adjusted EBITDA. ©2014 TransUnion Corp All Rights Reserved 2012 2013 TTM Jun 2014 CAGR 2012 - June 2014 US Information Systems $726 $741 $770 4% International $234 $239 $239 1% Interactive $180 $204 $214 12% Total Revenue $1,140 $1,183 $1,223 5% Adjustments $42 $62 $38 Adjusted Revenue $1,182 $1,245 $1,261 4% Adjusted EBITDA $385 $378 $384 0% As a % of Total Revenue 33.8% 31.9% 31.4% Further Adjusted EBITDA $422 $419 $426 1% As a % of Adjusted Revenue 33.5% 33.2% 33.8% Capital Expenditures 69 82 126 As a % of Adjusted Revenue 5.8% 6.6% 10.0% Unlevered FCF $353 $337 $300 -10% As a % of Adjusted Revenue 29.9% 27.1% 23.8% Unlevered FCF Conversion Rate (1) 83.6% 80.5% 70.5%

Summary of Further Adjustments 30 ($ in millions) Notes: For purposes of this presentation Adjusted Revenue is only used to calculate Further Adjusted EBITDA Margin (1) Other items related to: M&A integration expense, consulting costs, executive restructuring, IT and data center investments, minority interests, accounting and other adjustments ©2014 TransUnion Corp All Rights Reserved 2012 2013 TTM Jun 2014 Revenue (as Reported) $1,140 $1,183 $1,223 CRB Acquisition (May 2012) $1 $0 $0 Zipcode Acquisition (March 2013) $6 $1 $0 eScan Acquisition (September 2013) $18 $14 $4 TLO Acquisition (December 2013) $0 $26 $13 CIBIL Acquisition (May 2014) $18 $22 $21 Adjusted Revenue $1,182 $1,245 $1,261 Net Income Attributable to The Company ($64) ($35) ($18) Discontinued Operations - - - Net income (loss) from continuing operations attributable to The Company (64) (35) (18) Net interest expense (income) 164 196 197 Income taxes (5) 2 19 Depreciation & Amortization 144 187 203 Stock-based Compensation 4 6 7 Other (income) and expense 51 14 (39) Adjustments 91 8 14 Adjusted EBITDA $386 $378 384 Other items(1) $36 $41 $42 Further Adjusted EBITDA $422 $419 $426
