Attached files
| file | filename |
|---|---|
| EX-99.1 - EXHIBIT 99.1 - Truett-Hurst, Inc. | v389926_ex99-1.htm |
| 8-K - FORM 8-K - Truett-Hurst, Inc. | v389926_8k.htm |
EXHIBIT 99.2

Truett - Hurst, Inc. FY14 Earnings Call September 26, 2014 NASDAQ: THST 1

2 Safe Harbor Statement This presentation (including the presentation and any subsequent questions and answers) contains statements that are forward - looking within the meaning of Section 27 A of the Securities Act of 1933 and Section 21 E of the Securities Exchange Act of 1934 . Such forward - looking statements are only predictions and are not guarantees of future performance . Any such forward - looking statements are and will be, as the case may be, subject to many risks, uncertainties, certain assumptions and factors relating to the operations and business environments of Truett - Hurst, Inc . and its subsidiaries that may cause the actual results of the companies to be materially different from any future results expressed or implied in such forward - looking statements . These risk factors, include, but are not limited to, a reduction in the supply of grapes and bulk wine available to us ; significant competition ; any change in our relationships with retailers could harm our business ; we may not achieve or maintain profitability in the future ; the loss of key employees ; a reduction in our access to, or an increase in the cost of, the third - party services we use to produce our wine could harm our business ; credit facility restrictions on our current and future operations ; failure to protect, or infringement of, trademarks and proprietary rights ; these factors should not be construed as exhaustive and should be read in conjunction with the other cautionary statements that are included in this report or detailed in our periodic filings (including Forms 8 - K, 10 - K and 10 - Q) or other documents filed with the Securities and Exchange Commission . For more detailed information on us, please refer to our filings with the Securities and Exchange Commission, which are readily available at http : //www . sec . gov, or through the our Investor Relations website at http : //www . truetthurstinc . com . We are expected to file our annual report on Form 10 - K filed on September 29 , 2014 . For additional information, see our prior year annual report on Form 10 - K filed on September 27 , 2013 , or our other reports currently on file with the Securities and Exchange Commission, which contain a more detailed discussion of risks and uncertainties that may affect future results . We do not undertake to update any forward - looking statements unless otherwise required by law .

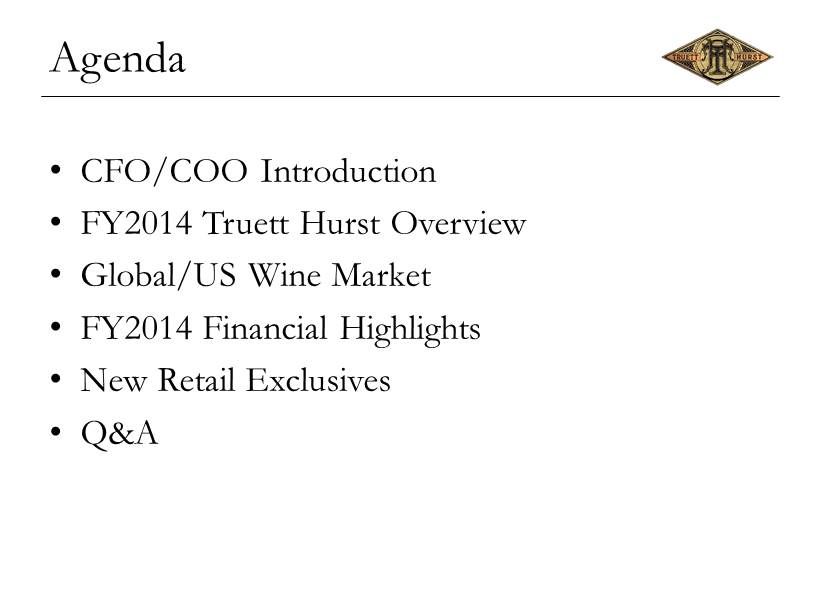
Agenda • CFO/COO Introduction • FY2014 Truett Hurst Overview • Global/US Wine Market • FY2014 Financial Highlights • New Retail Exclusives • Q&A

CFO/COO Introduction • Paul Forgue , joins Truett Hurst from global advisory firm Alvarez & Marsal where he spent 10 years providing advisory and management services throughout the world. • Started career with PricewaterhouseCoopers in Houston, TX after completing his MBA at Rice University. • Has been a part of the Sonoma County community for almost 15 years 4

FY 2014 Overview: ― Revenue growth of 29% with net sales of $22 million (an increase of $4.9 million versus prior year) ― Overall gross margin percent increased to 34% from 33% and gross profit dollars grew 31% to $7.4 million (an increase of $1.8 million versus prior year) ― Operating costs of $8.6 million ― $1.4 million incremental investment in sales and marketing ― $1.0 million increase in general and administrative ― $0.5 million in one time costs related to supplier insolvency 5

Global Consumption 6

7 1991 - 2011 CAGR = 4.1% (consumption $)

Innovation is driving growth 8 Source: Gomberg Fredrickson January 30, 2012

THST Market Dynamics ― Customer Base: ― We now sell to 3 of the top 5 food retailers ― Exclusive Brand/Private Label Focus: ― Private label = 23% of sales in top 30 retailers ($150 billion in 2009 and projected to hit $209 billion in 14’)* ― Private label wine = 3 - 5% of total US wine sales ― Top retailers targeting 10 - 20% wine ― Gross Profit Margin: ― We expect GM% to continue to increase by leveraging our increasing purchasing power with suppliers, capitalize on the current supply dynamics of California wine grapes, implement targeted price increases ― Operating Costs: ― We expect to see operating costs as a total % of sales decreasing as we leverage our fixed costs (including public company costs), develop efficiencies via our ERP system, reduce growth in headcount 9 *Source – Private Label Buyer Magazine

Growth Plans for 2015 • New Customer Acquisition – Target top 15 US wine retailers – Reduce concentration risk – Build much broader base of business • Product Line Extensions – Existing customers expanding offerings • Innovation – Square – going broad market while maintaining initial distribution – Wraps – expanding to broad market – Paper – experienced some difficulty, strong broad market interest – Cans – helped us close a big new customer • Combination of US market dynamics+ company strategy = continued growth 10

11 Truett Hurst Performance (Prior to June 26, 2013, H.D.D. LLC and Subsidiary) Net Revenue: Gross Profit: 69.8% 70.4% ― Outperformance vs. Industry ― Gaining market share CAGR: 5,402 12,689 17,162 22,057 1,501 3,075 5,666 7,429 - 5,000 10,000 15,000 20,000 25,000 FY 11 FY 12 FY 13 FY 14 Net Sales Gross Profit

FY 2014 FINANCIAL HIGHLIGHTS

FY14 Financial Highlights 13 2014 2013 YOY D Q1 Q2 Q3 Q4 FY FY B / (W) % Net sales 5,386 5,996 5,160 5,515 22,057 17,162 4,895 28.5% Gross profit 1,789 2,121 1,752 1,767 7,429 5,666 1,763 31.1% Gross margin % 33.2% 35.4% 34.0% 32.0% 33.7% 33.0% 0.7% Sales and marketing 1,051 1,280 1,252 1,429 5,012 3,592 (1,420) General and administrative 839 707 738 885 3,169 2,115 (1,054) Other (including provision for loss on deposit) - (1) 400 88 487 332 (155) Total operating expenses (1) 1,890 1,986 2,390 2,402 8,668 6,039 (2,629) 43.5% Net income (loss) before non-controlling interests (139) 111 (625) (631) (1,284) (621) (663) (1) Non-cash stock compenstion expense: Sales and marketing 106 78 40 117 341 156 (185) General and administrative 8 9 11 67 95 18 (77) 114 87 51 184 436 174 (262) Quarter over Quarter Changes: FY 2013 Net Sales 5,151 3,411 3,574 5,026 17,162 14 vs. 13 % increase 4.6% 75.8% 44.4% 9.7% 28.5%

14 FY14 Financial Highlights 2014 2013 YOY D Q1 Q2 Q3 Q4 FY FY B / (W) % Net Sales Wholesale 4,022 4,357 3,511 3,918 15,808 12,427 3,381 27.2% Direct to Consumer 928 1,091 993 1,026 4,038 3,193 845 26.5% Internet 436 548 656 571 2,211 1,542 669 43.4% 5,386 5,996 5,160 5,515 22,057 17,162 4,895 28.5% Gross Profit Wholesale 1,055 1,279 895 911 4,140 3,147 993 31.6% Direct to Consumer 557 658 608 650 2,473 1,837 636 34.6% Internet 177 184 249 206 816 682 134 19.6% 1,789 2,121 1,752 1,767 7,429 5,666 1,763 31.1% Gross Margin Wholesale 26.2% 29.4% 25.5% 23.3% 26.2% 25.3% 0.9% Direct to Consumer 60.0% 60.3% 61.2% 63.4% 61.2% 57.5% 3.7% Internet 40.6% 33.6% 38.0% 36.1% 36.9% 44.2% -7.3% 33.2% 35.4% 34.0% 32.0% 33.7% 33.0% 0.7%

15 FY14 Financial Highlights Y-O-Y 2013 2014 D in Q4 Q1 Q2 Q3 Q4 WC Total assets 34,132 34,453 34,879 35,560 34,328 Total liabilities 14,908 15,254 15,482 16,457 15,910 Total equity 19,224 19,199 19,397 19,103 18,418 34,132 34,453 34,879 35,560 34,328 Cash and cash equivalents 11,367 8,361 7,499 5,117 5,567 Property & equipment, net 5,383 5,544 5,664 5,575 5,553 Major Working Capital Accounts A/R 2,816 1,861 2,557 2,523 3,300 (484) Inventories 13,222 17,117 17,350 17,184 17,179 (3,957) Bulk Wine Deposit - - - 1,125 1,424 (1,424) AP & Accrueds (1) 3,833 4,445 3,461 2,953 3,194 (639) (6,504) (1) FY '13 AP & Accrued included approximately $999 in IPO related fees Interest Bearing Debt Line of Credit 6,887 6,018 7,270 6,582 8,685 Other Interest Bearing Debt 3,841 3,762 3,683 4,028 3,927 10,728 9,780 10,953 10,610 12,612

16 ― We fell short of the lower end of net sales guidance as net sales were significantly impacted by paper bottle supply disruptions ― Gross margin was at the high end of the range allowing us to deliver gross profit dollars of $7.4 million (in line with the lower end of the guidance range). ― Total operating expense was within the range of guidance at $8.6 million ― Operating profit was in line with the lower end of the calculated range based on guidance. FY14 Financial Highlights FY 14 - Guidance Reported Lower - Sales Higher - Sales 2014 YOY D Margin 31% 34% 31% 34% Net sales 22,057 28.5% 24,000 24,000 28,000 28,000 Cost of Sales (14,628) Gross profit 7,429 31.1% 7,440 8,160 8,680 9,520 Gross Margin 33.7% 0.7% 31.0% 34.0% 31.0% 34.0% Total operating expense 8,649 8,700 8,000 8,700 8,000 Operating Profit (1,220) (1,260) 160 (20) 1,520

NEW RETAIL EXCLUSIVES

Total Wine & More • Beginning Fall 2014 and Spring 2015, Total Wine & More will be adding several new Truett - Hurst products – Mad Duck Sauvignon Blanc – Inconspicuous Old Vine Lodi Zinfandel – Eden's Eve by Eden Ridge – The One Armed Man . 18 INCONSPICUOUS

The Kroger Company • Second largest grocery retailer in the US operating over 2,600 stores under nearly 2 dozen banners • Truett Hurst’s exclusive partner in the launch of California Winecraft – delicious single serving ready - to - drink wine based beverages in Craft Cans patterned on classic and worldwide favorite mixed wine combinations • Several traditional exclusive wine brands in addition 19

Q & A

21 APPENDIX 1. Contact Information 2. Conference Call Playback Information 3. Fiscal 2014 Pro forma Basic and Diluted EPS & Market Cap

Appendix I - Contact Information 22 Phillip L. Hurst Chief Executive Officer, President Email: Phil@truetthurst.com T: 707.433.4408 M: 707.318.7480 Paul A. Forgue Chief Financial Officer & Chief Operations Officer Email: paul@truetthurst.com T: 707.431.4423 M: 707.494.3452 www.truetthurstinc.com ir@truetthurstinc.com

Appendix II – Call Playback Information Transcript, when available, at: www.truetthurstinc.com Webcast/PowerPoint / Replay available at: www.truetthurstinc.com/investors Transcript available until October 10, 2014. 23

Appendix III Adjusted Pro Forma EPS & Market Cap June 30, 2014 Net loss attributable to Truett-Hurst, Inc. and H.D.D. LLC (1,166)$ Adjusted Pro Forma Basic & Diluted Loss Per Share Weighted average Class A common stock 3,621,455 LLC units assuming 100% LLC membership conversion 3,164,172 Total weighted average basic pro forma shares outstanding 6,785,627 Adjusted Pro Forma Basic Loss Per Share Calculation (0.17)$ Adjusted Market Capital based on June 30, 2014 Class A common stock closing price of $5.00 33,928,135$ TRUETT-HURST INC. AND SUBSIDIARIES Adjusted Pro Forma Basic Loss Per Share & Market Cap As of June 30, 2014 (assumes 100% conversion of LLC units to THI stock) 24
